Atención de la bronquiectasia dirigida por personal de enfermería versus dirigido por médicos
Información
- DOI:
- https://doi.org/10.1002/14651858.CD004359.pub2Copiar DOI

- Base de datos:
-
- Cochrane Database of Systematic Reviews
- Versión publicada:
-
- 20 junio 2018see what's new
- Tipo:
-
- Intervention
- Etapa:
-
- Review
- Grupo Editorial Cochrane:
-
Grupo Cochrane de Vías respiratorias
- Copyright:
-
- Copyright © 2018 The Cochrane Collaboration. Published by John Wiley & Sons, Ltd.
Cifras del artículo
Altmetric:
Citado por:
Autores
Contributions of authors
KL and KR wrote the protocol with additional input from KVC. KL and KR assessed search results. KL and KVC‐C entered data and developed the discussion. FC and BJS contributed comments to the final draft of the manuscript before submission to editorial.
Sources of support
Internal sources
-
The review authors declare that no such funding was received for this systematic review, Other.
External sources
-
The review authors declare that no such funding was received for this systematic review, Other.
Declarations of interest
None known.
Acknowledgements
Mike Greenstone, Emma Dennett, and Rebecca Normansell were the editors for this review and commented critically on the review. Christopher Cates checked and provided guidance for statistical analysis.
We would like to thank all staff at the Cochrane Airways Group for their ongoing help and support. We also wish to thank the peer reviewers for their time and valuable feedback.
We wish to thank the original authors of this review ‐ J. French (French 2003), D. Bilton, and F. Campbell.
The Background and Methods sections of this review are based on a standard template used by Cochrane Airways.
This project was supported by the National Institute for Health Research (NIHR), via Cochrane Infrastructure funding to the Cochrane Airways Group. The views and opinions expressed therein are those of the review authors and do not necessarily reflect those of the Systematic Reviews Programme, NIHR, NHS, or the Department of Health.
Version history
| Published | Title | Stage | Authors | Version |
| 2018 Jun 20 | Nurse‐led versus doctor‐led care for bronchiectasis | Review | Kathryn Lawton, Karen Royals, Kristin V Carson‐Chahhoud, Fiona Campbell, Brian J Smith | |
| 2003 Jan 20 | Nurse specialist care for bronchiectasis | Review | Jane French, Diana Bilton, Fiona Campbell | |
Differences between protocol and review
This review includes a new review author team.
Outcome measures include the following.
-
The new review author team reordered primary and secondary outcomes and included data on patient satisfaction and cost‐effectiveness not previously reported.
-
Hospital admission was changed to a primary outcome, in addition to exacerbations.
-
Lung function was changed to a secondary outcome, as it is unlikely to show significant differences in stable bronchiectasis.
New methods include the following.
-
Since the last review, changes to search methods and standard airways protocol have occurred; these have been included in this update.
-
Assessment of risk of bias has been updated. Results have been presented in the 'Summary of findings' table.
In the previous review, the first review author and Diana Bilton were involved in the only trial analysed in the review.
Keywords
MeSH
Medical Subject Headings (MeSH) Keywords
Medical Subject Headings Check Words
Adult; Child; Humans;
PICO
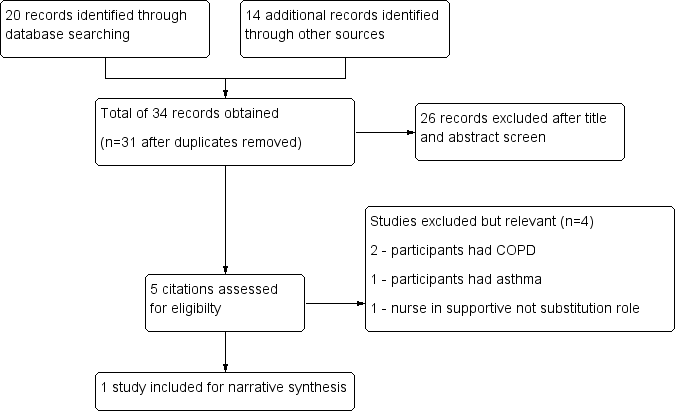
Study flow diagram.
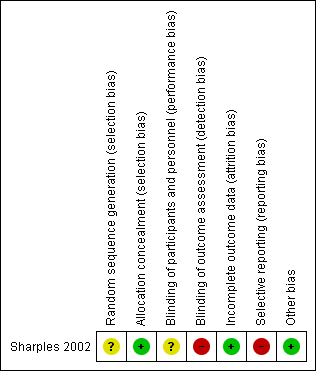
Risk of bias summary: review authors' judgements about each risk of bias item for each included study.
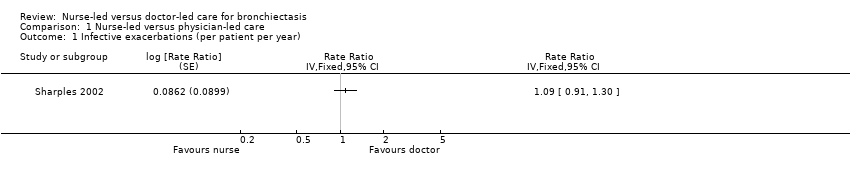
Comparison 1 Nurse‐led versus physician‐led care, Outcome 1 Infective exacerbations (per patient per year).

Comparison 1 Nurse‐led versus physician‐led care, Outcome 2 Admissions per patient per year.

Comparison 1 Nurse‐led versus physician‐led care, Outcome 3 SGRQ ‐ symptoms.
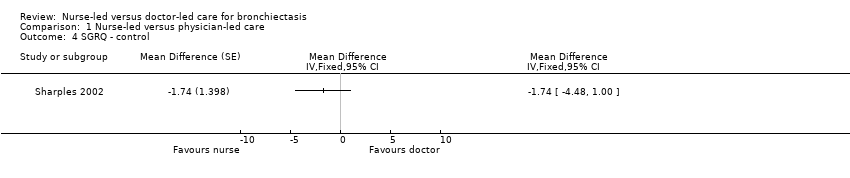
Comparison 1 Nurse‐led versus physician‐led care, Outcome 4 SGRQ ‐ control.

Comparison 1 Nurse‐led versus physician‐led care, Outcome 5 SGRQ ‐ impact.
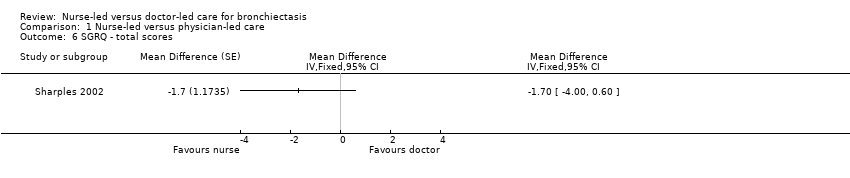
Comparison 1 Nurse‐led versus physician‐led care, Outcome 6 SGRQ ‐ total scores.
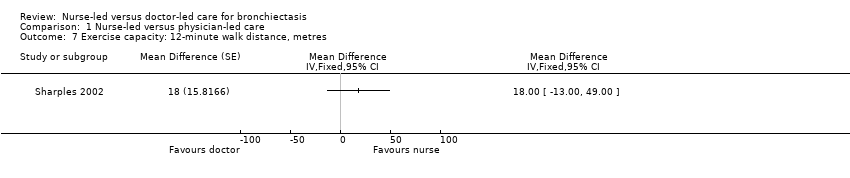
Comparison 1 Nurse‐led versus physician‐led care, Outcome 7 Exercise capacity: 12‐minute walk distance, metres.
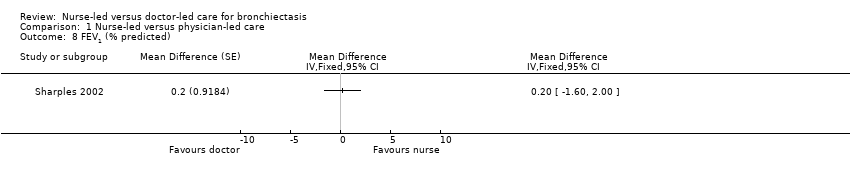
Comparison 1 Nurse‐led versus physician‐led care, Outcome 8 FEV1 (% predicted).
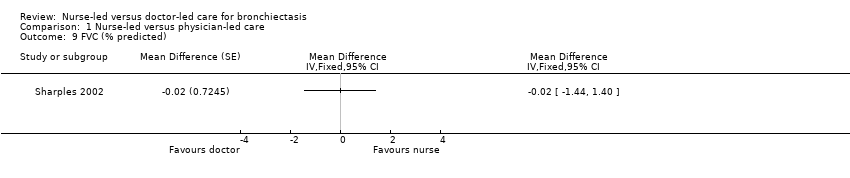
Comparison 1 Nurse‐led versus physician‐led care, Outcome 9 FVC (% predicted).
| Nurse‐led care compared with doctor‐led care for management of bronchiectasis | ||||||
| Patient or population: management of bronchiectasis | ||||||
| Outcomes | Anticipated absolute effects* (95% CI) | Relative effect | No. of participants | Certainty of the evidence | Comments | |
| Risk with doctor‐led care | Risk with nurse‐led care | |||||
| Exacerbations Assessed by clinician identified or participant self‐reported Follow‐up: 12 months | Mean rate of infective exacerbations was 3.1 per patient per year. | 0.28 per patient per year higher | 1.09 (95% CI 0.91 to 1.30) | 80 | ⊕⊕⊝⊝ | |
| Hospital admissions (per patient per year). | Mean admission per patient per year was 1.02. | 1.55 per patient per year higher | 1.52 (95% CI 1.03 to 2.23) | 80 | ⊕⊕⊝⊝ | More admissions in nurse‐led care. All nurse‐led care admissions approved by consultant. Protocol followed by nurse regarding management |
| Emergency department attendance | See comment. | See comment. | See comment. | See comment. | See comment. | Not reported |
| Mortality | Two participants died ‐ 1 from each care group ‐ after 12‐month assessment. | See comment. | ⊕⊕⊝⊝ | |||
| Cost‐effectiveness Total cost for duration of study and difference in cost for first and second years Cost scale: £ per participant | Total costs £5428 Cost difference £274 higher in second year | Total costs £8464 Cost difference £1940 lower in second year | ⊕⊕⊝⊝ | Costs may be reduced over time through a learning effect. | ||
| Quality of life, measured with SGRQ ‐ total scores | Unreported | MD 1.7 higher | 79 | ⊕⊕⊝⊝ | Participants reported fewer symptoms and less impact on daily life with nurse‐led care, but data show no clinical or statistically significant differences between nurse‐led and doctor‐led care. | |
| Exercise capacity: 12MWT | Mean exercise capacity: 12MWT was 746 m. | MD 18 m greater | 80 | ⊕⊕⊝⊝ | No significant differences in distance walked between nurse‐led and doctor‐led care | |
| FEV1 | Mean FEV1 was 69.5% predicted. | MD 0.2% predicted higher | 80 | ⊕⊕⊝⊝ | Nil significant differences in percentage predicted FEV1 between nurse‐led and doctor‐led care | |
| *The risk in the intervention group (and its 95% confidence interval) is based on the assumed risk in the comparison group and the relative effect of the intervention (and its 95% CI). | ||||||
| GRADE Working Group grades of evidence. | ||||||
| aCannot rule out carryover effects from cross‐over trial. No reported information at first 12‐month time period before cross‐over. May have had a learned effect that resulted in fewer exacerbations and hospitalisations and better quality of life. This may have led to better lung function and exercise capacity. Marked down one point for risk of bias. bAge of study, small number of participants, and uncertainty, with some results based on wide confidence intervals. Marked down one point for imprecision. cCannot rule out selective reporting with the decision not to cross‐over 6 participants after first 12 months. No longer considered stable bronchiectasis. Already marked down for risk of bias previously, so not downgraded again based on this reason. | ||||||
| Resource | Nurse‐led care (mean visits per participant) | Nurse‐led care (mean cost per participant, £) | Doctor‐led care (mean visits per participant) | Doctor‐led care (mean cost per participant, £) | Difference (SD, £) |
| Nurse‐led clinics | 4.61 | 180 | 0 | 0 | 180 (158) |
| Doctor‐led clinics | 0.45 | 25 | 4.48 | 217 | ‐192 (199) |
| Procedures | 0.13 | 61 | 0.11 | 54 | 7 (376) |
| Imaging | 1.14 | 47 | 0.76 | 45 | 1 (112) |
| Other tests | 24.58 | 260 | 18.94 | 222 | 37 (257) |
| Antibiotics (intravenous) | 23 (days) | 879 | 16 (days) | 523 | 356 (1452) |
| Antibiotics (oral) | 222 (days) | 684 | 201 (days) | 524 | 161 (695) |
| Bronchodilators | 461 (days) | 213 | 435 (days) | 193 | 20 (179) |
| Corticosteroids | 238 (days) | 278 | 219 (days) | 258 | 20 (181) |
| Other drugs | 212 (days) | 180 | 190 (days) | 155 | 25 (194) |
| Inpatient | 6.46 (days) | 1338 | 2.36 (days) | 477 | 861 (2755) |
| Day case | 0.11 | 43 | 0.05 | 16 | 27 (170) |
| GP visits | 1.11 | 20 | 1.40 | 26 | ‐6 (33) |
| Total | 4208 | 2711 | 1498 (688 to 2674) | ||
| SD: standard deviation. | |||||
| Comments | Nurse practitioner better, number, (%) | Doctor better, number (%) | P value |
| It was sometimes difficult to discuss your problems with the doctor/nurse practitioner. | 11/76 (14.5) | 1/76 (1.3) | 0.006 |
| The doctor/nurse practitioner explained clearly what is wrong. | 7/74 (9.5) | 0/74 (0) | 0.016 |
| The doctor/nurse practitioner examined you thoroughly when necessary. | 6/70 (8.6) | 0/70 (0) | 0.031 |
| The doctor/nurse practitioner should tell you more about your illness/condition and treatment. | 7/59 (11.9) | 3/59 (5.1) | 0.344 |
| The doctor/nurse practitioner made you feel at ease. | 2/75 (2.7) | 1/75 (1.3) | 1.000 |
| There was not enough time to discuss your problems with the doctor/nurse. | 10/74 (13.5) | 1/74 (1.4) | 0.012 |
| You felt confident the doctor/nurse practitioner knew about your medical history and your care. | 7/74 (9.5) | 1/74 (1.4) | 0.070 |
| Sometimes you felt that the doctor/nurse practitioner should listen more to what you said. | 5/69 (7.2) | 2/69 (2.9) | 0.453 |
| The doctor/nurse practitioner gave clear explanation about any tests that you needed. | 4/75 (5.3) | 1/75 (1.3) | 0.375 |
| You often came away from your appointment wishing you'd asked more questions. | 13/72 (18.1) | 9/72 (12.5) | 0.523 |
| You felt you were given a chance to have an active part when discussing your illness/condition. | 4/73 (5.5) | 0/73 (0.0) | 0.125 |
| There were frequent interruptions during your consultation. | 6/73 (8.2) | 3/73 (4.1) | 0.508 |
| Outcome or subgroup title | No. of studies | No. of participants | Statistical method | Effect size |
| 1 Infective exacerbations (per patient per year) Show forest plot | 1 | Rate Ratio (Fixed, 95% CI) | Totals not selected | |
| 2 Admissions per patient per year Show forest plot | 1 | Rate Ratio (Fixed, 95% CI) | Totals not selected | |
| 3 SGRQ ‐ symptoms Show forest plot | 1 | Mean Difference (Fixed, 95% CI) | Totals not selected | |
| 4 SGRQ ‐ control Show forest plot | 1 | Mean Difference (Fixed, 95% CI) | Totals not selected | |
| 5 SGRQ ‐ impact Show forest plot | 1 | Mean Difference (Fixed, 95% CI) | Totals not selected | |
| 6 SGRQ ‐ total scores Show forest plot | 1 | Mean Difference (Fixed, 95% CI) | Totals not selected | |
| 7 Exercise capacity: 12‐minute walk distance, metres Show forest plot | 1 | Mean Difference (Fixed, 95% CI) | Totals not selected | |
| 8 FEV1 (% predicted) Show forest plot | 1 | Mean Difference (Fixed, 95% CI) | Totals not selected | |
| 9 FVC (% predicted) Show forest plot | 1 | Mean Difference (Fixed, 95% CI) | Totals not selected | |