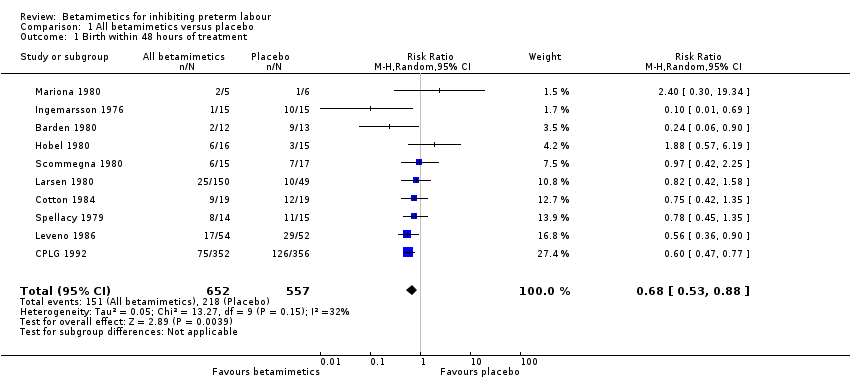
| 1 Birth within 48 hours of treatment Show forest plot | 10 | 1209 | Risk Ratio (M‐H, Random, 95% CI) | 0.68 [0.53, 0.88] |
|
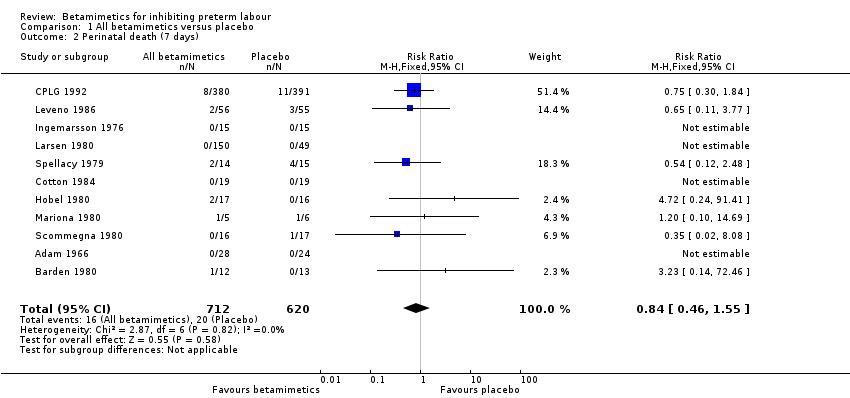
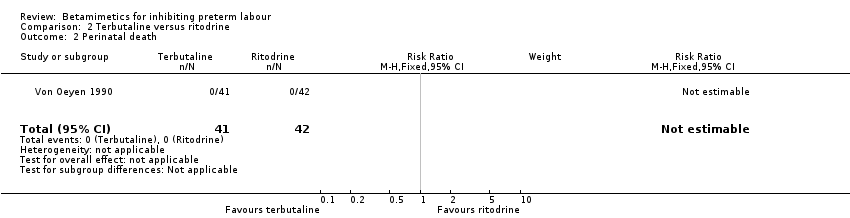
| 2 Perinatal death (7 days) Show forest plot | 11 | 1332 | Risk Ratio (M‐H, Fixed, 95% CI) | 0.84 [0.46, 1.55] |
|
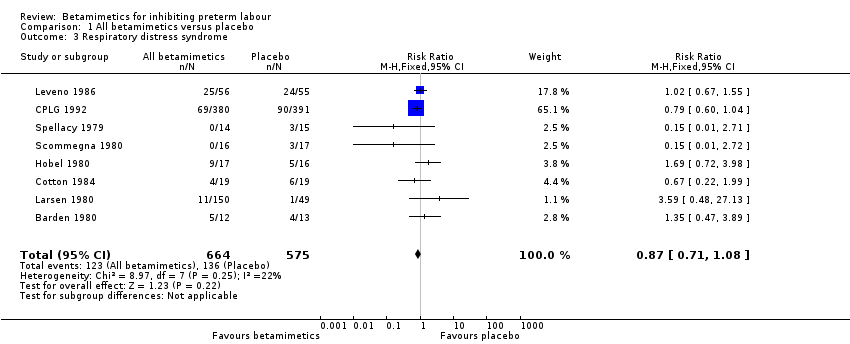
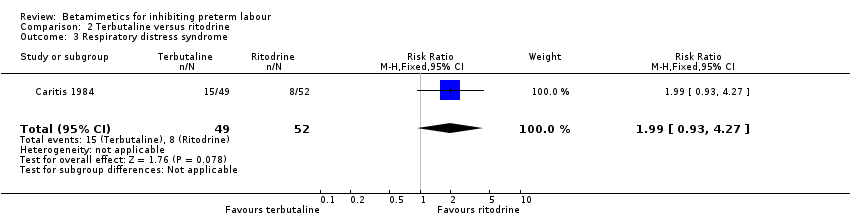
| 3 Respiratory distress syndrome Show forest plot | 8 | 1239 | Risk Ratio (M‐H, Fixed, 95% CI) | 0.87 [0.71, 1.08] |
|
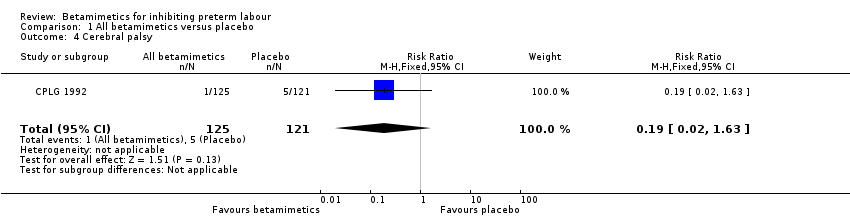
| 4 Cerebral palsy Show forest plot | 1 | 246 | Risk Ratio (M‐H, Fixed, 95% CI) | 0.19 [0.02, 1.63] |
|
| 5 Birth within 7 days Show forest plot | 5 | 911 | Risk Ratio (M‐H, Random, 95% CI) | 0.80 [0.65, 0.98] |
|
| 6 Birth less than 37 weeks' gestation Show forest plot | 10 | 1212 | Risk Ratio (M‐H, Fixed, 95% CI) | 0.95 [0.88, 1.03] |
|
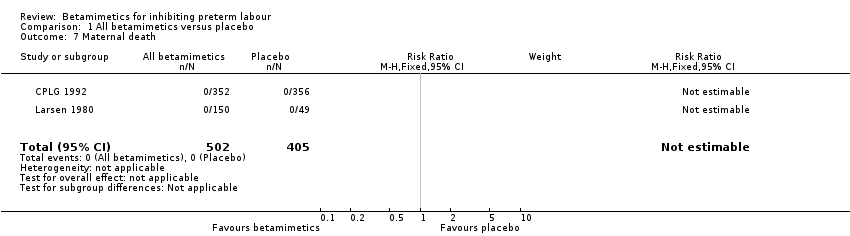
| 7 Maternal death Show forest plot | 2 | 907 | Risk Ratio (M‐H, Fixed, 95% CI) | 0.0 [0.0, 0.0] |
|
| 8 Pulmonary oedema Show forest plot | 3 | 852 | Risk Ratio (M‐H, Fixed, 95% CI) | 3.03 [0.12, 74.23] |
|
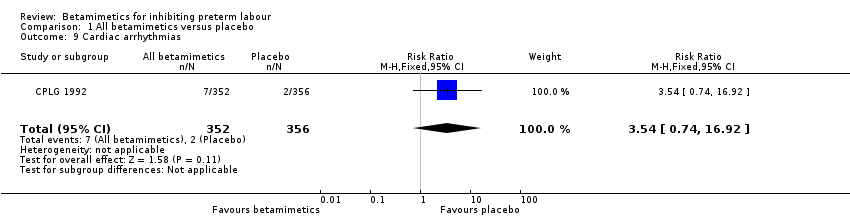
| 9 Cardiac arrhythmias Show forest plot | 1 | 708 | Risk Ratio (M‐H, Fixed, 95% CI) | 3.54 [0.74, 16.92] |
|
| 10 Myocardial ischemia Show forest plot | 1 | 106 | Risk Ratio (M‐H, Fixed, 95% CI) | 12.53 [0.72, 216.91] |
|
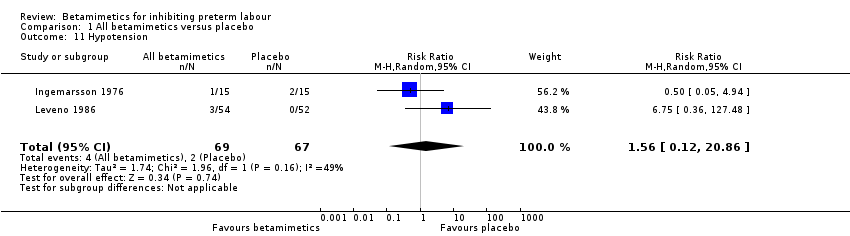
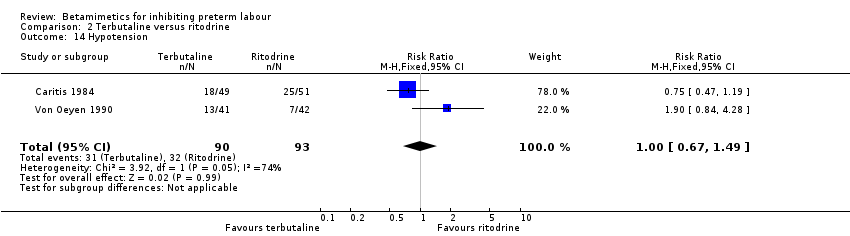
| 11 Hypotension Show forest plot | 2 | 136 | Risk Ratio (M‐H, Random, 95% CI) | 1.56 [0.12, 20.86] |
|
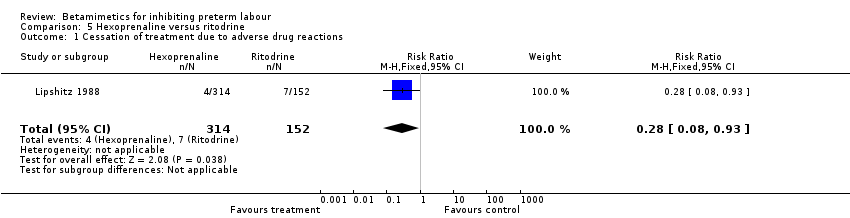
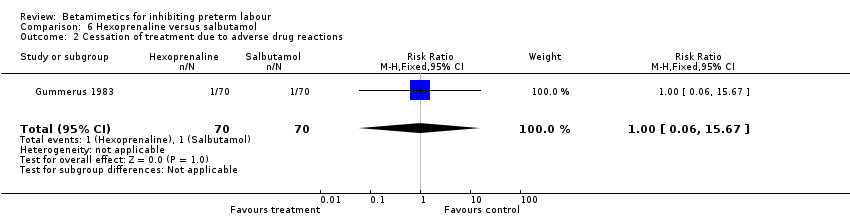
| 12 Cessation of treatment due to adverse drug reaction Show forest plot | 5 | 1081 | Risk Ratio (M‐H, Fixed, 95% CI) | 11.38 [5.21, 24.86] |
|
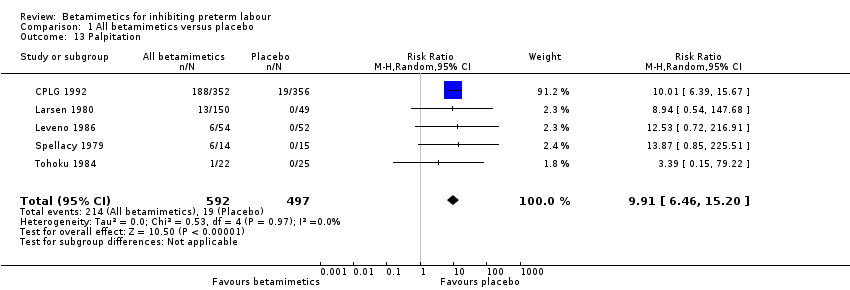
| 13 Palpitation Show forest plot | 5 | 1089 | Risk Ratio (M‐H, Random, 95% CI) | 9.91 [6.46, 15.20] |
|
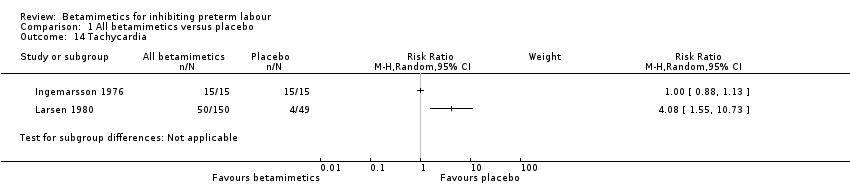
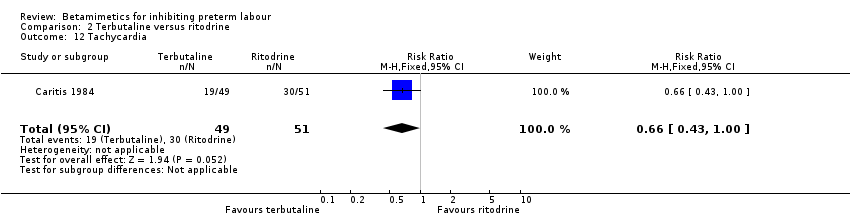
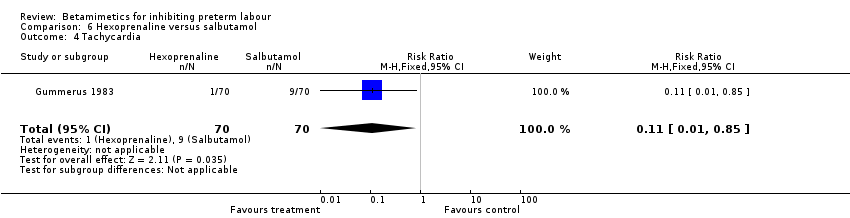
| 14 Tachycardia Show forest plot | 2 | | Risk Ratio (M‐H, Random, 95% CI) | Subtotals only |
|
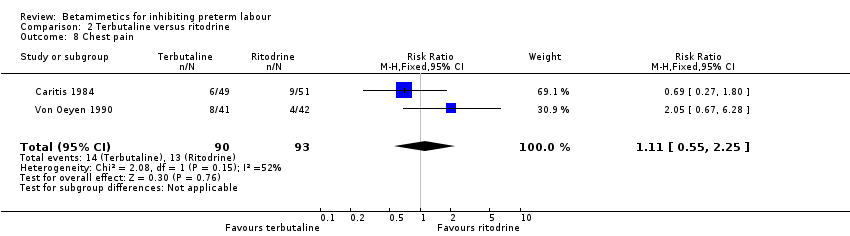
| 15 Chest pain Show forest plot | 2 | 814 | Risk Ratio (M‐H, Fixed, 95% CI) | 11.29 [3.81, 33.46] |
|
| 16 Dyspnoea Show forest plot | 2 | 814 | Risk Ratio (M‐H, Fixed, 95% CI) | 3.86 [2.21, 6.77] |
|
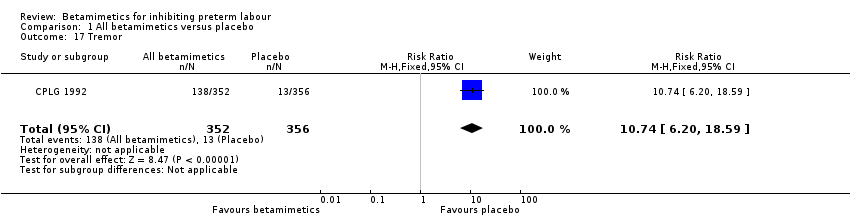
| 17 Tremor Show forest plot | 1 | 708 | Risk Ratio (M‐H, Fixed, 95% CI) | 10.74 [6.20, 18.59] |
|
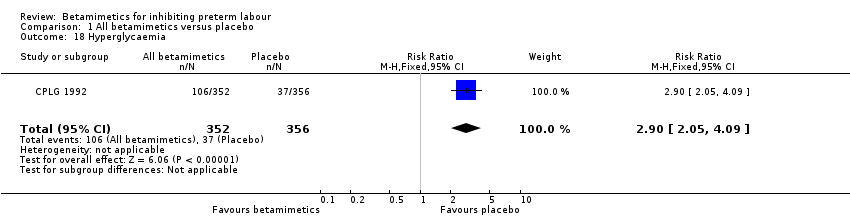
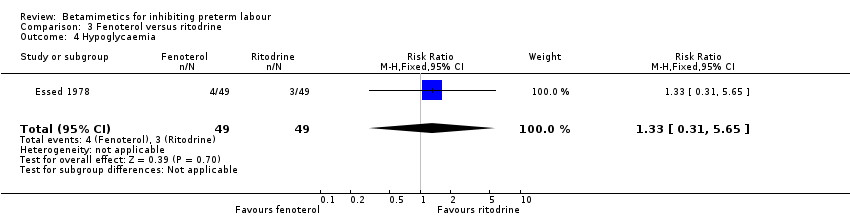
| 18 Hyperglycaemia Show forest plot | 1 | 708 | Risk Ratio (M‐H, Fixed, 95% CI) | 2.90 [2.05, 4.09] |
|
| 19 Hypokalaemia Show forest plot | 1 | 708 | Risk Ratio (M‐H, Fixed, 95% CI) | 6.07 [4.00, 9.20] |
|
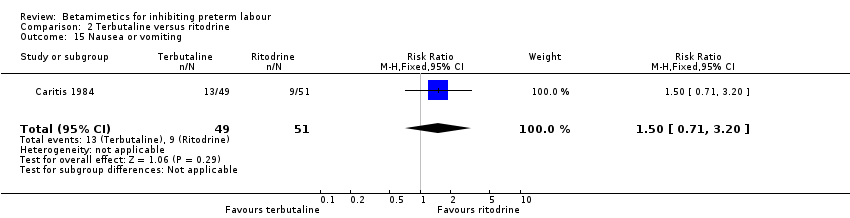
| 20 Nausea or vomiting Show forest plot | 3 | 932 | Risk Ratio (M‐H, Fixed, 95% CI) | 1.76 [1.29, 2.42] |
|
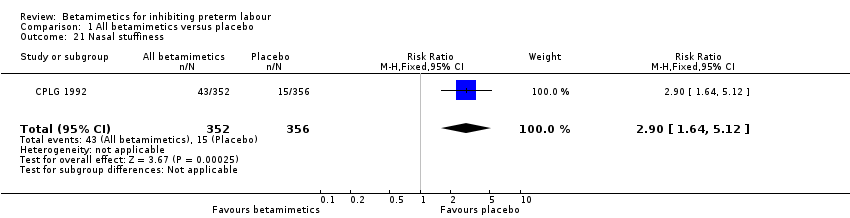
| 21 Nasal stuffiness Show forest plot | 1 | 708 | Risk Ratio (M‐H, Fixed, 95% CI) | 2.90 [1.64, 5.12] |
|
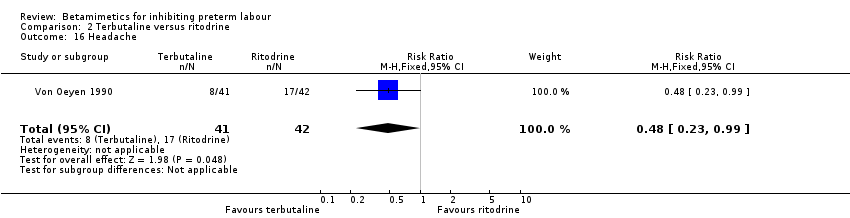
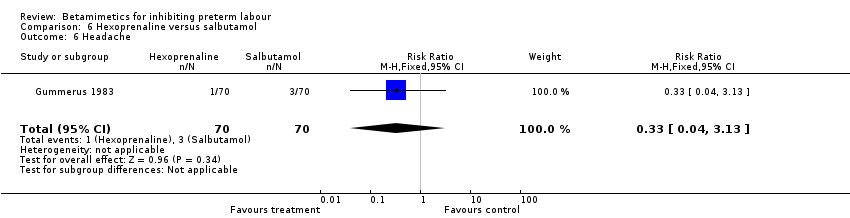
| 22 Headaches Show forest plot | 3 | 936 | Risk Ratio (M‐H, Fixed, 95% CI) | 4.07 [2.60, 6.35] |
|
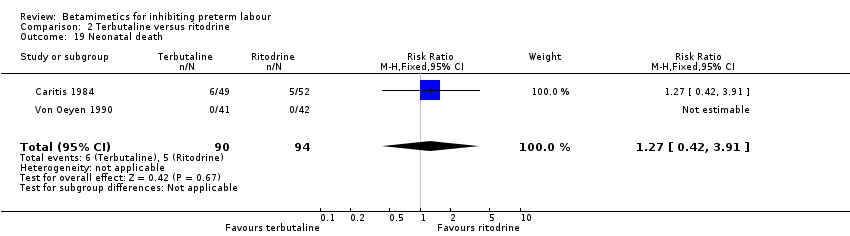
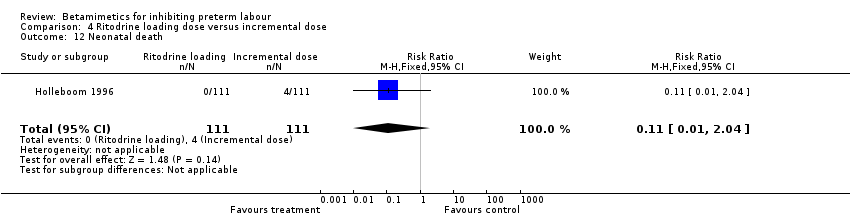
| 23 Neonatal death Show forest plot | 6 | 1174 | Risk Ratio (M‐H, Random, 95% CI) | 0.90 [0.27, 3.00] |
|
| 24 Infant death Show forest plot | 1 | 750 | Risk Ratio (M‐H, Fixed, 95% CI) | 0.51 [0.05, 5.64] |
|
| 25 Necrotising enterocolitis Show forest plot | 2 | 149 | Risk Ratio (M‐H, Fixed, 95% CI) | 0.42 [0.06, 2.78] |
|
| 26 Sepsis or infection Show forest plot | 2 | | Risk Ratio (M‐H, Random, 95% CI) | Subtotals only |
|
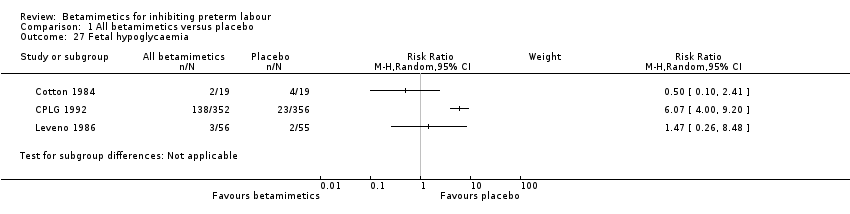
| 27 Fetal hypoglycaemia Show forest plot | 3 | | Risk Ratio (M‐H, Random, 95% CI) | Subtotals only |
|
| 28 Fetal tachycardia Show forest plot | 1 | 30 | Risk Ratio (M‐H, Fixed, 95% CI) | 2.4 [1.12, 5.13] |
|
| 29 Infant long‐term neurological development (Bayley score: Psychomotor development) Show forest plot | 1 | 246 | Mean Difference (IV, Fixed, 95% CI) | 1.30 [‐2.74, 5.34] |
|
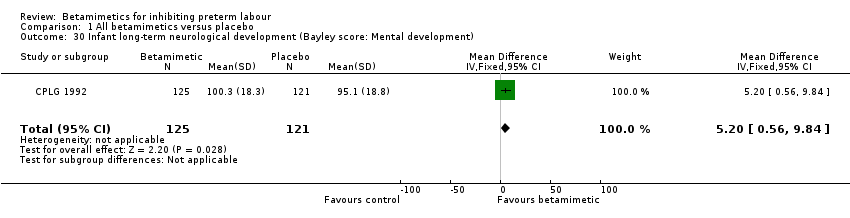
| 30 Infant long‐term neurological development (Bayley score: Mental development) Show forest plot | 1 | 246 | Mean Difference (IV, Fixed, 95% CI) | 5.20 [0.56, 9.84] |
|