| 1 Active knee flexion ROM ‐ short‐term effects Show forest plot | 10 | 470 | Mean Difference (IV, Random, 95% CI) | 2.40 [‐0.22, 5.03] |
|
| 2 Active knee flexion ROM ‐ medium‐term effects Show forest plot | 4 | | Mean Difference (IV, Random, 95% CI) | Totals not selected |
|
| 3 Active knee flexion ROM ‐ long‐term effects Show forest plot | 3 | 132 | Mean Difference (IV, Random, 95% CI) | 2.85 [‐1.16, 6.87] |
|
| 4 Pain ‐ short‐term effects Show forest plot | 8 | 414 | Mean Difference (IV, Random, 95% CI) | ‐0.38 [‐0.84, 0.08] |
|
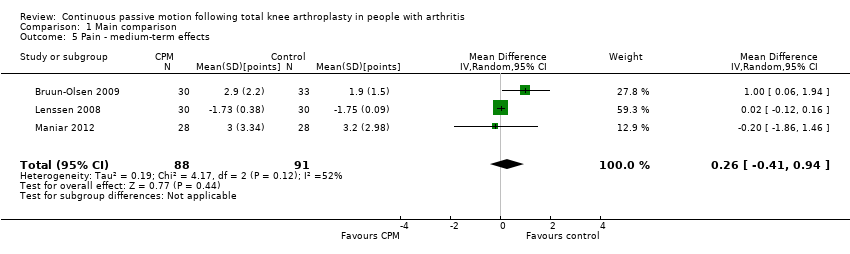
| 5 Pain ‐ medium‐term effects Show forest plot | 3 | 179 | Mean Difference (IV, Random, 95% CI) | 0.26 [‐0.41, 0.94] |
|
| 6 Pain ‐ long‐term effects Show forest plot | 1 | | Mean Difference (IV, Random, 95% CI) | Totals not selected |
|
| 7 Function ‐ short‐term effects [standardised mean] Show forest plot | 4 | | Std. Mean Difference (IV, Random, 95% CI) | Totals not selected |
|
| 8 Function ‐ medium‐term effects [standardised mean] Show forest plot | 6 | 405 | Std. Mean Difference (IV, Random, 95% CI) | ‐0.08 [‐0.27, 0.12] |
|
| 9 Function ‐ long‐term effects [standardised mean] Show forest plot | 4 | 288 | Std. Mean Difference (IV, Random, 95% CI) | 0.02 [‐0.22, 0.25] |
|
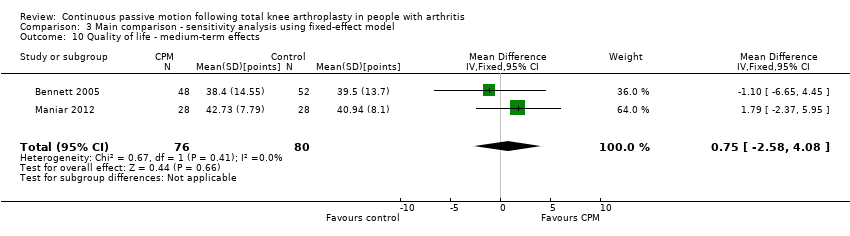
| 10 Quality of life ‐ medium‐term effects Show forest plot | 2 | 156 | Mean Difference (IV, Random, 95% CI) | 0.75 [‐2.58, 4.08] |
|
| 11 Quality of life ‐ long‐term effects Show forest plot | 1 | 100 | Mean Difference (IV, Fixed, 95% CI) | 2.20 [‐3.90, 8.30] |
|
| 12 Participants' global assessment of treatment effectiveness ‐ short‐term effects [points] Show forest plot | 3 | | Std. Mean Difference (IV, Random, 95% CI) | Totals not selected |
|
| 13 Participants' global assessment of treatment effectiveness ‐ medium‐term effects Show forest plot | 1 | 60 | Mean Difference (IV, Random, 95% CI) | ‐0.30 [‐0.74, 0.14] |
|
| 14 Manipulation under anaesthesia [number] Show forest plot | 8 | 581 | Risk Ratio (M‐H, Random, 95% CI) | 0.34 [0.13, 0.89] |
|
| 15 Adverse events [number] Show forest plot | 16 | 1040 | Risk Ratio (M‐H, Random, 95% CI) | 0.92 [0.63, 1.33] |
|
| 16 Passive knee flexion ROM ‐ short‐term effects Show forest plot | 11 | 697 | Mean Difference (IV, Random, 95% CI) | 2.03 [0.21, 3.86] |
|
| 17 Passive knee flexion ROM ‐ medium‐term effects Show forest plot | 4 | 264 | Mean Difference (IV, Random, 95% CI) | ‐1.85 [‐5.25, 1.55] |
|
| 18 Passive knee flexion ROM ‐ long‐term effects Show forest plot | 2 | 160 | Mean Difference (IV, Random, 95% CI) | 0.06 [‐2.22, 2.35] |
|
| 19 Active knee extension ROM ‐ short‐term effects Show forest plot | 11 | 574 | Mean Difference (IV, Random, 95% CI) | 0.85 [‐0.36, 2.06] |
|
| 20 Active knee extension ROM ‐ medium‐term effects Show forest plot | 4 | 195 | Mean Difference (IV, Random, 95% CI) | 0.77 [‐0.78, 2.31] |
|
| 21 Active knee extension ROM ‐ long‐term effects Show forest plot | 2 | 108 | Mean Difference (IV, Random, 95% CI) | 0.06 [‐0.06, 0.18] |
|
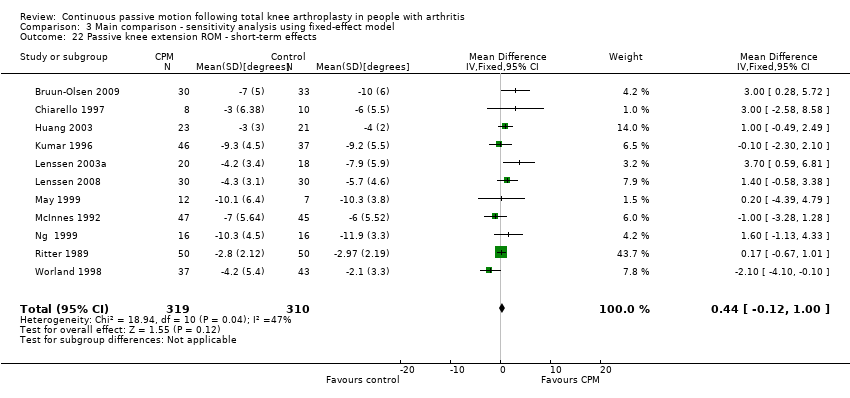
| 22 Passive knee extension ROM ‐ short‐term effects Show forest plot | 11 | 629 | Mean Difference (IV, Random, 95% CI) | 0.64 [‐0.26, 1.55] |
|
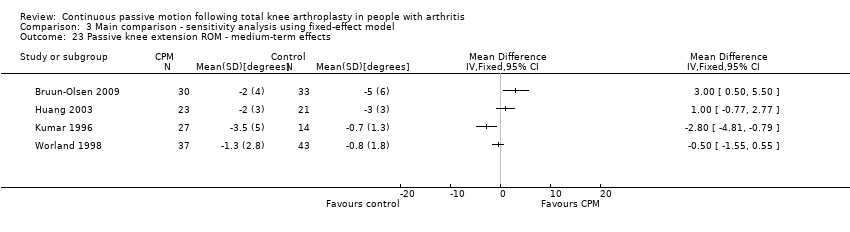
| 23 Passive knee extension ROM ‐ medium‐term effects Show forest plot | 4 | | Mean Difference (IV, Random, 95% CI) | Totals not selected |
|
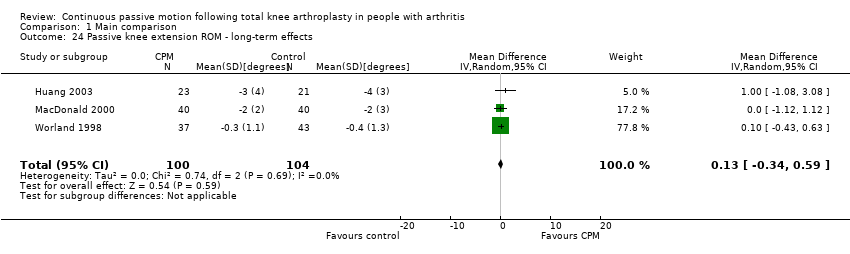
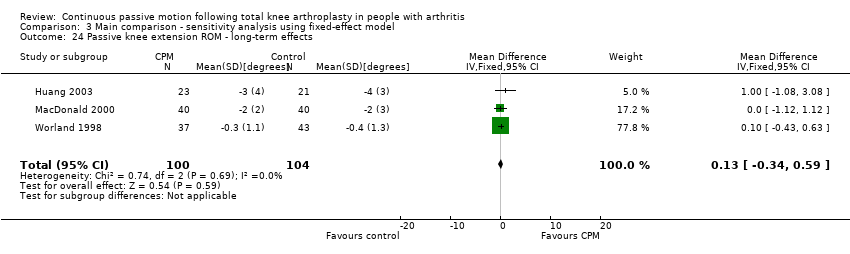
| 24 Passive knee extension ROM ‐ long‐term effects Show forest plot | 3 | 204 | Mean Difference (IV, Random, 95% CI) | 0.13 [‐0.34, 0.59] |
|
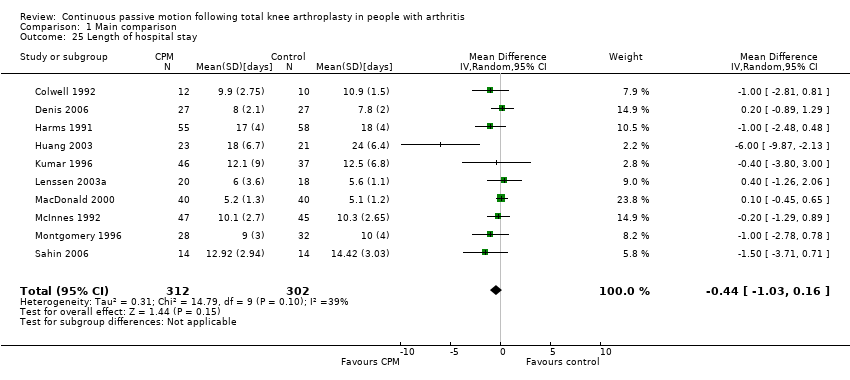
| 25 Length of hospital stay Show forest plot | 10 | 614 | Mean Difference (IV, Random, 95% CI) | ‐0.44 [‐1.03, 0.16] |
|
| 26 Swelling ‐ short‐term effects Show forest plot | 5 | | Mean Difference (IV, Random, 95% CI) | Totals not selected |
|
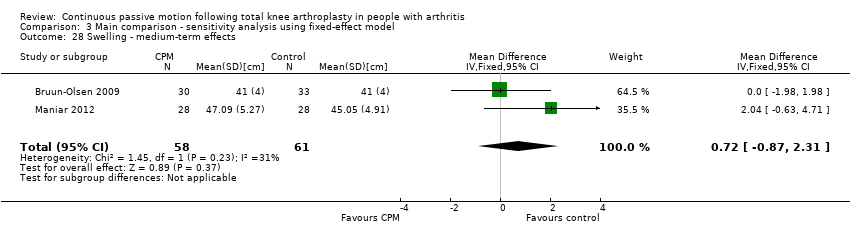
| 27 Swelling ‐ medium‐term effects Show forest plot | 2 | 119 | Mean Difference (IV, Random, 95% CI) | 0.82 [‐1.14, 2.77] |
|
| 28 Quadriceps strength ‐ short‐term effects [standardised mean] Show forest plot | 2 | 130 | Std. Mean Difference (IV, Random, 95% CI) | 0.27 [‐0.08, 0.61] |
|


![Comparison 1 Main comparison, Outcome 7 Function ‐ short‐term effects [standardised mean].](/es/cdsr/doi/10.1002/14651858.CD004260.pub3/media/CDSR/CD004260/image_n/nCD004260-CMP-001-07.png)
![Comparison 1 Main comparison, Outcome 8 Function ‐ medium‐term effects [standardised mean].](/es/cdsr/doi/10.1002/14651858.CD004260.pub3/media/CDSR/CD004260/image_n/nCD004260-CMP-001-08.png)
![Comparison 1 Main comparison, Outcome 9 Function ‐ long‐term effects [standardised mean].](/es/cdsr/doi/10.1002/14651858.CD004260.pub3/media/CDSR/CD004260/image_n/nCD004260-CMP-001-09.png)


![Comparison 1 Main comparison, Outcome 12 Participants' global assessment of treatment effectiveness ‐ short‐term effects [points].](/es/cdsr/doi/10.1002/14651858.CD004260.pub3/media/CDSR/CD004260/image_n/nCD004260-CMP-001-12.png)

![Comparison 1 Main comparison, Outcome 14 Manipulation under anaesthesia [number].](/es/cdsr/doi/10.1002/14651858.CD004260.pub3/media/CDSR/CD004260/image_n/nCD004260-CMP-001-14.png)
![Comparison 1 Main comparison, Outcome 15 Adverse events [number].](/es/cdsr/doi/10.1002/14651858.CD004260.pub3/media/CDSR/CD004260/image_n/nCD004260-CMP-001-15.png)


![Comparison 1 Main comparison, Outcome 28 Quadriceps strength ‐ short‐term effects [standardised mean].](/es/cdsr/doi/10.1002/14651858.CD004260.pub3/media/CDSR/CD004260/image_n/nCD004260-CMP-001-28.png)


![Comparison 3 Main comparison ‐ sensitivity analysis using fixed‐effect model, Outcome 7 Function ‐ short‐term effects [standardised mean].](/es/cdsr/doi/10.1002/14651858.CD004260.pub3/media/CDSR/CD004260/image_n/nCD004260-CMP-003-07.png)
![Comparison 3 Main comparison ‐ sensitivity analysis using fixed‐effect model, Outcome 8 Function ‐ medium‐term effects [standardised mean].](/es/cdsr/doi/10.1002/14651858.CD004260.pub3/media/CDSR/CD004260/image_n/nCD004260-CMP-003-08.png)
![Comparison 3 Main comparison ‐ sensitivity analysis using fixed‐effect model, Outcome 9 Function ‐ long‐term effects [standardised mean].](/es/cdsr/doi/10.1002/14651858.CD004260.pub3/media/CDSR/CD004260/image_n/nCD004260-CMP-003-09.png)
![Comparison 3 Main comparison ‐ sensitivity analysis using fixed‐effect model, Outcome 11 Quality of life ‐ long‐term effects [points].](/es/cdsr/doi/10.1002/14651858.CD004260.pub3/media/CDSR/CD004260/image_n/nCD004260-CMP-003-11.png)
![Comparison 3 Main comparison ‐ sensitivity analysis using fixed‐effect model, Outcome 12 Participants' global assessment of treatment effectiveness ‐ short‐term effects [points].](/es/cdsr/doi/10.1002/14651858.CD004260.pub3/media/CDSR/CD004260/image_n/nCD004260-CMP-003-12.png)

![Comparison 3 Main comparison ‐ sensitivity analysis using fixed‐effect model, Outcome 14 Manipulation under anaesthesia [number].](/es/cdsr/doi/10.1002/14651858.CD004260.pub3/media/CDSR/CD004260/image_n/nCD004260-CMP-003-14.png)
![Comparison 3 Main comparison ‐ sensitivity analysis using fixed‐effect model, Outcome 15 Adverse events [number].](/es/cdsr/doi/10.1002/14651858.CD004260.pub3/media/CDSR/CD004260/image_n/nCD004260-CMP-003-15.png)


![Comparison 3 Main comparison ‐ sensitivity analysis using fixed‐effect model, Outcome 25 Quadriceps strength ‐ short‐term effects [standardised mean].](/es/cdsr/doi/10.1002/14651858.CD004260.pub3/media/CDSR/CD004260/image_n/nCD004260-CMP-003-25.png)