Movilización pasiva continua después de la artroplastia total de rodilla en pacientes con artritis
Resumen
Antecedentes
La artritis de la rodilla es un problema frecuente que causa dolor y discapacidad. Si es grave, la artritis de la rodilla se puede tratar de forma quirúrgica con una artroplastia total de la rodilla. La rehabilitación posterior a la artroplastia de la rodilla a menudo incluye movilización pasiva continua (MPC). La MPC se realiza mediante una máquina que mueve la rodilla de forma pasiva y reiterada a una amplitud de movimiento (ADM) específica. Se considera que la MPC aumenta la recuperación de la ADM de la rodilla y presenta otros efectos beneficiosos terapéuticos. Sin embargo, no está claro si la MPC es efectiva.
Objetivos
Evaluar los efectos beneficiosos y perjudiciales de la MPC y la atención posoperatoria estándar versus una atención posoperatoria similar, con o sin ejercicios adicionales de la rodilla, en pacientes con artroplastia de la rodilla. Esta revisión es una actualización de una versión de la misma revisión de 2003 y 2010.
Métodos de búsqueda
Se realizaron búsquedas en el Registro Cochrane Central de Ensayos Controlados (Cochrane Central Register of Controlled Trials) (CENTRAL) (The Cochrane Library 2012, Número 12), MEDLINE (enero de 1966 hasta 24 de enero de 2013), EMBASE (enero de 1980 hasta 24 de enero de 2013), CINAHL (enero de 1982 hasta 24 de enero de 2013), AMED (enero de 1985 hasta 24 de enero de 2013) y en PEDro (hasta 24 de enero de 2013).
Criterios de selección
Ensayos controlados aleatorizados en los que el grupo experimental recibió MPC, y el grupo experimental y el grupo control recibieron atención posoperatoria y tratamiento similares después de la artroplastia total de rodilla en pacientes con artritis.
Obtención y análisis de los datos
Dos autores de la revisión de forma independiente seleccionaron los ensayos para su exclusión, extrajeron los datos y evaluaron el riesgo de sesgo. Los resultados primarios de interés fueron la ADM de la flexión activa de la rodilla, el dolor, la calidad de vida, la función, la evaluación global de los participantes de la efectividad del tratamiento, la incidencia de la manipulación bajo anestesia y los eventos adversos. Los resultados secundarios fueron la ADM de la flexión pasiva de la rodilla, la ADM de la extensión activa de la rodilla, la ADM de la extensión pasiva de la rodilla, la duración de la estancia hospitalaria, el edema y la fuerza del cuádriceps. Los efectos para los datos continuos se calcularon como diferencias de medias o diferencias de medias estandarizadas (DME), y los efectos para los datos dicotómicos como riesgos relativos, todos con los intervalos de confianza (IC) del 95%. Cuando fue apropiado se realizaron metanálisis mediante el modelo de efectos aleatorios.
Resultados principales
En las búsquedas electrónicas se identificaron 684 artículos después de eliminar los duplicados, y se recuperaron los informes completos de 62 ensayos potencialmente elegibles. Veinticuatro ensayos controlados aleatorizados con 1445 participantes cumplieron los criterios de inclusión; cuatro de ellos fueron nuevos para esta actualización.
Evidencia de calidad moderada indicó que la MPC no tiene efectos a corto plazo clínicamente importantes sobre la ADM de la flexión activa de la rodilla: la flexión media de la rodilla fue 78 grados en el grupo control, la MPC aumentó la ADM de la flexión activa de la rodilla en 2 grados (IC del 95%: 0 a 5), o una mejoría absoluta del 2% (IC del 95%: 0% a 4%). Los efectos a plazo medio y largo son similares, aunque la calidad de la evidencia es inferior.
Evidencia de baja calidad indicó que la MPC no tiene efectos a corto plazo clínicamente importantes sobre el dolor: el dolor medio fue de 3 puntos en el grupo control, la MPC redujo el dolor en 0,4 puntos en una escala de 10 puntos (IC del 95%: ‐0,8 a 0,1), o una reducción absoluta de ‐4% (IC del 95%: ‐8% a 1%).
Evidencia de moderada calidad indicó que la MPC no tiene efectos a corto plazo clínicamente importantes sobre el dolor: el dolor medio fue de 56 puntos en el grupo control, la MPC redujo el dolor en 1,6 puntos (IC del 95%: ‐6,1 a 2,0) en una escala de 100 puntos, o una reducción absoluta de ‐2% (IC del 95%: ‐5% a 2%). La DME fue ‐0,1 desviaciones estándar (DE) (IC del 95%: ‐0,3 a 0,1).
Evidencia de moderada calidad indicó que la MPC no tiene efectos a corto plazo clínicamente importantes sobre el dolor: el dolor medio fue de 40 puntos en el grupo control, la MPC redujo el dolor en 1 puntos (IC del 100%: ‐95 a 3) en una escala de 4 puntos, o una reducción absoluta de ‐1% (IC del 95%: ‐3% a 4%).
Evidencia de muy baja calidad indicó que la MPC reduce el riesgo de manipulación bajo anestesia; el riesgo de manipulación en el grupo control fue del 7,2%, el riesgo de manipulación en el grupo experimental fue del 1,6%; la MPC disminuyó el riesgo de manipulación en 25 manipulaciones menos por 1000 (IC del 95%: 9 a 64) o una reducción del riesgo absoluto de ‐4% (IC del 95%: ‐8% a 0%). El riesgo relativo fue 0,3 (IC del 95%: 0,1 a 0,9).
Evidencia de baja calidad indicó que la MPC reduce el riesgo de eventos adversos; en el grupo control fue del 16,3%, y en el grupo experimental fue del 15%; la MPC disminuyó el riesgo de eventos adversos en 13 eventos adversos menos por 1000, o una reducción del riesgo absoluto del ‐1% (IC del 95%: ‐5% a 3%). El riesgo relativo fue 0,9 (IC del 95%: 0,6 a 1,3). Las estimaciones para el riesgo de manipulación y de eventos adversos son muy imprecisas y la estimación para el riesgo de eventos adversos no distingue entre un aumento y una disminución clínicamente importantes en el riesgo.
No hubo evidencia suficiente para determinar el efecto de la MPC sobre la evaluación global de los participantes de la efectividad del tratamiento.
Conclusiones de los autores
La MPC no tiene efectos clínicamente importantes sobre la ADM de la flexión activa de la rodilla, el dolor, la función o la calidad de vida, como para justificar su uso habitual. Puede reducir el riesgo de manipulación bajo anestesia y el riesgo de desarrollar eventos adversos, aunque la evidencia que apoya estos hallazgos es de calidad muy baja y baja, respectivamente. No se conocen los efectos de la MPC sobre otros resultados.
PICO
Resumen en términos sencillos
Movilización pasiva continua después de la cirugía de reemplazo de rodilla
Antecedentes
La cirugía de reemplazo de rodilla es un procedimiento frecuente para el tratamiento de la artritis, aunque puede causar rigidez de la rodilla. La rigidez de la rodilla puede dificultar la realización de determinadas actividades que incluyen ponerse de pie desde una posición de sentado. La movilización pasiva continua (MPC) es una manera de proporcionar movimiento regular a la rodilla mediante una máquina. Esta revisión Cochrane presenta lo que se conoce acerca de los efectos de la MPC después de la cirugía de la rodilla. Luego de buscar todos los estudios relevantes en enero de 2013, se encontraron 24 estudios con 1445 participantes que habían sido sometidos a cirugía de reemplazo de la rodilla, principalmente a causa de artritis de la rodilla. La MPC comenzó desde el primer al cuarto días posteriores a la cirugía y se aplicó por 1,5 a 24 horas al día durante uno a 17 días. La revisión mostró que la cirugía de reemplazo de rodilla posterior a la MPC probablemente mejora levemente la capacidad de doblar la rodilla y la calidad de vida del paciente, aunque puede no mejorar el dolor o la función. No existe certeza acerca de los efectos de la MPC sobre la necesidad de manipulación bajo anestesia, las percepciones de los participantes de la efectividad del tratamiento o el riesgo de complicaciones.
La mejor estimación de lo que les sucede a los pacientes con MPC luego de la cirugía de reemplazo de rodilla incluye:
Amplitud de movimiento‐flexión activa de al rodilla (es decir, capacidad para doblar la rodilla)
Los pacientes que recibieron MPC pudieron doblar la rodilla como promedio 2 grados más (0 a 5 grados más) que los que no recibieron MPC, a las seis semanas (mejoría absoluta del 2%, mejoría absoluta 0% al 4%)
‐ Los pacientes que recibieron MPC pudieron doblar la rodilla como promedio 80 grados.
‐ Los pacientes que no recibieron MPC pudieron mover su rodilla como promedio 78 grados.
Dolor (puntuaciones más altas significan dolor peor o más intenso)
Los pacientes que recibieron MPC consideraron que el dolor fue como promedio 0,4 puntos menor(0,8 puntos menor a 0,1 puntos mayor) en una escala de 0 a 10 puntos, a las seis semanas (reducción absoluta del 4%, reducción del 8% a aumento del 1%)
‐ Los pacientes que recibieron MPC consideraron que el dolor fue como promedio 2,6 puntos en una escala de 0 a 10.
‐ Los pacientes que no recibieron MPC consideraron que el dolor fue como promedio 3 puntos en una escala de 0 a 10.
Función (puntuaciones mayores significan mejor función)
Los pacientes que recibieron MPC tuvieron como promedio una pérdida en la función equivalente a 1,6 puntos en una escala de 0 a 100 puntos, a los seis meses (reducción absoluta del 2%, reducción del 5% a aumento del 2%).
‐ Los pacientes que recibieron MPC tuvieron como promedio una función equivalente a 56 puntos en una escala de 0 a 100 puntos.
‐ Los pacientes que no recibieron MPC tuvieron como promedio una función equivalente a 57,6 puntos en una escala de 0 a 100 puntos.
Calidad de vida (puntuaciones más altas significan mejor calidad de vida)
Los pacientes que recibieron MPC tuvieron como promedio un aumento de la calidad de vida equivalente a 1 punto en una escala de 0 a 100 puntos, a los seis meses (mejoría absoluta del 1%, reducción del 3% a aumento del 4%).
‐ Los pacientes que recibieron MPC tuvieron como promedio una calidad de vida equivalente a 41 puntos en una escala de 0 a 100 puntos.
‐ Los pacientes que no recibieron MPC tuvieron como promedio una función equivalente a 40 puntos en una escala de 0 a 100 puntos.
Manipulación bajo anestesia
Los pacientes que recibieron MPC tuvieron como promedio una disminución en el riesgo de necesidad de manipulación bajo anestesia equivalente a 25 manipulaciones menos por 1000 pacientes (reducción del riesgo absoluto del 4%, reducción del riesgo del 8% a reducción del riesgo del 0%).
‐ Los pacientes que recibieron MPC tuvieron como promedio un riesgo del 1,6% de requerir manipulación bajo anestesia.
‐ Los pacientes que no recibieron MPC tuvieron como promedio un riesgo del 7,2% de requerir manipulación bajo anestesia.
Eventos adversos
Los pacientes que recibieron MPC tuvieron como promedio una disminución en el riesgo de desarrollar eventos adversos equivalente a 13 eventos adversos menos por 1000 pacientes (reducción del riesgo absoluto del 1%, reducción del riesgo del 5% a aumento del riesgo del 3%).
‐ Los pacientes que recibieron MPC tuvieron como promedio un riesgo del 15% de desarrollar eventos adversos.
‐ Los pacientes que no recibieron MPC tuvieron como promedio un riesgo del 16,3% de desarrollar eventos adversos.
Authors' conclusions
Summary of findings
| Primary comparison for continuous passive motion (CPM) versus no CPM | ||||||
| Patient or population: hospitalised patients who have undergone knee replacement surgery | ||||||
| Outcomes | Illustrative comparative risks* (95% CI) | Relative effect | No of participants | Quality of the evidence | Comments | |
| Assumed risk | Corresponding risk | |||||
| Control | Primary comparison | |||||
| Active knee flexion ROM | The mean active knee flexion ROM in the control groups was | The mean active knee flexion ROM in the intervention groups was | ‐ | 470 | ⊕⊕⊕⊝ | Absolute risk difference 2% (0 to 4); relative percent change 0% (2 to 5); not statistically significant2 |
| Pain | The mean pain in the control groups was | The mean pain in the intervention groups was | ‐ | 414 | ⊕⊕⊝⊝ | Absolute risk difference ‐4% (‐8 to 1); relative percent change ‐80% (‐36 to 8); not statistically significant5 |
| Function | The mean function in the control groups was | The mean function in the intervention groups was | ‐ | 405 | ⊕⊕⊕⊝ | SMD ‐0.1 (‐0.3 to 0.1); absolute risk difference ‐2% (‐5 to 2); relative percent change ‐4 (‐12 to 5)8 |
| Quality of life | The mean quality of life in the control groups was | The mean quality of life in the intervention groups was | 156 | ⊕⊕⊕⊝ | Absolute risk difference 1% (‐3 to 4) ; Relative percent change ‐8% (‐8 to 13); non‐statistically significant9 | |
| Participants' global assessment of treatment effectiveness | See comment | See comment | Not estimable | 211 | ⊕⊝⊝⊝ | Not estimable12 |
| Manipulation under anaesthesia | 72 per 1000 | 25 per 1000 | RR 0.34 | 581 | ⊕⊝⊝⊝ | Absolute risk difference ‐4% (‐8 to 0); relative percent decrease ‐67% (‐87 to 11); NNTB 21 (16 to 126) |
| Adverse events | 163 per 1000 | 150 per 1000 | RR 0.92 | 1040 | ⊕⊕⊝⊝ | Absolute risk difference ‐1% (‐5 to 3); relative percent decrease ‐9% (‐37 to 33); not statistically significant |
| *The basis for the assumed risk (e.g. the median control group risk across studies) is provided in footnotes. The corresponding risk (and its 95% confidence interval) is based on the assumed risk in the comparison group and the relative effect of the intervention (and its 95% CI). | ||||||
| GRADE Working Group grades of evidence | ||||||
| 1 The methodological quality of at least some of the included trials were susceptible to bias. | ||||||
Background
Description of the condition
Total knee arthroplasties (TKA) are surgical procedures that involve replacing the knee joint with artificial components. They are commonly performed to reduce pain and increase function in people with severe arthritis such as osteoarthritis (OA) and rheumatoid arthritis (RA). A common problem post surgery is joint stiffness.
Description of the intervention
Continuous passive motion (CPM) was first introduced by Salter et al in the 1960s (Salter 1989). It is a way of providing regular movement to the knee using an external motorised device that passively moves the joint through a pre‐set arc of motion (Sheppard 1995).
How the intervention might work
CPM is primarily advocated in the belief that it increases knee range of motion (ROM) (McCarthy 1992; Salter 1989). This is supported by animal studies, which have demonstrated that early movement minimises joint stiffness and improves ROM (Videman 1987). However, some scientists also claim that it reduces pain (Harms 1991), length of hospital stay (Fisher 1985; Schnebel 1989), and the need for manipulation under anaesthesia (a procedure that involves forcefully flexing the knee while the patient is anaesthetised to increase knee ROM (Fox 1981).
Why it is important to do this review
There remains uncertainty about whether CPM is therapeutic following TKA. For example, CPM continues to be prescribed as part of postoperative care following TKA, commercial companies continue to advertise CPM machines as a way to improve outcomes following TKA and research attention continues to be directed at determining the effects of CPM. Therefore, the purpose of this systematic review was to update two earlier versions of the same review with the overall aim of providing an objective synthesise of the evidence about the effectiveness of CPM following TKA for people with arthritis.
Objectives
To assess the benefits and harms of CPM and standard postoperative care versus similar postoperative care, with or without additional knee exercises, in people with knee arthroplasty. This review is an update of a 2003 and 2010 version of the same review.
Methods
Criteria for considering studies for this review
Types of studies
We included only randomised controlled trials (RCT), regardless of language. We accepted abstracts. We did not exclude trials based on quality assessment.
Types of participants
Participants could be of any age provided they were hospitalised following TKA. All participants needed to have a pre‐surgery diagnosis of arthritis.
Types of interventions
We included trials if CPM and standard postoperative care were compared with similar postoperative care with or without additional knee exercises. Standard postoperative care could include muscle‐strengthening exercises (isometric or dynamic), functional exercises, gait training, immobilisation or ice, provided both groups received the same intervention. Additional knee exercises could include instructions or supervised active or passive knee ROM exercises. They could not include knee exercises provided with any type of CPM device.
Types of outcome measures
Major outcomes
The primary outcomes of interest were active knee flexion ROM, pain, function, quality of life, participants' global assessment of treatment effectiveness, need for manipulation under anaesthesia and adverse events. If study authors did not distinguish between active and passive knee flexion ROM then it was assumed that the measurement was passive. Only direct measures of pain intensity were of interest. These included pain scales but not pain medication. These outcomes are presented in summary of findings Table for the main comparison.
Secondary outcomes
Secondary outcomes were passive knee flexion ROM, active knee extension ROM, passive knee extension ROM, length of hospital stay, swelling and quadriceps strength. If authors did not distinguish between active and passive knee ROM then it was assumed that the measurement was passive. We interpreted "knee extension lag" as active knee extension ROM and "fixed deformity" as passive knee extension ROM.
All results, except need for manipulation and adverse events, were categorised into short‐term effects of CPM (reflected in outcomes taken less than six weeks after randomisation), medium‐term effects of CPM (reflected in outcomes taken six weeks to six months after randomisation) and long‐term effects of CPM (reflected in outcomes taken more than six months after randomisation). Where trials collected data at multiple time periods within one of these categories, we used the data collected at the longest time since randomisation. Need for manipulation and adverse events were extracted regardless of time since randomisation.
Each of the primary outcomes were used in the 'Summary of findings' table. We used short‐term effects except for function and quality of life where we used medium‐term effects because either there were no data for the short‐term effects or the data could not be pooled because of heterogeneity.
Search methods for identification of studies
Electronic searches
We searched the following databases:
-
the Cochrane Central Register of Controlled Trials (CENTRAL) (2012, Issue 12);
-
MEDLINE (January 1966 to January 24, 2013);
-
EMBASE (January 1980 to January 24, 2013);
-
CINAHL (January 1982 to January 24, 2013);
-
AMED (January 1985 to January 24, 2013);
-
PEDro (to January 24, 2013).
We applied no language restrictions. The database details and results of all the searches are recorded in Appendix 1; Appendix 2; Appendix 3; Appendix 4; Appendix 5; and Appendix 6.
Searching other resources
We checked the reference lists of all included trials for other potentially relevant trials.
Data collection and analysis
Selection of studies
Two independent review authors examined the titles and abstracts of trials identified by the search strategy for trials that potentially met the inclusion criteria. We retrieved all trials classified as potentially eligible by at least one of the review authors. We re‐examined the retrieved articles to ensure that they met the inclusion criteria.
Data extraction and management
Two review authors independently extracted characteristics of included studies and results from each of the included trials. We resolved discrepancies by consensus. We addressed questions regarding the relative effectiveness of different dosages of CPM in a meta‐regression (see 'Data synthesis' for details). We used standardised mean differences (SMDs) when different scales were used to measure the same construct (e.g. function). SMDs were calculated by dividing the difference between treated and control means by the pooled estimate of the SD. If authors of trials provided both intention‐to‐treat and per‐protocol data, we used the intention‐to‐treat data. We did not impute missing data.
Assessment of risk of bias
Two review authors independently assessed the risk of bias in each trial using the method recommended in the Cochrane Handbook for Systematic Reviews of Interventions (Higgins 2011). We assessed the following methodological domains:
-
random sequence generation;
-
allocation sequence concealment;
-
blinding of participants;
-
blinding of therapists;
-
blinding of outcome assessors;
-
incomplete outcome data;
-
selective outcome reporting; and
-
other potential sources of bias.
We rated each potential source of bias as high, low or unclear (either lack of information or uncertainty over the potential for bias). We attempted to contact all study authors to clarify any ambiguities.
We resolved disagreements in ratings by discussion or, where necessary, by consulting a third review author.
Measures of treatment effect
For continuous data, we presented summary estimates as mean differences (MD) and 95% confidence intervals (CI) for pain, ROM and quality of life (weighted by the inverse of the variances of the estimates) or SMD and 95% CI for outcomes measured on different scales (function). SMDs were back‐translated to a typical scale (e.g. 0 to 100 for function) by multiplying the SMD by a typical among‐person SD (e.g. the SD of the control group at baseline from the most representative trial).
For dichotomous outcomes, we presented results as risk ratios (RR) and 95% CI.
For outcomes where it was desirable to have a lower score (e.g. pain); a negative value indicated a beneficial treatment effect of CPM. Conversely, for outcomes where it was desirable to have a larger score (e.g. knee flexion ROM); a positive value indicates a beneficial treatment effect of CPM. For some outcomes, such as function, different outcomes were used in different trials and the direction of beneficial treatment effect was not consistent such that higher numbers sometimes indicated a better outcome while in other trials it was the opposite. To overcome this problem, we inverted some data to ensure all outcomes were consistent within the one analysis.
Unit of analysis issues
In trials with more than two groups, we extracted only data from the two groups with the most contrasting interventions and used these for analyses. For example, in trials with one control and two CPM groups, we included only the results of the control group and CPM group with the highest dosage in analyses. We adopted this approach to reduce complexity and increase the readability of the systematic review.
Dealing with missing data
If outcomes were only reported graphically, we estimated the mean scores and SDs from the graphs.
Data synthesis
We estimated the effect of CPM by taking the difference in the mean outcome of the groups that did and did not receive CPM. For the primary analysis, the standard postoperative care may or may not have included additional knee exercises to one or both groups. We conducted a secondary analysis on just those trials in which the standard postoperative care for the control group included additional knee exercises. These trials provide a head‐to‐head comparison of the effectiveness of CPM and additional knee exercises. We pooled the MDs in outcomes from each trial to obtain a summary estimate of the effectiveness of CPM provided the I2 statistic was not greater than 50%. We used random‐effects models throughout. We used random‐effects meta‐regression to explore the effect of mean total CPM time (hours) on passive knee flexion ROM in the short term. We used the user‐written metareg routine in the Stata software package (version 10) for this purpose.
'Summary of findings' tables
We used the GRADE approach to summarise the quality of evidence about the effect of CPM on each of the primary outcomes (active knee flexion ROM, pain, function, quality of life, participants' global assessment of treatment effectiveness, need for manipulation under anaesthesia and adverse events). We used the short‐term effects in the analyses except for function and quality of life where we used the medium‐term effects because either there were no data for the short‐term effects or the data could not be pooled because of heterogeneity. We defined levels of quality as follows:
-
high quality: randomised trials;
-
medium quality: downgraded randomised trials;
-
low quality: double‐downgraded randomised trials; and
-
very low quality: triple‐downgraded randomised trials.
The quality of evidence was downgraded if:
-
there were limitations in the design and implementation of available trials suggesting high likelihood of bias;
-
there was only indirect evidence (indirect population, intervention, control, outcomes);
-
there was unexplained heterogeneity or inconsistency of results (including problems with subgroup analyses);
-
the results were imprecise (wide CIs); and
-
there was a high probability of publication bias.
In the same way, the quality of evidence was upgraded if:
-
the effect sizes were large;
-
all confounding factors reduced a demonstrated effect or suggested a spurious effect in trials that showed no effect; and
-
there was a dose‐response gradient.
We used GRADEpro software to compile the 'Summary of findings' table.
We re‐expressed outcomes pooled using SMDs as a MD by multiplying the SMD by a representative control group baseline SD from a trial, using a familiar instrument.
In addition to the absolute and relative magnitude of effect provided in the 'Summary of findings' table, we have reported the absolute percent difference, the relative percent change from baseline, and the number needed to treat (NNT) for an additional beneficial outcome (NNTB) or for an additional harmful outcome (NNTH) (the NNT was only provided for outcomes that showed a statistically significant difference).
For dichotomous outcomes, we calculated the absolute risk difference using the risk difference statistic in Review Manager 5 (RevMan 2012), and expressed the result as a percentage; the relative percentage change as the RR ‐ 1 and expressed it as a percentage; and the NNT from the control group event rate and the RR were determined using the Visual Rx NNT calculator (Cates 2008).
For continuous outcomes, we calculated the absolute risk difference as the MD between intervention and control groups in the original measurement units (divided by the scale), expressed as a percentage; the relative difference as the absolute change (or MD) divided by the baseline mean of the control group from a representative trial. As no continuous outcomes were significantly different between the intervention and control group, we did not calculate the NNT.
Subgroup analyses
We planned no subgroup analyses.
Sensitivity analyses
We planned no sensitivity analyses; however, we did look for small sample bias by re‐doing all the analyses using a fixed‐effect model and comparing results between the random‐effects model and fixed‐effect model of analyses for each outcome (Higgins 2011).
Results
Description of studies
Results of the search
The electronic searches identified 931 records (see Table 1 and Figure 1). This included 516 records that were identified in 2009 and an additional 415 records that were identified in 2013. Once duplicates were removed, there were 684 records (327 from 2009 and 357 from 2013).

Study flow diagram. Results from the 2003 version of this systematic review are included in the 2009 search results because a full search was re‐done in 2009 using a new search strategy.
| Database name, platform and time span | Update search date | Number of results |
| The Cochrane Library, Issue 12, December 2012 from database inception | January 2009 to 24 January 2013 | 1 |
| MEDLINE(R) Ovid 1966 to January week 3 2013 and MEDLINE(R) Ovid In‐Process & Other Non‐Indexed Citations 23 January 2013 | January 2009 to 24 January 2013 | 126 |
| EMBASE Ovid 1980 to 2013 week 3 | January 2009 to 24 January 2013 | 146 |
| EBSCOhost CINAHL 1981 to 23 January 2013 | January 2009 to 24 January 2013 | 1 |
| AMED Ovid (Allied and Complementary Medicine Database) 1985 to January 2013 | January 2009 to 24 January 2013 | 140 |
| Physiotherapy Evidence Database (PEDro) | January 2009 to 24 January 2013 | 1 |
| ‐ | TOTAL | 415 |
| ‐ | Total AFTER duplicates removed | 4 |
Included studies
Of the 684 records, 62 trials were potentially eligible. On inspection of the full reports, 24 met the inclusion criteria (Alkire 2010; Bennett 2005; Bruun‐Olsen 2009; Can 1995; Chiarello 1997; Colwell 1992; Denis 2006; Harms 1991; Huang 2003; Kumar 1996; Lau 2001; Lenssen 2003a; Lenssen 2008; MacDonald 2000; Maniar 2012; May 1999; McInnes 1992; Montgomery 1996; Ng 1999; Nielsen 1988; Ritter 1989; Sahin 2006; Vince 1987; Worland 1998). Four new studies were included in this update (Alkire 2010; Bruun‐Olsen 2009; Maniar 2012; Sahin 2006). All but one of the studies (Can 1995) were full papers. In the 24 included trials, CPM was administered from 1.5 to 24 hours a day (median 5.7, interquartile range 4 to 14) and for between 1 and 17 days (median 8, interquartile range 6 to 13) (see Characteristics of included studies table). A total of 1335 patients were randomised. Most patients had OA rather than RA. Treatments were initiated between the first and fourth postoperative day (POD) in all trials except one (May 1999), in which CPM treatment was initiated on transfer to a rehabilitation facility (between POD 2 and 13).
Excluded studies
Potentially eligible trials were most commonly excluded because the control group received something other than usual care with or without additional exercises (see Characteristics of excluded studies table). Seven trials are awaiting classification (see Characteristics of studies awaiting classification table).
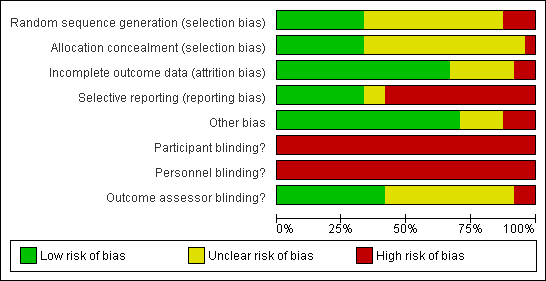
Risk of bias in included studies
No trial blinded patients or treating therapists as this is not easily achievable in trials of this type (see Figure 2 and Figure 3). Only eight trials concealed allocation and used an adequate method to generate the random sequence. Selective reporting was potentially a problem in 16 of the 24 trials and there was incomplete reporting of data in at least eight trials. Probably the biggest threat to bias in trials of CPM come from the use of non‐blinded assessors and only 10 trials blinded assessors. Sixteen trials had complete outcome data. Four trials were highly vulnerable to bias not satisfying any of the criteria used to assess methodological quality (Can 1995; Huang 2003; Vince 1987; Worland 1998).

Methodological quality summary: review authors' judgements about each methodological quality item for each included trial.

Risk of bias graph: review authors' judgements about each risk of bias item presented as percentages across all included studies.
Effects of interventions
The primary comparisons compared CPM combined with standard postoperative care versus standard postoperative care with or without additional knee exercises to one or both groups. These analyses included all trials for which data were available. The results are summarised below and in the summary of findings Table for the main comparison.
Major outcomes
1. Active knee flexion range of motion
Short‐term effects: Twelve trials with 626 participants measured active knee flexion ROM (Bennett 2005; Bruun‐Olsen 2009; Chiarello 1997; Denis 2006; Huang 2003; Lau 2001; Lenssen 2008; Maniar 2012; May 1999; McInnes 1992; Ng 1999; Sahin 2006). Ten trials with 470 participants provided useful data (Bruun‐Olsen 2009; Chiarello 1997; Denis 2006; Huang 2003; Lau 2001; Lenssen 2008; May 1999; McInnes 1992; Ng 1999; Sahin 2006). Active knee flexion was measured with a goniometer in all trials. The MD was 2 degrees with more ROM for the CPM group (95% CI 0 to 5; P value = 0.07; I2 = 43%; Analysis 1.1).
Medium‐term effects: Seven trials with 411 participants measured active knee flexion ROM (Bennett 2005; Bruun‐Olsen 2009; Huang 2003; Lau 2001; Lenssen 2008; Maniar 2012; Sahin 2006). Four trials with 195 participants provided useful data (Bruun‐Olsen 2009; Huang 2003; Lenssen 2008; Sahin 2006). Active knee flexion was measured with a goniometer in all trials. There was considerable between‐study heterogeneity in estimates of effect (I2 = 69%), so we did not pool the data. Point estimates of effect ranged from ‐7 to 8 degrees (Analysis 1.2).
Long‐term effects: Four trials with 232 participants measured active knee flexion ROM (Bennett 2005; Huang 2003; Lau 2001; Sahin 2006). Three trials with 132 participants provided useful data (Huang 2003; Lau 2001; Sahin 2006). Active knee flexion was measured with a goniometer in all trials. The MD was 3 degrees with more ROM for the CPM group (95% CI ‐1 to 7; P value = 0.16; I2 = 54%; Analysis 1.3).
2. Pain
Short‐term effects: Eleven trials with 683 participants measured pain (Bennett 2005; Bruun‐Olsen 2009; Denis 2006; Harms 1991; Lenssen 2003a; Lenssen 2008; Maniar 2012; May 1999; McInnes 1992; Montgomery 1996; Sahin 2006). Eight trials with 414 participants provided useful data (Bruun‐Olsen 2009; Denis 2006; Lenssen 2003a; Lenssen 2008; May 1999; McInnes 1992; Montgomery 1996; Sahin 2006). Pain was measured on a 10‐ or 100‐point visual analogue scale but we converted all results to a 10‐point scale for this review. The MD was ‐0.4 points on a 0‐ to 10‐point scale with less pain for the CPM group (95% CI ‐0.8 to 0.1; P value = 0.1; I2 = 50%; Analysis 1.4).
Medium‐term effects: Four trials with 243 participants measured pain (Alkire 2010; Bruun‐Olsen 2009; Lenssen 2008; Maniar 2012). Three trials with 179 participants provided useful data (Bruun‐Olsen 2009; Lenssen 2008; Maniar 2012). Pain was measured on a 10‐ or 100‐point visual analogue scale but we converted all results to a 10‐point scale for this review. The MD was 0.3 points on a 0‐ to 10‐point scale with more pain for the CPM group (95% CI ‐0.4 to 0.9; P value = 0.44; I2 = 52%; Analysis 1.5).
Long‐term effects: One trial with 28 participants measured pain using a 10‐point visual analogue scale (Sahin 2006). The MD was 0.1 points on a 0‐ to 10‐point scale with more pain for the CPM group (95% CI ‐0.8 to 0.9; P value = 0.87; Analysis 1.6).
3. Function
Short‐term effects: Five trials with 227 participants measured function (Denis 2006; Lenssen 2003a; Lenssen 2008; Maniar 2012; May 1999). Four trials with 171 participants provided useful data (Denis 2006; Lenssen 2003a; Lenssen 2008; May 1999). Function was measured in a variety of ways including the Knee Society Score, The Hospital for Special Surgery Score, The Timed Up and Go Test and the 10‐metre Walking Test. There was considerable between‐study heterogeneity in estimates of effect (I2 = 72%), so we did not pool the data. Point standardised estimates of effect ranged from ‐0.4 SD to 1 SD (Analysis 1.7).
Medium‐term effects: Eight trials with 555 participants measured function (Alkire 2010; Bennett 2005; Bruun‐Olsen 2009; Kumar 1996; Lenssen 2008; Maniar 2012; McInnes 1992; Worland 1998). Six trials with 405 participants provided useful data (Bennett 2005; Bruun‐Olsen 2009; Kumar 1996; Lenssen 2008; Maniar 2012; Worland 1998). Function was measured in a variety of ways including the Knee Society Score, The Hospital for Special Surgery Score, and the Western Ontario and McMaster Universities Osteoarthritis Index Physical Function Subscore. The SMD was ‐0.1 SD with less function for the CPM group (95% CI ‐0.3 to 0.1; P value = 0.45; I2 = 0%; Analysis 1.8).
Long‐term effects: Four trials with 288 participants measured function (Bennett 2005; MacDonald 2000; Sahin 2006; Worland 1998). All four trials provided useful data. Function was measured in a variety of ways including the Knee Society Score and The Hospital for Special Surgery Score. The SMD was 0 SD (95% CI ‐0.2 to 0.3; P value = 0.89; I2 = 0%; Analysis 1.9).
4. Quality of life
Short‐term effects: No trial measured this outcome during this time periods.
Medium‐term effects: Three trials with 197 participants measured quality of life(Bennett 2005; Kumar 1996; Maniar 2012). Two trials with 156 participants provided useful data (Bennett 2005; Maniar 2012). Quality of life was measured with the physical component subscore of the Short‐Form 12‐Item Health Survey (SF‐12). The MD was 1 point on a 0‐ to 100‐point scale with better quality of life for the CPM group (95% CI ‐3 to 4; P value = 0.66; Analysis 1.10).
Long‐term effects: One trial with 100 participants measured quality of life(Bennett 2005), using the physical component subscore of the SF‐12. The MD was 2 points on a 0‐ to 100‐point scale with better quality of life for the CPM group (95% CI ‐4 to 8; P value = 0.48; Analysis 1.11).
5. Participants' global assessment of treatment effectiveness
Short‐term effects: Three trials with 212 participants measured participants' global assessment of treatment effectiveness (Harms 1991; Lenssen 2003a; Lenssen 2008). All trials provided useful data. Participants' global assessment of treatment effectiveness was measured using a 7‐point perceived effects scale or a 10‐point visual analogue scale. There was considerable between‐study heterogeneity in estimates of effect (I2 = 67%), so we did not pool the data. Point estimates of effect ranged from ‐0.5 to 0.4 points (Analysis 1.12).
Medium‐term effects: One trial with 60 participants measured participants' global assessment of treatment effectiveness (Lenssen 2008), using a 7‐point perceived effects scale. The MD was ‐0.3 points on a 0‐ to 7‐point scale with less perception of treatment effectiveness for the CPM group (95% CI ‐0.7 to 0.1; P value = 0.18; Analysis 1.13).
Long‐term effects: No trial measured this outcome during this time periods.
6. Manipulation under anaesthesia
Nine trials with 600 participants measured incidence proportion of manipulation under anaesthesia (Alkire 2010; Denis 2006; Harms 1991; Kumar 1996; Lenssen 2008; Maniar 2012; May 1999; McInnes 1992; Vince 1987). Eight trials with 581 participants provided useful data (Denis 2006; Harms 1991; Kumar 1996; Lenssen 2008; Maniar 2012; McInnes 1992; Vince 1987). There were 25 manipulations under anaesthesia. The RR was 0.34 with less risk for the CPM group (95% CI 0.13 to 0.89; P value = 0.03; I2 = 0%; Analysis 1.14).
7. Adverse events
Seventeen trials with 1104 participants reported incidence proportion of adverse events (Alkire 2010; Bennett 2005; Colwell 1992; Denis 2006; Harms 1991; Huang 2003; Kumar 1996; Lau 2001; Maniar 2012; McInnes 1992; Montgomery 1996; Ng 1999; Nielsen 1988; Ritter 1989; Sahin 2006; Vince 1987; Worland 1998). Sixteen trials with 1040 participants provided useful data (Bennett 2005; Colwell 1992; Denis 2006; Harms 1991; Huang 2003; Kumar 1996; Lau 2001; Maniar 2012; McInnes 1992; Montgomery 1996; Ng 1999; Nielsen 1988; Ritter 1989; Sahin 2006; Vince 1987; Worland 1998). Adverse events included delayed healing, haemarthrosis, falls, deep venous thromboses, wound infections, pulmonary emboli, knee haematoma and a patellar rupture. There were 178 adverse events in total. The RR was 0.92 with less risk for the CPM group (95% CI 0.63 to 1.33; P value = 0.65; I2 = 39%; Analysis 1.15).
Secondary outcomes
1. Passive knee flexion range of motion
Short‐term effects: Fifteen trials with 944 participants measured passive knee flexion ROM (Alkire 2010; Bennett 2005; Bruun‐Olsen 2009; Chiarello 1997; Colwell 1992; Harms 1991; Kumar 1996; Lenssen 2003a; Lenssen 2008; Montgomery 1996; Ng 1999; Nielsen 1988; Ritter 1989; Vince 1987; Worland 1998). Eleven trials with 697 participants provided useful data (Bruun‐Olsen 2009; Chiarello 1997; Harms 1991; Kumar 1996; Lenssen 2003a; Lenssen 2008; Montgomery 1996; Ng 1999; Nielsen 1988; Ritter 1989; Worland 1998). Passive knee flexion was measured with a goniometer in all trials. The MD was 2 degrees with more ROM for the CPM group (95% CI 0 to 4; P value = 0.03; I2 = 22%; Analysis 1.16).
Medium‐term effects: Seven trials with 447 participants measured passive knee flexion ROM (Alkire 2010; Bruun‐Olsen 2009; Colwell 1992; Kumar 1996; MacDonald 2000; Ritter 1989; Worland 1998). Four trials with 264 participants provided useful data (Bruun‐Olsen 2009; Kumar 1996; MacDonald 2000; Worland 1998). Passive knee flexion was measured with a goniometer in all trials. The MD was ‐2 degrees with less ROM for the CPM group (95% CI ‐5 to 2; P value = 0.29; I2 = 29%; Analysis 1.17).
Long‐term effects: Three trials with 177 participants measured passive knee flexion ROM (Colwell 1992; MacDonald 2000; Worland 1998). Two trials with 160 participants provided useful data (MacDonald 2000; Worland 1998). Passive knee flexion was measured with a goniometer in all trials. The MD was 0 degrees (95% CI ‐2 to 2; P value = 0.96; I2 = 0%; Analysis 1.18).
2. Active knee extension range of motion
Short‐term effects: Fifteen trials with 890 participants measured active knee extension ROM (Bennett 2005; Bruun‐Olsen 2009; Chiarello 1997; Denis 2006; Harms 1991; Huang 2003; Lau 2001; Lenssen 2008; Maniar 2012; May 1999; McInnes 1992; Ng 1999; Nielsen 1988; Ritter 1989; Sahin 2006). Eleven trials with 574 participants provided useful data (Bruun‐Olsen 2009; Chiarello 1997; Denis 2006; Harms 1991; Huang 2003; Lenssen 2008; May 1999; McInnes 1992; Ng 1999; Nielsen 1988; Sahin 2006). Active knee extension was measured with a goniometer in all trials. The MD was 1 degree with more ROM for the CPM group (95% CI 0 to 2; P value = 0.17; I2 = 41%; Analysis 1.19).
Medium‐term effects: Six trials with 355 participants measured active knee extension ROM (Bennett 2005; Bruun‐Olsen 2009; Huang 2003; Lau 2001; Lenssen 2008; Sahin 2006). Four trials with 195 participants provided useful data (Bruun‐Olsen 2009; Huang 2003; Lenssen 2008; Sahin 2006). Active knee extension was measured with a goniometer in all trials. The MD was 1 degree with more ROM for the CPM group (95% CI ‐1 to 2; P value = 0.33; I2 = 41%; Analysis 1.20).
Long‐term effects: Five trials with 312 participants measured active knee extension ROM (Bennett 2005; Huang 2003; Lau 2001; Sahin 2006; Worland 1998). Two trials with 108 participants provided useful data (Sahin 2006; Worland 1998). Active knee extension was measured with a goniometer in all trials. The MD was 0 degrees (95% CI 0 to 0; P value = 0.33; I2 = 0%; Analysis 1.21).
3. Passive knee extension range of motion
Short‐term effects: Fifteen trials with 876 participants measured passive knee extension ROM (Alkire 2010; Bennett 2005; Bruun‐Olsen 2009; Chiarello 1997; Colwell 1992; Huang 2003; Kumar 1996; Lenssen 2003a; Lenssen 2008; May 1999; McInnes 1992; Ng 1999; Ritter 1989; Vince 1987; Worland 1998). Eleven trials with 629 participants provided useful data (Bruun‐Olsen 2009; Chiarello 1997; Huang 2003; Kumar 1996; Lenssen 2003a; Lenssen 2008; May 1999; McInnes 1992; Ng 1999; Ritter 1989; Worland 1998). Passive knee extension was measured with a goniometer in all trials. The MD was 1 degree with more ROM for the CPM group (95% CI 0 to 2; P value = 0.16; I2 = 47%; Analysis 1.22).
Medium‐term effects: Seven trials with 411 participants measured passive knee extension ROM (Alkire 2010; Bennett 2005; Bruun‐Olsen 2009; Colwell 1992; Huang 2003; Kumar 1996; Worland 1998). Four trials with 228 participants provided useful data (Bruun‐Olsen 2009; Huang 2003; Kumar 1996; Worland 1998). Passive knee extension was measured with a goniometer in all trials. There was considerable between‐study heterogeneity in estimates of effect (I2 = 80%), so we did not pool the data. Point estimates of effect ranged from ‐3 to 3 degrees (Analysis 1.23).
Long‐term effects: Five trials with 321 participants measured passive knee extension ROM (Bennett 2005; Colwell 1992; Huang 2003; MacDonald 2000; Worland 1998). Three trials with 204 participants provided useful data (Huang 2003; MacDonald 2000; Worland 1998). Passive knee extension was measured with a goniometer in all trials. The MD was 0 degrees (95% CI 0 to 1; P value = 0.59; I2 = 0%; Analysis 1.24).
4. Length of hospital stay
Short‐term effects: Fourteen trials with 840 participants measured length of hospital stay (Alkire 2010; Bennett 2005; Colwell 1992; Denis 2006; Harms 1991; Huang 2003; Kumar 1996; Lenssen 2003a; MacDonald 2000; May 1999; McInnes 1992; Montgomery 1996; Sahin 2006; Vince 1987). Ten trials with 614 participants provided useful data (Colwell 1992; Denis 2006; Harms 1991; Huang 2003; Kumar 1996; Lenssen 2003a; MacDonald 2000; McInnes 1992; Montgomery 1996; Sahin 2006). The MD was ‐0.4 days with shorter length of hospital stay for the CPM group (95% CI ‐1.0 to 0.2; P value = 0.15; I2 = 39%; Analysis 1.25).
5. Swelling
Short‐term effects: Seven trials with 464 participants measured swelling (Alkire 2010; Bruun‐Olsen 2009; Maniar 2012; McInnes 1992; Montgomery 1996; Ritter 1989; Sahin 2006). Five trials with 300 participants provided useful data (Bruun‐Olsen 2009; Maniar 2012; McInnes 1992; Montgomery 1996; Sahin 2006). Swelling was measured with a tape measure. There was considerable between‐study heterogeneity in estimates of effect (I2 = 71%), so we did not pool the data. Point estimates of effect ranged from ‐1.9 to 1.6 cm (Analysis 1.26).
Medium‐term effects: Two trials with 119 participants measured swelling (Bruun‐Olsen 2009; Maniar 2012). Both trials provided useful data. Swelling was measured with a tape measure. The MD was 0.8 cm with more swelling for the CPM group (95% CI ‐1.1 to 2.8; P value = 0.41; I2 = 31%; Analysis 1.27).
Long‐term effects: No trial measured this outcome during this time periods.
6. Quadriceps strength
Short‐term effects: Two trials with 130 participants measured quadriceps strength (Lenssen 2003a; McInnes 1992). Both trials provided useful data. Strength was measured with a dynamometer (N) or manual muscle test (6‐point scale). The SMD was 0.3 SD with more strength for the CPM group (95% CI ‐0.1 to 0.6; P value = 0.13; I2 = 0%; Analysis 1.28).
Medium‐ and long‐term effects: No trial measured this outcome during these time periods.
The secondary comparison compared CPM combined with standard postoperative care versus standard postoperative care plus additional knee exercises. These analyses provide a head‐to‐head comparison of the effectiveness of CPM and exercise. Analyses were performed on data from four trials (May 1999; Montgomery 1996; Ritter 1989; Worland 1998). Where it was possible to calculate pooled estimates, there was no indication of the superiority of either intervention (CPM or exercise).
The short‐term effects of mean total continuous passive motion time on passive knee flexion range of motion
Eleven trials with 697 participants measured passive knee flexion ROM and provided sufficient data to estimate mean total CPM time (Bruun‐Olsen 2009; Chiarello 1997; Harms 1991; Kumar 1996; Lenssen 2003a; Lenssen 2008; Montgomery 1996; Ng 1999; Nielsen 1988; Ritter 1989; Worland 1998). The duration of CPM had no effect on passive knee flexion ROM (mean increase of 0.01 degrees for every additional hour of CPM; 95% CI ‐0.04 to 0.06). This effect was not statistically significant (P value = 0.66).
Sensitivity analysis
Small sample size bias was not detected for any of the main comparisons.
Discussion
Summary of main results
CPM following TKA is primarily advocated for its proposed benefits on knee ROM, particularly knee flexion. Knee flexion ROM is important for mobility tasks such as walking, transferring and performing activities of daily living (Rowe 2000). It is also important for activities such as squatting and kneeling, which are activities of daily living for many cultures (Hemmerich 2006). In interpreting the results of this review, it is important to consider how much additional knee flexion ROM is required to justify the use of CPM. Few people would claim that an added benefit of less than 5 degrees is functionally important, and most people would probably agree that considerably more than 5 degrees is required to justify the added time, cost and inconvenience of CPM. This being the case, the findings of this systematic review provide moderate‐quality evidence to indicate that CPM does not have clinically important short‐term effects on active knee flexion ROM (see summary of findings Table for the main comparison and Analysis 1.1). The short‐term effects on passive knee flexion, passive knee extension and active knee extension are similar with mean effects of 1 to 2 degrees. All estimates of the short‐term effects of CPM on knee ROM are estimated with less than 5 degrees of uncertainty (as reflected in the 95% CI). The medium‐ and long‐term effects of CPM on active knee flexion ROM, passive knee flexion ROM, active knee extension ROM or passive knee extension ROM are similar to the short‐term effects ‐ all have mean effects less than 3 degrees. Importantly, the upper 95% CIs of all but one of the eight estimates of the medium‐ and long‐term effects are less than 5 degrees. The exception is the long‐term effects on active knee flexion ROM, but this estimate was only based on three trials of 132 participants and the estimate is imprecise (95% CI ‐1 to 7 degrees). Taken together, this review provides moderate‐quality evidence that CPM does not have sufficient effect on knee ROM to justify its widespread use.
Some people develop very stiff knees following TKA, irrespective of whether they receive CPM. One way to manage this problem is to manipulate the knee under anaesthesia. There is very low‐quality evidence to suggest that CPM reduces the risk of manipulation. The reported effect is large in relative terms (RR 0.34) but the incidence proportion of manipulations following TKA is low (i.e. 7%) with only 25 manipulations reported in the eight trials involving 581 participants. An RR of 0.34 with this incidence proportion corresponds to an absolute reduction in risk of manipulation under anaesthesia of 4% (see summary of findings Table for the main comparison). This means that one manipulation will be prevented in every 21 people provided with CPM (95% CI 16 to 126). However, the estimate of RR is imprecise (95% CI 0.13 to 0.89) and does not rule out the possibility of a trivially small effect (i.e. one manipulation prevented in every 126 people provided CPM). In addition, these results are based on just eight trials and it is not clear in any of the included trials whether the clinicians making decisions about the need for manipulation were blinded to allocation. Interestingly, while knee stiffness is the most common indication for manipulation under anaesthesia, the results from this systematic review indicate there was little difference in knee ROM of people who did and did not receive CPM. Therefore, the findings about risk of manipulation need to be interpreted with caution (see summary of findings Table for the main comparison and Analysis 1.14).
One hundred and seventy‐eight adverse events were reported in 16 trials comprising 1040 participants. The types of adverse events reported were delayed healing, haemarthrosis, falls, deep venous thromboses, wound infections, pulmonary emboli and a patellar rupture. Some of the adverse events were unlikely to be related to CPM but nonetheless were included in the analyses because they would not bias the findings. The point estimate provides low‐quality evidence to indicate a decrease in the risk of adverse events with CPM (RR 0.92; 95% CI 0.63 to 1.33); however, the associated 95% CI includes an important increase and decrease in the risk of adverse events with CPM. It is, therefore, unclear whether CPM affects the risk of adverse events. The effect of CPM on participants' global assessment of treatment effectiveness was also unclear. The three trials that included this outcome provided contradictory results and the data were too heterogeneous to pool.
CPM clearly does not have clinically meaningful short‐, medium‐ or long‐term effects on pain (MDs range from ‐0.4 to 0.3 points on a 10‐point scale; 95% CI range from ‐0.8 to 0.9) although the medium‐ and long‐term effects are only based on three and one trials, respectively, and, therefore, need to be interpreted with caution. The short‐, medium‐ and long‐term effects of CPM on length of hospital stay, swelling and quadriceps strength are more difficult to interpret. While none of the meta‐analyses on these outcomes were statistically significant, it is not clear if they rule out clinically meaningful effects. Resolution of this issue requires clarification of what constitutes a clinically meaningful effect. For example, if a reduction in length of hospital stay of 2 days is considered clinically meaningful then the results of this systematic review clearly indicate that CPM does not have clinically meaningful effects (MD ‐0.4 days; 95% CI ‐1.0 to 0.2). However, if a reduction in length of hospital stay of 1 day is considered clinically meaningful then the data do not rule out the possibility of a clinically meaningful effect.
Perhaps the most important outcome is function because it reflects the implications of ROM, strength, swelling and pain on activities of daily living. However, function was not routinely included as an outcome measure and when it was, many different scales were used. The best estimate of the effect of CPM on function comes from trials that examined the medium‐term effect. These trials provided moderate‐quality evidence to suggest that CPM does not have clinically important effects on function unless a relative percent change in function of 5% is considered as worthwhile (relative percent change ‐4%; 95% CI ‐12 to 5; see summary of findings Table for the main comparison). The precision of this estimate is surprisingly good given the multidimensional nature of the different measures used to measure function. For example, The Hospital and Knee Score used in some trials not only measures the ability of patients to walk, transfer and climb stairs but also measures knee ROM, pain, strength and instability. Future trials would benefit from some agreement on the most appropriate way to measure function in this group of patients.
Quality of life was only measured in two trials (Bennett 2005; Maniar 2012), yet together these trials provide moderate‐quality evidence to indicate that CPM does not have clinically important effects. The medium‐term effect was very small and the estimate surprisingly precise (MD of 1 point on a 0‐ to 100‐point scale; 95% CI ‐3 to 4). This estimate does not rule out the possibility of a 4/100 point improvement in quality of life with CPM but most would consider this too small to justify its use. However, more trials are required to verify these findings.
Overall completeness and applicability of evidence
Many different protocols were used to administer CPM. For example, in some trials CPM was started immediately after the TKA operation whereas in other trials it was started days later. The CPM settings were also different between trials. In some trials, the settings were dictated by a protocol whereas in other trials they were determined by patient comfort or clinician discretion. All these variables may have influenced the observed effects of CPM. A meta‐regression was used to explore the possibility that total CPM time influences passive knee flexion ROM. Passive knee flexion ROM was selected because this was the most commonly measured outcome. The meta‐regression indicated that there was little or no effect of CPM duration on short‐term passive knee flexion ROM. That is, trials that applied CPM for 24 hours a day over an extended time period did not report systematically more passive knee flexion ROM than those that only applied CPM for a few hours over one or two days.
Protocols for co‐interventions were also highly variable. In a subset of four trials, control participants also received additional knee exercises. A secondary analysis explored the effect of CPM in this subset of trials. The purpose was to compare the effectiveness of CPM and knee exercises. This analysis was inconclusive because of the small number of trials. Nonetheless, it is unlikely that CPM would be more effective than knee exercises because the primary analysis indicated CPM is no more effective than usual care, with or without additional knee exercises.
There was usually a high degree of consistency (low between‐study heterogeneity) in estimates of effects of pooled findings. Heterogeneity was only apparent in a small number of comparisons, typically where SMDs were used and when total sample sizes were small. The heterogeneity could have been due to any number of factors but was most likely due to the use of different tools to measure the same construct. This was particularly problematic for function, which was measured with outcomes as diverse as self reporting questionnaires and timed walking tests.
Interestingly, the applicability of the evidence about CPM is changing. CPM may no longer be a viable or appropriate treatment option, regardless of findings, because patients are now commonly discharged within a few days of surgery and often mobilised on the same day as surgery.
Quality of the evidence
The methodological quality of trials was variable (see Figure 2). Only 10 trials clearly blinded assessors. Not surprisingly, given the nature of the intervention, no trial blinded participants or therapists. Failure to blind assessors, participants and therapists exposes the trials to performance and detection biases. The failure to blind participants is potentially more of problem for outcomes that rely on self report (such as pain) than more objective measures (such as passive knee ROM). Only eight of the 24 trials concealed allocation and nearly all trials were selective in their reporting of data. These potential sources of bias led to a downgrading of the quality of evidence for all outcomes reported in the summary of findings Table for the main comparison on the 'Risk of bias' criterion. Pain, manipulation under anaesthesia and participants' global assessment of treatment effectiveness were further downgraded because the results across trials for these outcomes were inconsistent. Imprecision of the point estimates were considered a serious problem for two of the primary outcomes, namely participants' global assessment of treatment effectiveness and manipulation under anaesthesia. Consequently, the findings for active knee flexion ROM, function and quality of life are based on moderate‐quality evidence, the findings for pain and risk of adverse events are based on low‐quality evidence, and the findings for participants' global assessment of treatment effectiveness and manipulation under anaesthesia are based on very low‐quality evidence. These limitations notwithstanding, the main findings are probably robust because bias tends to inflate estimates of effects (Gluud 2006; Savovic 2012), and most estimates of treatment effects in this systematic review were very small.
Potential biases in the review process
The main potential source of bias in the review process arises from failure to identify all relevant trials. This may have occurred, particularly if trials were unpublished. However, retrieval bias generally tends to inflate estimates of effects (Dickersin 1993; Egger 1998), but this review reports small effects of CPM on most outcomes.
Agreements and disagreements with other studies or reviews
The original version of this systematic review was done in 2003. It was updated in 2010 and then again for this review in 2013. The main difference in conclusions between the original and the 2010 version related to length of hospital stay. In 2003, it was concluded that CPM reduces length of hospital stay. In the 2010 systematic review, it was concluded that CPM does not reduce length of hospital stay. However, in this present review it was concluded that the effects of CPM on length of hospital stay are inconclusive.
It is also worth noting that the original review performed in 2003 suggested that the effect of CPM on knee ROM may be dose dependent. Dose dependence was tested in the 2010 review and then again in this review by using a meta‐regression to examine effects of mean total CPM time (hours) on passive knee flexion ROM in the short term. The results indicated that the response to CPM is not dose dependent.
Our findings are broadly consistent with the findings of similar systematic reviews (Grella 2008; Lenssen 2003b; van Dijk 2007; Viswanathan 2010). The only discrepancy is with the conclusions of Lenssen et al (Lenssen 2003b). These authors concluded that CPM had a short‐term effect on knee flexion ROM (MD 8 degrees; 95% CI ‐2 to 18) despite the considerable uncertainty around the estimate. The difference between our estimate and that of Lenssen 2003b was probably due to differences in the trials included in the two meta‐analyses. Our pooled estimate (MD 2 degrees, 95% CI 0 to 4) was based on 11 trials (697 participants) and the estimate of Lenssen 2003b was based of five trials (317 participants). There was only one trial in common in the two meta‐analyses due to differences in the inclusion criteria and year of the reviews.
Other systematic reviews have investigated the effect of CPM following knee cartilage defect surgery (Fazalare 2010), shoulder rotator cuff repair (Du Plessis 2011), and anterior cruciate ligament reconstruction (Lobb 2012; Smith 2007). One review reported no evidence of benefit of CPM (Lobb 2012), two concluded that there was insufficient evidence (Fazalare 2010; Smith 2007), and one reported two clinical trials that demonstrated a treatment effect on ROM but this conclusion was not clearly supported from the findings of the two cited trials (Du Plessis 2011). While it is possible that the effects of CPM are different for various conditions, this would seem unlikely. Therefore, the results of the systematic reviews following different types of surgery lend further weight to the results of this systematic review indicating little if any benefit of CPM on at least knee ROM following TKA.
Summary
The findings of 24 RCTs of 1445 participants provide moderate‐quality evidence that CPM does not have clinically important short‐term effects on active knee flexion ROM or medium‐term effects on function or quality of life. There is low‐quality evidence to indicate that CPM does not have clinically important short‐term effects on pain. The effects of CPM on participants' global assessment of treatment effectiveness, risk of manipulation, risk of adverse events, length of hospital stay, swelling and quadriceps strength remain unclear although there is very low‐quality evidence to indicate that CPM reduces the risk of manipulation under anaesthesia.

Study flow diagram. Results from the 2003 version of this systematic review are included in the 2009 search results because a full search was re‐done in 2009 using a new search strategy.

Methodological quality summary: review authors' judgements about each methodological quality item for each included trial.
Risk of bias graph: review authors' judgements about each risk of bias item presented as percentages across all included studies.

Comparison 1 Main comparison, Outcome 1 Active knee flexion ROM ‐ short‐term effects.

Comparison 1 Main comparison, Outcome 2 Active knee flexion ROM ‐ medium‐term effects.

Comparison 1 Main comparison, Outcome 3 Active knee flexion ROM ‐ long‐term effects.

Comparison 1 Main comparison, Outcome 4 Pain ‐ short‐term effects.
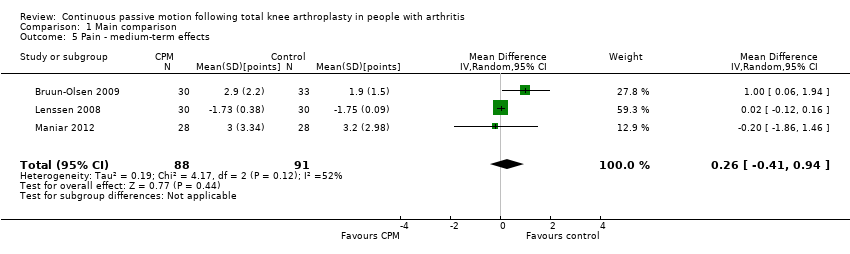
Comparison 1 Main comparison, Outcome 5 Pain ‐ medium‐term effects.

Comparison 1 Main comparison, Outcome 6 Pain ‐ long‐term effects.
![Comparison 1 Main comparison, Outcome 7 Function ‐ short‐term effects [standardised mean].](/es/cdsr/doi/10.1002/14651858.CD004260.pub3/media/CDSR/CD004260/image_n/nCD004260-CMP-001-07.png)
Comparison 1 Main comparison, Outcome 7 Function ‐ short‐term effects [standardised mean].
![Comparison 1 Main comparison, Outcome 8 Function ‐ medium‐term effects [standardised mean].](/es/cdsr/doi/10.1002/14651858.CD004260.pub3/media/CDSR/CD004260/image_n/nCD004260-CMP-001-08.png)
Comparison 1 Main comparison, Outcome 8 Function ‐ medium‐term effects [standardised mean].
![Comparison 1 Main comparison, Outcome 9 Function ‐ long‐term effects [standardised mean].](/es/cdsr/doi/10.1002/14651858.CD004260.pub3/media/CDSR/CD004260/image_n/nCD004260-CMP-001-09.png)
Comparison 1 Main comparison, Outcome 9 Function ‐ long‐term effects [standardised mean].

Comparison 1 Main comparison, Outcome 10 Quality of life ‐ medium‐term effects.

Comparison 1 Main comparison, Outcome 11 Quality of life ‐ long‐term effects.
![Comparison 1 Main comparison, Outcome 12 Participants' global assessment of treatment effectiveness ‐ short‐term effects [points].](/es/cdsr/doi/10.1002/14651858.CD004260.pub3/media/CDSR/CD004260/image_n/nCD004260-CMP-001-12.png)
Comparison 1 Main comparison, Outcome 12 Participants' global assessment of treatment effectiveness ‐ short‐term effects [points].

Comparison 1 Main comparison, Outcome 13 Participants' global assessment of treatment effectiveness ‐ medium‐term effects.
![Comparison 1 Main comparison, Outcome 14 Manipulation under anaesthesia [number].](/es/cdsr/doi/10.1002/14651858.CD004260.pub3/media/CDSR/CD004260/image_n/nCD004260-CMP-001-14.png)
Comparison 1 Main comparison, Outcome 14 Manipulation under anaesthesia [number].
![Comparison 1 Main comparison, Outcome 15 Adverse events [number].](/es/cdsr/doi/10.1002/14651858.CD004260.pub3/media/CDSR/CD004260/image_n/nCD004260-CMP-001-15.png)
Comparison 1 Main comparison, Outcome 15 Adverse events [number].

Comparison 1 Main comparison, Outcome 16 Passive knee flexion ROM ‐ short‐term effects.

Comparison 1 Main comparison, Outcome 17 Passive knee flexion ROM ‐ medium‐term effects.

Comparison 1 Main comparison, Outcome 18 Passive knee flexion ROM ‐ long‐term effects.

Comparison 1 Main comparison, Outcome 19 Active knee extension ROM ‐ short‐term effects.

Comparison 1 Main comparison, Outcome 20 Active knee extension ROM ‐ medium‐term effects.

Comparison 1 Main comparison, Outcome 21 Active knee extension ROM ‐ long‐term effects.

Comparison 1 Main comparison, Outcome 22 Passive knee extension ROM ‐ short‐term effects.

Comparison 1 Main comparison, Outcome 23 Passive knee extension ROM ‐ medium‐term effects.
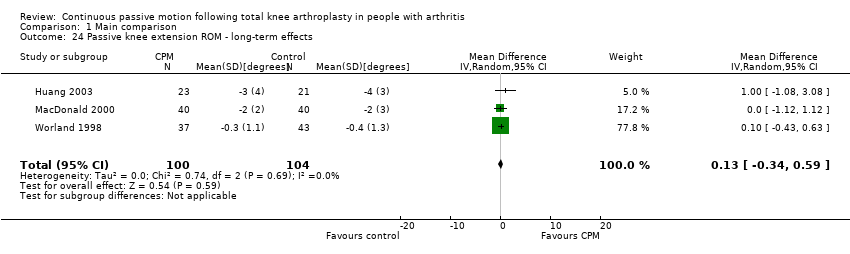
Comparison 1 Main comparison, Outcome 24 Passive knee extension ROM ‐ long‐term effects.
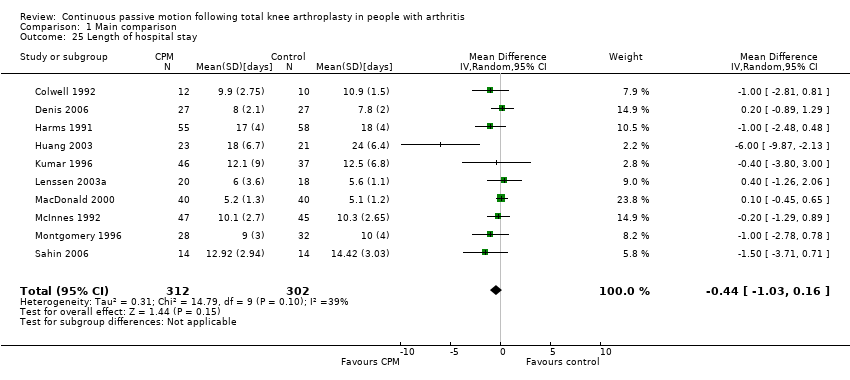
Comparison 1 Main comparison, Outcome 25 Length of hospital stay.

Comparison 1 Main comparison, Outcome 26 Swelling ‐ short‐term effects.

Comparison 1 Main comparison, Outcome 27 Swelling ‐ medium‐term effects.
![Comparison 1 Main comparison, Outcome 28 Quadriceps strength ‐ short‐term effects [standardised mean].](/es/cdsr/doi/10.1002/14651858.CD004260.pub3/media/CDSR/CD004260/image_n/nCD004260-CMP-001-28.png)
Comparison 1 Main comparison, Outcome 28 Quadriceps strength ‐ short‐term effects [standardised mean].

Comparison 2 Secondary comparison ‐ subgroup of studies in which control participants received additional knee exercises, Outcome 1 Active knee flexion ROM.

Comparison 2 Secondary comparison ‐ subgroup of studies in which control participants received additional knee exercises, Outcome 2 Passive knee flexion ROM.

Comparison 2 Secondary comparison ‐ subgroup of studies in which control participants received additional knee exercises, Outcome 3 Active knee extension ROM.

Comparison 2 Secondary comparison ‐ subgroup of studies in which control participants received additional knee exercises, Outcome 4 Passive knee extension ROM.

Comparison 2 Secondary comparison ‐ subgroup of studies in which control participants received additional knee exercises, Outcome 5 Length of hospital stay.

Comparison 2 Secondary comparison ‐ subgroup of studies in which control participants received additional knee exercises, Outcome 6 Function.
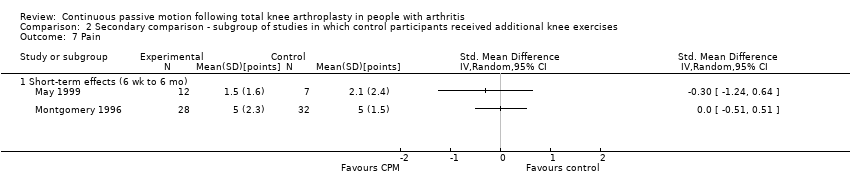
Comparison 2 Secondary comparison ‐ subgroup of studies in which control participants received additional knee exercises, Outcome 7 Pain.

Comparison 2 Secondary comparison ‐ subgroup of studies in which control participants received additional knee exercises, Outcome 8 Swelling.

Comparison 3 Main comparison ‐ sensitivity analysis using fixed‐effect model, Outcome 1 Active knee flexion ROM ‐ short‐term effects.
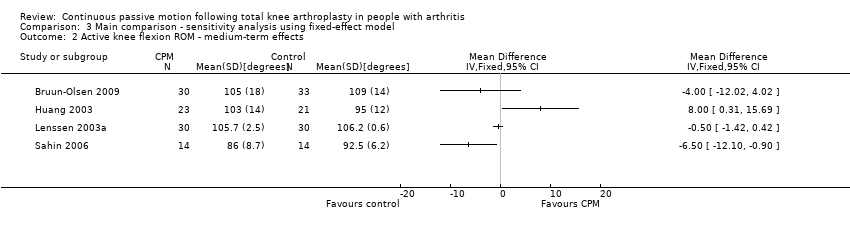
Comparison 3 Main comparison ‐ sensitivity analysis using fixed‐effect model, Outcome 2 Active knee flexion ROM ‐ medium‐term effects.

Comparison 3 Main comparison ‐ sensitivity analysis using fixed‐effect model, Outcome 3 Active knee flexion ROM ‐ long‐term effects.

Comparison 3 Main comparison ‐ sensitivity analysis using fixed‐effect model, Outcome 4 Pain ‐ short‐term effects.

Comparison 3 Main comparison ‐ sensitivity analysis using fixed‐effect model, Outcome 5 Pain ‐ medium‐term effects.
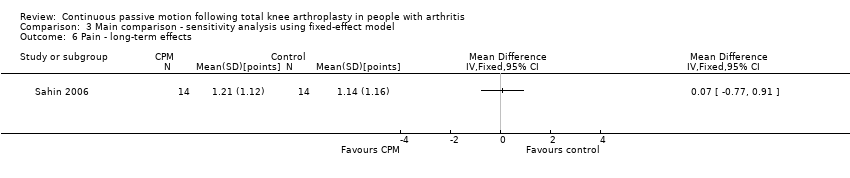
Comparison 3 Main comparison ‐ sensitivity analysis using fixed‐effect model, Outcome 6 Pain ‐ long‐term effects.
![Comparison 3 Main comparison ‐ sensitivity analysis using fixed‐effect model, Outcome 7 Function ‐ short‐term effects [standardised mean].](/es/cdsr/doi/10.1002/14651858.CD004260.pub3/media/CDSR/CD004260/image_n/nCD004260-CMP-003-07.png)
Comparison 3 Main comparison ‐ sensitivity analysis using fixed‐effect model, Outcome 7 Function ‐ short‐term effects [standardised mean].
![Comparison 3 Main comparison ‐ sensitivity analysis using fixed‐effect model, Outcome 8 Function ‐ medium‐term effects [standardised mean].](/es/cdsr/doi/10.1002/14651858.CD004260.pub3/media/CDSR/CD004260/image_n/nCD004260-CMP-003-08.png)
Comparison 3 Main comparison ‐ sensitivity analysis using fixed‐effect model, Outcome 8 Function ‐ medium‐term effects [standardised mean].
![Comparison 3 Main comparison ‐ sensitivity analysis using fixed‐effect model, Outcome 9 Function ‐ long‐term effects [standardised mean].](/es/cdsr/doi/10.1002/14651858.CD004260.pub3/media/CDSR/CD004260/image_n/nCD004260-CMP-003-09.png)
Comparison 3 Main comparison ‐ sensitivity analysis using fixed‐effect model, Outcome 9 Function ‐ long‐term effects [standardised mean].
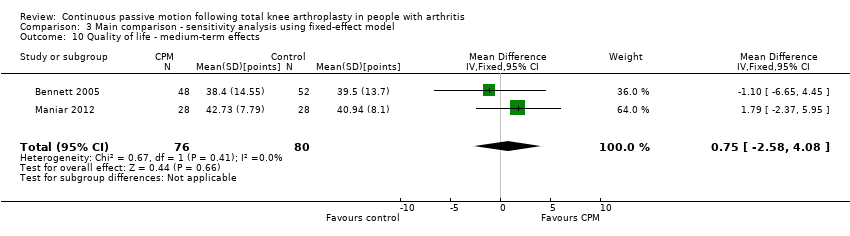
Comparison 3 Main comparison ‐ sensitivity analysis using fixed‐effect model, Outcome 10 Quality of life ‐ medium‐term effects.
![Comparison 3 Main comparison ‐ sensitivity analysis using fixed‐effect model, Outcome 11 Quality of life ‐ long‐term effects [points].](/es/cdsr/doi/10.1002/14651858.CD004260.pub3/media/CDSR/CD004260/image_n/nCD004260-CMP-003-11.png)
Comparison 3 Main comparison ‐ sensitivity analysis using fixed‐effect model, Outcome 11 Quality of life ‐ long‐term effects [points].
![Comparison 3 Main comparison ‐ sensitivity analysis using fixed‐effect model, Outcome 12 Participants' global assessment of treatment effectiveness ‐ short‐term effects [points].](/es/cdsr/doi/10.1002/14651858.CD004260.pub3/media/CDSR/CD004260/image_n/nCD004260-CMP-003-12.png)
Comparison 3 Main comparison ‐ sensitivity analysis using fixed‐effect model, Outcome 12 Participants' global assessment of treatment effectiveness ‐ short‐term effects [points].

Comparison 3 Main comparison ‐ sensitivity analysis using fixed‐effect model, Outcome 13 Participants' global assessment of treatment effectiveness ‐ medium‐term effects.
![Comparison 3 Main comparison ‐ sensitivity analysis using fixed‐effect model, Outcome 14 Manipulation under anaesthesia [number].](/es/cdsr/doi/10.1002/14651858.CD004260.pub3/media/CDSR/CD004260/image_n/nCD004260-CMP-003-14.png)
Comparison 3 Main comparison ‐ sensitivity analysis using fixed‐effect model, Outcome 14 Manipulation under anaesthesia [number].
![Comparison 3 Main comparison ‐ sensitivity analysis using fixed‐effect model, Outcome 15 Adverse events [number].](/es/cdsr/doi/10.1002/14651858.CD004260.pub3/media/CDSR/CD004260/image_n/nCD004260-CMP-003-15.png)
Comparison 3 Main comparison ‐ sensitivity analysis using fixed‐effect model, Outcome 15 Adverse events [number].

Comparison 3 Main comparison ‐ sensitivity analysis using fixed‐effect model, Outcome 16 Passive knee flexion ROM ‐ short‐term effects.

Comparison 3 Main comparison ‐ sensitivity analysis using fixed‐effect model, Outcome 17 Passive knee flexion ROM ‐ medium‐term effects.

Comparison 3 Main comparison ‐ sensitivity analysis using fixed‐effect model, Outcome 18 Passive knee flexion ROM ‐ long‐term effects.

Comparison 3 Main comparison ‐ sensitivity analysis using fixed‐effect model, Outcome 19 Active knee extension ROM ‐ short‐term effects.

Comparison 3 Main comparison ‐ sensitivity analysis using fixed‐effect model, Outcome 20 Active knee extension ROM ‐ medium‐term effects.

Comparison 3 Main comparison ‐ sensitivity analysis using fixed‐effect model, Outcome 21 Active knee extension ROM ‐ long‐term effects.
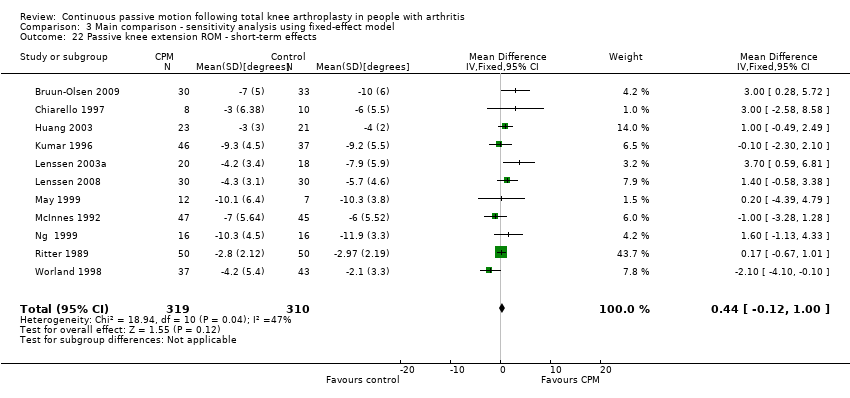
Comparison 3 Main comparison ‐ sensitivity analysis using fixed‐effect model, Outcome 22 Passive knee extension ROM ‐ short‐term effects.
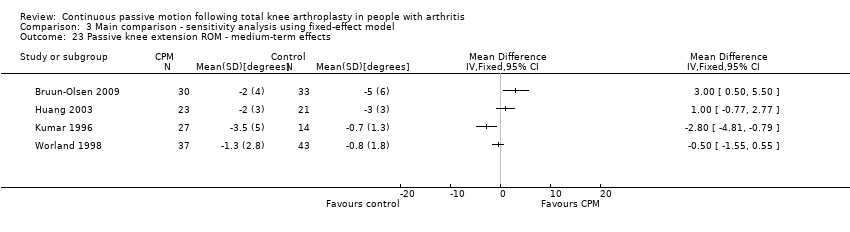
Comparison 3 Main comparison ‐ sensitivity analysis using fixed‐effect model, Outcome 23 Passive knee extension ROM ‐ medium‐term effects.
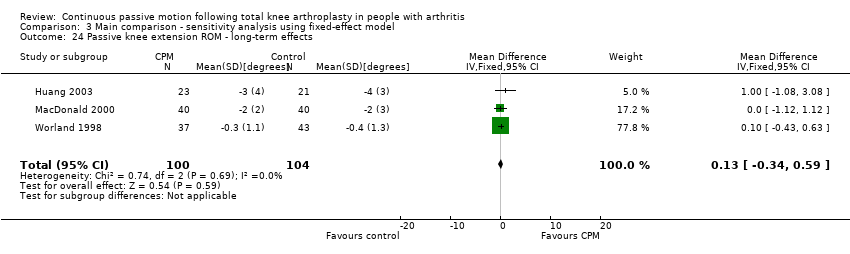
Comparison 3 Main comparison ‐ sensitivity analysis using fixed‐effect model, Outcome 24 Passive knee extension ROM ‐ long‐term effects.
![Comparison 3 Main comparison ‐ sensitivity analysis using fixed‐effect model, Outcome 25 Quadriceps strength ‐ short‐term effects [standardised mean].](/es/cdsr/doi/10.1002/14651858.CD004260.pub3/media/CDSR/CD004260/image_n/nCD004260-CMP-003-25.png)
Comparison 3 Main comparison ‐ sensitivity analysis using fixed‐effect model, Outcome 25 Quadriceps strength ‐ short‐term effects [standardised mean].

Comparison 3 Main comparison ‐ sensitivity analysis using fixed‐effect model, Outcome 26 Length of hospital stay.

Comparison 3 Main comparison ‐ sensitivity analysis using fixed‐effect model, Outcome 27 Swelling ‐ short‐term effects.
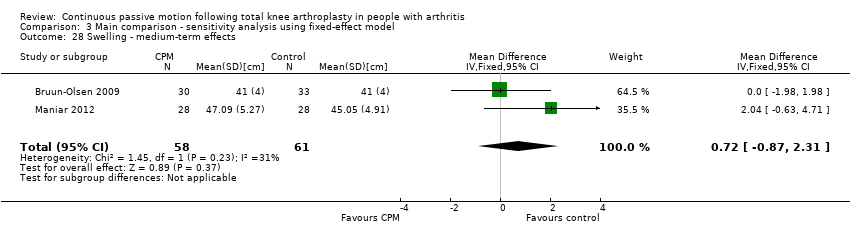
Comparison 3 Main comparison ‐ sensitivity analysis using fixed‐effect model, Outcome 28 Swelling ‐ medium‐term effects.
| Primary comparison for continuous passive motion (CPM) versus no CPM | ||||||
| Patient or population: hospitalised patients who have undergone knee replacement surgery | ||||||
| Outcomes | Illustrative comparative risks* (95% CI) | Relative effect | No of participants | Quality of the evidence | Comments | |
| Assumed risk | Corresponding risk | |||||
| Control | Primary comparison | |||||
| Active knee flexion ROM | The mean active knee flexion ROM in the control groups was | The mean active knee flexion ROM in the intervention groups was | ‐ | 470 | ⊕⊕⊕⊝ | Absolute risk difference 2% (0 to 4); relative percent change 0% (2 to 5); not statistically significant2 |
| Pain | The mean pain in the control groups was | The mean pain in the intervention groups was | ‐ | 414 | ⊕⊕⊝⊝ | Absolute risk difference ‐4% (‐8 to 1); relative percent change ‐80% (‐36 to 8); not statistically significant5 |
| Function | The mean function in the control groups was | The mean function in the intervention groups was | ‐ | 405 | ⊕⊕⊕⊝ | SMD ‐0.1 (‐0.3 to 0.1); absolute risk difference ‐2% (‐5 to 2); relative percent change ‐4 (‐12 to 5)8 |
| Quality of life | The mean quality of life in the control groups was | The mean quality of life in the intervention groups was | 156 | ⊕⊕⊕⊝ | Absolute risk difference 1% (‐3 to 4) ; Relative percent change ‐8% (‐8 to 13); non‐statistically significant9 | |
| Participants' global assessment of treatment effectiveness | See comment | See comment | Not estimable | 211 | ⊕⊝⊝⊝ | Not estimable12 |
| Manipulation under anaesthesia | 72 per 1000 | 25 per 1000 | RR 0.34 | 581 | ⊕⊝⊝⊝ | Absolute risk difference ‐4% (‐8 to 0); relative percent decrease ‐67% (‐87 to 11); NNTB 21 (16 to 126) |
| Adverse events | 163 per 1000 | 150 per 1000 | RR 0.92 | 1040 | ⊕⊕⊝⊝ | Absolute risk difference ‐1% (‐5 to 3); relative percent decrease ‐9% (‐37 to 33); not statistically significant |
| *The basis for the assumed risk (e.g. the median control group risk across studies) is provided in footnotes. The corresponding risk (and its 95% confidence interval) is based on the assumed risk in the comparison group and the relative effect of the intervention (and its 95% CI). | ||||||
| GRADE Working Group grades of evidence | ||||||
| 1 The methodological quality of at least some of the included trials were susceptible to bias. | ||||||
| Database name, platform and time span | Update search date | Number of results |
| The Cochrane Library, Issue 12, December 2012 from database inception | January 2009 to 24 January 2013 | 1 |
| MEDLINE(R) Ovid 1966 to January week 3 2013 and MEDLINE(R) Ovid In‐Process & Other Non‐Indexed Citations 23 January 2013 | January 2009 to 24 January 2013 | 126 |
| EMBASE Ovid 1980 to 2013 week 3 | January 2009 to 24 January 2013 | 146 |
| EBSCOhost CINAHL 1981 to 23 January 2013 | January 2009 to 24 January 2013 | 1 |
| AMED Ovid (Allied and Complementary Medicine Database) 1985 to January 2013 | January 2009 to 24 January 2013 | 140 |
| Physiotherapy Evidence Database (PEDro) | January 2009 to 24 January 2013 | 1 |
| ‐ | TOTAL | 415 |
| ‐ | Total AFTER duplicates removed | 4 |
| Outcome or subgroup title | No. of studies | No. of participants | Statistical method | Effect size |
| 1 Active knee flexion ROM ‐ short‐term effects Show forest plot | 10 | 470 | Mean Difference (IV, Random, 95% CI) | 2.40 [‐0.22, 5.03] |
| 2 Active knee flexion ROM ‐ medium‐term effects Show forest plot | 4 | Mean Difference (IV, Random, 95% CI) | Totals not selected | |
| 3 Active knee flexion ROM ‐ long‐term effects Show forest plot | 3 | 132 | Mean Difference (IV, Random, 95% CI) | 2.85 [‐1.16, 6.87] |
| 4 Pain ‐ short‐term effects Show forest plot | 8 | 414 | Mean Difference (IV, Random, 95% CI) | ‐0.38 [‐0.84, 0.08] |
| 5 Pain ‐ medium‐term effects Show forest plot | 3 | 179 | Mean Difference (IV, Random, 95% CI) | 0.26 [‐0.41, 0.94] |
| 6 Pain ‐ long‐term effects Show forest plot | 1 | Mean Difference (IV, Random, 95% CI) | Totals not selected | |
| 7 Function ‐ short‐term effects [standardised mean] Show forest plot | 4 | Std. Mean Difference (IV, Random, 95% CI) | Totals not selected | |
| 8 Function ‐ medium‐term effects [standardised mean] Show forest plot | 6 | 405 | Std. Mean Difference (IV, Random, 95% CI) | ‐0.08 [‐0.27, 0.12] |
| 9 Function ‐ long‐term effects [standardised mean] Show forest plot | 4 | 288 | Std. Mean Difference (IV, Random, 95% CI) | 0.02 [‐0.22, 0.25] |
| 10 Quality of life ‐ medium‐term effects Show forest plot | 2 | 156 | Mean Difference (IV, Random, 95% CI) | 0.75 [‐2.58, 4.08] |
| 11 Quality of life ‐ long‐term effects Show forest plot | 1 | 100 | Mean Difference (IV, Fixed, 95% CI) | 2.20 [‐3.90, 8.30] |
| 12 Participants' global assessment of treatment effectiveness ‐ short‐term effects [points] Show forest plot | 3 | Std. Mean Difference (IV, Random, 95% CI) | Totals not selected | |
| 13 Participants' global assessment of treatment effectiveness ‐ medium‐term effects Show forest plot | 1 | 60 | Mean Difference (IV, Random, 95% CI) | ‐0.30 [‐0.74, 0.14] |
| 14 Manipulation under anaesthesia [number] Show forest plot | 8 | 581 | Risk Ratio (M‐H, Random, 95% CI) | 0.34 [0.13, 0.89] |
| 15 Adverse events [number] Show forest plot | 16 | 1040 | Risk Ratio (M‐H, Random, 95% CI) | 0.92 [0.63, 1.33] |
| 16 Passive knee flexion ROM ‐ short‐term effects Show forest plot | 11 | 697 | Mean Difference (IV, Random, 95% CI) | 2.03 [0.21, 3.86] |
| 17 Passive knee flexion ROM ‐ medium‐term effects Show forest plot | 4 | 264 | Mean Difference (IV, Random, 95% CI) | ‐1.85 [‐5.25, 1.55] |
| 18 Passive knee flexion ROM ‐ long‐term effects Show forest plot | 2 | 160 | Mean Difference (IV, Random, 95% CI) | 0.06 [‐2.22, 2.35] |
| 19 Active knee extension ROM ‐ short‐term effects Show forest plot | 11 | 574 | Mean Difference (IV, Random, 95% CI) | 0.85 [‐0.36, 2.06] |
| 20 Active knee extension ROM ‐ medium‐term effects Show forest plot | 4 | 195 | Mean Difference (IV, Random, 95% CI) | 0.77 [‐0.78, 2.31] |
| 21 Active knee extension ROM ‐ long‐term effects Show forest plot | 2 | 108 | Mean Difference (IV, Random, 95% CI) | 0.06 [‐0.06, 0.18] |
| 22 Passive knee extension ROM ‐ short‐term effects Show forest plot | 11 | 629 | Mean Difference (IV, Random, 95% CI) | 0.64 [‐0.26, 1.55] |
| 23 Passive knee extension ROM ‐ medium‐term effects Show forest plot | 4 | Mean Difference (IV, Random, 95% CI) | Totals not selected | |
| 24 Passive knee extension ROM ‐ long‐term effects Show forest plot | 3 | 204 | Mean Difference (IV, Random, 95% CI) | 0.13 [‐0.34, 0.59] |
| 25 Length of hospital stay Show forest plot | 10 | 614 | Mean Difference (IV, Random, 95% CI) | ‐0.44 [‐1.03, 0.16] |
| 26 Swelling ‐ short‐term effects Show forest plot | 5 | Mean Difference (IV, Random, 95% CI) | Totals not selected | |
| 27 Swelling ‐ medium‐term effects Show forest plot | 2 | 119 | Mean Difference (IV, Random, 95% CI) | 0.82 [‐1.14, 2.77] |
| 28 Quadriceps strength ‐ short‐term effects [standardised mean] Show forest plot | 2 | 130 | Std. Mean Difference (IV, Random, 95% CI) | 0.27 [‐0.08, 0.61] |
| Outcome or subgroup title | No. of studies | No. of participants | Statistical method | Effect size |
| 1 Active knee flexion ROM Show forest plot | 1 | Mean Difference (IV, Random, 95% CI) | Totals not selected | |
| 1.1 Short‐term effects (< 6 wk) | 1 | Mean Difference (IV, Random, 95% CI) | 0.0 [0.0, 0.0] | |
| 2 Passive knee flexion ROM Show forest plot | 3 | Mean Difference (IV, Random, 95% CI) | Subtotals only | |
| 2.1 Short‐term effects (< 6 wk) | 3 | 240 | Mean Difference (IV, Random, 95% CI) | 1.14 [‐1.09, 3.38] |
| 2.2 Medium‐term effects (6 wk to 6 mo) | 1 | 80 | Mean Difference (IV, Random, 95% CI) | 0.10 [‐4.11, 4.31] |
| 2.3 Long‐term effects (> 6 mo) | 1 | 80 | Mean Difference (IV, Random, 95% CI) | ‐0.5 [‐3.40, 2.40] |
| 3 Active knee extension ROM Show forest plot | 2 | Mean Difference (IV, Random, 95% CI) | Totals not selected | |
| 3.1 Short‐term effects (< 6 wk) | 1 | Mean Difference (IV, Random, 95% CI) | 0.0 [0.0, 0.0] | |
| 3.2 Long‐term effects (> 6 mo) | 1 | Mean Difference (IV, Random, 95% CI) | 0.0 [0.0, 0.0] | |
| 4 Passive knee extension ROM Show forest plot | 3 | Mean Difference (IV, Random, 95% CI) | Totals not selected | |
| 4.1 Short‐term effects (< 6 wk) | 3 | Mean Difference (IV, Random, 95% CI) | 0.0 [0.0, 0.0] | |
| 4.2 Medium‐term effects (6 wk to 6 mo) | 1 | Mean Difference (IV, Random, 95% CI) | 0.0 [0.0, 0.0] | |
| 4.3 Long‐term effects (> 6 mo) | 1 | Mean Difference (IV, Random, 95% CI) | 0.0 [0.0, 0.0] | |
| 5 Length of hospital stay Show forest plot | 1 | Mean Difference (IV, Random, 95% CI) | Subtotals only | |
| 6 Function Show forest plot | 2 | Std. Mean Difference (IV, Random, 95% CI) | Totals not selected | |
| 6.1 Short‐term effect (< 6 wk) | 1 | Std. Mean Difference (IV, Random, 95% CI) | 0.0 [0.0, 0.0] | |
| 6.2 Medium‐term effects (6 wk to 6 mo) | 1 | Std. Mean Difference (IV, Random, 95% CI) | 0.0 [0.0, 0.0] | |
| 6.3 Long‐term effects (> 6 mo) | 1 | Std. Mean Difference (IV, Random, 95% CI) | 0.0 [0.0, 0.0] | |
| 7 Pain Show forest plot | 2 | Std. Mean Difference (IV, Random, 95% CI) | Totals not selected | |
| 7.1 Short‐term effects (6 wk to 6 mo) | 2 | Std. Mean Difference (IV, Random, 95% CI) | 0.0 [0.0, 0.0] | |
| 8 Swelling Show forest plot | 2 | Mean Difference (IV, Random, 95% CI) | Totals not selected | |
| 8.1 Short‐term effects (6 wk to 6 mo) | 2 | Mean Difference (IV, Random, 95% CI) | 0.0 [0.0, 0.0] | |
| Outcome or subgroup title | No. of studies | No. of participants | Statistical method | Effect size |
| 1 Active knee flexion ROM ‐ short‐term effects Show forest plot | 10 | 470 | Mean Difference (IV, Fixed, 95% CI) | 2.29 [0.39, 4.20] |
| 2 Active knee flexion ROM ‐ medium‐term effects Show forest plot | 4 | Mean Difference (IV, Fixed, 95% CI) | Totals not selected | |
| 3 Active knee flexion ROM ‐ long‐term effects Show forest plot | 3 | 132 | Mean Difference (IV, Fixed, 95% CI) | 4.12 [2.22, 6.02] |
| 4 Pain ‐ short‐term effects Show forest plot | 8 | 414 | Mean Difference (IV, Fixed, 95% CI) | ‐0.14 [‐0.34, 0.05] |
| 5 Pain ‐ medium‐term effects Show forest plot | 3 | 179 | Mean Difference (IV, Fixed, 95% CI) | 0.04 [‐0.10, 0.18] |
| 6 Pain ‐ long‐term effects Show forest plot | 1 | Mean Difference (IV, Fixed, 95% CI) | Totals not selected | |
| 7 Function ‐ short‐term effects [standardised mean] Show forest plot | 4 | Std. Mean Difference (IV, Fixed, 95% CI) | Totals not selected | |
| 8 Function ‐ medium‐term effects [standardised mean] Show forest plot | 6 | 405 | Std. Mean Difference (IV, Fixed, 95% CI) | ‐0.08 [‐0.27, 0.12] |
| 9 Function ‐ long‐term effects [standardised mean] Show forest plot | 4 | 288 | Std. Mean Difference (IV, Fixed, 95% CI) | 0.02 [‐0.22, 0.25] |
| 10 Quality of life ‐ medium‐term effects Show forest plot | 2 | 156 | Mean Difference (IV, Fixed, 95% CI) | 0.75 [‐2.58, 4.08] |
| 11 Quality of life ‐ long‐term effects [points] Show forest plot | 1 | 100 | Mean Difference (IV, Fixed, 95% CI) | 2.20 [‐3.90, 8.30] |
| 12 Participants' global assessment of treatment effectiveness ‐ short‐term effects [points] Show forest plot | 3 | Std. Mean Difference (IV, Fixed, 95% CI) | Totals not selected | |
| 13 Participants' global assessment of treatment effectiveness ‐ medium‐term effects Show forest plot | 1 | 60 | Mean Difference (IV, Fixed, 95% CI) | ‐0.30 [‐0.74, 0.14] |
| 14 Manipulation under anaesthesia [number] Show forest plot | 8 | 581 | Risk Ratio (M‐H, Fixed, 95% CI) | 0.26 [0.11, 0.64] |
| 15 Adverse events [number] Show forest plot | 16 | 1040 | Risk Ratio (M‐H, Fixed, 95% CI) | 0.95 [0.75, 1.21] |
| 16 Passive knee flexion ROM ‐ short‐term effects Show forest plot | 11 | 697 | Mean Difference (IV, Fixed, 95% CI) | 2.01 [0.50, 3.52] |
| 17 Passive knee flexion ROM ‐ medium‐term effects Show forest plot | 4 | 264 | Mean Difference (IV, Fixed, 95% CI) | ‐1.69 [‐4.46, 1.08] |
| 18 Passive knee flexion ROM ‐ long‐term effects Show forest plot | 2 | 160 | Mean Difference (IV, Fixed, 95% CI) | 0.06 [‐2.22, 2.35] |
| 19 Active knee extension ROM ‐ short‐term effects Show forest plot | 11 | 574 | Mean Difference (IV, Fixed, 95% CI) | 1.18 [0.33, 2.02] |
| 20 Active knee extension ROM ‐ medium‐term effects Show forest plot | 4 | 195 | Mean Difference (IV, Fixed, 95% CI) | 0.74 [‐0.45, 1.92] |
| 21 Active knee extension ROM ‐ long‐term effects Show forest plot | 2 | 108 | Mean Difference (IV, Fixed, 95% CI) | 0.06 [‐0.06, 0.18] |
| 22 Passive knee extension ROM ‐ short‐term effects Show forest plot | 11 | 629 | Mean Difference (IV, Fixed, 95% CI) | 0.44 [‐0.12, 1.00] |
| 23 Passive knee extension ROM ‐ medium‐term effects Show forest plot | 4 | Mean Difference (IV, Fixed, 95% CI) | Totals not selected | |
| 24 Passive knee extension ROM ‐ long‐term effects Show forest plot | 3 | 204 | Mean Difference (IV, Fixed, 95% CI) | 0.13 [‐0.34, 0.59] |
| 25 Quadriceps strength ‐ short‐term effects [standardised mean] Show forest plot | 2 | 130 | Std. Mean Difference (IV, Fixed, 95% CI) | 0.27 [‐0.08, 0.61] |
| 26 Length of hospital stay Show forest plot | 10 | 614 | Mean Difference (IV, Fixed, 95% CI) | ‐0.20 [‐0.58, 0.19] |
| 27 Swelling ‐ short‐term effects Show forest plot | 5 | Mean Difference (IV, Fixed, 95% CI) | Totals not selected | |
| 28 Swelling ‐ medium‐term effects Show forest plot | 2 | 119 | Mean Difference (IV, Fixed, 95% CI) | 0.72 [‐0.87, 2.31] |