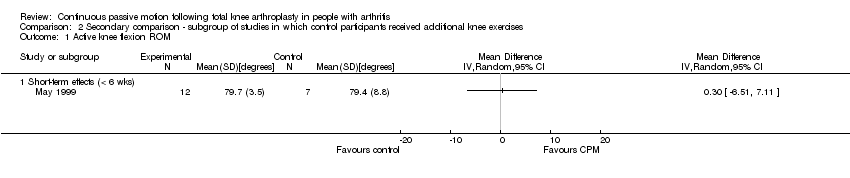
| 1 Active knee flexion ROM Show forest plot | 9 | | Mean Difference (IV, Random, 95% CI) | Subtotals only |
|
| 1.1 Short‐term effects (< 6 wks) | 8 | 379 | Mean Difference (IV, Random, 95% CI) | 3.08 [‐0.10, 6.25] |
| 1.2 Medium‐term effects (6 wks to 6 mo) | 2 | 104 | Mean Difference (IV, Random, 95% CI) | 2.86 [‐5.29, 11.00] |
| 1.3 Long‐term effects (> 6 mo) | 2 | 104 | Mean Difference (IV, Random, 95% CI) | 4.86 [2.83, 6.89] |
| 2 Passive knee flexion ROM Show forest plot | 11 | | Mean Difference (IV, Random, 95% CI) | Subtotals only |
|
| 2.1 Short‐term effects (< 6 wks) | 9 | 551 | Mean Difference (IV, Random, 95% CI) | 2.46 [0.39, 4.52] |
| 2.2 Medium‐term effects (6 wks to 6 mo) | 3 | 201 | Mean Difference (IV, Random, 95% CI) | ‐1.51 [‐5.73, 2.72] |
| 2.3 Long‐term effects (> 6 mo) | 2 | 160 | Mean Difference (IV, Random, 95% CI) | 0.06 [‐2.22, 2.35] |
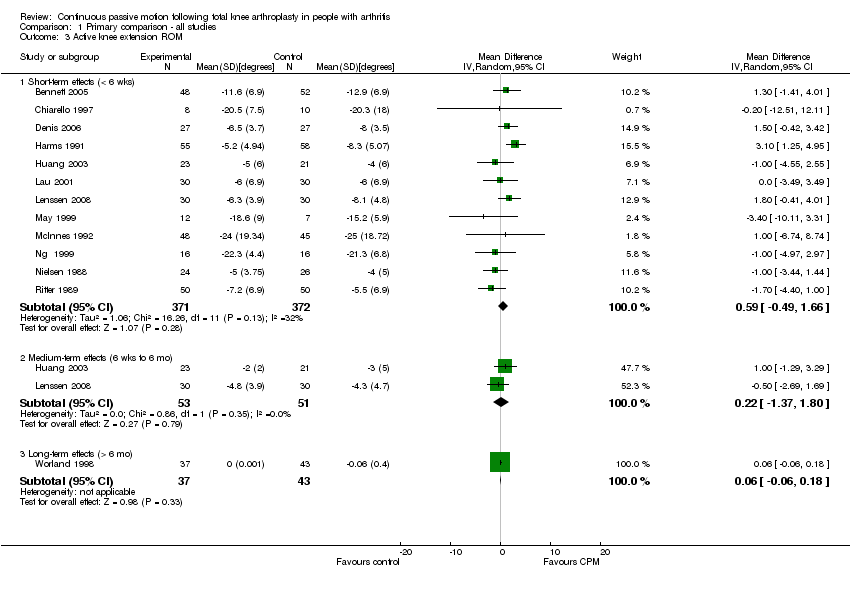
| 3 Active knee extension ROM Show forest plot | 13 | | Mean Difference (IV, Random, 95% CI) | Subtotals only |
|
| 3.1 Short‐term effects (< 6 wks) | 12 | 743 | Mean Difference (IV, Random, 95% CI) | 0.59 [‐0.49, 1.66] |
| 3.2 Medium‐term effects (6 wks to 6 mo) | 2 | 104 | Mean Difference (IV, Random, 95% CI) | 0.22 [‐1.37, 1.80] |
| 3.3 Long‐term effects (> 6 mo) | 1 | 80 | Mean Difference (IV, Random, 95% CI) | 0.06 [‐0.06, 0.18] |
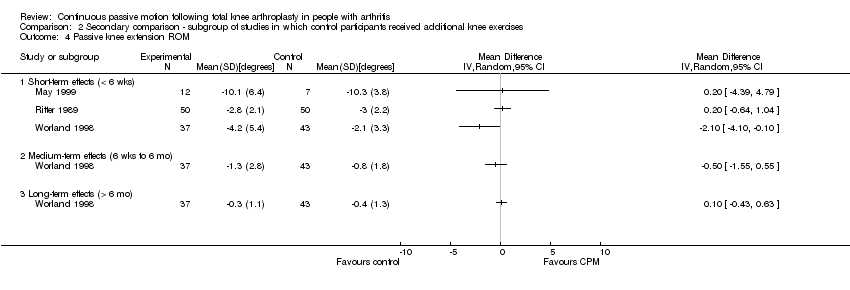
| 4 Passive knee extension ROM Show forest plot | 14 | | Mean Difference (IV, Random, 95% CI) | Subtotals only |
|
| 4.1 Short‐term effects (< 6 wks) | 13 | 749 | Mean Difference (IV, Random, 95% CI) | 0.32 [‐0.46, 1.10] |
| 4.2 Medium‐term effects (6 wks to 6 mo) | 3 | 165 | Mean Difference (IV, Random, 95% CI) | ‐0.70 [‐2.50, 1.11] |
| 4.3 Long‐term effects (> 6 mo) | 3 | 204 | Mean Difference (IV, Random, 95% CI) | 0.13 [‐0.34, 0.59] |
| 5 Length of hospital stay Show forest plot | 12 | 748 | Mean Difference (IV, Random, 95% CI) | ‐0.34 [‐0.85, 0.17] |
|
| 6 Function [standardised mean] Show forest plot | 8 | | Std. Mean Difference (IV, Random, 95% CI) | Subtotals only |
|
| 6.1 Short‐term effects (6 wks to 6 mo) | 4 | 171 | Std. Mean Difference (IV, Random, 95% CI) | 0.10 [‐0.50, 0.70] |
| 6.2 Medium‐term effects (6 wks to 6 mo) | 4 | 286 | Std. Mean Difference (IV, Random, 95% CI) | ‐0.04 [‐0.27, 0.19] |
| 6.3 Long‐term effects (> 6 mo) | 3 | 260 | Std. Mean Difference (IV, Random, 95% CI) | ‐0.02 [‐0.26, 0.23] |
| 7 Manipulation under anaesthesia [number] Show forest plot | 3 | 234 | Risk Ratio (M‐H, Random, 95% CI) | 0.15 [0.03, 0.70] |
|
| 8 Pain Show forest plot | 6 | | Mean Difference (IV, Random, 95% CI) | Totals not selected |
|
| 8.1 Short‐term effects (< 6 wks) | 6 | | Mean Difference (IV, Random, 95% CI) | 0.0 [0.0, 0.0] |
| 8.2 Medium‐term effects (6 wks to 6 mo) | 1 | | Mean Difference (IV, Random, 95% CI) | 0.0 [0.0, 0.0] |
| 9 Swelling Show forest plot | 2 | | Mean Difference (IV, Random, 95% CI) | Totals not selected |
|
| 9.1 Short‐term effects (6wks to 6mo) | 2 | | Mean Difference (IV, Random, 95% CI) | 0.0 [0.0, 0.0] |
| 10 Quadriceps strength [standardised mean] Show forest plot | 2 | | Std. Mean Difference (IV, Random, 95% CI) | Subtotals only |
|
| 10.1 Short‐term effects (6 wks to 6 mo) group | 2 | 130 | Std. Mean Difference (IV, Random, 95% CI) | 0.27 [‐0.08, 0.61] |

![Forest plot of primary comparison. Outcome: 7.1 Active knee flexion ROM [degrees].](/es/cdsr/doi/10.1002/14651858.CD004260.pub2/media/CDSR/CD004260/rel0002/CD004260/image_n/nCD004260-AFig-FIG01.png)
![Forest plot of primary comparison. Outcome: 7.2 Passive knee flexion ROM [degrees].](/es/cdsr/doi/10.1002/14651858.CD004260.pub2/media/CDSR/CD004260/rel0002/CD004260/image_n/nCD004260-AFig-FIG02.png)
![Forest plot of primary comparison. Outcome: 7.3 Active knee extension ROM [degrees]. The SD of the CPM group for Worland 1998 was zero but entered as 0.001 to enable calculation of a point estimate.](/es/cdsr/doi/10.1002/14651858.CD004260.pub2/media/CDSR/CD004260/rel0002/CD004260/image_n/nCD004260-AFig-FIG03.png)
![Forest plot of primary comparison. Outcome: 7.4 Passive knee extension ROM [degrees].](/es/cdsr/doi/10.1002/14651858.CD004260.pub2/media/CDSR/CD004260/rel0002/CD004260/image_n/nCD004260-AFig-FIG04.png)
![Forest plot of primary comparison. Outcome: 7.6 Length of hospital stay [days].](/es/cdsr/doi/10.1002/14651858.CD004260.pub2/media/CDSR/CD004260/rel0002/CD004260/image_n/nCD004260-AFig-FIG05.png)
![Forest plot of primary comparison. Outcome: 7.11 Function [standardised mean].](/es/cdsr/doi/10.1002/14651858.CD004260.pub2/media/CDSR/CD004260/rel0002/CD004260/image_n/nCD004260-AFig-FIG06.png)
![Forest plot of primary comparison. Outcome: 7.7 Manipulation under anaesthesia [number].](/es/cdsr/doi/10.1002/14651858.CD004260.pub2/media/CDSR/CD004260/rel0002/CD004260/image_n/nCD004260-AFig-FIG07.png)
![Forest plot of primary comparison. Outcome: 7.8 Pain [points].](/es/cdsr/doi/10.1002/14651858.CD004260.pub2/media/CDSR/CD004260/rel0002/CD004260/image_n/nCD004260-AFig-FIG08.png)
![Forest plot of primary comparison. Outcome: 7.9 Swelling [cm].](/es/cdsr/doi/10.1002/14651858.CD004260.pub2/media/CDSR/CD004260/rel0002/CD004260/image_n/nCD004260-AFig-FIG09.png)
![Forest plot of primary comparison. Outcome: 7.10 Quadricep strength [standardised mean].](/es/cdsr/doi/10.1002/14651858.CD004260.pub2/media/CDSR/CD004260/rel0002/CD004260/image_n/nCD004260-AFig-FIG10.png)


![Comparison 1 Primary comparison ‐ all studies, Outcome 6 Function [standardised mean].](/es/cdsr/doi/10.1002/14651858.CD004260.pub2/media/CDSR/CD004260/rel0002/CD004260/image_n/nCD004260-CMP-001-06.png)
![Comparison 1 Primary comparison ‐ all studies, Outcome 7 Manipulation under anaesthesia [number].](/es/cdsr/doi/10.1002/14651858.CD004260.pub2/media/CDSR/CD004260/rel0002/CD004260/image_n/nCD004260-CMP-001-07.png)


![Comparison 1 Primary comparison ‐ all studies, Outcome 10 Quadriceps strength [standardised mean].](/es/cdsr/doi/10.1002/14651858.CD004260.pub2/media/CDSR/CD004260/rel0002/CD004260/image_n/nCD004260-CMP-001-10.png)