Scolaris Content Display Scolaris Content Display

Comparison 1 No. Patients with at least 50% pain relief, Outcome 1 Naproxen sodium 550 mg.
Figuras y tablas -
Analysis 1.1

Comparison 1 No. Patients with at least 50% pain relief, Outcome 1 Naproxen sodium 550 mg.

Comparison 1 No. Patients with at least 50% pain relief, Outcome 2 Naproxen/naproxen sodium 400/440 mg.
Figuras y tablas -
Analysis 1.2

Comparison 1 No. Patients with at least 50% pain relief, Outcome 2 Naproxen/naproxen sodium 400/440 mg.

Comparison 1 No. Patients with at least 50% pain relief, Outcome 3 Naproxen/naproxen sodium 200/220 mg.
Figuras y tablas -
Analysis 1.3

Comparison 1 No. Patients with at least 50% pain relief, Outcome 3 Naproxen/naproxen sodium 200/220 mg.

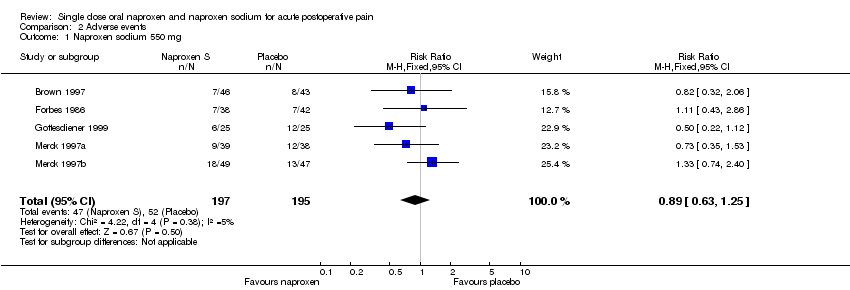
Comparison 2 Adverse events, Outcome 1 Naproxen sodium 550 mg.
Figuras y tablas -
Analysis 2.1

Comparison 2 Adverse events, Outcome 1 Naproxen sodium 550 mg.

Comparison 2 Adverse events, Outcome 2 Naproxen/naproxen sodium 400/440 mg.
Figuras y tablas -
Analysis 2.2

Comparison 2 Adverse events, Outcome 2 Naproxen/naproxen sodium 400/440 mg.

Comparison 2 Adverse events, Outcome 3 Naproxen/naproxen sodium 200/220 mg.
Figuras y tablas -
Analysis 2.3

Comparison 2 Adverse events, Outcome 3 Naproxen/naproxen sodium 200/220 mg.

Comparison 1. No. Patients with at least 50% pain relief

Outcome or subgroup title

No. of studies

No. of participants

Statistical method

Effect size

1 Naproxen sodium 550 mg Show forest plot

6

500

Risk Ratio (M‐H, Fixed, 95% CI)

4.18 [2.93, 5.97]

2 Naproxen/naproxen sodium 400/440 mg Show forest plot

3

334

Risk Ratio (M‐H, Fixed, 95% CI)

4.80 [2.75, 8.38]

3 Naproxen/naproxen sodium 200/220 mg Show forest plot

2

202

Risk Ratio (M‐H, Fixed, 95% CI)

2.87 [1.60, 5.15]

Figuras y tablas -
Comparison 1. No. Patients with at least 50% pain relief
Comparison 2. Adverse events

Outcome or subgroup title

No. of studies

No. of participants

Statistical method

Effect size

1 Naproxen sodium 550 mg Show forest plot

5

392

Risk Ratio (M‐H, Fixed, 95% CI)

0.89 [0.63, 1.25]

2 Naproxen/naproxen sodium 400/440 mg Show forest plot

2

257

Risk Ratio (M‐H, Fixed, 95% CI)

1.32 [0.78, 2.24]

3 Naproxen/naproxen sodium 200/220 mg Show forest plot

1

122

Risk Ratio (M‐H, Fixed, 95% CI)

2.21 [0.90, 5.43]

Figuras y tablas -
Comparison 2. Adverse events