Scolaris Content Display Scolaris Content Display

Flow diagram.
Figuras y tablas -
Figure 1

Flow diagram.

'Risk of bias' graph: review authors' judgements about each risk of bias item presented as percentages across all included studies.
Figuras y tablas -
Figure 2

'Risk of bias' graph: review authors' judgements about each risk of bias item presented as percentages across all included studies.

'Risk of bias' summary: review authors' judgements about each risk of bias item for each included study.
Figuras y tablas -
Figure 3

'Risk of bias' summary: review authors' judgements about each risk of bias item for each included study.

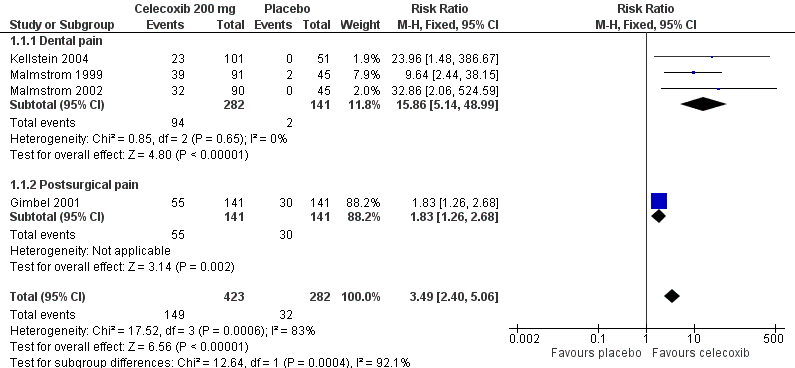
Forest plot of comparison: 1 Celecoxib 200 mg versus placebo, outcome: 1.1 At least 50% pain relief over 4‐6 hours.
Figuras y tablas -
Figure 4

Forest plot of comparison: 1 Celecoxib 200 mg versus placebo, outcome: 1.1 At least 50% pain relief over 4‐6 hours.

L'Abbé plot of celecoxib 200 mg versus placebo for at least 50% pain relief. Size of circle is proportional to size of study (inset scale). Cream circles ‐ dental studies; pink circle ‐ orthopaedic study.
Figuras y tablas -
Figure 5

L'Abbé plot of celecoxib 200 mg versus placebo for at least 50% pain relief. Size of circle is proportional to size of study (inset scale). Cream circles ‐ dental studies; pink circle ‐ orthopaedic study.

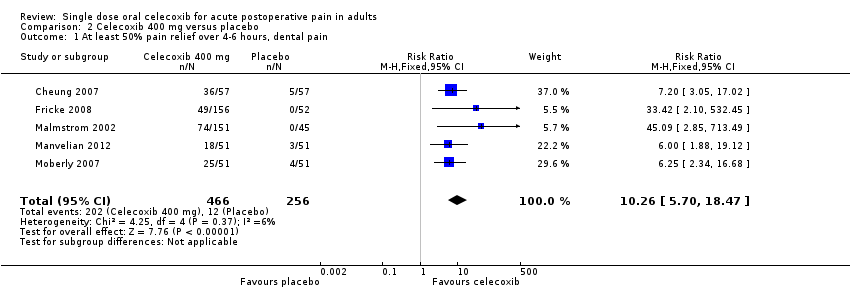
Forest plot of comparison: 2 Celecoxib 400 mg versus placebo, outcome: 2.1 At least 50% pain relief over 4‐6 hours dental pain.
Figuras y tablas -
Figure 6

Forest plot of comparison: 2 Celecoxib 400 mg versus placebo, outcome: 2.1 At least 50% pain relief over 4‐6 hours dental pain.

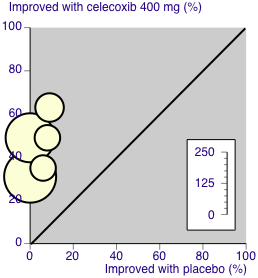
L'Abbé plot of celecoxib 400 mg versus placebo for at least 50% pain relief. Size of circle is proportional to size of study (inset scale). Cream circles ‐ dental studies
Figuras y tablas -
Figure 7

L'Abbé plot of celecoxib 400 mg versus placebo for at least 50% pain relief. Size of circle is proportional to size of study (inset scale). Cream circles ‐ dental studies

Comparison 1 Celecoxib 200 mg versus placebo, Outcome 1 At least 50% pain relief over 4‐6 hours.
Figuras y tablas -
Analysis 1.1

Comparison 1 Celecoxib 200 mg versus placebo, Outcome 1 At least 50% pain relief over 4‐6 hours.

Comparison 1 Celecoxib 200 mg versus placebo, Outcome 2 Use of rescue medication over 24 hours.
Figuras y tablas -
Analysis 1.2

Comparison 1 Celecoxib 200 mg versus placebo, Outcome 2 Use of rescue medication over 24 hours.

Comparison 1 Celecoxib 200 mg versus placebo, Outcome 3 Any adverse event.
Figuras y tablas -
Analysis 1.3

Comparison 1 Celecoxib 200 mg versus placebo, Outcome 3 Any adverse event.

Comparison 2 Celecoxib 400 mg versus placebo, Outcome 1 At least 50% pain relief over 4‐6 hours, dental pain.
Figuras y tablas -
Analysis 2.1

Comparison 2 Celecoxib 400 mg versus placebo, Outcome 1 At least 50% pain relief over 4‐6 hours, dental pain.

Comparison 2 Celecoxib 400 mg versus placebo, Outcome 2 Use of rescue medication over 24 hours.
Figuras y tablas -
Analysis 2.2

Comparison 2 Celecoxib 400 mg versus placebo, Outcome 2 Use of rescue medication over 24 hours.

Comparison 2 Celecoxib 400 mg versus placebo, Outcome 3 Any adverse event.
Figuras y tablas -
Analysis 2.3

Comparison 2 Celecoxib 400 mg versus placebo, Outcome 3 Any adverse event.

Comparison 1. Celecoxib 200 mg versus placebo

Outcome or subgroup title

No. of studies

No. of participants

Statistical method

Effect size

1 At least 50% pain relief over 4‐6 hours Show forest plot

4

705

Risk Ratio (M‐H, Fixed, 95% CI)

3.49 [2.40, 5.06]

1.1 Dental pain

3

423

Risk Ratio (M‐H, Fixed, 95% CI)

15.86 [5.14, 48.99]

1.2 Postsurgical pain

1

282

Risk Ratio (M‐H, Fixed, 95% CI)

1.83 [1.26, 2.68]

2 Use of rescue medication over 24 hours Show forest plot

2

271

Risk Ratio (IV, Fixed, 95% CI)

0.78 [0.70, 0.86]

3 Any adverse event Show forest plot

4

669

Risk Ratio (M‐H, Fixed, 95% CI)

0.90 [0.63, 1.29]

3.1 Dental

3

387

Risk Ratio (M‐H, Fixed, 95% CI)

0.97 [0.63, 1.49]

3.2 Orthopaedic

1

282

Risk Ratio (M‐H, Fixed, 95% CI)

0.8 [0.43, 1.48]

Figuras y tablas -
Comparison 1. Celecoxib 200 mg versus placebo
Comparison 2. Celecoxib 400 mg versus placebo

Outcome or subgroup title

No. of studies

No. of participants

Statistical method

Effect size

1 At least 50% pain relief over 4‐6 hours, dental pain Show forest plot

5

722

Risk Ratio (M‐H, Fixed, 95% CI)

10.26 [5.70, 18.47]

2 Use of rescue medication over 24 hours Show forest plot

3

518

Risk Ratio (IV, Fixed, 95% CI)

0.68 [0.62, 0.74]

3 Any adverse event Show forest plot

6

725

Risk Ratio (M‐H, Fixed, 95% CI)

1.00 [0.84, 1.17]

Figuras y tablas -
Comparison 2. Celecoxib 400 mg versus placebo