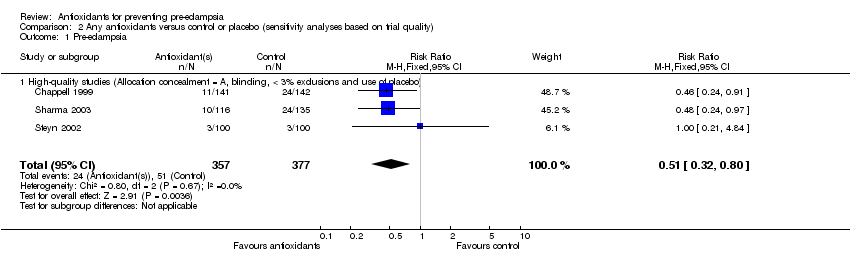
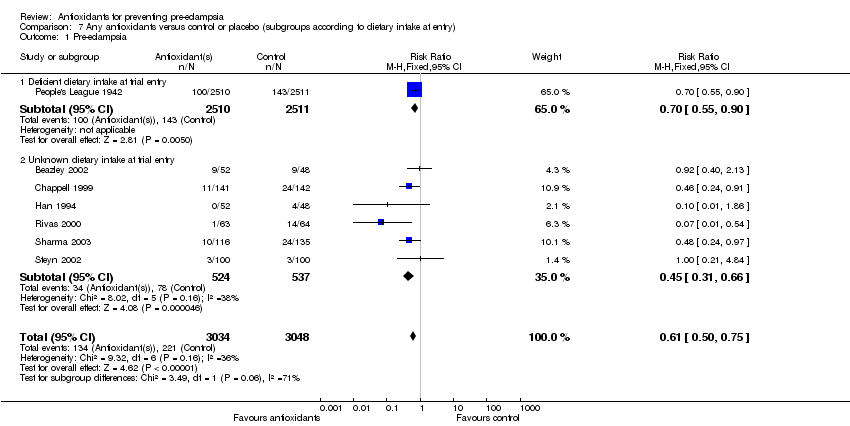
| 1 Pre‐eclampsia (subgroups by whether random or quasi‐random allocation) Show forest plot | 7 | 6082 | Risk Ratio (M‐H, Fixed, 95% CI) | 0.61 [0.50, 0.75] |
|
| 1.1 Studies with random allocation | 6 | 1061 | Risk Ratio (M‐H, Fixed, 95% CI) | 0.45 [0.31, 0.66] |
| 1.2 Studies with quasi‐random allocation | 1 | 5021 | Risk Ratio (M‐H, Fixed, 95% CI) | 0.70 [0.55, 0.90] |
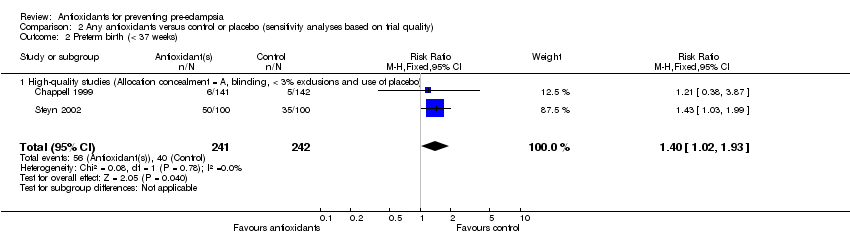
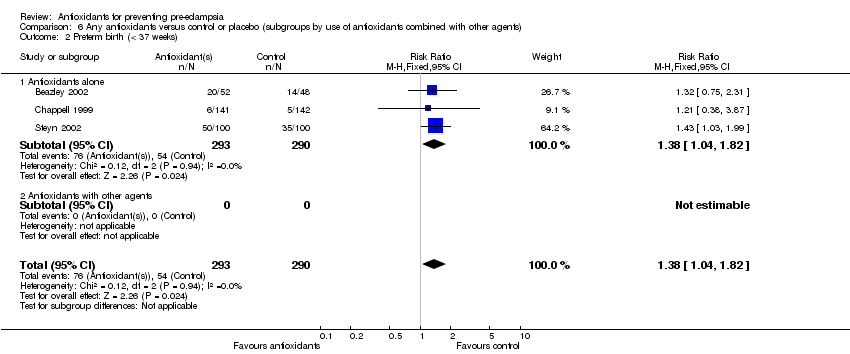
| 2 Preterm birth (< 37 weeks) Show forest plot | 3 | 583 | Risk Ratio (M‐H, Fixed, 95% CI) | 1.38 [1.04, 1.82] |
|
| 2.1 Studies with random allocation | 3 | 583 | Risk Ratio (M‐H, Fixed, 95% CI) | 1.38 [1.04, 1.82] |
| 2.2 Studies with quasi‐random allocation | 0 | 0 | Risk Ratio (M‐H, Fixed, 95% CI) | 0.0 [0.0, 0.0] |
| 3 Small‐for‐gestational age Show forest plot | 3 | 634 | Risk Ratio (M‐H, Fixed, 95% CI) | 0.64 [0.47, 0.87] |
|
| 3.1 Studies with random allocation | 3 | 634 | Risk Ratio (M‐H, Fixed, 95% CI) | 0.64 [0.47, 0.87] |
| 3.2 Studies with quasi‐random studies | 0 | 0 | Risk Ratio (M‐H, Fixed, 95% CI) | 0.0 [0.0, 0.0] |
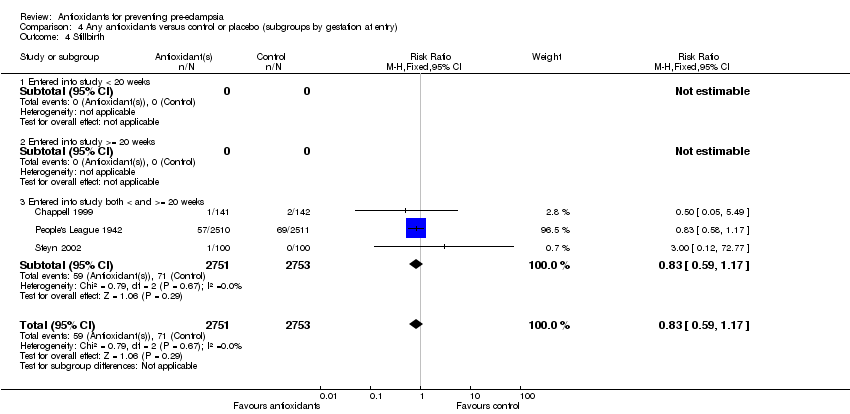
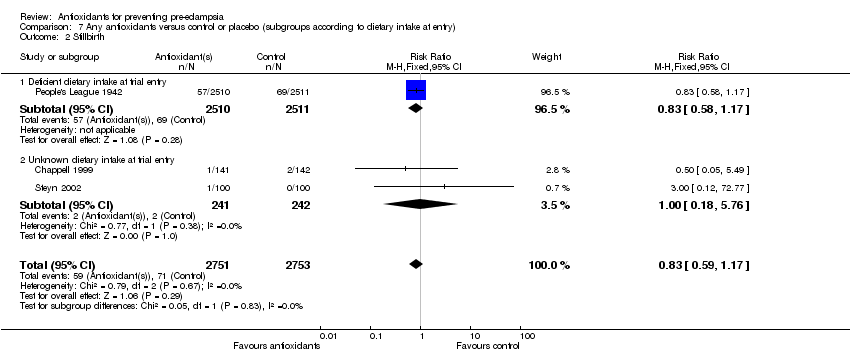
| 4 Stillbirth Show forest plot | 3 | 5504 | Risk Ratio (M‐H, Fixed, 95% CI) | 0.83 [0.59, 1.17] |
|
| 4.1 Studies with random allocation | 2 | 483 | Risk Ratio (M‐H, Fixed, 95% CI) | 1.00 [0.18, 5.76] |
| 4.2 Quasi‐random studies only | 1 | 5021 | Risk Ratio (M‐H, Fixed, 95% CI) | 0.83 [0.58, 1.17] |
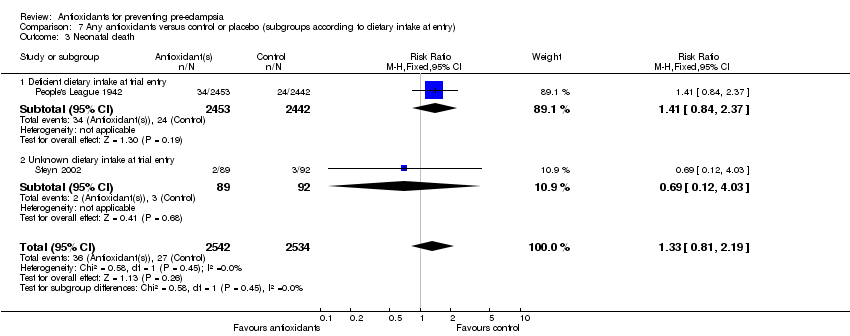
| 5 Neonatal death Show forest plot | 2 | 5076 | Risk Ratio (M‐H, Fixed, 95% CI) | 1.33 [0.81, 2.19] |
|
| 5.1 Studies with random allocation | 1 | 181 | Risk Ratio (M‐H, Fixed, 95% CI) | 0.69 [0.12, 4.03] |
| 5.2 Studies with quasi‐random allocation (death before 8 days) | 1 | 4895 | Risk Ratio (M‐H, Fixed, 95% CI) | 1.41 [0.84, 2.37] |
| 6 Elective delivery (induction of labour or elective caesarean section) Show forest plot | 1 | 200 | Risk Ratio (M‐H, Fixed, 95% CI) | 2.0 [0.51, 7.78] |
|
| 6.1 Induction of labour | 1 | 200 | Risk Ratio (M‐H, Fixed, 95% CI) | 2.0 [0.51, 7.78] |
| 7 Bleeding episodes (including placental abruption, APH, PPH, need for transfusion) Show forest plot | 2 | 483 | Risk Ratio (M‐H, Random, 95% CI) | 1.58 [0.08, 31.47] |
|
| 7.1 Studies with random allocation | 2 | 483 | Risk Ratio (M‐H, Random, 95% CI) | 1.58 [0.08, 31.47] |
| 7.2 Studies with quasi‐random allocation | 0 | 0 | Risk Ratio (M‐H, Random, 95% CI) | 0.0 [0.0, 0.0] |
| 8 Serious maternal morbidity (including eclampsia, liver and renal failure, DIC, stroke) Show forest plot | 1 | 251 | Risk Ratio (M‐H, Fixed, 95% CI) | 0.39 [0.02, 9.42] |
|
| 8.1 Eclampsia (studies with random allocation) | 1 | 251 | Risk Ratio (M‐H, Fixed, 95% CI) | 0.39 [0.02, 9.42] |
| 8.2 Eclampsia (studies with quasi‐random allocation) | 0 | 0 | Risk Ratio (M‐H, Fixed, 95% CI) | 0.0 [0.0, 0.0] |
| 9 Gestational age at birth Show forest plot | 2 | 351 | Mean Difference (IV, Fixed, 95% CI) | 1.01 [0.56, 1.46] |
|
| 9.1 Studies with random allocation | 2 | 351 | Mean Difference (IV, Fixed, 95% CI) | 1.01 [0.56, 1.46] |
| 9.2 Studies with quasi‐random allocation | 0 | 0 | Mean Difference (IV, Fixed, 95% CI) | 0.0 [0.0, 0.0] |
| 10 Birthweight Show forest plot | 3 | 451 | Mean Difference (IV, Fixed, 95% CI) | 91.83 [11.55, 172.11] |
|
| 10.1 Studies with random allocation | 3 | 451 | Mean Difference (IV, Fixed, 95% CI) | 91.83 [11.55, 172.11] |
| 10.2 Studies with quasi‐random allocation | 0 | 0 | Mean Difference (IV, Fixed, 95% CI) | 0.0 [0.0, 0.0] |
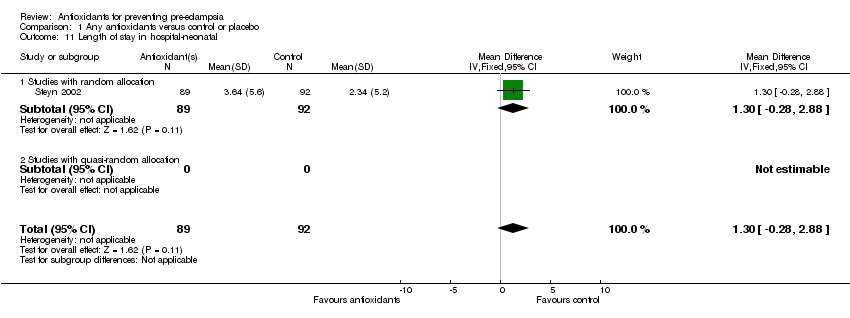
| 11 Length of stay in hospital‐neonatal Show forest plot | 1 | 181 | Mean Difference (IV, Fixed, 95% CI) | 1.30 [‐0.28, 2.88] |
|
| 11.1 Studies with random allocation | 1 | 181 | Mean Difference (IV, Fixed, 95% CI) | 1.30 [‐0.28, 2.88] |
| 11.2 Studies with quasi‐random allocation | 0 | 0 | Mean Difference (IV, Fixed, 95% CI) | 0.0 [0.0, 0.0] |