Scolaris Content Display Scolaris Content Display

Comparison 1 Corticosteroid vs IVIG alone, Outcome 1 Fetal/neonatal death.
Figuras y tablas -
Analysis 1.1

Comparison 1 Corticosteroid vs IVIG alone, Outcome 1 Fetal/neonatal death.

Comparison 1 Corticosteroid vs IVIG alone, Outcome 2 Platelet count at birth.
Figuras y tablas -
Analysis 1.2

Comparison 1 Corticosteroid vs IVIG alone, Outcome 2 Platelet count at birth.

Comparison 1 Corticosteroid vs IVIG alone, Outcome 3 Satisfactory response to therapy.
Figuras y tablas -
Analysis 1.3

Comparison 1 Corticosteroid vs IVIG alone, Outcome 3 Satisfactory response to therapy.

Comparison 1 Corticosteroid vs IVIG alone, Outcome 4 Mean change between pre‐treatment and birth fetal platelet count.
Figuras y tablas -
Analysis 1.4

Comparison 1 Corticosteroid vs IVIG alone, Outcome 4 Mean change between pre‐treatment and birth fetal platelet count.

Comparison 1 Corticosteroid vs IVIG alone, Outcome 5 Mean change in fetal platelet count between 1st and 2nd fetal blood sampling.
Figuras y tablas -
Analysis 1.5

Comparison 1 Corticosteroid vs IVIG alone, Outcome 5 Mean change in fetal platelet count between 1st and 2nd fetal blood sampling.

Comparison 2 IVIG with a corticosteroid vs IVIG alone, Outcome 1 Intracranial haemorrhage.
Figuras y tablas -
Analysis 2.1

Comparison 2 IVIG with a corticosteroid vs IVIG alone, Outcome 1 Intracranial haemorrhage.

Comparison 2 IVIG with a corticosteroid vs IVIG alone, Outcome 2 Platelet count at birth.
Figuras y tablas -
Analysis 2.2

Comparison 2 IVIG with a corticosteroid vs IVIG alone, Outcome 2 Platelet count at birth.

Comparison 2 IVIG with a corticosteroid vs IVIG alone, Outcome 3 Premature birth.
Figuras y tablas -
Analysis 2.3

Comparison 2 IVIG with a corticosteroid vs IVIG alone, Outcome 3 Premature birth.

Comparison 2 IVIG with a corticosteroid vs IVIG alone, Outcome 4 Satisfactory response to therapy.
Figuras y tablas -
Analysis 2.4

Comparison 2 IVIG with a corticosteroid vs IVIG alone, Outcome 4 Satisfactory response to therapy.

Comparison 2 IVIG with a corticosteroid vs IVIG alone, Outcome 5 Mean change between pre‐treatment and birth fetal platelet count.
Figuras y tablas -
Analysis 2.5

Comparison 2 IVIG with a corticosteroid vs IVIG alone, Outcome 5 Mean change between pre‐treatment and birth fetal platelet count.

Comparison 2 IVIG with a corticosteroid vs IVIG alone, Outcome 6 Mean change in fetal platelet count at 2nd from 1st fetal blood sampling.
Figuras y tablas -
Analysis 2.6

Comparison 2 IVIG with a corticosteroid vs IVIG alone, Outcome 6 Mean change in fetal platelet count at 2nd from 1st fetal blood sampling.

Comparison 2 IVIG with a corticosteroid vs IVIG alone, Outcome 7 Mean change in fetal platelet count at birth from first fetal blood sampling.
Figuras y tablas -
Analysis 2.7

Comparison 2 IVIG with a corticosteroid vs IVIG alone, Outcome 7 Mean change in fetal platelet count at birth from first fetal blood sampling.

Comparison 2 IVIG with a corticosteroid vs IVIG alone, Outcome 8 Number of ICHs in previous sibling.
Figuras y tablas -
Analysis 2.8

Comparison 2 IVIG with a corticosteroid vs IVIG alone, Outcome 8 Number of ICHs in previous sibling.

Comparison 2 IVIG with a corticosteroid vs IVIG alone, Outcome 9 Adverse outcomes associated with FBS.
Figuras y tablas -
Analysis 2.9

Comparison 2 IVIG with a corticosteroid vs IVIG alone, Outcome 9 Adverse outcomes associated with FBS.

Comparison 2 IVIG with a corticosteroid vs IVIG alone, Outcome 10 Adverse events associated with treatment.
Figuras y tablas -
Analysis 2.10

Comparison 2 IVIG with a corticosteroid vs IVIG alone, Outcome 10 Adverse events associated with treatment.

Table 1. Results from observational studies of antenatal treatment for fetomaternal alloimmune thrombocytopenia with IVIG

Study

No. fetuses treated

IvIg admin

Steroid admin(daily)

IUT

Second‐line Rx‐nonrespon

No. with ICH

No.plt ct <30x10*9/l

No. deaths

Comments

Daffos 1984

1

Nil

Nil

IUT prior to delivery

Nil

0

0

0

Bussel 1988

7

1 g/kg/week (n = 7)

Dexamethasone 5 mg/day (n = 3), 3 mg/day (n = 2)

Nil

Nil

0

0

0

Mir 1988

1

0.8 mg/kg at 30 weeks, then 0.4 mg/kg/week from 31 weeks

Nil

Nil

Nil

0

0

0

Kaplan 1988

7

0.4 g/kg/5 days weekly from 35 weeks if plt < 20 x 10*9/l (n = 1)

1 IUT 38 weeks. Serial IUT x 3 (n = 1)

Nil

0

0

0

Nicolini 1988

1

Nil

Nil

Weekly IUT from 26 weeks

Nil

0

0

0

Daffos 1988

1

Nil

Prednisolone 10 mg from 23 weeks

Nil

Nil

0

0

0

Murphy 1990

1

Nil

Nil

Weekly IUT from 29 weeks until delivery 34 weeks

Nil

0

0

0

Nicolini 1990

2

Nil

Nil

Weekly IUT from 26 and 27 weeks until delivery

IVIG from week 25, with persistent thrombocytopenia (n = 1)

0

0

0

Kaplan 1991

6

Nil

Prednisone 10 mg from 22 to 26 weeks until delivery at 37 to 38 weeks (n = 4). 25 mg from 21 weeks (n = 2)

Nil

IVIG 1 g/kg/week from 26 weeks until delivery at 38 weeks (n = 1)

0

1

0

Lynch 1992

18

1 g/kg/week from diagnosis of thrombocytopenia at 20 to 22 weeks (one case received 0.5 mg/kg/week)

9 also received dexamethasone 1.5 to 5 mg or prednisolone 10 mg

Nil

Nil

0

2

0

Wenstrom 1992

6

1 g/kg/week

3 received dexamethasone 1.5 mg

Nil

Prednisone 60 mg/day (n = 2)

0

1

0

Marzusch 1992

1

1 g/kg/week from 17 to 34 weeks

Nil

Nil

Failed IUT prior to delivery (n = 1)

0

1

0

Kroll 1994

1

1 g/kg/week from 20 weeks

Nil

Nil

Weekly IUT from time of ICH at 32 weeks until delivery at 35 weeks

1

0

0

Zimmermann 1992

1

Intrauterine transfusion to fetus

Nil

Nil

Single IUT given prior to delivery

0

0

0

Bowman 1992

1

Intrauterine transfusion to fetus

Nil

Nil

IVIG 1 g/kg/week given to mother

0

0

0

Murphy 1994

15

1 g/kg/week
beginning at 21 to 34 weeks to 31 to 38 weeks (n = 4)
Prednisone 20 mg/day plus IVIG
1 g/kg/week beginning 14 to 20 weeks up to 16 to 33 weeks
(n = 3)**

Prednisone 20 mg/day from 16 to 26 weeks to 25 to 36 weeks
(n = 2).**

Weekly IUT from 18 to 29 weeks until delivery at 33 to 35 weeks, apart from one case 2 (n = 4) *

Prednisone alone (n = 1)
Prednisone + IVIG (n = 2)
weekly IUTs were commenced at from 26 to 34 weeks until delivery at 33 to 36 weeks.

1

0

3

*Severely affected babies with initial fetal platelet count < 20 x 10*9/l were treated with fetal platelet transfusions. **Mildly affected fetuses with initial fetal platelet count > 50 x 10*9/l were initially treated either with steroids or IvIgG alone or a combination of both.

Kanhai 1996

19

1 g/kg/week (n = 8) Intrauterine transfusion to fetus (n = 1)

IUT schedule based on previous obstetric history (n = 19)

Prednisone 60 mg/day for 3 weeks (n = 1)

0

0

1 following cordocentesis an ELSCS.
1 fetus: non fatal sagittal sinus thrombosis
1 following cordocentesis an ELSCS.
1 fetus: non fatal sagittal sinus thrombosis

Kaplan 1998

37

From diagnosis of thrombocytopenia (n = 27)1 g/kg/week

Corticosteroids 0.5 mg/kg/day

Nil

Nil

2

Not stated

3

Mackenzie 1999

14

1 g/kg/week (n = 11)

Nil

IUT weekly from 27 weeks until delivery (n = 3)

Nil

0

1 (IUT treatment), 1 (IVIG treatment)

2 related to cordocentesis

Sainio 1999

15

1 g/kg/week from 25 to 32 weeks to 35 to 39 weeks (n = 7)
IVIG Plus prednisone (30 mg/day 24 to 29 weeks (n = 1)

Prednisone 20 mg/day from 22 to 35 weeks (n = 1). IVIG ‐1 g/kg for one week only at 35 weeks

Weekly IUT from 25 to 29 weeks to 33 to 36 weeks, apart from 2 cases*

7 cases receiving IVIG +/‐ prednisone required IUT prior to delivery

0

3

0

* 2 pregnancies were managed with a single transfusion: one immediately prior to delivery at 34 weeks, and the other at 28 weeks prior to delivery at 37 weeks.

Dawkins 1999

17

1 g/kg/week (n = 11)

Nil

Nil

Nil

Not stated

2

0

Silver 2000

18

1 g/kg/week (n = 8). Intrauterine transfusion (n = 2)

Nil

Nil

Nil

0

Not stated

0

Radder 2001

56

1 g/kg/week

Weekly IUT

0

25 had platelet count < 50 prior to delivery/IUT

1

Overton 2002

12

1 g/kg/week (n = 3)
Intrauterine transfusion in addition (n = 2)

Nil

Weekly IUT from 22 to 24 weeks until delivery

Nil

0

Not stated

2 (1 procedure related)

Lucas 2002

2 (in 1 woman)

0.4 g/kg x 3/week (n = 1) and 0.5 g/kg x 2/week (n = 1)

Nil

Weekly IUT x 5 (n = 1)
X1 (n = 1)

Nil

0

0

0

Birchall 2003

56

1 g/kg/week (n = 16)

Prednisone 0.5 mg/kg/day
plus IVIG (n = 2 )

Weekly IUT (n = 33)

2 (both before 1st FBS)

Not stated

3 (2 related to FBS)

van den Akker 2006

32

1g/kg from weeks 32 to 38 followed by induction of labour

Nil

Nil

Nil

0

4

0

ELSCS: elective lower section caesarean section
FBS: fetal blood sampling
IUT: intrauterine transfusion

Figuras y tablas -
Table 1. Results from observational studies of antenatal treatment for fetomaternal alloimmune thrombocytopenia with IVIG
Table 2. Complications of treatment ‐ Berkowitz 2007

Complication

IVIG alone

(n = 22)

IVIG + prednisone

(n =28)

Second‐line

(n = 13)

Gastrointestinal diabetes mellitus

0

4 (14)

3 (23)

Fluid retention

1 (5)

9 (32)

4 (31)

Mood swings

2 (9)

7 (25)

5 (38)

Moderate to severe fatigue

7 (32)

5 (18)

6 (46)

Joint pain

3 (14)

6 (21)

3 (23)

Moderate to severe headache

9 (41)

10 (36)

6 (46)

Rash

2 (9)

3 (11)

1 (8)

Insomnia/jitteriness

0

2 (7)

4 (31)

TOTAL number of complications

24

46

32

Data on complications experienced were not obtained from 6 women receiving IVIG alone and 4 women receiving IVIG and prednisone

Complications of treatment data presented as number of women (%) of events.

IVIG: intravenous immunoglobulin

Figuras y tablas -
Table 2. Complications of treatment ‐ Berkowitz 2007
Comparison 1. Corticosteroid vs IVIG alone

Outcome or subgroup title

No. of studies

No. of participants

Statistical method

Effect size

1 Fetal/neonatal death Show forest plot

1

Risk Ratio (M‐H, Fixed, 95% CI)

Subtotals only

2 Platelet count at birth Show forest plot

1

Mean Difference (IV, Fixed, 95% CI)

Subtotals only

3 Satisfactory response to therapy Show forest plot

1

Risk Ratio (M‐H, Fixed, 95% CI)

Subtotals only

4 Mean change between pre‐treatment and birth fetal platelet count Show forest plot

1

Mean Difference (IV, Fixed, 95% CI)

Subtotals only

5 Mean change in fetal platelet count between 1st and 2nd fetal blood sampling Show forest plot

1

Mean Difference (IV, Fixed, 95% CI)

Subtotals only

Figuras y tablas -
Comparison 1. Corticosteroid vs IVIG alone
Comparison 2. IVIG with a corticosteroid vs IVIG alone

Outcome or subgroup title

No. of studies

No. of participants

Statistical method

Effect size

1 Intracranial haemorrhage Show forest plot

1

Risk Ratio (M‐H, Fixed, 95% CI)

Subtotals only

1.1 IVIG 1g/kg/week plus prednisone 0.5 mg/kg/day versus IVIG 2g/kg/week

1

73

Risk Ratio (M‐H, Fixed, 95% CI)

1.03 [0.07, 15.82]

2 Platelet count at birth Show forest plot

3

Mean Difference (IV, Fixed, 95% CI)

Subtotals only

2.1 IVIG 1g/kg/week plus dexamethasone 1.5 mg/day versus IVIG 1 g/kg/week

1

54

Mean Difference (IV, Fixed, 95% CI)

14.10 [‐30.26, 58.46]

2.2 1g/kg/week plus prednisone 1.0 mg/kg/day versus IVIG 1g/kg/week

1

36

Mean Difference (IV, Fixed, 95% CI)

28.00 [‐11.47, 67.47]

2.3 IVIG 1g/kg/week plus prednisone 0.5 mg/kg/day versus IVIG 2g/kg/week

1

73

Mean Difference (IV, Fixed, 95% CI)

‐35.40 [‐258.66, 187.86]

3 Premature birth Show forest plot

2

Mean Difference (IV, Fixed, 95% CI)

Subtotals only

3.1 IVIG 1g/kg/week plus dexamethasone 1.5 mg/day versus IVIG 1 g/kg/week

1

54

Mean Difference (IV, Fixed, 95% CI)

‐0.5 [‐2.69, 1.69]

3.2 IVIG 1g/kg/week plus prednisone 0.5 mg/kg/day versus IVIG 2g/kg/week

1

73

Mean Difference (IV, Fixed, 95% CI)

‐0.20 [‐5.71, 5.31]

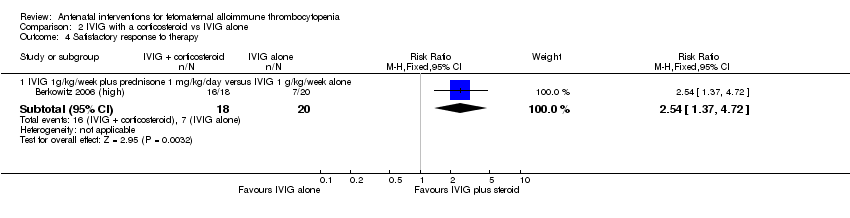
4 Satisfactory response to therapy Show forest plot

1

Risk Ratio (M‐H, Fixed, 95% CI)

Subtotals only

4.1 IVIG 1g/kg/week plus prednisone 1 mg/kg/day versus IVIG 1 g/kg/week alone

1

38

Risk Ratio (M‐H, Fixed, 95% CI)

2.54 [1.37, 4.72]

5 Mean change between pre‐treatment and birth fetal platelet count Show forest plot

2

Mean Difference (IV, Fixed, 95% CI)

Subtotals only

5.1 IVIG 1g/kg/week plus prednisone 1 mg/kg/day versus IVIG 1 g/kg/week alone

1

35

Mean Difference (IV, Fixed, 95% CI)

10.83 [‐28.99, 50.65]

5.2 IVIG 1g/kg/week plus prednisone 0.5 mg/kg/day versus IVIG 2g/kg/week

1

58

Mean Difference (IV, Fixed, 95% CI)

‐21.95 [‐57.96, 14.06]

6 Mean change in fetal platelet count at 2nd from 1st fetal blood sampling Show forest plot

2

Mean Difference (IV, Fixed, 95% CI)

Subtotals only

6.1 IVIG 1g/kg/week plus dexamethasone 1.5 mg/day versus IVIG 1 g/kg/week

1

54

Mean Difference (IV, Fixed, 95% CI)

‐3.5 [‐24.62, 17.62]

6.2 IVIG 1g/kg/week plus prednisone 1 mg/kg/day versus IVIG 1 g/kg/week alone

1

36

Mean Difference (IV, Fixed, 95% CI)

42.0 [18.91, 65.09]

7 Mean change in fetal platelet count at birth from first fetal blood sampling Show forest plot

1

Mean Difference (IV, Fixed, 95% CI)

Subtotals only

7.1 IVIG 1g/kg/week plus dexamethasone 1.5 mg/day versus IVIG 1 g/kg/week

1

54

Mean Difference (IV, Fixed, 95% CI)

24.40 [‐14.17, 62.97]

8 Number of ICHs in previous sibling Show forest plot

1

Risk Ratio (M‐H, Fixed, 95% CI)

Subtotals only

8.1 IVIG 1g/kg/week plus prednisone 1 mg/kg/day versus IVIG 1 g/kg/week alone

1

40

Risk Ratio (M‐H, Fixed, 95% CI)

0.83 [0.21, 3.24]

9 Adverse outcomes associated with FBS Show forest plot

1

Risk Ratio (M‐H, Fixed, 95% CI)

Subtotals only

9.1 IVIG 1g/kg/week plus prednisone 0.5 mg/kg/day versus IVIG 2g/kg/week

1

79

Risk Ratio (M‐H, Fixed, 95% CI)

0.98 [0.14, 6.58]

10 Adverse events associated with treatment Show forest plot

1

Risk Ratio (M‐H, Fixed, 95% CI)

Subtotals only

10.1 IVIG 1g/kg/week plus prednisone 0.5 mg/kg/day versus IVIG 2g/kg/week

1

73

Risk Ratio (M‐H, Fixed, 95% CI)

1.06 [0.88, 1.27]

Figuras y tablas -
Comparison 2. IVIG with a corticosteroid vs IVIG alone