Cesárea repetida electiva planificada versus parto vaginal planificado en pacientes con un parto anterior por cesárea
Resumen
Antecedentes
Cuando una paciente ha tenido un parto anterior por cesárea, hay dos opciones para su atención en un embarazo posterior: la cesárea repetida electiva planificada o el parto vaginal planificado. Aunque existen riesgos y efectos beneficiosos del parto por cesárea repetida electiva planificada y del parto vaginal planificado después de una cesárea (PVDC), las fuentes actuales de información se limitan a estudios de cohortes no aleatorios. Los estudios así diseñados tienen una posibilidad significativa de sesgo, por lo que las conclusiones basadas en estos resultados están limitadas con respecto a su confiabilidad y se deben interpretar con cuidado.
Objetivos
Evaluar, mediante las mejores pruebas disponibles, los efectos beneficiosos y perjudiciales de una política de cesárea repetida electiva planificada con una política de PVDC planificado en pacientes con un parto anterior por cesárea.
Métodos de búsqueda
Se hicieron búsquedas en el registro de ensayos del Grupo Cochrane de Embarazo y Parto (Cochrane Pregnancy and Childbirth Group) (30 de septiembre de 2013) y en las listas de referencias de los estudios recuperados.
Criterios de selección
Ensayos controlados aleatorios con datos informados que compararon los resultados de madres y recién nacidos donde se realizó una cesárea repetida electiva planificada, con los resultados de pacientes donde se realizó un parto vaginal planificado y tenían un parto anterior por cesárea.
Obtención y análisis de los datos
Dos revisores de forma independiente evaluaron la calidad de los ensayos y extrajeron los datos.
Resultados principales
Se incluyeron dos ensayos aleatorios con 320 pacientes y sus lactantes. Sin embargo, los datos de los resultados clínicos maternos e infantiles estuvieron disponibles de un ensayo con tasas de eventos muy bajas y que solamente incluyó a 22 pacientes.
En los resultados primarios muerte materna o morbilidad grave (un estudio; 22 pacientes; cociente de riesgos [CR] no estimable) y mortalidad infantil o morbilidad grave (un estudio; 22 pacientes; CR no estimable), no se identificaron diferencias estadísticamente significativas entre el parto por cesárea planificado y el parto vaginal planificado.
Conclusiones de los autores
La cesárea repetida electiva planificada y el parto vaginal planificado en pacientes con un parto anterior por cesárea se asocian con efectos beneficiosos y perjudiciales. Las pruebas de estas prácticas de atención se obtienen en su mayoría de estudios no aleatorios, los que se asocian con sesgos potenciales. Por lo tanto, los resultados y las conclusiones se deben interpretar con precaución. Se necesitan ensayos controlados aleatorios que aporten pruebas más confiables con respecto a los efectos beneficiosos y perjudiciales de la cesárea repetida electiva planificada y del parto vaginal planificado en pacientes con un parto anterior por cesárea.
PICO
Resumen en términos sencillos
Cesárea repetida electiva planificada versus parto vaginal planificado en pacientes con un parto anterior por cesárea
Cuando una paciente ha tenido un parto anterior por cesárea, hay dos opciones para su atención en un embarazo posterior: la cesárea repetida electiva planificada o el parto vaginal planificado. Ambas formas de atención tienen efectos beneficiosos y riesgos asociados. Se encontraron dos ensayos pequeños disponibles, pero hay datos limitados para ayudar a las pacientes, sus compañeros y sus cuidadores a decidir una opción.
Authors' conclusions
Background
Description of the condition
The rate of caesarean section in high‐income countries is increasing, accounting for 23.7% of all births in the United Kingdom, 26% in Ireland (OECD Health Data 2011), and 32.8% in the United States (Hamilton 2012). Reported rates from South America are higher, reaching over 50% in private hospitals in Chile, Argentina, Brazil and Paraguay (Belizan 1999). Suggested reasons for the high proportion of caesarean births over the last few decades have included medicolegal issues, the increasing use of electronic fetal heart rate monitoring, and reduced training in operative vaginal and vaginal breech births (Mastrobattista 1999). Repeat caesarean section is the most common primary obstetric indication for repeat caesarean in 28% of births in the United Kingdom (RCOG 2001) and 32.8% of births in the United States (CDC 2010).
Concerns about the increasing caesarean section rate resulted in a consensus statement by the American College of Obstetricians and Gynecologists, that "most women with one previous caesarean delivery with a low‐transverse incision are candidates for and should be counseled about VBAC" (ACOG 2010). However, there is considerable variation in both the proportion of women attempting labour after caesarean birth (28% to 82%), as well as reported success rates (49% to 87%) (Guise 2010).
Description of the intervention
For a woman with a previous caesarean birth, the decision regarding planned mode of birth in a subsequent pregnancy will be influenced by many factors, including previous experience of a vaginal birth, desire to achieve a vaginal birth, feelings about the previous caesarean birth, and family considerations (including an easier recovery). There are benefits and harms associated with both repeat elective caesarean birth and vaginal birth after caesarean section, which will be discussed subsequently.
Repeat elective caesarean birth is associated with an increase in the risk of complications such as bleeding, the need for blood transfusion, infection, damage to the bladder and bowel, and clots in the veins of the legs (called deep venous thrombosis). As the numbers of caesarean births for each individual woman increases, so does the difficulty in performing surgery due to adhesions, and the risk of damage to the bladder or bowel at the time of surgery (Marshall 2011). There may also be difficulties in conceiving a further pregnancy or problems where the placenta develops over the scar in the uterus in a subsequent pregnancy (placenta praevia) (Marshall 2011). Occasionally the placenta may continue to develop into the muscle wall of the uterus (placenta accreta/placenta percreta). This may cause difficulties with the placenta being delivered after birth, and sometimes excessive bleeding. Babies born by caesarean may develop some difficulties with breathing (called transient tachypnoea of the newborn), and may need to spend time in a special care nursery. This is usually only for a short duration, and most babies recover fully. Occasionally a baby may develop more serious problems with his or her breathing (called respiratory distress syndrome), and may need some extra oxygen, assistance with breathing and a longer stay in the nursery. The risks of developing this relate to the use of general anaesthesia and the age at which the baby is born (Hook 1997; Morrison 1995).
One uncommon, but potentially serious complication associated with a prior uterine surgery (including a previous caesarean section), is that of uterine rupture (where the prior caesarean scar breaks down). This may occur prior to the onset of labour, or during labour while a woman is undergoing a planned vaginal birth after caesarean (VBAC). This complication can be life‐threatening for both the woman and her baby. The estimated risk of scar rupture from large prospective studies varies following VBAC from 0.2% (Crowther 2012a), to 0.7% (Landon 2004). Any vaginal birth may be associated with a non‐reassuring fetal heart rate tracing (sometimes called fetal distress) or inability of the cervix to dilate (sometimes called failure to progress or lack of progress), both of which may require birth by emergency caesarean section. Emergency caesarean birth in labour has been associated with an increased chance of infection, bleeding (increasing the need for blood transfusion), and clots in the veins of the legs (deep venous thrombosis) when compared with both vaginal birth and elective caesarean birth. Any vaginal birth may be associated with trauma to the woman's perineum (the area between the vagina and rectum) either from a tear or cut (called an episiotomy) during childbirth. Vaginal birth may also be associated with longer‐term problems for the woman, including pelvic floor weakness contributing to symptoms such as prolapse and incontinence. Infants born vaginally may have lower Apgar scores and an increased chance of trauma if the birth has been difficult, than those infants born by elective caesarean section.
How the intervention might work
In an attempt to compare the benefits and harms associated with both a planned repeat elective caesarean birth and a planned VBAC, Guise and colleagues completed a comprehensive systematic review of the literature (Guise 2010), in which the overall rates of maternal complications were low among women undergoing trial of labour and repeat caesarean birth. While the risk of hysterectomy, haemorrhage, and transfusions did not differ significantly between the two methods of birth, maternal death was increased following elective caesarean birth (13.4 per 100,000 repeat caesarean birth versus 3.8 per 100,000 for women undergoing a trial of labour) (Guise 2010). The reported rate of uterine rupture was three per 1000, and significantly higher among women who laboured (4.7/1000 trial of labour versus 0.3/1000 repeat caesarean birth).
In view of the limitations identified in these meta‐analyses and the need for more reliable information about the benefits and harms associated with both planned elective repeat caesarean birth and planned vaginal birth after caesarean, Landon (Landon 2004) and Crowther (Crowther 2012a) conducted large prospective cohort studies.
Landon and colleagues within the National Institute of Child Health and Human Development Maternal Fetal Medicine Units Network (Landon 2004) conducted a prospective observational study across 19 centres in the United States. In this study, women with any prior caesarean birth were identified from the delivery suite register, excluding those women who presented in early labour and subsequently underwent a caesarean section. A total of 33,699 women with a prior caesarean birth were involved in the study, of whom 17,898 (53.1%) attempted VBAC, and 15,801 (46.9%) underwent elective repeat caesarean section. The observed rate of symptomatic uterine scar rupture among women undergoing VBAC was 0.7% and of infant death or hypoxic ischaemic encephalopathy, 0.38%.
Crowther and colleagues (Crowther 2012a) conducted a prospective patient preference study across 14 maternity centres in Australia. In this study, women with a single prior caesarean section presenting in their next ongoing pregnancy, with a live singleton in cephalic presentation, at 37 weeks' gestation or more, and who were considered eligible to attempt planned VBAC were eligible to participate. Women were asked their preference for either planned VBAC or planned caesarean section, and assigned to their preferred study group. A total of 2323 women participated in the study. A nested randomised trial involving 22 women was conducted in parallel with the patient preference study. Fewer infants in the planned elective repeat caesarean section group suffered death or serious adverse outcome (risk ratio (RR) 0.39; 95% confidence interval (CI) 0.19 to 0.80), when compared with infants born to women in the planned VBAC group. While significantly fewer women in the planned elective repeat caesarean section group suffered major haemorrhage (RR 0.37; 95% CI 0.17 to 0.80), there were no significant differences between the two groups in risk of uterine rupture (RR0.37; 95% CI 0.04 to 3.57).
While there are risks and benefits for both planned elective repeat caesarean birth and planned vaginal birth after caesarean, current sources of information are limited to non‐randomised cohort studies, which are largely retrospective in nature, and hampered by the lack of comparability of the groups assessed. Studies designed in this way have significant potential for bias and consequently conclusions based on these results are limited in their reliability and should be interpreted with caution. As outlined by Guise and colleagues, there is little information about the outcomes of intended mode of birth, with the bulk of the available literature reporting outcomes based on actual mode of birth, with "this inception cohort the equivalent of intention to treat for randomized controlled trials" (Guise 2010).
Information from randomised controlled trials would better assess the risks and benefits of vaginal birth after caesarean section with elective repeat caesarean section in women with a previous caesarean birth.
Why it is important to do this review
Planned elective repeat caesarean section and planned vaginal birth after caesarean section for women with a prior caesarean birth are both associated with benefits and harms. Evidence for these care practices to allow women and their caregivers to make an informed decision is required.
Objectives
To assess, using the best available evidence, the benefits and harms of a policy of planned elective repeat caesarean section with a policy of planned vaginal birth after caesarean section for women with a previous caesarean birth. The primary outcomes relate to success of trial of labour, need for caesarean section, maternal and neonatal mortality, and maternal and neonatal morbidity.
Methods
Criteria for considering studies for this review
Types of studies
All published, unpublished, and ongoing randomised controlled trials with reported data, that compared outcomes for mothers and/or babies who were randomised to a planned elective repeat caesarean birth with outcomes for mothers and/or babies who had a planned vaginal birth where a prior birth was by caesarean section.
Types of participants
Women with one or more prior caesarean section (regardless of indication for primary caesarean birth, number of caesarean births, type of uterine scar, or method of closure of uterine incision) who were planning a vaginal birth in a subsequent pregnancy.
Types of interventions
Planned elective repeat caesarean birth versus planned vaginal birth.
Types of outcome measures
Primary outcomes
-
Death or serious maternal morbidity (defined by trial authors)
-
Death or serious infant morbidity (defined by trial authors)
Secondary outcomes
Outcome measures for the woman
-
Vaginal birth
-
Instrumental vaginal birth
-
Caesarean birth
-
Caesarean birth for fetal distress
-
Uterine rupture (defined as clinically significant rupture involving the full thickness of the uterine wall and requiring surgical repair)
-
Uterine scar dehiscence (defined as clinically asymptomatic disruption of the uterus that is discovered incidentally at surgery)
-
Haemorrhage (blood loss greater than 500 mL and/or requiring blood transfusion)
-
Evacuation of the uterus after childbirth for postpartum haemorrhage or retained placental tissue
-
Hysterectomy for any complications resulting from birth
-
Vulval or perineal haematoma requiring evacuation
-
Deep vein thrombosis or thrombophlebitis requiring anticoagulant therapy
-
Pulmonary embolus requiring anticoagulant therapy
-
Pneumonia due to infection, aspiration or other causes
-
Adult respiratory distress syndrome
-
Wound infection (requiring prolongation of hospitalisation or readmission)
-
Wound dehiscence
-
Puerperal infection
-
Damage to the bladder, bowel or ureter requiring surgical repair
-
Cervical laceration extending to the lower uterine segment or abnormal extension of the uterine incision
-
Occurrence of a fistula involving the genital tract and urinary or gastrointestinal tracts
-
Bowel obstruction
-
Paralytic ileus
-
Pulmonary oedema
-
Stroke (acute neurological deficit greater than 24 hours)
-
Cardiac arrest
-
Respiratory arrest
-
Coagulopathy
-
Maternal death
-
Any other serious maternal complication related to birth
-
Level of pain after birth
-
Postnatal depression
-
Breastfeeding
Outcome measures for the infant
-
Neonatal or perinatal death
-
Meconium‐stained liquor
-
Apgar score less than seven at five minutes
-
Birthweight
-
Admission to the neonatal intensive care unit (NICU)
-
Birth trauma (subdural or intracerebral haemorrhage, spinal cord injury, basal skull fracture, other fracture, peripheral nerve injury)
-
Seizures at less than 24 hours of age
-
Laceration to baby at time of birth
-
Neonatal encephalopathy
-
Altered level of consciousness
-
Use of mechanical ventilation
-
Any respiratory disease
-
Severe respiratory distress syndrome requiring oxygen (as defined by trialists)
-
Any oxygen requirement
-
Transient tachypnoea of the newborn
-
Use of tube feeding
-
Necrotising enterocolitis
-
Proven systemic infection treated with antibiotics within 48 hours of life
Maternal emotional well‐being
-
Postnatal depression (defined as the number of women screening at risk of postnatal depression, in addition to mean depressive score, using the Edinburgh Postnatal Depression Scale (EPDS))
-
Maternal anxiety (defined the mean anxiety score as measured using the State Trait Anxiety Index (STAI))
-
Maternal quality of life (as defined by trialists)
Longer‐term outcomes for the woman
-
Return to 'normal' activities
-
Health and well‐being assessment
-
Sexual health
-
Symptoms related to pelvic floor damage
-
Need for operative pelvic floor repair
-
Relationship with partner and child(ren)
-
Future fertility (both voluntary and involuntary)
-
Development of placenta praevia or placenta accreta/percreta in subsequent pregnancies
-
Mode of birth in subsequent pregnancy
Longer‐term outcomes for the child
-
Death after discharge from hospital
-
Disability in infancy
-
Disability in childhood
Measures of satisfaction include
-
Women's satisfaction with care
-
Women's preferences for care
Costs include
-
Costs associated with planned elective repeat caesarean birth versus planned vaginal birth
-
Maternal postnatal length of stay
-
Neonatal length of stay
-
Costs associated with readmission of mother
-
Costs associated with readmission of baby
Outcomes would have been included in the analysis if data were available according to original treatment allocation and reasonable measures were taken to minimise observer bias. Only outcomes with available data would have appeared in the analysis tables. Data that were not prestated would have been extracted and reported. These would have been clearly labelled as such (not prespecified). The possibility has to be borne in mind that such outcomes would only have been reported because the difference between the groups, which is a result of chance, have reached conventional levels of statistical significance. In order to minimise the risk of bias, the conclusions would have been based solely only on the prestated outcomes.
Search methods for identification of studies
Electronic searches
We searched the Cochrane Pregnancy and Childbirth Group's Trials Register (30 September 2013).
The Cochrane Pregnancy and Childbirth Group’s Trials Register is maintained by the Trials Search Co‐ordinator and contains trials identified from:
-
monthly searches of the Cochrane Central Register of Controlled Trials (CENTRAL);
-
weekly searches of MEDLINE;
-
weekly searches of Embase;
-
handsearches of 30 journals and the proceedings of major conferences;
-
weekly current awareness alerts for a further 44 journals plus monthly BioMed Central email alerts.
Details of the search strategies for CENTRAL, MEDLINE and Embase, the list of handsearched journals and conference proceedings, and the list of journals reviewed via the current awareness service can be found in the ‘Specialized Register’ section within the editorial information about the Cochrane Pregnancy and Childbirth Group.
Trials identified through the searching activities described above are each assigned to a review topic (or topics). The Trials Search Co‐ordinator searches the register for each review using the topic list rather than keywords.
For details of additional author searching carried out in the initial version of the review, please see Appendix 1.
Searching other resources
We searched the reference lists of retrieved studies.
We did not apply any language restrictions.
Data collection and analysis
For the methods used when assessing the trials identified in the previous version of this review, seeDodd 2004.
For this update we used the following methods when assessing the reports identified by the updated search.
Selection of studies
Two review authors independently assessed for inclusion all the potential studies we identified as a result of the search strategy. We resolved any disagreement through discussion or, if required, we consulted a third person.
Data extraction and management
We designed a form to extract data. For eligible studies, at least two review authors extracted the data using the agreed form. We resolved discrepancies through discussion or, if required, we consulted a third person. We entered data into Review Manager software (RevMan 2012) and checked for accuracy.
When information regarding any of the above was unclear, we planned to contact authors of the original reports to provide further details.
Jodie Dodd and Caroline Crowther are the authors of one of the reports included in this review (Crowther 2012b). This study report was assessed by the other review authors.
Assessment of risk of bias in included studies
Two review authors independently assessed risk of bias for each study using the criteria outlined in the Cochrane Handbook for Systematic Reviews of Interventions (Higgins 2011). We resolved any disagreement by discussion or by involving a third assessor.
(1) Random sequence generation (checking for possible selection bias)
We described for each included study the method used to generate the allocation sequence in sufficient detail to allow an assessment of whether it should produce comparable groups.
We assessed the method as:
-
low risk of bias (any truly random process, e.g. random number table; computer random number generator);
-
high risk of bias (any non‐random process, e.g. odd or even date of birth; hospital or clinic record number);
-
unclear risk of bias.
(2) Allocation concealment (checking for possible selection bias)
We described for each included study the method used to conceal allocation to interventions prior to assignment and assessed whether intervention allocation could have been foreseen in advance of, or during recruitment, or changed after assignment.
We assessed the methods as:
-
low risk of bias (e.g. telephone or central randomisation; consecutively numbered sealed opaque envelopes);
-
high risk of bias (open random allocation; unsealed or non‐opaque envelopes, alternation; date of birth);
-
unclear risk of bias.
(3.1) Blinding of participants and personnel (checking for possible performance bias)
We described for each included study the methods used, if any, to blind study participants and personnel from knowledge of which intervention a participant received. We considered studies to be at low risk of bias if they were blinded, or if we judged that the lack of blinding would be unlikely to affect results. We assessed blinding separately for different outcomes or classes of outcomes.
We assessed the methods as:
-
low, high or unclear risk of bias for participants;
-
low, high or unclear risk of bias for personnel.
(3.2) Blinding of outcome assessment (checking for possible detection bias)
We described for each included study the methods used, if any, to blind outcome assessors from knowledge of which intervention a participant received. We assessed blinding separately for different outcomes or classes of outcomes.
We assessed methods used to blind outcome assessment as:
-
low, high or unclear risk of bias.
(4) Incomplete outcome data (checking for possible attrition bias due to the amount, nature and handling of incomplete outcome data)
We described for each included study, and for each outcome or class of outcomes, the completeness of data including attrition and exclusions from the analysis. We have stated whether attrition and exclusions were reported and the numbers included in the analysis at each stage (compared with the total randomised participants), reasons for attrition or exclusion where reported, and whether missing data were balanced across groups or were related to outcomes. Where sufficient information was reported, or could be supplied by the trial authors, we planned to re‐include missing data in the analyses undertaken.
We assessed methods as:
-
low risk of bias (e.g. no missing outcome data; missing outcome data balanced across groups);
-
high risk of bias (e.g. numbers or reasons for missing data imbalanced across groups; ‘as treated’ analysis done with substantial departure of intervention received from that assigned at randomisation);
-
unclear risk of bias.
(5) Selective reporting (checking for reporting bias)
We described for each included study how we investigated the possibility of selective outcome reporting bias and what we found.
We assessed the methods as:
-
low risk of bias (where it is clear that all of the study’s pre‐specified outcomes and all expected outcomes of interest to the review have been reported);
-
high risk of bias (where not all the study’s pre‐specified outcomes have been reported; one or more reported primary outcomes were not pre‐specified; outcomes of interest are reported incompletely and so cannot be used; study fails to include results of a key outcome that would have been expected to have been reported);
-
unclear risk of bias.
(6) Other bias (checking for bias due to problems not covered by (1) to (5) above)
We described for each included study any important concerns we had about other possible sources of bias.
We assessed whether each study was free of other problems that could put it at risk of bias:
-
low risk of other bias;
-
high risk of other bias;
-
unclear whether there is risk of other bias.
(7) Overall risk of bias
We made explicit judgements about whether studies were at high risk of bias, according to the criteria given in the Cochrane Handbook (Higgins 2011). With reference to (1) to (6) above, we assessed the likely magnitude and direction of the bias and whether we consider it likely to impact on the findings. We planned to explore the impact of the level of bias through undertaking sensitivity analyses ‐ seeSensitivity analysis.
Measures of treatment effect
Dichotomous data
For dichotomous data, we presented results as summary risk ratio with 95% confidence intervals.
Continuous data
For continuous data, we used the mean difference if outcomes were measured in the same way between trials. In future updates, if appropriate, we will use the standardised mean difference to combine trials that measure the same outcome, but use different methods.
Unit of analysis issues
Cluster‐randomised trials
No cluster‐randomised trials were included in this update.
In future updates, if identified, we will include cluster‐randomised trials in the analyses along with individually‐randomised trials. We will adjust their sample sizes using the methods described in the Cochrane Handbook [Section 16.3.4] using an estimate of the intracluster correlation co‐efficient (ICC) derived from the trial (if possible), from a similar trial or from a study of a similar population. If we use ICCs from other sources, we will report this and conduct sensitivity analyses to investigate the effect of variation in the ICC. If we identify both cluster‐randomised trials and individually‐randomised trials, we plan to synthesise the relevant information. We will consider it reasonable to combine the results from both if there is little heterogeneity between the study designs and the interaction between the effect of intervention and the choice of randomisation unit is considered to be unlikely.
We will also acknowledge heterogeneity in the randomisation unit and perform a sensitivity analysis to investigate the effects of the randomisation unit.
Dealing with missing data
For included studies, we noted levels of attrition. In future updates, if more studies are included, we will explore the impact of including studies with high levels of missing data in the overall assessment of treatment effect by using sensitivity analysis.
In future updates of this review, for all outcomes, we will carry out analyses, as far as possible, on an intention‐to‐treat basis, i.e. we will attempt to include all participants randomised to each group in the analyses, and all participants will be analysed in the group to which they were allocated, regardless of whether or not they received the allocated intervention. The denominator for each outcome in each trial will be the number randomised minus any participants whose outcomes are known to be missing.
Assessment of heterogeneity
In future updates, if more studies are included and data are available for meta‐analysis, we will assess statistical heterogeneity in each meta‐analysis using the Tau², I² and Chi² statistics. We will regard heterogeneity as substantial if the I² is greater than 30% and either the Tau² is greater than zero, or there is a low P value (less than 0.10) in the Chi² test for heterogeneity.
Assessment of reporting biases
In future updates, if there are 10 or more studies in the meta‐analysis, we will investigate reporting biases (such as publication bias) using funnel plots. We will assess funnel plot asymmetry visually. If asymmetry is suggested by a visual assessment, we will perform exploratory analyses to investigate it.
Data synthesis
We carried out statistical analysis using the Review Manager software (RevMan 2012). However, we were unable to combine data as maternal and infant clinical outcomes were available from only one trial (Crowther 2012b). We planned to use fixed‐effect meta‐analysis for combining data where it was reasonable to assume that studies were estimating the same underlying treatment effect: i.e. where trials were examining the same intervention, and the trials’ populations and methods were judged sufficiently similar.
In future updates, if more data become available for meta‐analysis and there is clinical heterogeneity sufficient to expect that the underlying treatment effects differ between trials, or if substantial statistical heterogeneity is detected, we will use random‐effects meta‐analysis to produce an overall summary, if an average treatment effect across trials is considered clinically meaningful. The random‐effects summary will be treated as the average range of possible treatment effects and we will discuss the clinical implications of treatment effects differing between trials. If the average treatment effect is not clinically meaningful, we will not combine trials.
If we use random‐effects analyses, the results will be presented as the average treatment effect with 95% confidence intervals, and the estimates of Tau² and I².
Subgroup analysis and investigation of heterogeneity
It was not possible to perform the proposed subgroup analyses.
In future updates, if we identify substantial heterogeneity, we will investigate it using subgroup analyses and sensitivity analyses. We will consider whether an overall summary is meaningful, and if it is, use random‐effects analysis to produce it.
We plan to carry out the following subgroup analyses.
-
Previous vaginal birth versus no previous vaginal birth.
-
Single prior caesarean birth versus two or more prior caesarean births.
The following outcomes will be used in subgroup analysis.
-
Death or serious maternal morbidity (defined by trial authors).
-
Death or serious infant morbidity (defined by trial authors).
We will assess subgroup differences by interaction tests available within RevMan (RevMan 2012). We will report the results of subgroup analyses quoting the Chi2 statistic and P value, and the interaction test I² value.
Sensitivity analysis
It was not possible to perform the proposed sensitivity analyses. In future updates, sensitivity analyses will be performed on the basis of trial quality to explore the effects of any heterogeneity identified.
Results
Description of studies
Results of the search
The search strategy identified six reports of two randomised trials in which women with a single previous caesarean birth were randomised to either planned elective caesarean section or to planned vaginal birth in a subsequent pregnancy (Crowther 2012b; Law 2010).
The trial by Crowther and colleagues was conducted as a nested randomised trial within a prospective patient preference study.
Included studies
The two identified randomised trials were included involving a total of 320 women with a single prior caesarean birth in a subsequent pregnancy (Crowther 2012b; Law 2010). Both studies compared a plan for elective repeat caesarean birth with vaginal birth.
The primary outcome for the Crowther trial was a composite of death or serious adverse outcome for the infant, in addition to secondary outcomes reflecting death or serious adverse outcomes for the woman (Crowther 2012b).
The primary outcome for the Law trial was an assessment of maternal psychometric measures including depression, general health and well‐being, anxiety, and satisfaction, with no reporting of other clinical outcomes either for the woman or her infant (Law 2010).
Excluded studies
There were no excluded studies.
Risk of bias in included studies
The overall methodological quality of both trials was good. Please refer to table Characteristics of included studies for further details and to the summary figures for assessments of risk of bias (Figure 1; Figure 2).
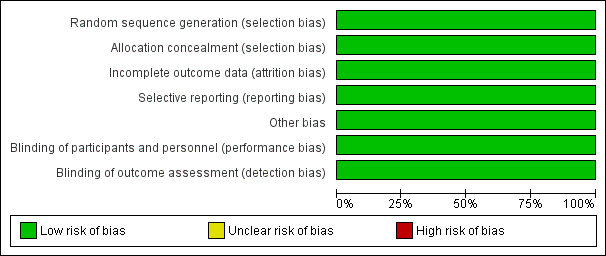
Risk of bias graph: review authors' judgements about each risk of bias item presented as percentages across all included studies.
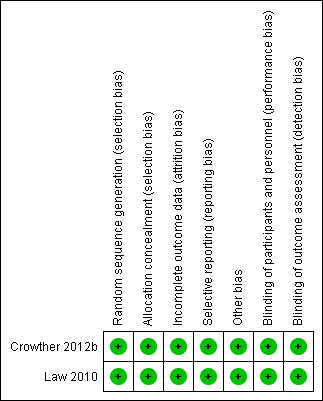
Risk of bias summary: review authors' judgements about each risk of bias item for each included study.
Allocation
Both trials were stated to be randomised trials, and utilised computer‐generated randomisation sequences (Crowther 2012b; Law 2010). Allocation concealment was adequate for both, Crowther and colleagues utilising a telephone randomisation service (Crowther 2012b), and Law and colleagues used sealed opaque sequentially numbered envelopes (Law 2010).
Blinding
Blinding of participants, caregivers and outcome assessors was not achieved in either study (Crowther 2012b; Law 2010).
Incomplete outcome data
There were no reported losses to follow‐up in the Crowther trial (Crowther 2012b). Law and colleagues report outcomes for 291 of 298 women randomised (six women withdrew after randomisation ‐ three in each group ‐ and one woman was excluded as she was ineligible) (Law 2010).
Selective reporting
A range of maternal and infant clinical outcomes were reported by Crowther (Crowther 2012b). Psychometric outcomes for women were reported by Law, with no other clinical outcomes reported for the woman or her infant (Law 2010).
Other potential sources of bias
Both studies were assessed as being at low risk of bias.
Effects of interventions
Two randomised trials involving 320 women and their infants were included. However, data for maternal and infant clinical outcomes were available from one trial with very low event rates, involving 22 women only (Crowther 2012b).
Primary outcomes
For the primary outcomes maternal death or serious morbidity (one study; 22 women; RR not estimable), and infant death or serious morbidity (one study; 22 women; RR not estimable), there were no statistically significant differences between planned caesarean birth and planned vaginal birth identified.
Secondary outcomes
For the secondary maternal and infant outcomes reported, there were no statistically significant differences identified between planned caesarean birth and planned vaginal birth.
The trial by Law and colleagues (Law 2010) reported maternal psychological well‐being. There were no statistically significant differences identified between planned caesarean section and planned vaginal birth for women with a prior caesarean birth, as assessed at six months postpartum using the State Trait Anxiety Inventory (median score 35.5; interquartile range (IQR) 25.8 to 44.0 planned caesarean section versus median 33.0; IQR 24.8 to 45.0 planned vaginal birth); Edinburgh Postnatal Depression Scale (median 0.0; IQR 0.0 to 4.0 planned caesarean section versus median 0.5; IQR 0.0 to 4.0 planned vaginal birth); Beck Depression Inventory (median 1.5; IQR 0.0 to 4.8 planned caesarean section versus median 1.0; IQR 0.0 to 4.3 planned vaginal birth); General Health Questionnaire (median 0.0; IQR 0.0 to 1.0 planned caesarean section versus median 0.0; IQR 0.0 to 2.0 planned vaginal birth); or the Client Satisfaction Questionnaire (median 24.0; IQR22.0 to 25.0 planned caesarean section versus median 23.0; IQR 22.0 to 25.0 planned vaginal birth).
It was not possible to perform the proposed subgroup analyses.
Discussion
There were two randomised controlled trials identified that compared outcomes for women planning a repeat elective caesarean with women planning a vaginal birth where a prior birth was by caesarean section. However, clinical outcomes were reported in only one of the studies involving 22 women (Crowther 2012b). As the event rates were very low, the risk of each outcome is not estimable, significantly limiting our ability to reliably draw conclusions from the randomised data. There do not appear to be differences in maternal emotional well‐being associated with either planned repeat caesarean birth or vaginal birth after caesarean section (VBAC).
While there are risks and benefits for both planned elective repeat caesarean birth and planned VBAC, current sources of information are limited to non‐randomised cohort studies, that are largely retrospective in nature. Studies designed in this way have potential for bias and consequently any conclusions based on these results are limited in their reliability and should be interpreted with caution.
There is a need for methodologically rigorous studies to provide direct evidence about the relative benefits and harms of elective repeat caesarean birth and vaginal birth after caesarean for both short‐term and long‐term health outcomes for women and their infants. This information is best obtained from randomised controlled trials, as the methodology limits the potential for bias and provides the most reliable evidence regarding the benefits and harms of both forms of care.

Risk of bias graph: review authors' judgements about each risk of bias item presented as percentages across all included studies.

Risk of bias summary: review authors' judgements about each risk of bias item for each included study.

Comparison 1 Primary outcome, Outcome 1 Death or serious maternal morbidity.

Comparison 1 Primary outcome, Outcome 2 Death or serious infant morbidity.

Comparison 2 Secondary maternal outcomes, Outcome 1 Vaginal birth.

Comparison 2 Secondary maternal outcomes, Outcome 2 Caesarean section.

Comparison 2 Secondary maternal outcomes, Outcome 3 Uterine rupture.

Comparison 2 Secondary maternal outcomes, Outcome 4 Haemorrhage or need for blood transfusion.

Comparison 2 Secondary maternal outcomes, Outcome 5 Hysterectomy.
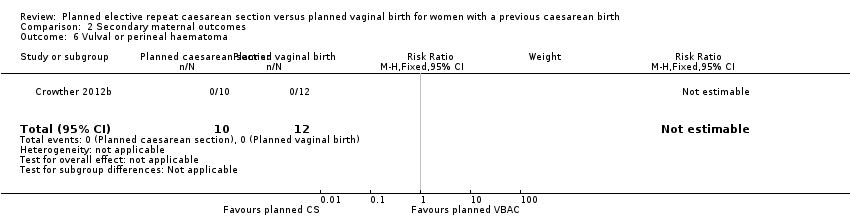
Comparison 2 Secondary maternal outcomes, Outcome 6 Vulval or perineal haematoma.
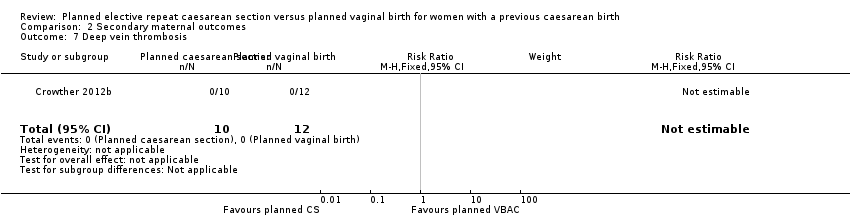
Comparison 2 Secondary maternal outcomes, Outcome 7 Deep vein thrombosis.

Comparison 2 Secondary maternal outcomes, Outcome 8 Pulmonary embolus.

Comparison 2 Secondary maternal outcomes, Outcome 9 Pneumonia.
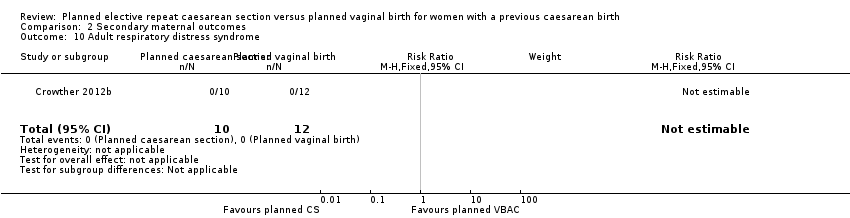
Comparison 2 Secondary maternal outcomes, Outcome 10 Adult respiratory distress syndrome.

Comparison 2 Secondary maternal outcomes, Outcome 11 Wound Infection.

Comparison 2 Secondary maternal outcomes, Outcome 12 Wound dehiscence.

Comparison 2 Secondary maternal outcomes, Outcome 13 Organ damage.

Comparison 2 Secondary maternal outcomes, Outcome 14 Development of fistula.

Comparison 2 Secondary maternal outcomes, Outcome 15 Bowel obstruction.

Comparison 2 Secondary maternal outcomes, Outcome 16 Pulmonary oedema.

Comparison 2 Secondary maternal outcomes, Outcome 17 Stroke.

Comparison 2 Secondary maternal outcomes, Outcome 18 Cardiac arrest.

Comparison 2 Secondary maternal outcomes, Outcome 19 Respiratory arrest.

Comparison 2 Secondary maternal outcomes, Outcome 20 Maternal death.

Comparison 3 Secondary infant outcomes, Outcome 1 Perinatal death.

Comparison 3 Secondary infant outcomes, Outcome 2 Apgar score less than 7 at 5 minutes.

Comparison 3 Secondary infant outcomes, Outcome 3 Birthweight.

Comparison 3 Secondary infant outcomes, Outcome 4 Intensive care unit admission.

Comparison 3 Secondary infant outcomes, Outcome 5 Birth trauma.

Comparison 3 Secondary infant outcomes, Outcome 6 Seizures.

Comparison 3 Secondary infant outcomes, Outcome 7 Neonatal encephalopathy.

Comparison 3 Secondary infant outcomes, Outcome 8 Severe respiratory distress syndrome.

Comparison 3 Secondary infant outcomes, Outcome 9 Necrotising enterocolitis.

Comparison 3 Secondary infant outcomes, Outcome 10 Systemic infection.
| Outcome or subgroup title | No. of studies | No. of participants | Statistical method | Effect size |
| 1 Death or serious maternal morbidity Show forest plot | 1 | 22 | Risk Ratio (M‐H, Fixed, 95% CI) | 0.0 [0.0, 0.0] |
| 2 Death or serious infant morbidity Show forest plot | 1 | 22 | Risk Ratio (M‐H, Fixed, 95% CI) | 0.0 [0.0, 0.0] |
| Outcome or subgroup title | No. of studies | No. of participants | Statistical method | Effect size |
| 1 Vaginal birth Show forest plot | 1 | 22 | Risk Ratio (M‐H, Fixed, 95% CI) | 0.34 [0.09, 1.29] |
| 2 Caesarean section Show forest plot | 1 | 22 | Risk Ratio (M‐H, Fixed, 95% CI) | 1.92 [0.92, 4.01] |
| 3 Uterine rupture Show forest plot | 1 | 22 | Risk Ratio (M‐H, Fixed, 95% CI) | 0.0 [0.0, 0.0] |
| 4 Haemorrhage or need for blood transfusion Show forest plot | 1 | 22 | Risk Ratio (M‐H, Fixed, 95% CI) | 1.2 [0.20, 7.05] |
| 5 Hysterectomy Show forest plot | 1 | 22 | Risk Ratio (M‐H, Fixed, 95% CI) | 0.0 [0.0, 0.0] |
| 6 Vulval or perineal haematoma Show forest plot | 1 | 22 | Risk Ratio (M‐H, Fixed, 95% CI) | 0.0 [0.0, 0.0] |
| 7 Deep vein thrombosis Show forest plot | 1 | 22 | Risk Ratio (M‐H, Fixed, 95% CI) | 0.0 [0.0, 0.0] |
| 8 Pulmonary embolus Show forest plot | 1 | 22 | Risk Ratio (M‐H, Fixed, 95% CI) | 0.0 [0.0, 0.0] |
| 9 Pneumonia Show forest plot | 1 | 22 | Risk Ratio (M‐H, Fixed, 95% CI) | 0.0 [0.0, 0.0] |
| 10 Adult respiratory distress syndrome Show forest plot | 1 | 22 | Risk Ratio (M‐H, Fixed, 95% CI) | 0.0 [0.0, 0.0] |
| 11 Wound Infection Show forest plot | 1 | 22 | Risk Ratio (M‐H, Fixed, 95% CI) | 0.0 [0.0, 0.0] |
| 12 Wound dehiscence Show forest plot | 1 | 22 | Risk Ratio (M‐H, Fixed, 95% CI) | 0.0 [0.0, 0.0] |
| 13 Organ damage Show forest plot | 1 | 22 | Risk Ratio (M‐H, Fixed, 95% CI) | 0.0 [0.0, 0.0] |
| 14 Development of fistula Show forest plot | 1 | 22 | Risk Ratio (M‐H, Fixed, 95% CI) | 0.0 [0.0, 0.0] |
| 15 Bowel obstruction Show forest plot | 1 | 22 | Risk Ratio (M‐H, Fixed, 95% CI) | 0.0 [0.0, 0.0] |
| 16 Pulmonary oedema Show forest plot | 1 | 22 | Risk Ratio (M‐H, Fixed, 95% CI) | 0.0 [0.0, 0.0] |
| 17 Stroke Show forest plot | 1 | 22 | Risk Ratio (M‐H, Fixed, 95% CI) | 0.0 [0.0, 0.0] |
| 18 Cardiac arrest Show forest plot | 1 | 22 | Risk Ratio (M‐H, Fixed, 95% CI) | 0.0 [0.0, 0.0] |
| 19 Respiratory arrest Show forest plot | 1 | 22 | Risk Ratio (M‐H, Fixed, 95% CI) | 0.0 [0.0, 0.0] |
| 20 Maternal death Show forest plot | 1 | 22 | Risk Ratio (M‐H, Fixed, 95% CI) | 0.0 [0.0, 0.0] |
| Outcome or subgroup title | No. of studies | No. of participants | Statistical method | Effect size |
| 1 Perinatal death Show forest plot | 1 | 22 | Risk Ratio (M‐H, Fixed, 95% CI) | 0.0 [0.0, 0.0] |
| 2 Apgar score less than 7 at 5 minutes Show forest plot | 1 | 22 | Risk Ratio (M‐H, Fixed, 95% CI) | 0.0 [0.0, 0.0] |
| 3 Birthweight Show forest plot | 1 | 22 | Mean Difference (IV, Fixed, 95% CI) | ‐133.0 [‐513.12, 247.12] |
| 4 Intensive care unit admission Show forest plot | 1 | 22 | Risk Ratio (M‐H, Fixed, 95% CI) | 0.0 [0.0, 0.0] |
| 5 Birth trauma Show forest plot | 1 | 22 | Risk Ratio (M‐H, Fixed, 95% CI) | 0.0 [0.0, 0.0] |
| 6 Seizures Show forest plot | 1 | 22 | Risk Ratio (M‐H, Fixed, 95% CI) | 0.0 [0.0, 0.0] |
| 7 Neonatal encephalopathy Show forest plot | 1 | 22 | Risk Ratio (M‐H, Fixed, 95% CI) | 0.0 [0.0, 0.0] |
| 8 Severe respiratory distress syndrome Show forest plot | 1 | 22 | Risk Ratio (M‐H, Fixed, 95% CI) | 0.0 [0.0, 0.0] |
| 9 Necrotising enterocolitis Show forest plot | 1 | 22 | Risk Ratio (M‐H, Fixed, 95% CI) | 0.0 [0.0, 0.0] |
| 10 Systemic infection Show forest plot | 1 | 22 | Risk Ratio (M‐H, Fixed, 95% CI) | 0.0 [0.0, 0.0] |