| 1 Positive respiratory culture for P. aeruginosa (Gibson 2003) Show forest plot | 1 | | Odds Ratio (M‐H, Fixed, 95% CI) | Totals not selected |
|
| 1.1 At 1 month | 1 | | Odds Ratio (M‐H, Fixed, 95% CI) | 0.0 [0.0, 0.0] |
| 1.2 At 2 months | 1 | | Odds Ratio (M‐H, Fixed, 95% CI) | 0.0 [0.0, 0.0] |
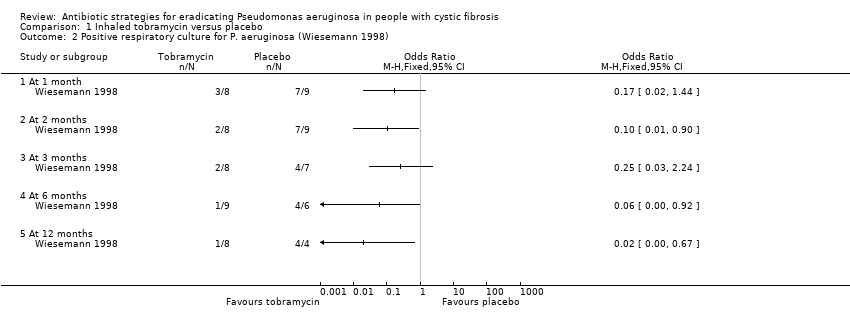
| 2 Positive respiratory culture for P. aeruginosa (Wiesemann 1998) Show forest plot | 1 | | Odds Ratio (M‐H, Fixed, 95% CI) | Totals not selected |
|
| 2.1 At 1 month | 1 | | Odds Ratio (M‐H, Fixed, 95% CI) | 0.0 [0.0, 0.0] |
| 2.2 At 2 months | 1 | | Odds Ratio (M‐H, Fixed, 95% CI) | 0.0 [0.0, 0.0] |
| 2.3 At 3 months | 1 | | Odds Ratio (M‐H, Fixed, 95% CI) | 0.0 [0.0, 0.0] |
| 2.4 At 6 months | 1 | | Odds Ratio (M‐H, Fixed, 95% CI) | 0.0 [0.0, 0.0] |
| 2.5 At 12 months | 1 | | Odds Ratio (M‐H, Fixed, 95% CI) | 0.0 [0.0, 0.0] |
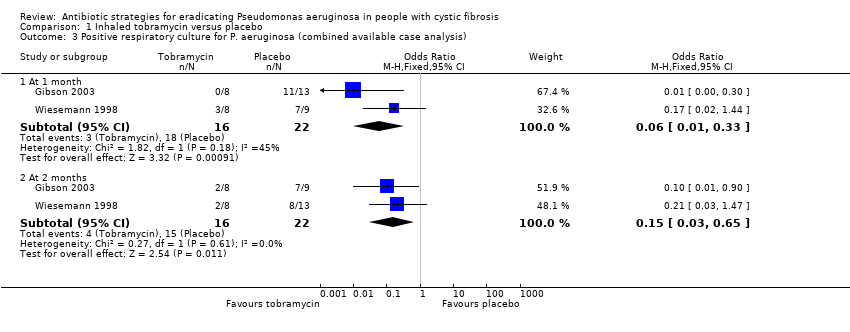
| 3 Positive respiratory culture for P. aeruginosa (combined available case analysis) Show forest plot | 2 | | Odds Ratio (M‐H, Fixed, 95% CI) | Subtotals only |
|
| 3.1 At 1 month | 2 | 38 | Odds Ratio (M‐H, Fixed, 95% CI) | 0.06 [0.01, 0.33] |
| 3.2 At 2 months | 2 | 38 | Odds Ratio (M‐H, Fixed, 95% CI) | 0.15 [0.03, 0.65] |
| 4 Positive respiratory culture for P. aeruginosa (combined) ‐ best case Show forest plot | 2 | | Odds Ratio (M‐H, Fixed, 95% CI) | Subtotals only |
|
| 4.1 At 1 month | 2 | 39 | Odds Ratio (M‐H, Fixed, 95% CI) | 0.06 [0.01, 0.30] |
| 4.2 At 2 months | 2 | 39 | Odds Ratio (M‐H, Fixed, 95% CI) | 0.14 [0.03, 0.60] |
| 4.3 At 3 months | 1 | 18 | Odds Ratio (M‐H, Fixed, 95% CI) | 0.14 [0.02, 1.16] |
| 4.4 At 6 months | 1 | 18 | Odds Ratio (M‐H, Fixed, 95% CI) | 0.04 [0.00, 0.48] |
| 4.5 At 12 months | 1 | 18 | Odds Ratio (M‐H, Fixed, 95% CI) | 0.01 [0.00, 0.26] |
| 5 Positive respiratory culture for P. aeruginosa (combined) ‐ worst case Show forest plot | 2 | | Odds Ratio (M‐H, Fixed, 95% CI) | Subtotals only |
|
| 5.1 At 1 month | 2 | 39 | Odds Ratio (M‐H, Fixed, 95% CI) | 0.08 [0.02, 0.38] |
| 5.2 At 2 months | 2 | 39 | Odds Ratio (M‐H, Fixed, 95% CI) | 0.18 [0.04, 0.73] |
| 5.3 At 3 months | 1 | 18 | Odds Ratio (M‐H, Fixed, 95% CI) | 0.36 [0.05, 2.77] |
| 5.4 At 6 months | 1 | 18 | Odds Ratio (M‐H, Fixed, 95% CI) | 0.16 [0.01, 1.83] |
| 5.5 At 12 months | 1 | 18 | Odds Ratio (M‐H, Fixed, 95% CI) | 0.36 [0.05, 2.77] |
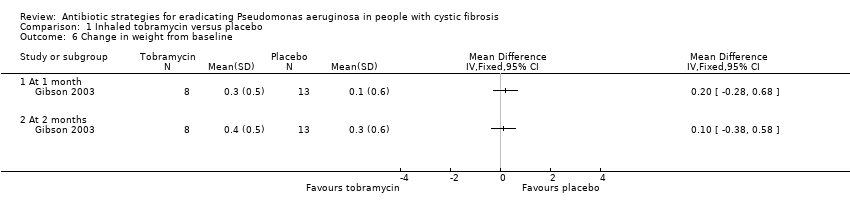
| 6 Change in weight from baseline Show forest plot | 1 | | Mean Difference (IV, Fixed, 95% CI) | Totals not selected |
|
| 6.1 At 1 month | 1 | | Mean Difference (IV, Fixed, 95% CI) | 0.0 [0.0, 0.0] |
| 6.2 At 2 months | 1 | | Mean Difference (IV, Fixed, 95% CI) | 0.0 [0.0, 0.0] |
| 7 Adverse events Show forest plot | 1 | | Odds Ratio (M‐H, Fixed, 95% CI) | Totals not selected |
|
| 7.1 Cough | 1 | | Odds Ratio (M‐H, Fixed, 95% CI) | 0.0 [0.0, 0.0] |
| 8 Change in modified Shwachmann score from baseline Show forest plot | 1 | | Mean Difference (IV, Fixed, 95% CI) | Totals not selected |
|
| 8.1 At 1 month | 1 | | Mean Difference (IV, Fixed, 95% CI) | 0.0 [0.0, 0.0] |
| 8.2 At 2 months | 1 | | Mean Difference (IV, Fixed, 95% CI) | 0.0 [0.0, 0.0] |