多発性硬化症に対する食事介入
アブストラクト
背景
臨床および実験的なデータにより、一定の食事レジメン、特に多価不飽和脂肪酸(PUFA)およびビタミンを含む食事が多発性硬化症(MS)患者のアウトカムを改善する可能性が示唆されている。食事および栄養補助食品は疾患アウトカムを改善し従来の治療の有効性の限界を超えるものと思われることからMS患者に多く用いられている。 本レビューはコクラン・レビュー「Dietary intervention for multiple sclerosis」(コクラン・ライブラリ2007年第1号に最初に発表)の更新版である。
目的
MSに対する食事レジメンの有効性および安全性に関するMS患者の疑問に答えること。食事習慣の変更はMS患者に対する有効な介入となりうるか。上記の介入の副作用可能性は明らかになっているか。測定されているか。食事介入とその他の既知の治療処置又は対症療法との間に相互作用の可能性があるか。それらについて検討されているか。
検索戦略
Cochrane Multiple Sclerosis and Rare Diseases of the Central Nervous System Group Specialised Register(2011年11月)、CENTRAL(コクラン・ライブラリ2011年第4号)、MEDLINE (PubMed)(1966年~2011年11月)、EMBASE(embase.com)(1974年~2011年11月)および認められた論文の参考文献リストを検索した。
選択基準
ビタミンD補充を除く特定の食事介入、食事計画又は栄養補助食品を食事調整なし又はプラセボと比較する全比較試験[ランダム化比較試験(RCT)および比較臨床試験(CCT)]を適格とした。
データ収集と分析
2名のレビューアが別々に論文を選択し、試験の質を評価しデータを抽出した。データをRevManに入力し分析した。 二値データは相対リスク(RR)として95%信頼区間(95%CI)で表し、異質性存在下、ランダム効果モデルを用いた(I2 > 60%)。連続データは重み付け平均差を用いて分析し、介入前後の変化の治療群および対照群間の差で判定した。
主な結果
ランダム化された患者794名を対象に検索戦略から得たPUFAを検討する6件のRCT。 PUFAは、24ヵ月目では疾患進行に対する有意な効果を示さなかった。オメガ‐6脂肪酸(11g/日~23 g/日のリノール酸)は144名のMS患者で効果を示さなかった(RR 1.04、95%CI 0.66~1.63)。リノール酸(2.9 g/日~3.4 g/日)は慢性の進行性MS患者65名に対し有益ではなかった(RR 0.78、95%CI 0.43~1.42)。オメガ‐3脂肪酸は再発寛解型MS患者292名に対し有益ではなかった(RR 0.82、95%CI 0.65~1.03、P = 0.08)。 再発アウトカムにおける僅かな利益の可能性は、一部試験ではオメガ‐6脂肪酸と関連したが、上記所見はエンドポイントの妥当性低下という限界があった。安全性又は患者報告によるアウトカムは判断不可能であった。一般的に、試験の質は不良であった。 ビタミン補充およびアレルゲン非含有の食事に関する試験は、主に臨床アウトカム不足のため適格基準に合致するものがなく、分析対象とはならなかった。
著者の結論
PUFAはMSの主要臨床アウトカム(疾患進行)に対し大きな影響をもたらさないように思われたが、2年間にわたり再発頻度低下の傾向を認める可能性がある。しかし、質が不確定なためPUFA補充の真の利益又は有害性を評価するには入手可能なデータが不十分である。 MSに対するビタミン補充およびアンチオキシダント補給剤の利益およびリスクの可能性に関するエビデンスが不足している。MSに対する食事介入の有効性を評価するにはさらなる研究が必要である。
PICO
一般語訳
多発性硬化症(MS)の補助治療としての食事介入
利用可能な従来の治療の有効性が部分的で、副作用を引き起こす可能性があるため、大半のMS患者が補完的な代替医療、すなわち通常は特定の食事および栄養補助食品による治療を受けています。実際、「食事」および「多発性硬化症」の用語を用いたインターネット検索では2,700万ものリンクが表示され、上記治療は広範に用いられ、MS患者集団はその効果を信じていることが示されました。最も一般的な食事介入は、多価不飽和脂肪酸(PUFA)、アレルゲン非含有(グルテンおよびミルク)の食事、ビタミンおよび微量栄養素、並びにセレニウム、イチョウの葉抽出物およびコエンザイムQ10などのアンチオキシダント補充です。 本レビューのレビューアらは、食事習慣の変更によりMS患者の予後に望ましい影響があるかどうかの評価を試みました。この分野では大量のデータが発表されていますが、患者総数794名を対象とするわずか6件のPUFAに関する比較試験が本レビューでの方法の品質の点で選択基準に合致しました。ビタミンおよび抗酸化補給剤に関する試験で、当該基準に合致するものは認められませんでした。科学データベースを広範囲に検索しましたが、その他のMSに対する食事介入案に関する論文は見出されませんでした。 利用可能なデータは、PUFA補給から得られる利益又は有害性の可能性を評価するには不十分でした。50%~75%のMS患者が食事レジメンおよび補給剤を使用している点から見ても、PUFAに関するエビデンスがなく、他の補給剤に関するデータが大幅に不足しているのは残念です。
Authors' conclusions
Background
This is an update of the Cochrane review "Dietary intervention for multiple sclerosis" (first published on The Cochrane Library 2007, Issue 1). The authors decided to exclude the vitamin D intervention from this review update as vitamin D is the subject of another recent Cochrane review.
Because available conventional therapies are only partially effective and may produce side effects, people with multiple sclerosis (MS) widely use treatments proposed by complementary and alternative medicine (CAM). Studies in several countries, including the United States, Canada, the Netherlands, Germany and Australia, showed that about a half to three quarters of MS patients use some form of CAM in conjunction with conventional medicine (www.MS‐CAM.org; Schwartz 1999; Bowling 2003; Leong 2009; Yadav 2010; O'Connors 2012). CAM therapies commonly used by people with MS are special diets and dietary supplements (Horowitz 2011). Many people with MS consider special diets as vital for improving their health status (Shinto 2004) and they use them particularly when they want to improve their sense of control over their disease (Ebers 1998; Schwarz 2005).
A rationale has been proposed for nutritional interventions in MS, evaluating at the molecular level the effects of dietary molecules on the inflammatory and autoimmune processes involved in MS (Riccio 2011). Nutritional status and dietary habits in MS patients have not been extensively studied or reported, however individual findings suggest that many patients suffer from various forms of malnutrition (Habek 2010). Several epidemiological studies have considered various nutritional factors in relation to MS, as summarised by Lauer (Lauer 1997), and dietary interventions appear to have the potential to favourably influence the prognosis of MS.
Description of the condition
MS is an inflammatory and demyelinating disease of the central nervous system. MS is the most important non‐traumatic cause of neurological disability in young adults, especially women, typically striking those aged between 20 and 40 years. Although MS etiology and pathogenesis remain poorly understood, it is widely accepted that the disease has an immune‐mediated basis and occurs in genetically susceptible individuals. Despite limited advances in treatments, there is still no cure. Management is also largely directed to relieving symptoms, which arise variably in the course of the disease.
Description of the intervention
Over the years, a number of diets for MS have been proposed to be effective, such as the Swank Diet and the Kousmine Diet (diets high in polyunsaturated fats and low in animal fats). Allergen‐free, gluten‐free, sucrose‐ and tobacco‐free, raw food, pectin‐ and fructose‐restricted diets, the Cambridge and other liquid diets, the Hebener diet, the Lowdown on Low Carb, and the Paleo diet have all been proposed. Supplementation with evening primrose oil, fish oils, vitamins, minerals, cerebrosides, aloe vera, and 'enzymes' as well as 'megascorbic' therapy are also quite common. A rationale for nutritional interventions in MS, provided by evaluating at the molecular level the effects of dietary molecules on the inflammatory and autoimmune processes involved in MS, has been proposed (Riccio 2011). Nutritional status and dietary habits in MS patients have not been extensively studied or reported, however individual findings suggest that many patients suffer from various forms of malnutrition (Habek 2010). Several epidemiological studies have considered various nutritional factors in relation to MS, as summarised by Lauer (Lauer 1997), and dietary interventions appear to have the potential to favourably influence the prognosis of MS.
How the intervention might work
Polyunsaturated fatty acid (PUFA) supplementation
Several ecological studies have shown that risk of MS is high in countries with a high intake of saturated fats and is low in countries with high intake of polyunsaturated fats (Swank 1950; Swank 1952; Agranoff 1974; Alter 1974; Butcher 1976; Nanji 1986; Lauer 1991; Malosse 1992; Lauer 1994; Esparza 1995; Lauer 1995). Nine out of 19 (47%) case‐control studies that investigated food consumption in different periods before MS onset found increased risk associated with animal fat or animal product consumption, or a protective effect of vegetable fats (Murrell 1990; Sepcic 1993; Lauer 1994 bis; Tola 1994; Wender 1994; Gusev 1996; Gronning (unpublished, reported by Lauer 1997); Ghadirian 1998; Zorzon 2003). Vegetable fats are a rich source of PUFAs, which include omega‐3 and omega‐6 fatty acids. Omega‐6 fatty acids include compounds such as linoleic acid and gamma‐linolenic acid. Examples of omega‐3 fatty acids include eicosapentanoic acid (EPA), docosahexanoic acid (DHA) and alpha‐linolenic acid (ALA). Several pathophysiological mechanisms were proposed as a rational basis for the therapeutic use of PUFAs for MS including immuno‐modulatory and anti‐inflammatory actions, effects on microcirculation and erythrocyte aggregation, antioxidant action, and also effects related to their role as constituents of the myelin membrane (Bates 1989 bis; Das 2003; Swank 2003; Schwarz 2005; Mehta 2009).
Vitamin B12 supplementation
Vitamin B12 plays a key role in myelin formation and is essential for the maintenance of nerve cells; it also has an immunomodulatory effect. Therefore, vitamin B12 deficiency may lead to deformed myelin and is associated with reduction of immunomodulatory and neurotrophic activities. Folates and vitamin B12 have fundamental roles in central nervous system (CNS) function at any age (Reynolds 2006). Relationships between MS and vitamin B12 have been suggested, but none have been confirmed (Miller 2005). Low or decreased levels of vitamin B12 were reported in MS patients (Crellin 1990; Reynolds 1992).
Other vitamins and antioxidant action
Free radicals and oxidative stress have roles in inflammatory processes and hence may be involved in the pathogenesis of MS. Some markers of oxidative damage, which may contribute to myelin and axonal injury, are increased in MS patients. In people with MS, and animal models of MS, products such as peroxynitrite and superoxide (reactive oxygen species (ROS)) are formed that are highly toxic to neurons (Gilgun‐Sherki 2004; Ferretti 2005; Koch 2006). Antioxidants, including vitamins A, C, and E, may decrease free radical‐induced cellular injury; this is the rationale for their use in MS. Other dietary supplements with antioxidant activity that are used in MS include alpha‐lipoic acid, selenium, preparations of Gingko biloba, coenzyme Q10 (CoQ10), and anthocyane preparations such as grape seed extract and pine bark extract.
Allergen‐free diet
Diets that are high in gluten and milk are generally much more common in areas characterised by elevated MS prevalence (Shatin 1964; Butcher 1976). An association between MS and food allergies has been hypothesised since the 1930s. The clinical course of MS, characterised by exacerbations and remissions, is similar to the clinical course of many allergic diseases (Ehrentheil 1952). Particular attention has focused on the hypothesis that cryptic gluten sensitivity may play a role in the neurological manifestations of MS (Ghezzi 2001).
Some studies suggest intestinal involvement in MS patients. For example, histological abnormalities were found in five of 12 patients with no gastrointestinal symptoms who had intestinal biopsies (Lange 1976). Furthermore, malabsorption tests in 52 MS patients found malabsorption in 40%, abnormal d‐xylose absorption in 27%, and abnormal jejunal mucosa in 13% of the patients (Gupta 1977).
Why it is important to do this review
A search on Google® (in English) on November 2011 using the search terms "diet" and "multiple sclerosis" retrieved over 27 million links, clearly indicating that many dietary regimens are widely used and strongly recommended in the MS consumer community. No other systematic review on this topic has been published in any scientific journal we were able to retrieve after a comprehensive search.
Objectives
The aim of this systematic review was to assess the efficacy and safety of dietary interventions (modifications to usual diet) in people with MS. Such interventions are undertaken with the expectation of modifying the course and prognosis of MS or at least improving health status.
The following primary questions were addressed.
1. Can changes in dietary habits be an effective intervention for MS patients?
2. Are the potential side effects of these interventions known, and have they been measured?
3. Are potential interactions between dietary interventions and other curative or symptomatic treatments known, and have they been studied?
Methods
Criteria for considering studies for this review
Types of studies
Randomised controlled trials (RCTs) and controlled clinical trials (CCTs) were considered. Our protocol specified that if RCTs or CCTs were both unavailable, we would have searched for and included data from observational studies (for example cohort, case‐control and cross‐sectional studies). Studies with historical controls, ecological studies and uncontrolled pre‐post evaluations (studies that used pretreatment data as the comparison for treatment effect, without randomising patient allocation) were excluded as these provide unreliable data for determining associations.
Types of participants
Adult patients with clinically definite MS according to Schumacher (Schumacher 1965), Poser (Poser 1983), Lublin (Lublin 1996), McDonald (McDonald 2001) or Polman (Polman 2005) criteria, regardless of age, sex, degree of disability, duration and course of the disease.
Types of interventions
Advice or instructions on a specific intervention in the usual diet (for example exclusion of a particular food type) or a diet plan or dietary supplementation, except for vitamin D supplementation, regardless of duration of intervention compared to no dietary modification or placebo.Studies reporting dietary interventions involving multiple components (for example PUFAs and vitamins), but not as a co‐intervention in both arms, would have been considered only if separate results for each component were available.
Types of outcome measures
Primary outcomes
Primary outcome measures in comparison groups at 12 months, 24 months and at the end of the scheduled follow‐up period in the primary studies
1. Patients with disease progression.
Disability progression has been defined as a persistent worsening by at least one point in the Kurtzke Expanded Disability Status Scale (EDSS) (Kurtzke 1983) recorded by the physician out of relapse and confirmed by follow‐up assessment at six months. However, other definitions of disability progression as given in an identified paper were accepted, including an increase of at least one point in entry score (if baseline score < 5.5) and of at least a half‐point (if baseline score ≥ 5.5) in the EDSS, or a different time for confirmation. The EDSS is the most frequently used assessment in clinical studies on MS. It is based on the results of a neurologic examination and the patient's ability to walk. Scores range from 0 (no neurologic abnormality) to 10 (death from MS). Other disability measurement instruments were accepted provided they could be standardised to the EDSS.
2. Patients who had at least one exacerbation during the treatment and follow‐up period.
Exacerbation was defined as new symptoms or signs, or worsening of previous symptoms or signs, lasting more than 24 hours in the absence of fever, infection or concurrent steroid withdrawal and confirmed by the physician. However, other definitions of disability progression were accepted if provided by the original paper.
Patient‐reported outcomes (PROs)
3. Health related quality of life (HRQOL) assessed by validated instruments (e.g. SF‐36, MSQOL‐54).
The SF‐36 is a multi‐purpose short‐form health survey with 36 questions that examine eight domains to provide a general measure of health. It is a generic measure as opposed to the MSQOL‐54 that targets MS specifically (Vickrey 1995).
4. Cognitive functions assessed by validated instruments (e.g. Brief Repeatable Battery of Neuropsychological Tests (BRBNT)).
BRBNT consists of five tests including measures of visual and acoustic sustained attention, verbal learning and delayed recall, visuo‐spatial learning and delayed recall, and semantic retrieval (Rao 1991).
5. Physical (i.e. fatigue, spasticity, spasms, pain, bladder function, bowel symptoms) or psychological (depression, psychological well‐being, stress) symptoms that are patient‐reported by validated questionnaires or scales (e.g. the Modified Fatigue Impact Scale (MFIS); the Mental Health Inventory (MHI)).
The MFIS was designed to probe the perception of the impact of fatigue on daily activities in people with MS, where higher scores indicate increased perception of fatigue (Fischer 1999). The MHI is a measure of overall emotional functioning covering a wide range of negative and positive emotions; higher scores indicate better mental health (Vickrey 1997).
Safety outcomes
6. Patients who experienced adverse events.
Adverse events were categorised as mild, moderate or severe according to internationally accepted criteria (www.WHO‐UMC.org).
7. Patients who discontinued treatment because of adverse events.
Secondary outcomes
8. Change in disability score (DSS or EDSS) from baseline to the end of the follow‐up period.
Search methods for identification of studies
We revised the search strategy from the previous version of this review and conducted a comprehensive search to identify all relevant studies regardless of language or publication status.
Electronic searches
In the original review, we examined and selected RCTs up to March 2006. Details are listed in Appendix 1.
The present update includes trials from April 2006 to November 2011. Trials were identified using:
1. Cochrane Multiple Sclerosis and Rare Diseases of the Central Nervous System Group Specialised Register (17 November 2011) (Appendix 2);
2. Cochrane Central Register of Controlled Trials (CENTRAL) (2011, Issue 4) (Appendix 3);
3. MEDLINE (PubMed) (2006 to 17 November 2011) (Appendix 4);
4. EMBASE (embase.com) (2006 to 17 November 2011) (Appendix 5).
Searching other resources
-
AIFA (http://www.agenziafarmaco.gov.it) (accessed 9 November 2011)
-
ClinicalTrials.gov (http://clinicaltrials.gov) (accessed 9 November 2011)
-
EMEA (http://www.ema.europa.eu/) (accessed 15 November 2011)
-
Iranian Registry of Clinical Trials (http://www.irct.ir) (accessed 15 November 2011)
Data collection and analysis
Studies were allocated to one of the following categories based on the rationale of the intervention as stated in the background section of the paper: PUFA; vitamins; allergen‐free diets. The subsequent analyses were performed for each intervention category. If a study reported a dietary intervention supplying multiple components, and results for each component were available, we included the study; otherwise the study was excluded.
Selection of studies
Two review authors (MF, LV) independently assessed the titles and abstracts of studies resulting from the searches. We obtained full copies of all relevant and potentially relevant studies, that is those appearing to meet the inclusion criteria and those for which there were insufficient data in the title and abstract to make a clear decision. The two authors then independently assessed full texts and resolved any disagreement on the eligibility of included studies through discussion and consensus. The two review authors were not blinded to the names of the authors, their institutions, the journal or the journal publisher.
Data extraction and management
Two review authors (MF, LV) independently extracted data from studies meeting the inclusion criteria described above. The data were extracted using a predefined data extraction form created as a Microsoft Excel® spreadsheet and entered into RevMan; all entries were re‐checked by both authors, and all disagreements were resolved by discussion.
The following details were extracted: (1) study design; (2) characteristics of study participants (diagnosis, disease course, age, sex, specific inclusion and exclusion criteria, clinical setting, clinical baseline characteristics); (3) number and distribution of patients who dropped out or withdrew; (4) a full description of the dietary intervention (type, components, frequency, dose and duration); (5) the comparison (alternative dietary treatment, placebo, no dietary treatment); (6) clinical outcome measurement instruments, clinical outcomes and scores (disability or exacerbation) at specified follow‐up times; (7) type of PRO instruments and results at specified follow‐up times; (8) type and the severity of adverse events, and numbers of patients who discontinued treatment because of adverse events.
Assessment of risk of bias in included studies
Criteria for risk of bias assessment were based on the Cochrane Handbook for Systematic Reviews of Interventions Version 5.1.0 (Higgins 2011). The quality of the studies was assessed independently by two review authors (MF, LV). Any disagreement was resolved by discussion among review authors.
The following domains were assessed as 'Low risk', 'Unclear risk' or 'High risk':
-
random sequence generation (selection bias);
-
allocation concealment (selection bias);
-
blinding of outcome assessment (detection bias);
-
incomplete outcome data (attrition bias), defined as 'High risk' when losses to follow‐up were more than 15% and unbalanced between arms;
-
other bias.
Risk of bias descriptions were reported in the 'Risk of bias in included studies' tables.
Measures of treatment effect
The analysis was performed separately for each intervention category. For dichotomous data, results from studies were summarised as relative risks (RR) with 95% confidence intervals (95% CI). Continuous data were analysed using weighted mean differences (WMD) determined (in order to take pre‐experiment group differences into account) from the difference between the pre‐ and post‐intervention changes in the treatment and control groups. For each outcome we limited the analysis to trials that included patients with a similar disease course (relapsing remitting (RR) MS, chronic progressive (CP) MS). If a study reported different doses for a intervention, the highest dose was considered in the analysis.
Dealing with missing data
For missing data we contacted the authors of primary study reports and asked them to provide additional information.
Assessment of heterogeneity
Heterogeneity, as a measure of differences between studies, was assessed using the I² statistic for heterogeneity. If heterogeneity was found and it was considered relevant (I² > 80%), no pooled estimate of treatment effect was calculated. If heterogeneity was found but it was not considered to be a serious source of bias (I² > 60%), then a random‐effects model was used. If no heterogeneity was found then a fixed‐effect model was used.
Data synthesis
Analysis was performed separately for each intervention category. Dichotomous data were summarised as RR with 95% CI, using a random‐effects model if heterogeneity was found (I² > 60%). Continuous data were analysed using the WMD. For all statistical analyses we used the Cochrane Collaboration's Review Manager software (RevMan 5.1.7).
Subgroup analysis and investigation of heterogeneity
We planned to carry out analyses separately for each intervention category. Lack of data did not permit a subgroup analysis based on MS course (RRMS, CPMS etc.). We assessed clinical heterogeneity by examining the reported characteristics of participants, interventions and outcomes as specified in the criteria for the included studies.
Statistical heterogeneity was assessed using a Chi2 test and the I2 statistic. We considered heterogeneity to be significant when the P value was less than 0.10 (Higgins 2003).
Sensitivity analysis
Although not planned in the review protocol, we performed sensitivity analyses to verify the presence of bias due to unequal distribution of losses to follow‐up in the studies and between study's arms. We used the total number of randomised patients as denominator and assumed that all missing participants (lost to follow‐up) experienced the outcome event.
Results
Description of studies
Salient particulars of the trial design, participants, interventions, and outcomes of the studies meeting the inclusion criteria are summarised in the table Characteristics of included studies.
Results of the search
Of the 923 references identified by the search up to March 2006, 37 abstracts were provisionally selected to be read as full papers. Initial disagreement occurred for two papers but was resolved by discussion. A further 31 papers were subsequently excluded. The remaining six studies contributed to this review (see details in Figure 1) and were all related to PUFA diets.

Study flow diagram (up to March 2006).
Our 2011 search identified 2864 references screened by two review authors (MF, LV). Thirteen studies were selected as full papers or the published protocol for consideration; none met the inclusion criteria (Figure 2).

PRISMA flowchart (2006‐17 November 2011).
Included studies
PUFA supplementation
Six RCTs on PUFA supplementation were selected, published between 1973 and 2005 (Millar 1973; Bates 1977; Bates 1978; Paty 1978; Bates 1989; Weinstock‐Guttman 2005) (see Characteristics of included studies). Overall, these studies accounted for 794 randomised patients, 395 allocated to PUFA and 399 to oleic acid (control arm); however, 75 patients (36 PUFA patients and 39 controls) were not included in the analyses reported in these papers.
Sample size and participants
Millar 1973 randomised 87 patients (60% women) with defined MS from two centres (Belfast and London); all were neurologically stable and had a Disability Status Scale (DSS) score < 6. Patients were excluded if they had previously taken sunflower seed oil. Millar 1973 Belfast randomised only RRMS patients, while no information was available for Millar 1973 London.
Bates 1977 randomised 152 patients with CPMS. No other inclusion or exclusion criteria were reported.
Bates 1978 randomised 116 RRMS patients (69% women). No other inclusion or exclusion criteria were reported. In Bates 1977 and Bates 1978 participants were allocated to four arms, two with treatment (sunflower seed oil spread and Naudicelle oil capsules) and two control groups.
Paty 1978 randomised 96 patients (53% women) with defined MS without major details; they were able to walk with a walking aid and those with serious concomitant disease or significant MS‐related dementia were excluded. No other inclusion or exclusion criteria were reported.
Bates 1989 randomised 312 RRMS patients (68% women); eligible patients had a DSS score ≤ 6 and at least two documented relapses, the last one of which had to occur in the two years prior to randomisation.
Weinstock‐Guttman 2005 randomised 31 patients (85% women) with RRMS in a stable phase of disease over the preceding two months and with at least one documented relapse over the preceding three years. Concomitant use of immunomodulator treatments was permitted.
Average disease duration was uneven across trials: 9.2 versus 7.7 years in the treated and control group (Millar 1973), 7 versus 6 (Bates 1978), 13 versus 16 (Paty 1978), 6.5 versus 6.6 (Bates 1989) and 6.9 versus 4.6 years (Weinstock‐Guttman 2005).
Interventions
The following interventions were compared with oleic acid (control intervention).
• Supplementation with omega‐6 fatty acids (N‐6 PUFA) ‐ linoleic acid as a spread: 11.5 g/day (Bates 1977), 17 g/day (Paty 1978), 17.2 g/day (Millar 1973) and 23 g/day (Bates 1978).
• Supplementation with omega‐6 fatty acids (N‐6 PUFA) ‐ linoleic and linolenic acid as capsule: 3.42 g/day plus 0.36 g/day (Bates 1977) and 2.92 g/day plus 0.34 g/day (Bates 1978).
• Supplementation with omega‐3 fatty acids (N‐3 PUFA) ‐ fish oil capsules: 1.71 g /day EPA and 1.14 g/day DHA (Bates 1989), 1.98 g/day EPA and 1.32 g/day DHA (Weinstock‐Guttman 2005).
The interventions were given for 24 (Millar 1973; Bates 1977; Bates 1978; Bates 1989), 12 (Weinstock‐Guttman 2005), or 30 months (Paty 1978).
Clinical outcomes
All the included studies specified a clinical effect as outcome of the PUFA diet.
1. Proportion of patients who had progression of disability measured by Kurtzke DSS or EDSS at 12 months (Weinstock‐Guttman 2005) or 24 months (Millar 1973; Bates 1977; Bates 1989).
2. Proportion of patients who had at least one relapse at 12 months (Weinstock‐Guttman 2005) (data not published) or 24 months (Millar 1973; Bates 1978).
3. Relapse rate and the standard deviations (or standard errors) at 24 months were available from two studies (Millar 1973; Bates 1978). Other studies included this outcome but neither the baseline nor the end‐of‐trial standard deviations (or standard errors) were reported (Bates 1977; Paty 1978; Bates 1989).
4. Change in Kurtzke DSS or EDSS from baseline to 12 months (Weinstock‐Guttman 2005) (secondary outcome, data not published), 24 months (Millar 1973) or 30 months (Paty 1978) was also measured but the standard deviations (or standard errors) were not reported.
Patient‐reported outcomes
Weinstock‐Guttman 2005 compared the Physical Component Scale (PCS) of the Short Form Health Survey Questionnaire (SF‐36), Modified Fatigue Impact Scale (MFIS) and Mental Health Inventory (MHI) scores at one, six and 12 months with those at baseline in treated and control patients.
Excluded studies
Salient particulars for studies that didn't meet the inclusion criteria are summarised in the table Characteristics of excluded studies.
PUFA supplementation
Of 21 studies on PUFA supplementation, 15 were excluded based on the following criteria. Two RCTs reported only biochemical outcomes (Paty 1975; Yadav 2005). Seven studies were uncontrolled pre‐post studies in which pretreatment data were used for comparison and patient allocation was not randomised, as required in a cross‐over design (Shenton 1975; Meyer‐Rienecker 1976; Horrobin 1979; Rosnowska 1980; Cendrowski 1986; Fitzgerald 1987; Nordvik 2000). Gallai 1995 was an open label study with healthy controls and only biochemical outcomes. Dworkin 1984 was a re‐analysis of three RCTs. Odinak 2002 was a retrospective case‐control study. Zhang 2000 was a cohort study. Schwarz 1970 and Swank 1990 were case series.
From the new strategy (2006 to 2011) two trials emerged: Harbige 2007 referred to study data (reference number 94) that were unavailable because they were never published; Shinto 2009 was an uncontrolled study on omega‐3 fatty acid supplementation for 10 RRMS patients.
Other vitamin supplementation
One RCT met our inclusion criteria (Wade 2002); however the study was excluded because both the treatment and control groups received a component of active treatment (1000 µg vitamin B12 each week through the study) while the treatment group also received lofepramine and phenylalanine. Seven observational studies on other vitamins were also excluded as they did not meet our inclusion criteria (Schwarz 1970; Schultz 1984; Jensen 1986; Mai 1990; Kira 1994; Zhang 2001; Odinak 2002).
From the new strategy (2006 to 2011) only one trial emerged and was excluded because of multiple co‐interventions (Bisaga 2011).
Allergen‐free diet
Of the three studies identified, none met our inclusion criteria. One was a case‐control study (Hewson 1984) and it was excluded because only laboratory outcomes were assessed; the other two were uncontrolled pre‐post studies (Ehrentheil 1952; Liversedge 1977).
Other diets and dietary supplementation
From the new strategy (2006 to 2011) four studies emerged on other dietary supplementation and were all excluded: Lebrun 2006 was an observational, prospective, open label study on levocarnitine supplementation; Reese 2009 was a case report on dietary supplementation (2 g each of glutathione, N acetyl‐cysteine and taurine daily, and lithium orotate 300 mg twice daily) in order to reduce oxidative stress and excito‐toxicity (implicated in secondary progressive MS); Mohammad Shirazi 2007 was a descriptive study on macronutrients; van Rensburg 2006 was an uncontrolled study on iron and folate‐vitamin B12, without a MS control group.
Other studies
When databases of registered trials were searched (November 2011), six ongoing studies emerged (see Figure 2) (AIFA 2005‐006071‐12; NCT00010842; NCT01037907; IRCT201102175855N1; NCT00852722; NCT01417273). Characteristics of these studies are summarised in Characteristics of ongoing studies.
Risk of bias in included studies
Risks of bias are summarised in Figure 3 and Figure 4.

Risk of bias summary: review authors' judgements about each risk of bias item for each included study.

Risk of bias graph: review authors' judgements about each risk of bias item presented as percentages across all included studies.
See Characteristics of included studies tables for detailed quality assessments of each included study. Overall, no study was judged as free of risk of bias; it's important to emphasise that most of the included studies were published when the requirement for a description of the methodological aspects was not as stringent as today (Millar 1973; Bates 1977; Bates 1978; Paty 1978; Bates 1989).
Allocation
None of the studies reported the method to implement sequence generation; very often they only stated "randomised study", without a more comprehensive description. Likewise, no study reported the method used for allocation. Only Millar 1973 and Bates 1978 stated that the treatment and placebo were similar in appearance to prevent masking disclosure.
Blinding
Detection bias may be present if outcome assessors are not blinded to patient assignment, as this can influence the assessments; such bias is avoided by blinding participants, assessors and caregivers. Except for Weinstock‐Guttman 2005, no other study reported how the examining physician was blinded to treatment allocation; nevertheless, it is unclear if the method of masking in Weinstock‐Guttman 2005 allowed an influence on some outcome measures.
Incomplete outcome data
All studies performed statistical analysis only on the number of patients who completed the study, not considering the whole number of randomised patients (that is without considering dropouts). Further, in Bates 1977 and Bates 1978 it was not specified if withdrawals were included in the analysis. Millar 1973 and Bates 1989 didn't report reasons for withdrawals and Paty 1978 didn't report which arm withdrawals belonged to. Weinstock‐Guttman 2005 reported the number lost to follow‐up as balanced between arms and with similar reasons for discontinuation, but unpublished data, provided by the authors, showed a high rate of losses for EDSS evaluation (33% in the treated patients and 75% in control patients).
Selective reporting
Baseline characteristics were not provided (Bates 1977) or were only reported for patients that remained in the study and were analysed at the end of the follow‐up period (Millar 1973; Paty 1978), allowing for a possible source of bias.
Other potential sources of bias
The most frequent potential bias was the timing of progression evaluation, with less than the minimum period of six months for confirmation of progression (Millar 1973; Bates 1977; Bates 1978; Bates 1989) and some baseline imbalance between arms (Millar 1973; Bates 1978; Bates 1989). Another bias may be present in two studies (Bates 1989; Weinstock‐Guttman 2005) characterised by the lack of a strictly untreated control group and by the presence of co‐interventions. Finally, it was not possible to retrieve the type of MS patients (RR or CP) for Millar 1973 and Paty 1978.
Other sources of bias are reported in the Characteristics of excluded studies tables.
Effects of interventions
Analyses were carried out with data reported by each trial and denominators were the number of patients followed during the study period and analysed (not the total number of patients randomised). Analyses were performed separately for each intervention category.
Omega‐6 fatty acids, spread of linoleic acid compared to oleic acid
(Millar 1973; Bates 1977; Paty 1978)
Information about disability progression at 24 months was available from two trials and 144 patients (Millar 1973; Bates 1977); the relative risk (RR) was 1.04 (95% CI 0.66 to 1.63, P = 0.87, I² = 57%) (Analysis 1.1).
Only two studies (Millar 1973; Bates 1978) reported data on patients' exacerbations (Analysis 1.2). The RR for the number of patients experiencing no relapses was 1.11 (95% CI 0.59 to 2.10, P = 0.74, I² = 16%); the RRs of experiencing 1, and 2 or 3 or more relapses were 1.38 (95% CI 0.95 to 1.99, P = 0.09, I² = 0%) and 0.61 (95% CI 0.38 to 0.97, P = 0.04, I² = 24%) respectively.
Sensitivity analysis showed no differences for the considered outcomes (data not shown) except for the number of patients experiencing three or more relapses, where the risk ratio was no longer statistically significant (RR 0.75, 95% CI 0.52 to 1.09, P = 0.13, I² = 0%).
Data on relapse rate were available from two studies and 132 patients (Millar 1973; Bates 1978). Weighted mean differences (WMD) of treatment effect were tested resulting in a small decrease in relapse rate at 24 months (WMD 0.79, 95% CI 0.63 to 1.00, P = 0.05) (Analysis 1.3). No significant heterogeneity was found between the two studies.
We were unable to calculate the mean EDSS change (secondary outcome) due to the lack of standard deviations (SD) and P values. In Millar 1973, the Kurtzke Disability Status Scale changed from 2.9 to 3.1 in the sunflower seed oil group (treated) and from 2.7 to 3.3 in the olive oil arm (controls), while in Paty 1978 the Kurtzke Disability Status Scale changed from 4.24 to 3.52 in the sunflower seed oil group and from 4.26 to 3.85 in the olive oil arm.
Omega‐6 fatty acids, capsules of linoleic acid compared to oleic acid
Information on progression after 24 months was available from one trial and 65 CPMS patients (Bates 1977). The RR of progression was 0.78 (95% CI 0.43 to 1.42, P = 0.42) (Analysis 2.1).
Information about patients with at least one exacerbation was available in one study for 58 RRMS patients evaluated at 24 months (Bates 1978). The RR of experiencing at least one exacerbation was 1.14 (95% CI 0.88 to 1.46, P = 0.32) (Analysis 2.2). Sensitivity analyses for each outcome did not modify the results (data not shown). The relapse rate at 24 months did not seem to decline after treatment (Analysis 2.3).
Omega‐3 fatty acids, capsules of fish‐oil (EPA and DHA) compared to oleic acid
(Bates 1989; Weinstock‐Guttman 2005)
The number of RRMS patients who experienced disease progression was given (personal communication, unpublished data) by Weinstock‐Guttman 2005 at 12 months and was presented by Bates 1989 at 24 months (Analysis 3.1).
Weinstock‐Guttman 2005 had data on this outcome only for 14 of the 31 randomised patients (RR 0.15, 95% CI 0.01 to 3.11, P = 0.22). Due to the high rate of losses to follow‐up, the sensitivity analysis modified the RR, showing an effect in favour of the treatment group (RR 0.41, 95% CI 0.19 to 0.87, P = 0.02). Bates 1989 presented data for 292 RRMS patients at 24 months (RR 0.82, 95% CI 0.65 to 1.03, P = 0.08) and the sensitivity analysis did not modify the RR (data not shown).
Only Weinstock‐Guttman 2005 provided data on the number of patients who experienced one or more relapses at 12 months (Analysis 3.2). The RR was 0.65 (95% CI 0.19 to 2.18, P = 0.48) and the sensitivity analysis did not modify the RR (data not shown).
Weinstock‐Guttman 2005 showed a slight benefit at six months favouring the experimental arm (fish oil group) in the Physical Component Scale (PCS) of the SF‐36 and in the MHI; however, the difference between the treated and control groups did not reach statistical significance at 12 months. A significant difference was seen in the fatigue scale of the MFIS at six months (P = 0.035) in favour of the control group (olive oil) but this benefit was uncertain at 12 months (P = 0.059).
Safety outcomes
No study reported any descriptions of adverse events. Only Paty 1978 provided the number of patients and the reason for withdrawal due to side effect (7 gastrointestinal intolerance, 5 weight gain, 2 depression, 1 rash and 1 death). No more information was available.
Other vitamins or allergen‐free diet
No studies were available.
Discussion
The aim of the present review was to assess the efficacy and safety of dietary interventions in MS patients. Thus, we searched for trials on all specific dietary interventions or supplementations in the usual diet or a specific diet plan. This was except for vitamin D supplementation as vitamin D is already the subject of another Cochrane review, "Vitamin D for the management of multiple sclerosis" (Jagannath 2010). That review included a single study with 49 participants (25 treated and 24 controls). The trial provided some evidence of a potential benefit of the intervention on several outcomes (annualised relapse rate, EDSS scores, suppression of T‐cell proliferation) and reported a relative absence of any adverse events. But, due to the absence of a comparison with other RCTs and the potential high risk of biases reported by the review authors, there could be limits on the applicability of the available evidence to the MS population as a whole.
All the dietary interventions for which we searched for published papers may have biological activities that would justify systematic research on their effects in MS. The literature on dietary interventions in MS is extensive but, after comprehensive searching of the scientific databases, we found only six PUFA trials. The design and quality of all the six included studies, as drawn from the published articles, were uncertain and we retrieved little evidence on the efficacy of the PUFA treatments. No RCTs on any other proposed dietary intervention were found. Thus, we were not able to form any judgement about other dietary interventions.
Summary of main results
Disease progression, the primary endpoint, was unaffected by PUFA administration for up to two years in any subtype of analysis.
Relapses seemed to be less frequent in patients treated with a PUFA spread. However, this weak effect disappeared when we applied a sensitivity analysis. This finding could be due to differences between baseline characteristics of the groups that were compared (selection bias), specially if considering the number of pre‐study relapses.
Disease progression didn't improve after 12 months for patients treated with fish oil capsules . When considering the sensitivity analysis, the result seemed in favour of the treatment arm but this was influenced by the very high losses to follow‐up rate, especially in the control arm (75% versus 33%), in a study with a small sample (a total of 31 randomised participants).
No study reported any description of adverse events; only Paty 1978 provided the number of withdrawals due to side effects. PROs were reporter by one study only (Weinstock‐Guttman 2005).
Overall completeness and applicability of evidence
To help assess the applicability of the findings, the population included in the trials should be described in detail. In the included studies the researchers enrolled participants of heterogeneous disease type, severity and duration of disease.
In this review only data on the use of PUFA were included in the analysis because no RCTs were available on any other dietary interventions.
This review was not able to answer the main questions posed by the consumers directly involved in the protocol writing. In the included studies the data on health related quality of life, cognitive functions, and physical or psychological symptoms that are highly demanded by consumers are lacking. To some extent the problem is historical as four studies were published in the 1970s, one in the 1980s, and only Weinstock‐Guttman 2005 has some reports on these outcomes.
Quality of the evidence
We found six RCTs available in literature that reported data for 794 randomised patients. The body of evidence identified didn't allow a robust conclusion regarding the objectives of the review because the trials that were analysed were prone to multiple biases. First, they differed in baseline characteristics, inclusion criteria and study design. They enrolled participants of variable number, disease type, severity and duration; they used different types and doses of PUFAs; and they planned different treatment durations and follow‐up periods. In particular, due to different treatment schedules, we were forced to split the analysis into homogeneous intervention categories. Second, some studies had large numbers of dropouts, and dropouts were never included in the analyses. With regard to compliance, some evidence emerged that adherence to dietary interventions was poor or unsatisfactory (Weinstock‐Guttman 2005).
Trial quality was poor and no studies were judged as free of potential biases; most of the risk of bias domains were judged to be unclear because of the lack of information provided by the studies. Baseline characteristics were often incomplete and reported only for patients that remained in the study and were analysed at the end of the follow‐up period. Most of studies didn't report how the examining physician was blinded to treatment allocation.
All studies performed statistical analysis only on the number of patients who completed the study, not considering the number of randomised participants. However, we must emphasise that most of the included studies were published when descriptions of methodological aspects were not as stringent as today.
Considering that none of the studies took reasonable steps to minimise the introduction of bias, all the findings must be viewed cautiously, especially when considering them in clinical practice.
Potential biases in the review process
We made attempts to limit bias in the review process by ensuring: i) a comprehensive search for potentially eligible studies; ii) standardisation of the review process.
In order to reduce the heterogeneity between trials, we split the analysis into homogeneous intervention categories. It is recommended that Cochrane reviews should seek to include all outcomes that are likely to be important to users of the review, but overall conclusions are more difficult to draw if there are multiple analyses.
Agreements and disagreements with other studies or reviews
We are not aware of any other systematic reviews that have covered this research question. We are in agreement with the editorials and descriptive reviews published in scientific journals (Payne 2001; Das 2003; Schwarz 2005; Namaka 2008; Habek 2010; Yadav 2010; Cutter 2011). A commentary had suggested that diets and dietary supplements that increase PUFA intake may produce beneficial effects in MS (Bowling 2003) when considering any study design, not only RCTs.
With the present review we are not able to confirm the positive results claimed in a broad case‐series study (Swank 1990) on a dietary treatment developed by Dr Roy Swank. Swank started a dietary approach for MS treatment in the 1940s, which is still widely recommended in the patient community. The main aim of the Swank diet is a drastic reduction of intake of saturated fat (< 15 g/day) and supplementation with vegetable oil and cod liver oil. The study design he used did not fit the inclusion criteria considered for this review and, as an observational study, a proper protocol and statistical tools will be necessary to analyse and discuss such a study.

Study flow diagram (up to March 2006).

PRISMA flowchart (2006‐17 November 2011).

Risk of bias summary: review authors' judgements about each risk of bias item for each included study.

Risk of bias graph: review authors' judgements about each risk of bias item presented as percentages across all included studies.
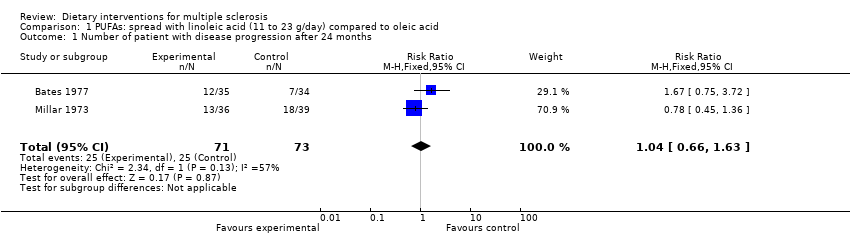
Comparison 1 PUFAs: spread with linoleic acid (11 to 23 g/day) compared to oleic acid, Outcome 1 Number of patient with disease progression after 24 months.

Comparison 1 PUFAs: spread with linoleic acid (11 to 23 g/day) compared to oleic acid, Outcome 2 Number of patients experiencing relapses.

Comparison 1 PUFAs: spread with linoleic acid (11 to 23 g/day) compared to oleic acid, Outcome 3 Relapse rate at 24 months.

Comparison 2 PUFAs: capsules with linoleic acid (2.9 to 3.4 g/day) compared to oleic acid, Outcome 1 Number of Chronic‐Progressive patients with disease progression after 24 months.
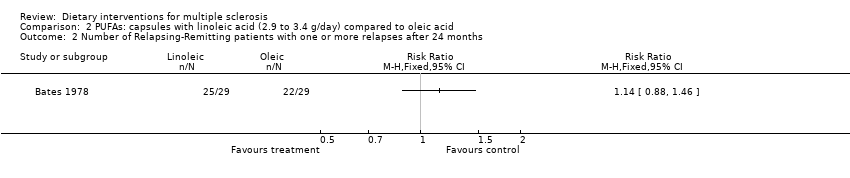
Comparison 2 PUFAs: capsules with linoleic acid (2.9 to 3.4 g/day) compared to oleic acid, Outcome 2 Number of Relapsing‐Remitting patients with one or more relapses after 24 months.

Comparison 2 PUFAs: capsules with linoleic acid (2.9 to 3.4 g/day) compared to oleic acid, Outcome 3 Relapse rate after 24 months in relapsing‐remitting patients.

Comparison 3 PUFAs: fish oil capsules with eicosapentaenoic acid + docosaexanoid acid (omega‐3 fatty acid) compared to oleic acid for RRMS patients, Outcome 1 Number of patients with disease progression.

Comparison 3 PUFAs: fish oil capsules with eicosapentaenoic acid + docosaexanoid acid (omega‐3 fatty acid) compared to oleic acid for RRMS patients, Outcome 2 Number of patients with one or more relapses after 12 months.
| Outcome or subgroup title | No. of studies | No. of participants | Statistical method | Effect size |
| 1 Number of patient with disease progression after 24 months Show forest plot | 2 | 144 | Risk Ratio (M‐H, Fixed, 95% CI) | 1.04 [0.66, 1.63] |
| 2 Number of patients experiencing relapses Show forest plot | 2 | 541 | Risk Ratio (M‐H, Fixed, 95% CI) | 0.91 [0.74, 1.13] |
| 2.1 no relapses | 2 | 132 | Risk Ratio (M‐H, Fixed, 95% CI) | 1.13 [0.58, 2.19] |
| 2.2 1‐2 relapses | 2 | 132 | Risk Ratio (M‐H, Fixed, 95% CI) | 1.37 [0.94, 1.98] |
| 2.3 3 or more relapses | 2 | 132 | Risk Ratio (M‐H, Fixed, 95% CI) | 0.61 [0.38, 0.96] |
| 2.4 3 or more relapses ‐ Sensitivity analysis | 2 | 145 | Risk Ratio (M‐H, Fixed, 95% CI) | 0.75 [0.52, 1.09] |
| 3 Relapse rate at 24 months Show forest plot | 1 | WMD (Fixed, 95% CI) | 0.83 [0.62, 1.12] | |
| Outcome or subgroup title | No. of studies | No. of participants | Statistical method | Effect size |
| 1 Number of Chronic‐Progressive patients with disease progression after 24 months Show forest plot | 1 | Risk Ratio (M‐H, Fixed, 95% CI) | Totals not selected | |
| 2 Number of Relapsing‐Remitting patients with one or more relapses after 24 months Show forest plot | 1 | Risk Ratio (M‐H, Fixed, 95% CI) | Totals not selected | |
| 3 Relapse rate after 24 months in relapsing‐remitting patients Show forest plot | 1 | rr (Fixed, 95% CI) | Totals not selected | |
| Outcome or subgroup title | No. of studies | No. of participants | Statistical method | Effect size |
| 1 Number of patients with disease progression Show forest plot | 2 | Risk Ratio (M‐H, Fixed, 95% CI) | Totals not selected | |
| 1.1 After 12 months | 1 | Risk Ratio (M‐H, Fixed, 95% CI) | 0.0 [0.0, 0.0] | |
| 1.2 After 12 months ‐ Sensitivity analysis | 1 | Risk Ratio (M‐H, Fixed, 95% CI) | 0.0 [0.0, 0.0] | |
| 1.3 After 24 months | 1 | Risk Ratio (M‐H, Fixed, 95% CI) | 0.0 [0.0, 0.0] | |
| 2 Number of patients with one or more relapses after 12 months Show forest plot | 1 | Risk Ratio (M‐H, Fixed, 95% CI) | Totals not selected | |