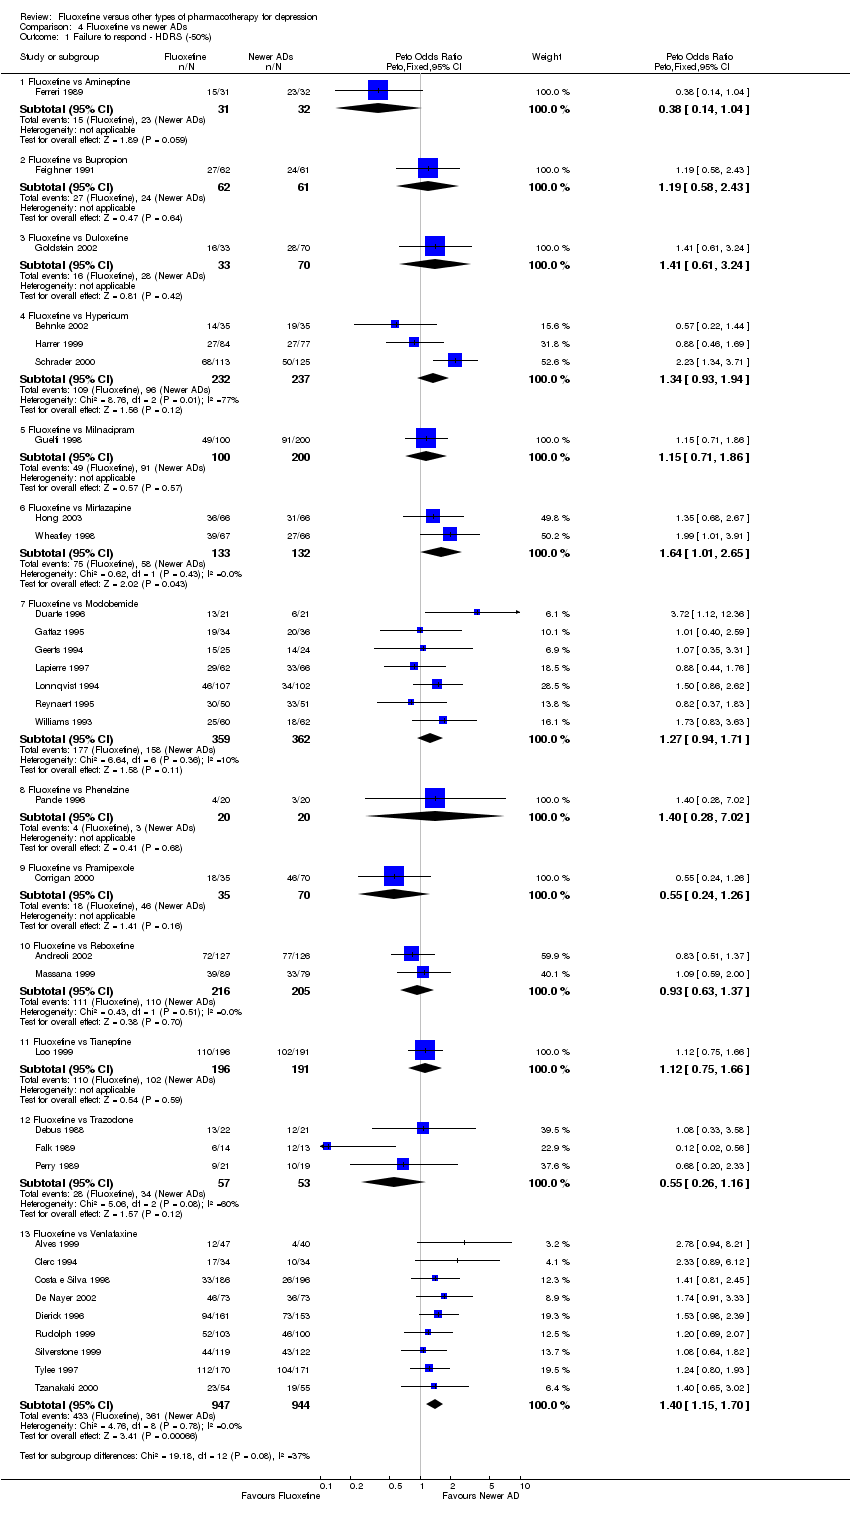
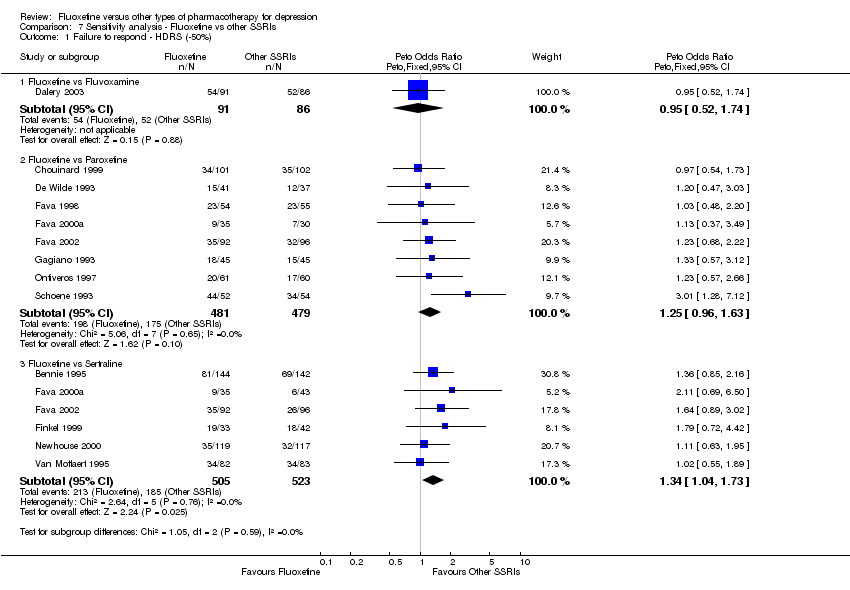
| 1 Failure to respond ‐ HDRS (‐50%) Show forest plot | 33 | | Peto Odds Ratio (Peto, Fixed, 95% CI) | Subtotals only |
|
| 1.1 Fluoxetine vs Amineptine | 1 | 63 | Peto Odds Ratio (Peto, Fixed, 95% CI) | 0.38 [0.14, 1.04] |
| 1.2 Fluoxetine vs Bupropion | 1 | 123 | Peto Odds Ratio (Peto, Fixed, 95% CI) | 1.19 [0.58, 2.43] |
| 1.3 Fluoxetine vs Duloxetine | 1 | 103 | Peto Odds Ratio (Peto, Fixed, 95% CI) | 1.41 [0.61, 3.24] |
| 1.4 Fluoxetine vs Hypericum | 3 | 469 | Peto Odds Ratio (Peto, Fixed, 95% CI) | 1.34 [0.93, 1.94] |
| 1.5 Fluoxetine vs Milnacipram | 1 | 300 | Peto Odds Ratio (Peto, Fixed, 95% CI) | 1.15 [0.71, 1.86] |
| 1.6 Fluoxetine vs Mirtazapine | 2 | 265 | Peto Odds Ratio (Peto, Fixed, 95% CI) | 1.64 [1.01, 2.65] |
| 1.7 Fluoxetine vs Moclobemide | 7 | 721 | Peto Odds Ratio (Peto, Fixed, 95% CI) | 1.27 [0.94, 1.71] |
| 1.8 Fluoxetine vs Phenelzine | 1 | 40 | Peto Odds Ratio (Peto, Fixed, 95% CI) | 1.40 [0.28, 7.02] |
| 1.9 Fluoxetine vs Pramipexole | 1 | 105 | Peto Odds Ratio (Peto, Fixed, 95% CI) | 0.55 [0.24, 1.26] |
| 1.10 Fluoxetine vs Reboxetine | 2 | 421 | Peto Odds Ratio (Peto, Fixed, 95% CI) | 0.93 [0.63, 1.37] |
| 1.11 Fluoxetine vs Tianeptine | 1 | 387 | Peto Odds Ratio (Peto, Fixed, 95% CI) | 1.12 [0.75, 1.66] |
| 1.12 Fluoxetine vs Trazodone | 3 | 110 | Peto Odds Ratio (Peto, Fixed, 95% CI) | 0.55 [0.26, 1.16] |
| 1.13 Fluoxetine vs Venlafaxine | 9 | 1891 | Peto Odds Ratio (Peto, Fixed, 95% CI) | 1.40 [1.15, 1.70] |
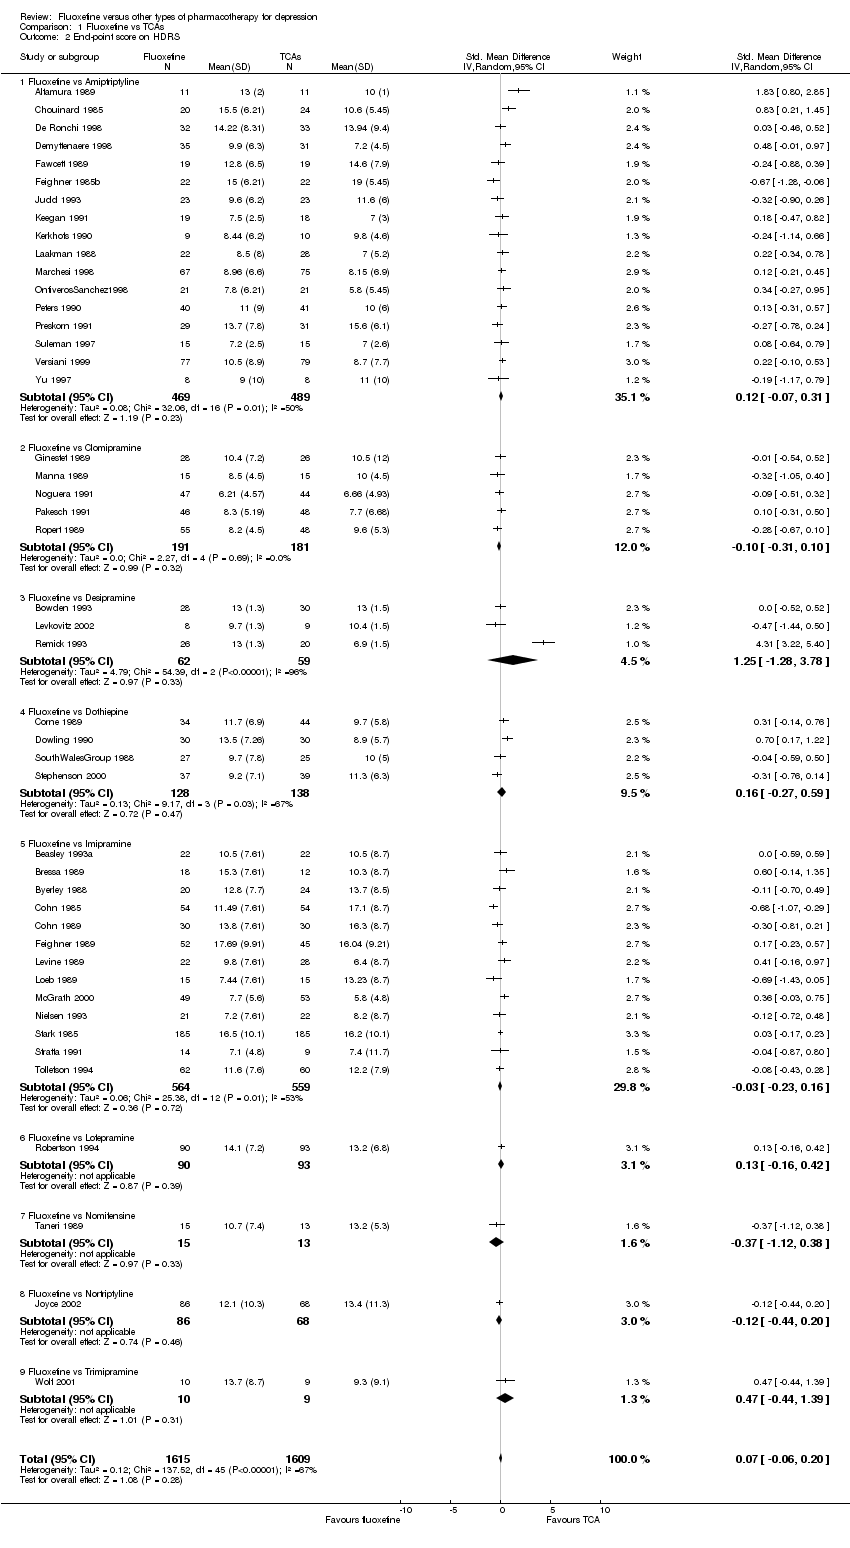
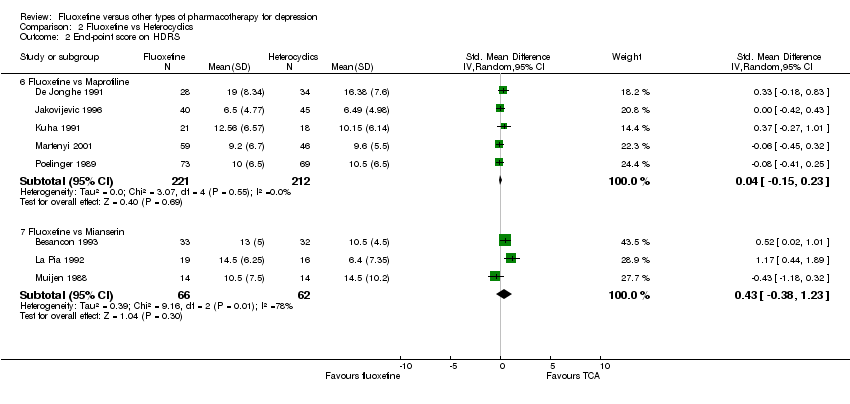
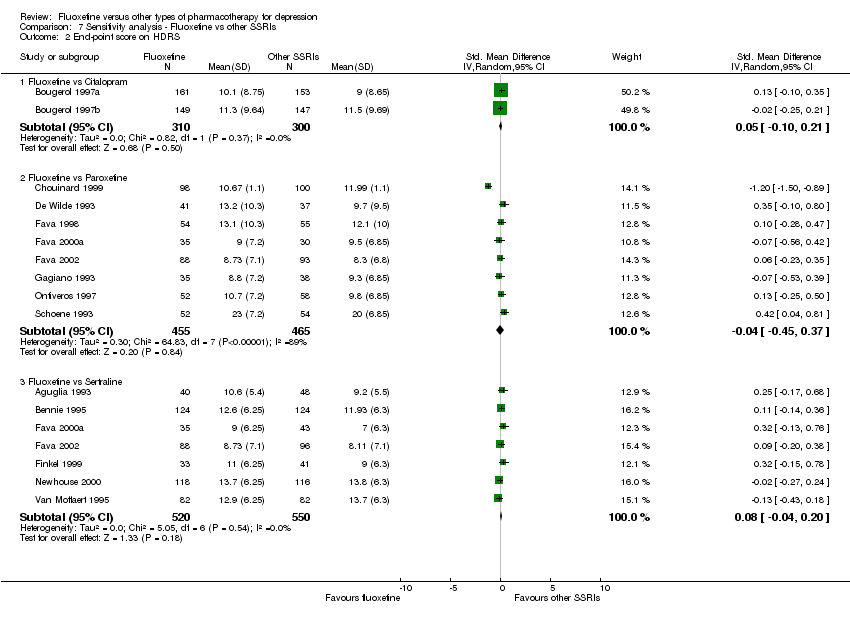
| 2 End‐point score on HDRS Show forest plot | 33 | | Std. Mean Difference (IV, Random, 95% CI) | Subtotals only |
|
| 2.1 Fluoxetine vs ABT‐200 | 1 | 141 | Std. Mean Difference (IV, Random, 95% CI) | ‐1.85 [‐2.25, ‐1.45] |
| 2.2 Fluoxetine vs Amisulpride | 1 | 268 | Std. Mean Difference (IV, Random, 95% CI) | 0.17 [‐0.07, 0.41] |
| 2.3 Fluoxetine vs Hypericum | 3 | 448 | Std. Mean Difference (IV, Random, 95% CI) | 0.11 [‐0.08, 0.29] |
| 2.4 Fluoxetine vs Milnacipram | 1 | 149 | Std. Mean Difference (IV, Random, 95% CI) | ‐0.38 [‐0.71, ‐0.06] |
| 2.5 Fluoxetine vs Moclobemide | 6 | 540 | Std. Mean Difference (IV, Random, 95% CI) | 0.13 [‐0.04, 0.30] |
| 2.6 Fluoxetine vs Nefazodone | 3 | 238 | Std. Mean Difference (IV, Random, 95% CI) | ‐0.06 [‐0.32, 0.19] |
| 2.7 Fluoxetine vs Phenelzine | 1 | 40 | Std. Mean Difference (IV, Random, 95% CI) | ‐0.05 [‐0.67, 0.57] |
| 2.8 Fluoxetine vs Reboxetine | 1 | 168 | Std. Mean Difference (IV, Random, 95% CI) | 0.15 [‐0.16, 0.45] |
| 2.9 Fluoxetine vs Tianeptine | 3 | 730 | Std. Mean Difference (IV, Random, 95% CI) | ‐0.15 [‐0.40, 0.10] |
| 2.10 Fluoxetine vs Trazodone | 3 | 90 | Std. Mean Difference (IV, Random, 95% CI) | ‐0.06 [‐0.65, 0.53] |
| 2.11 Fluoxetine vs Venlafaxine | 10 | 1831 | Std. Mean Difference (IV, Random, 95% CI) | 0.11 [0.00, 0.23] |
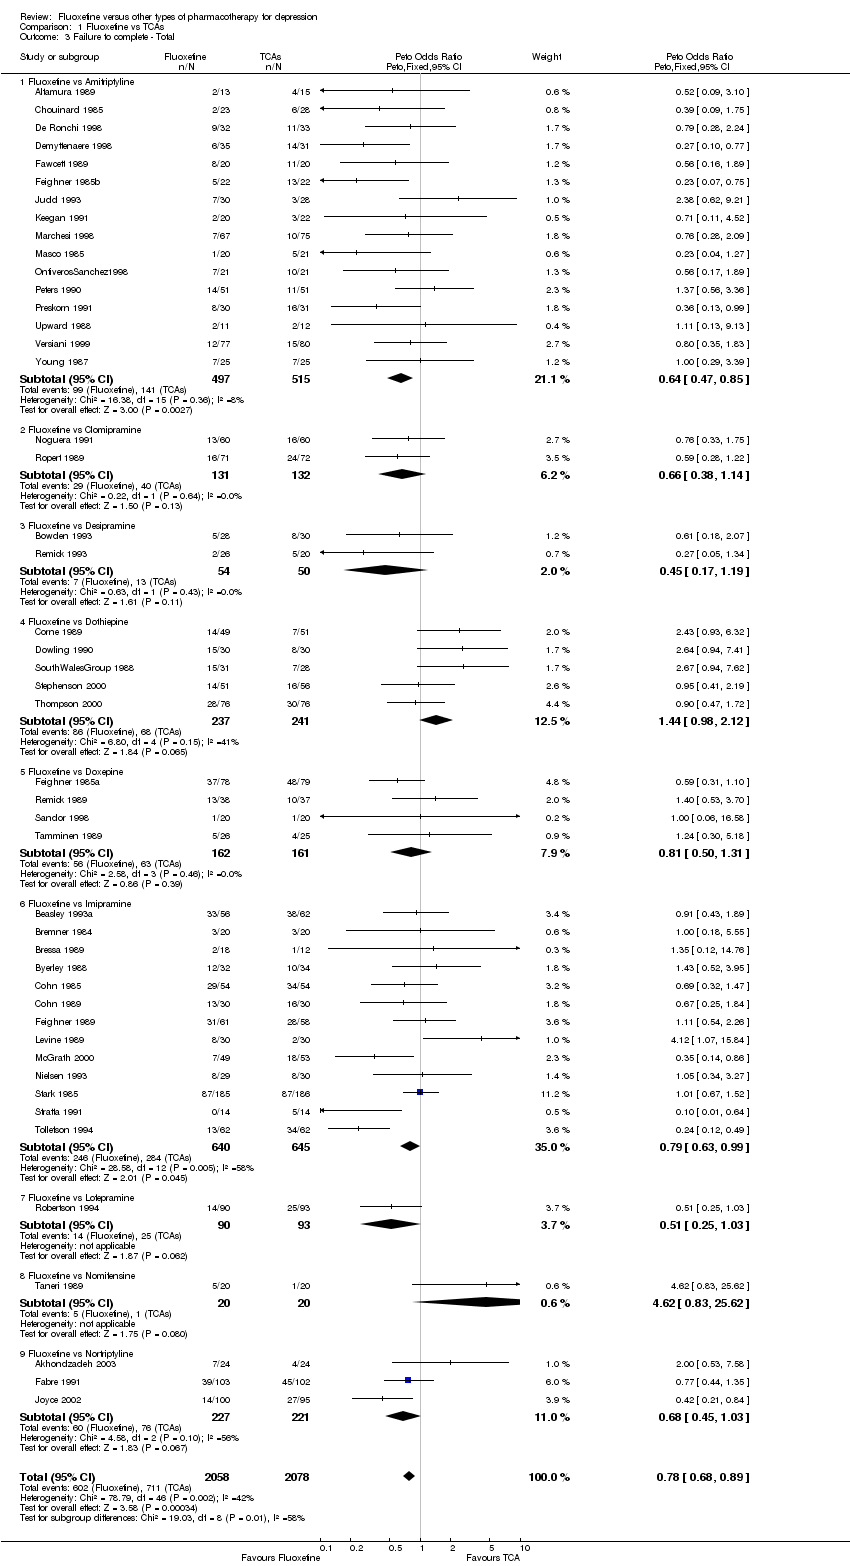
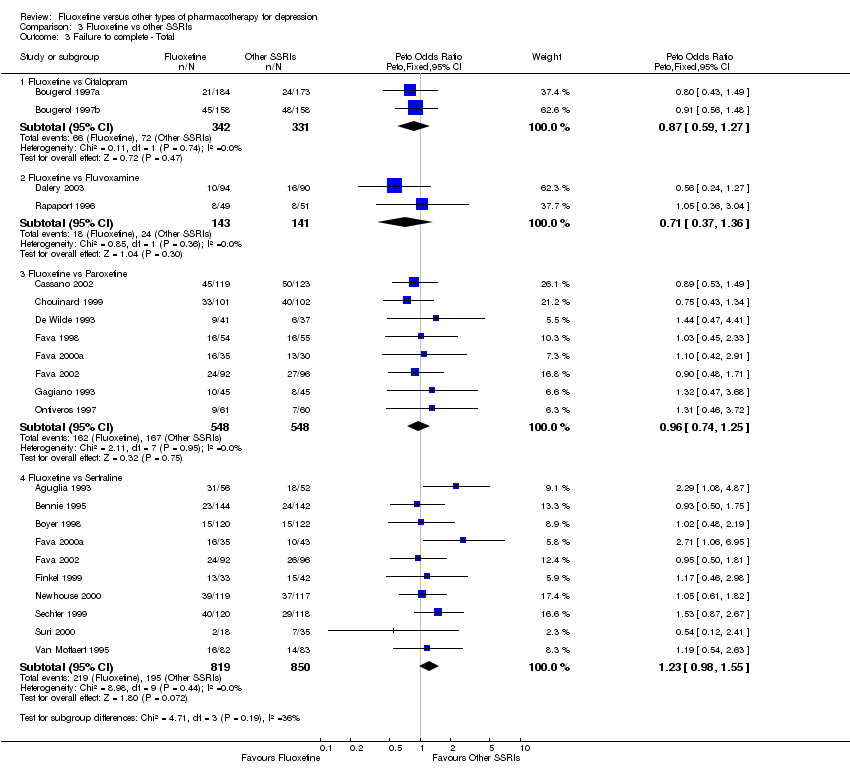
| 3 Failure to complete ‐ Total Show forest plot | 42 | | Peto Odds Ratio (Peto, Fixed, 95% CI) | Subtotals only |
|
| 3.1 Fluoxetine vs ABT‐200 | 1 | 144 | Peto Odds Ratio (Peto, Fixed, 95% CI) | 0.21 [0.10, 0.41] |
| 3.2 Fluoxetine vs Amineptine | 2 | 232 | Peto Odds Ratio (Peto, Fixed, 95% CI) | 0.71 [0.37, 1.38] |
| 3.3 Fluoxetine vs Amisulpride | 1 | 281 | Peto Odds Ratio (Peto, Fixed, 95% CI) | 1.39 [0.81, 2.37] |
| 3.4 Fluoxetine vs Bupropion | 1 | 123 | Peto Odds Ratio (Peto, Fixed, 95% CI) | 1.15 [0.52, 2.52] |
| 3.5 Fluoxetine vs Duloxetine | 1 | 103 | Peto Odds Ratio (Peto, Fixed, 95% CI) | 1.09 [0.46, 2.60] |
| 3.6 Fluoxetine vs Hypericum | 3 | 471 | Peto Odds Ratio (Peto, Fixed, 95% CI) | 1.40 [0.68, 2.89] |
| 3.7 Fluoxetine vs Milnacipram | 2 | 490 | Peto Odds Ratio (Peto, Fixed, 95% CI) | 0.93 [0.63, 1.38] |
| 3.8 Fluoxetine vs Mirtazapine | 2 | 265 | Peto Odds Ratio (Peto, Fixed, 95% CI) | 0.86 [0.52, 1.44] |
| 3.9 Fluoxetine vs Moclobemide | 7 | 721 | Peto Odds Ratio (Peto, Fixed, 95% CI) | 1.01 [0.70, 1.45] |
| 3.10 Fluoxetine vs Nefazodone | 2 | 118 | Peto Odds Ratio (Peto, Fixed, 95% CI) | 0.39 [0.14, 1.06] |
| 3.11 Fluoxetine vs Phenelzine | 1 | 40 | Peto Odds Ratio (Peto, Fixed, 95% CI) | 0.13 [0.01, 2.13] |
| 3.12 Fluoxetine vs Pramipexole | 1 | 105 | Peto Odds Ratio (Peto, Fixed, 95% CI) | 0.20 [0.08, 0.47] |
| 3.13 Fluoxetine vs Reboxetine | 2 | 421 | Peto Odds Ratio (Peto, Fixed, 95% CI) | 0.61 [0.40, 0.94] |
| 3.14 Fluoxetine vs Tianeptine | 3 | 830 | Peto Odds Ratio (Peto, Fixed, 95% CI) | 0.96 [0.69, 1.33] |
| 3.15 Fluoxetine vs Trazodone | 3 | 110 | Peto Odds Ratio (Peto, Fixed, 95% CI) | 0.46 [0.21, 1.03] |
| 3.16 Fluoxetine vs Venlafaxine | 10 | 2036 | Peto Odds Ratio (Peto, Fixed, 95% CI) | 0.94 [0.76, 1.15] |
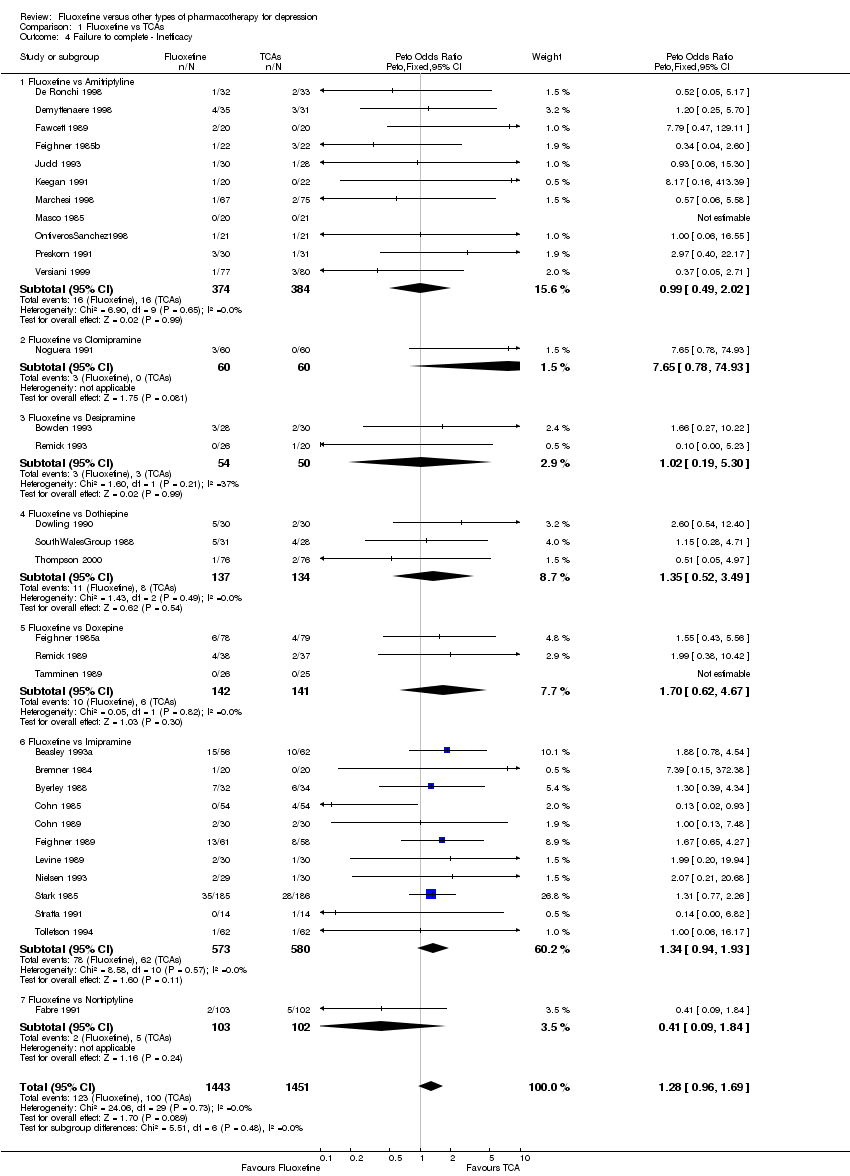
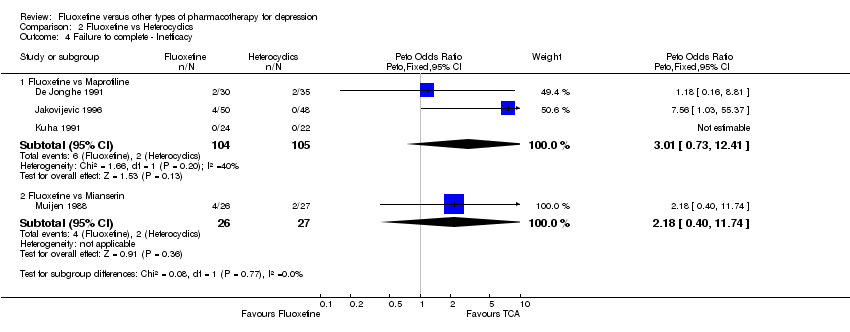
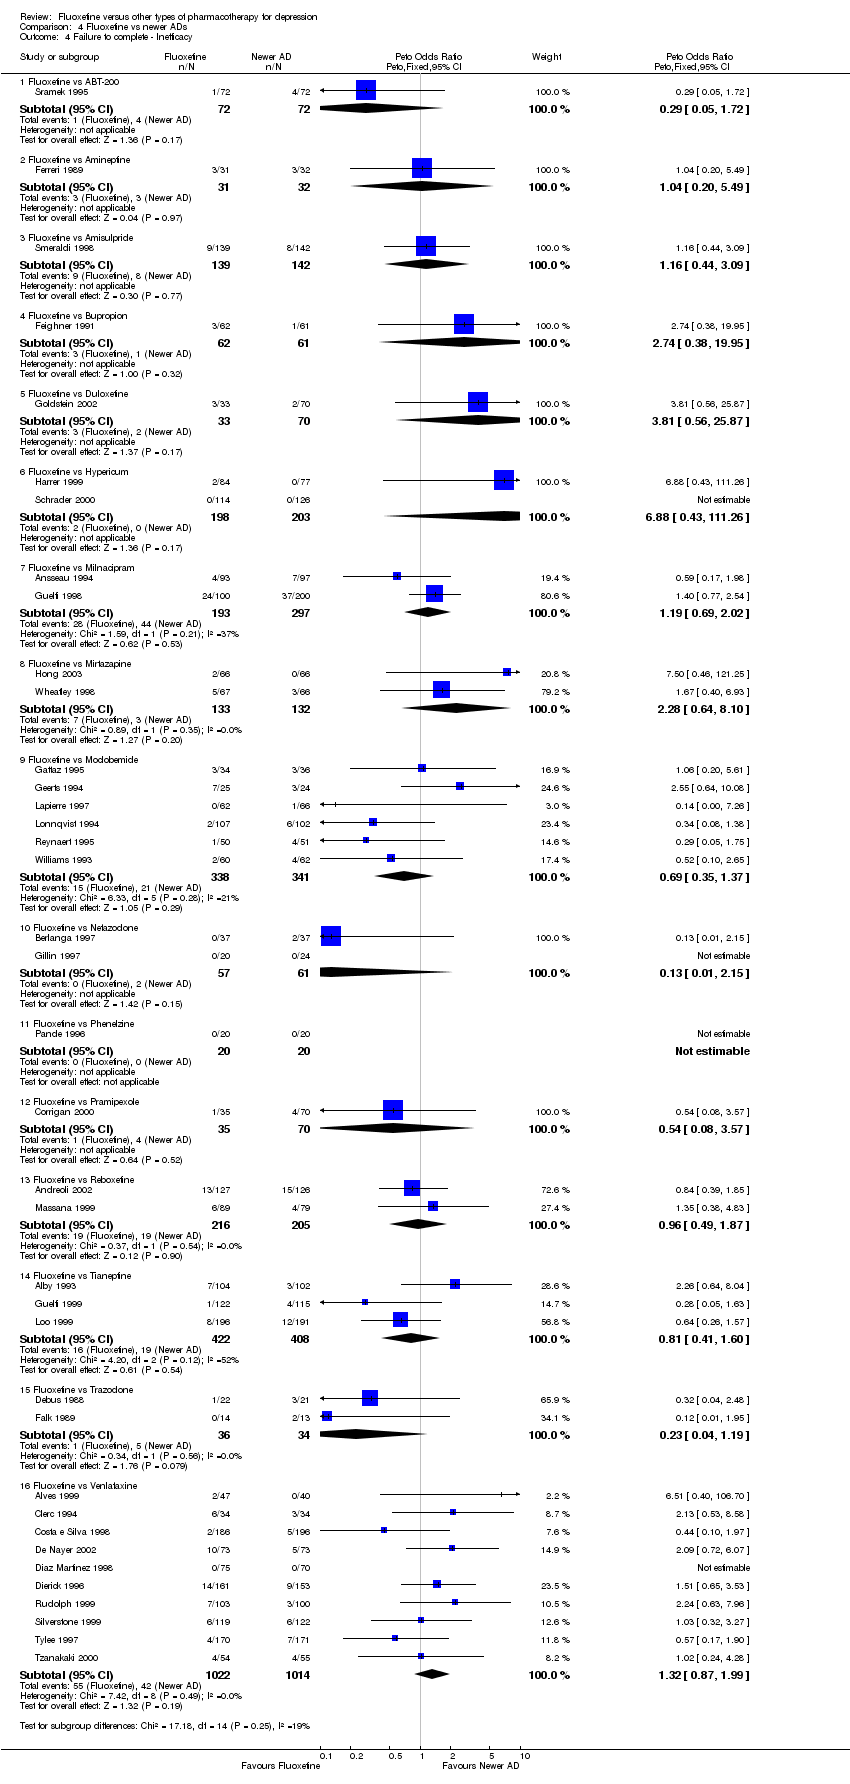
| 4 Failure to complete ‐ Inefficacy Show forest plot | 38 | | Peto Odds Ratio (Peto, Fixed, 95% CI) | Subtotals only |
|
| 4.1 Fluoxetine vs ABT‐200 | 1 | 144 | Peto Odds Ratio (Peto, Fixed, 95% CI) | 0.29 [0.05, 1.72] |
| 4.2 Fluoxetine vs Amineptine | 1 | 63 | Peto Odds Ratio (Peto, Fixed, 95% CI) | 1.04 [0.20, 5.49] |
| 4.3 Fluoxetine vs Amisulpride | 1 | 281 | Peto Odds Ratio (Peto, Fixed, 95% CI) | 1.16 [0.44, 3.09] |
| 4.4 Fluoxetine vs Bupropion | 1 | 123 | Peto Odds Ratio (Peto, Fixed, 95% CI) | 2.74 [0.38, 19.95] |
| 4.5 Fluoxetine vs Duloxetine | 1 | 103 | Peto Odds Ratio (Peto, Fixed, 95% CI) | 3.81 [0.56, 25.87] |
| 4.6 Fluoxetine vs Hypericum | 2 | 401 | Peto Odds Ratio (Peto, Fixed, 95% CI) | 6.88 [0.43, 111.26] |
| 4.7 Fluoxetine vs Milnacipram | 2 | 490 | Peto Odds Ratio (Peto, Fixed, 95% CI) | 1.19 [0.69, 2.02] |
| 4.8 Fluoxetine vs Mirtazapine | 2 | 265 | Peto Odds Ratio (Peto, Fixed, 95% CI) | 2.28 [0.64, 8.10] |
| 4.9 Fluoxetine vs Moclobemide | 6 | 679 | Peto Odds Ratio (Peto, Fixed, 95% CI) | 0.69 [0.35, 1.37] |
| 4.10 Fluoxetine vs Nefazodone | 2 | 118 | Peto Odds Ratio (Peto, Fixed, 95% CI) | 0.13 [0.01, 2.15] |
| 4.11 Fluoxetine vs Phenelzine | 1 | 40 | Peto Odds Ratio (Peto, Fixed, 95% CI) | 0.0 [0.0, 0.0] |
| 4.12 Fluoxetine vs Pramipexole | 1 | 105 | Peto Odds Ratio (Peto, Fixed, 95% CI) | 0.54 [0.08, 3.57] |
| 4.13 Fluoxetine vs Reboxetine | 2 | 421 | Peto Odds Ratio (Peto, Fixed, 95% CI) | 0.96 [0.49, 1.87] |
| 4.14 Fluoxetine vs Tianeptine | 3 | 830 | Peto Odds Ratio (Peto, Fixed, 95% CI) | 0.81 [0.41, 1.60] |
| 4.15 Fluoxetine vs Trazodone | 2 | 70 | Peto Odds Ratio (Peto, Fixed, 95% CI) | 0.23 [0.04, 1.19] |
| 4.16 Fluoxetine vs Venlafaxine | 10 | 2036 | Peto Odds Ratio (Peto, Fixed, 95% CI) | 1.32 [0.87, 1.99] |
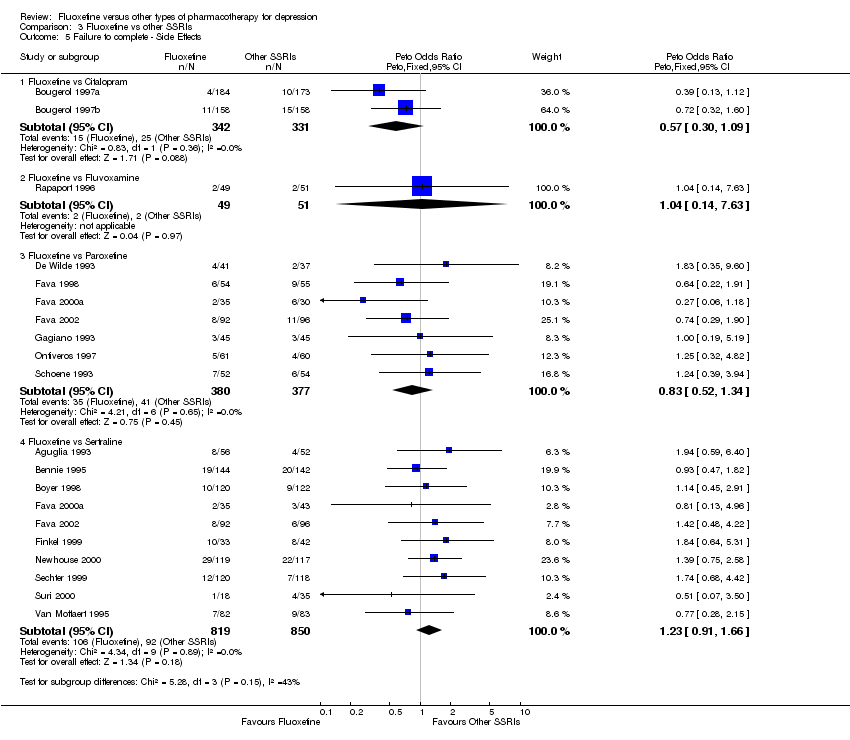
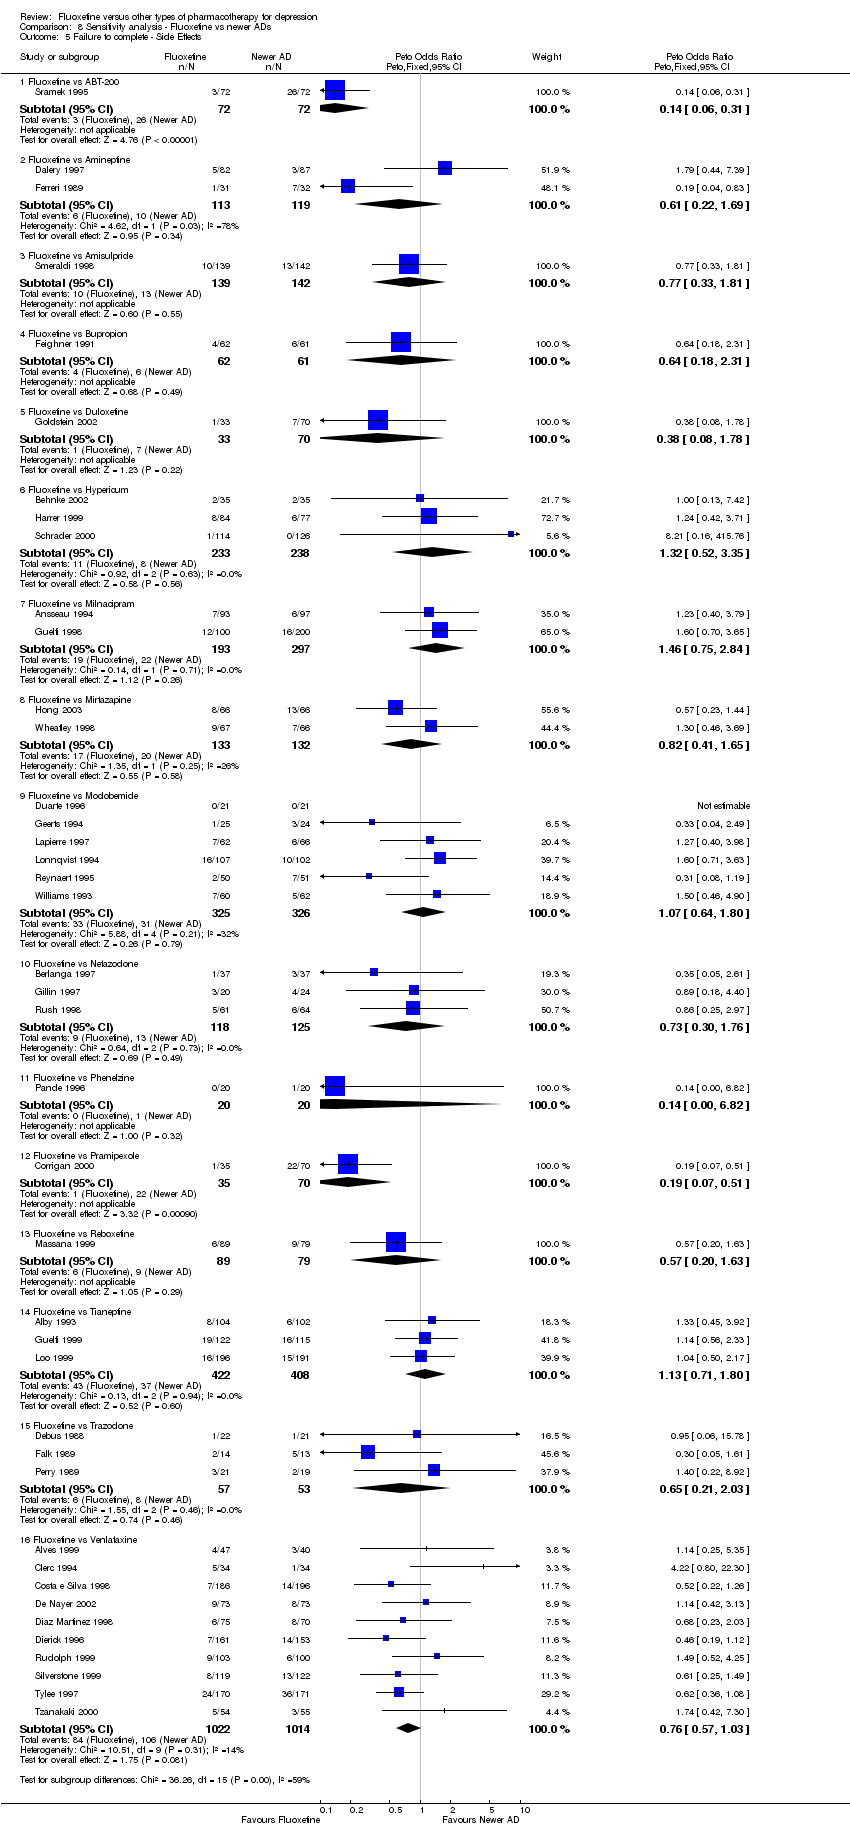
| 5 Failure to complete ‐ Side Effects Show forest plot | 42 | | Peto Odds Ratio (Peto, Fixed, 95% CI) | Subtotals only |
|
| 5.1 Fluoxetine vs ABT‐200 | 1 | 144 | Peto Odds Ratio (Peto, Fixed, 95% CI) | 0.14 [0.06, 0.31] |
| 5.2 Fluoxetine vs Amineptine | 2 | 232 | Peto Odds Ratio (Peto, Fixed, 95% CI) | 0.61 [0.22, 1.69] |
| 5.3 Fluoxetine vs Amisulpride | 1 | 281 | Peto Odds Ratio (Peto, Fixed, 95% CI) | 0.77 [0.33, 1.81] |
| 5.4 Fluoxetine vs Bupropion | 1 | 123 | Peto Odds Ratio (Peto, Fixed, 95% CI) | 0.64 [0.18, 2.31] |
| 5.5 Fluoxetine vs Duloxetine | 1 | 103 | Peto Odds Ratio (Peto, Fixed, 95% CI) | 0.38 [0.08, 1.78] |
| 5.6 Fluoxetine vs Hypericum | 3 | 471 | Peto Odds Ratio (Peto, Fixed, 95% CI) | 1.32 [0.52, 3.35] |
| 5.7 Fluoxetine vs Milnacipram | 2 | 490 | Peto Odds Ratio (Peto, Fixed, 95% CI) | 1.46 [0.75, 2.84] |
| 5.8 Fluoxetine vs Mirtazapine | 2 | 265 | Peto Odds Ratio (Peto, Fixed, 95% CI) | 0.82 [0.41, 1.65] |
| 5.9 Fluoxetine vs Moclobemide | 7 | 721 | Peto Odds Ratio (Peto, Fixed, 95% CI) | 1.07 [0.64, 1.80] |
| 5.10 Fluoxetine vs Nefazodone | 3 | 243 | Peto Odds Ratio (Peto, Fixed, 95% CI) | 0.73 [0.30, 1.76] |
| 5.11 Fluoxetine vs Phenelzine | 1 | 40 | Peto Odds Ratio (Peto, Fixed, 95% CI) | 0.14 [0.00, 6.82] |
| 5.12 Fluoxetine vs Pramipexole | 1 | 105 | Peto Odds Ratio (Peto, Fixed, 95% CI) | 0.19 [0.07, 0.51] |
| 5.13 Fluoxetine vs Reboxetine | 1 | 168 | Peto Odds Ratio (Peto, Fixed, 95% CI) | 0.57 [0.20, 1.63] |
| 5.14 Fluoxetine vs Tianeptine | 3 | 830 | Peto Odds Ratio (Peto, Fixed, 95% CI) | 1.13 [0.71, 1.80] |
| 5.15 Fluoxetine vs Trazodone | 3 | 110 | Peto Odds Ratio (Peto, Fixed, 95% CI) | 0.65 [0.21, 2.03] |
| 5.16 Fluoxetine vs Venlafaxine | 10 | 2036 | Peto Odds Ratio (Peto, Fixed, 95% CI) | 0.76 [0.57, 1.03] |