Anticoagulantes (de duración prolongada) para la prevención de la tromboembolia venosa posterior al reemplazo total de rodilla o cadera o la reparación de la fractura de cadera
Información
- DOI:
- https://doi.org/10.1002/14651858.CD004179.pub2Copiar DOI

- Base de datos:
-
- Cochrane Database of Systematic Reviews
- Versión publicada:
-
- 30 marzo 2016see what's new
- Tipo:
-
- Intervention
- Etapa:
-
- Review
- Grupo Editorial Cochrane:
-
Grupo Cochrane de Vascular
- Copyright:
-
- Copyright © 2016 The Cochrane Collaboration. Published by John Wiley & Sons, Ltd.
Cifras del artículo
Altmetric:
Citado por:
Autores
Contributions of authors
RF and MS selected the studies, extracted the data, performed the statistical analyses and wrote the review.
Sources of support
Internal sources
-
No sources of support supplied
External sources
-
Chief Scientist Office, Scottish Government Health Directorates, The Scottish Government, UK.
The Cochrane Vascular editorial base is supported by the Chief Scientist Office.
-
National Institute for Health Research (NIHR), UK.
This project was supported by the NIHR, via Cochrane Incentive Award funding to Cochrane Vascular. The views and opinions expressed therein are those of the authors and do not necessarily reflect those of the Systematic Reviews Programme, NIHR, NHS or the Department of Health.
Declarations of interest
RF: none known.
MS: none known. MS is a member of Cochrane Vascular's editorial staff. To prevent any conflict of interest issues editorial decisions and activities related to this review were carried out by other editorial staff where appropriate.
Acknowledgements
The review authors thank Dr DJ Quinlan, Dr JW Eikelboom, and Dr JD Douketis for their work on the protocol of this review and Prof G Stansby and Dr R Hughes for their clinical input.
Version history
| Published | Title | Stage | Authors | Version |
| 2016 Mar 30 | Anticoagulants (extended duration) for prevention of venous thromboembolism following total hip or knee replacement or hip fracture repair | Review | Rachel Forster, Marlene Stewart | |
| 2002 Apr 22 | Anticoagulants (extended duration) for prevention of venous thromboembolism following total hip or knee replacement or hip fracture repair | Protocol | Daniel John Quinlan, John W Eikelboom, James D Douketis | |
Differences between protocol and review
New authors have taken over this review.
The outcome 'Total VTE' was added as several studies did not report VTE (specifically DVT) as symptomatic or asymptomatic, making it difficult to place within the previously listed outcome definitions. This way more data could be combined for comparison, but needed to be done with caution as the outcomes would be more heterogenous.
'Clinically relevant non‐major bleeding' was added to the bleeding outcomes as this was commonly reported in the newer, larger trials, and does not fit well within major or minor bleeding categories.
The outcomes 'Wound infection', 'Wound healing' and 'Reoperation following surgery' were added as they are deemed important outcomes for orthopaedic surgeons (Wang 2014).
Calculation of number needed to treat for an additional beneficial outcome (NNTB) and needed to treat for an additional harmful outcome (NNTH) were removed as the calculations in a meta‐analysis setting can be misleading and should be treated with caution.
The method of evaluating study quality has changed since the protocol was published; we used the Cochrane 'Risk of bias' tool (Higgins 2011). We have also added 'Summary of findings' tables.
In the 'Sensitivity analysis' section, we have removed the indication to compare results using a fixed and random‐effects model, as we are using the I2 statistic to decide the appropriateness of the use of the different model types.
Keywords
MeSH
Medical Subject Headings (MeSH) Keywords
- Anticoagulants [*therapeutic use];
- Arthroplasty, Replacement, Hip [*adverse effects];
- Arthroplasty, Replacement, Knee [*adverse effects];
- Hemorrhage [chemically induced];
- Heparin [*therapeutic use];
- Hip Fractures [*surgery];
- Randomized Controlled Trials as Topic;
- Venous Thromboembolism [*prevention & control];
- Vitamin K [*antagonists & inhibitors];
Medical Subject Headings Check Words
Humans;
PICO

Study flow diagram.

Risk of bias graph: review authors' judgements about each risk of bias item presented as percentages across all included studies.

Risk of bias summary: review authors' judgements about each risk of bias item for each included study.

Comparison 1 Heparin versus placebo, Outcome 1 Symptomatic VTE (DVT and PE).

Comparison 1 Heparin versus placebo, Outcome 2 Symptomatic DVT (proximal or distal).

Comparison 1 Heparin versus placebo, Outcome 3 Symptomatic PE.
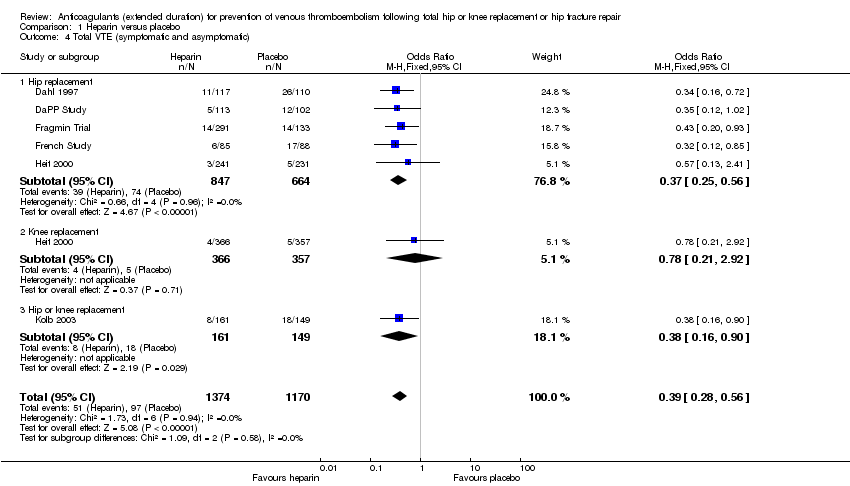
Comparison 1 Heparin versus placebo, Outcome 4 Total VTE (symptomatic and asymptomatic).

Comparison 1 Heparin versus placebo, Outcome 5 Asymptomatic DVT.
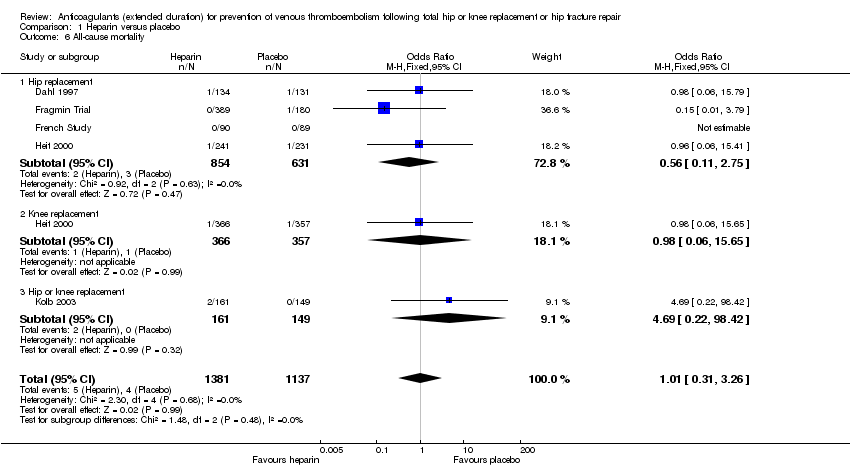
Comparison 1 Heparin versus placebo, Outcome 6 All‐cause mortality.

Comparison 1 Heparin versus placebo, Outcome 7 Adverse events.

Comparison 1 Heparin versus placebo, Outcome 8 Bleeding ‐ major.
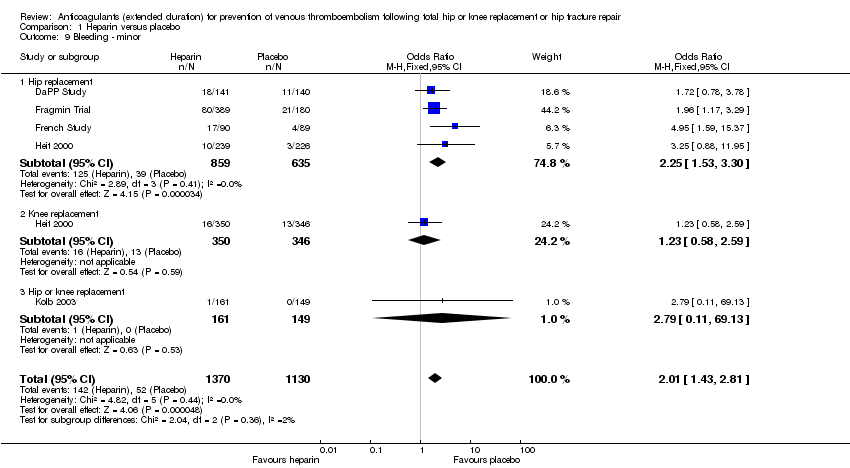
Comparison 1 Heparin versus placebo, Outcome 9 Bleeding ‐ minor.

Comparison 1 Heparin versus placebo, Outcome 10 Reoperation.

Comparison 2 Vitamin K antagonists versus placebo, Outcome 1 Symptomatic VTE (DVT and PE).
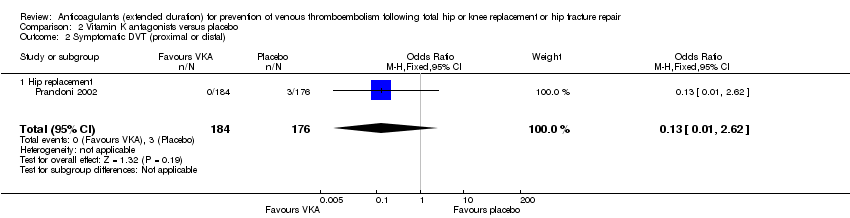
Comparison 2 Vitamin K antagonists versus placebo, Outcome 2 Symptomatic DVT (proximal or distal).
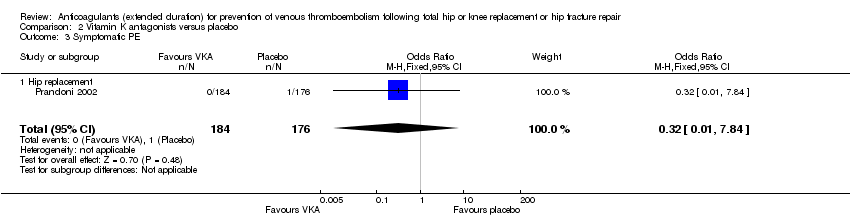
Comparison 2 Vitamin K antagonists versus placebo, Outcome 3 Symptomatic PE.

Comparison 2 Vitamin K antagonists versus placebo, Outcome 4 Total VTE (symptomatic and asymptomatic).

Comparison 2 Vitamin K antagonists versus placebo, Outcome 5 All‐cause mortality.
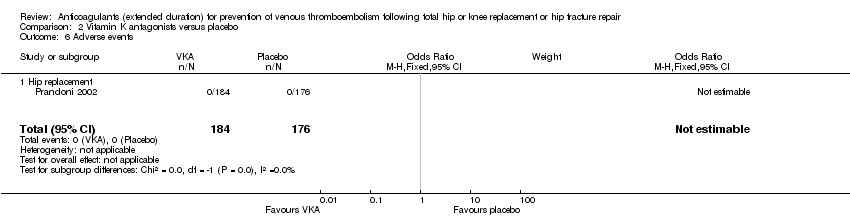
Comparison 2 Vitamin K antagonists versus placebo, Outcome 6 Adverse events.

Comparison 2 Vitamin K antagonists versus placebo, Outcome 7 Bleeding ‐ major.

Comparison 3 DOAC versus placebo, Outcome 1 Symptomatic VTE (DVT and PE).
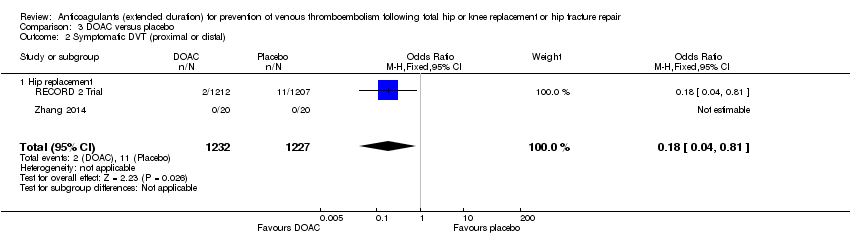
Comparison 3 DOAC versus placebo, Outcome 2 Symptomatic DVT (proximal or distal).
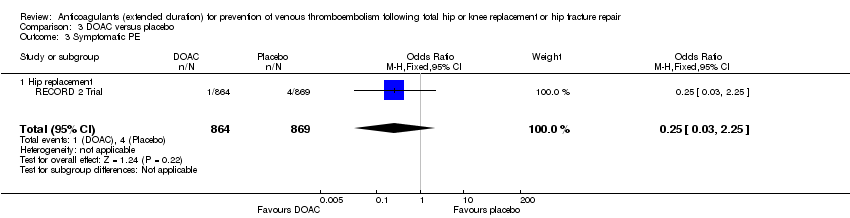
Comparison 3 DOAC versus placebo, Outcome 3 Symptomatic PE.

Comparison 3 DOAC versus placebo, Outcome 4 Total VTE (symptomatic and asymptomatic).

Comparison 3 DOAC versus placebo, Outcome 5 All‐cause mortality.
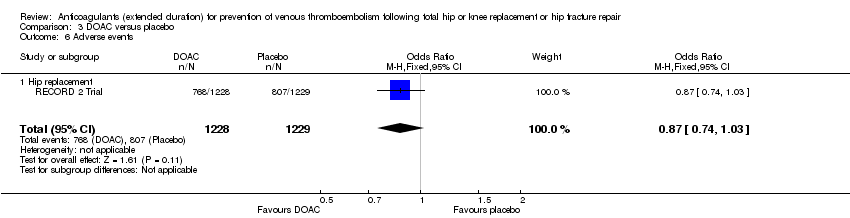
Comparison 3 DOAC versus placebo, Outcome 6 Adverse events.
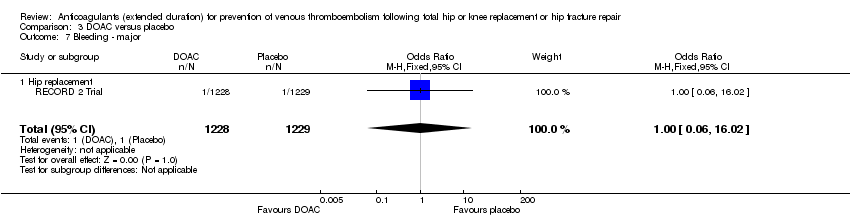
Comparison 3 DOAC versus placebo, Outcome 7 Bleeding ‐ major.

Comparison 3 DOAC versus placebo, Outcome 8 Bleeding‐ clinically relevant non‐major.

Comparison 3 DOAC versus placebo, Outcome 9 Bleeding ‐ minor.
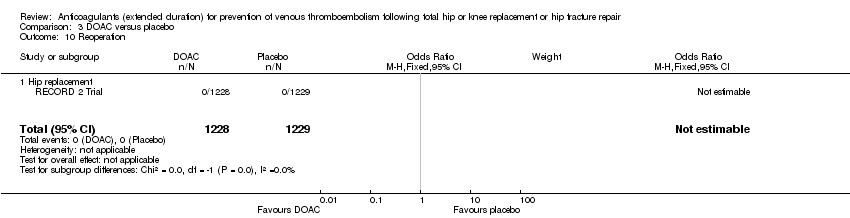
Comparison 3 DOAC versus placebo, Outcome 10 Reoperation.
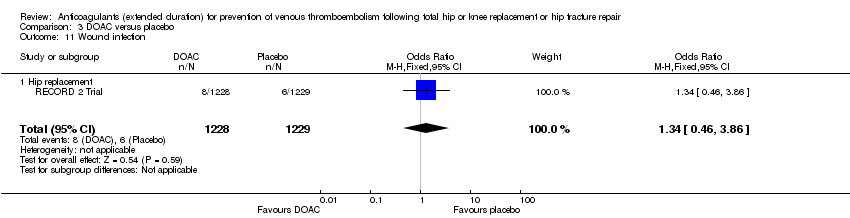
Comparison 3 DOAC versus placebo, Outcome 11 Wound infection.

Comparison 4 Anticoagulant (chosen at investigators' discretion) versus placebo, Outcome 1 Symptomatic VTE (DVT and PE).

Comparison 4 Anticoagulant (chosen at investigators' discretion) versus placebo, Outcome 2 Symptomatic DVT (proximal or distal).

Comparison 4 Anticoagulant (chosen at investigators' discretion) versus placebo, Outcome 3 Symptomatic PE.

Comparison 4 Anticoagulant (chosen at investigators' discretion) versus placebo, Outcome 4 Total VTE (symptomatic and asymptomatic).

Comparison 4 Anticoagulant (chosen at investigators' discretion) versus placebo, Outcome 5 Asymptomatic DVT.
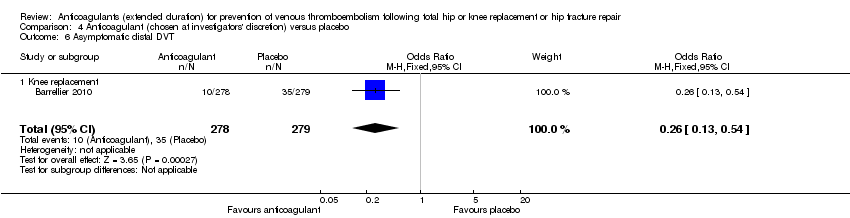
Comparison 4 Anticoagulant (chosen at investigators' discretion) versus placebo, Outcome 6 Asymptomatic distal DVT.

Comparison 4 Anticoagulant (chosen at investigators' discretion) versus placebo, Outcome 7 All‐cause mortality.
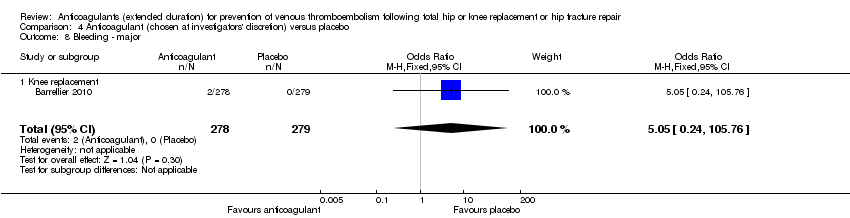
Comparison 4 Anticoagulant (chosen at investigators' discretion) versus placebo, Outcome 8 Bleeding ‐ major.

Comparison 5 Vitamin K antagonists versus heparin, Outcome 1 Symptomatic VTE (DVT and PE).

Comparison 5 Vitamin K antagonists versus heparin, Outcome 2 Symptomatic DVT (proximal or distal).

Comparison 5 Vitamin K antagonists versus heparin, Outcome 3 Symptomatic PE.
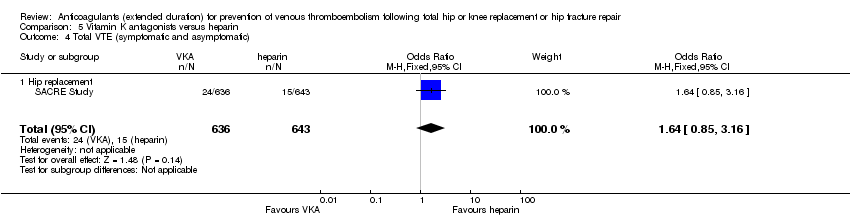
Comparison 5 Vitamin K antagonists versus heparin, Outcome 4 Total VTE (symptomatic and asymptomatic).

Comparison 5 Vitamin K antagonists versus heparin, Outcome 5 All‐cause mortality.

Comparison 5 Vitamin K antagonists versus heparin, Outcome 6 Bleeding ‐ major.
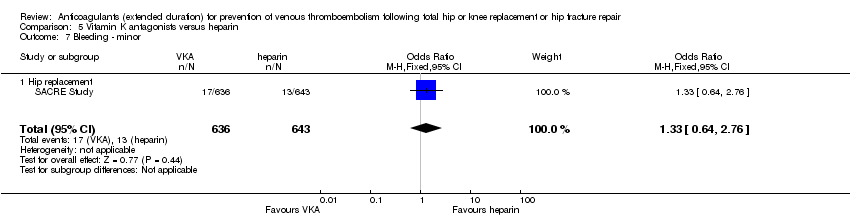
Comparison 5 Vitamin K antagonists versus heparin, Outcome 7 Bleeding ‐ minor.

Comparison 5 Vitamin K antagonists versus heparin, Outcome 8 Reoperation.
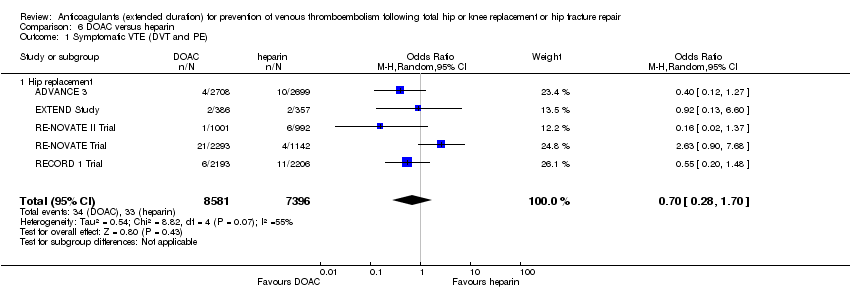
Comparison 6 DOAC versus heparin, Outcome 1 Symptomatic VTE (DVT and PE).

Comparison 6 DOAC versus heparin, Outcome 2 Symptomatic DVT (proximal or distal).

Comparison 6 DOAC versus heparin, Outcome 3 Symptomatic PE.

Comparison 6 DOAC versus heparin, Outcome 4 Total VTE (symptomatic and asymptomatic).

Comparison 6 DOAC versus heparin, Outcome 5 Asymptomatic DVT.

Comparison 6 DOAC versus heparin, Outcome 6 Asymptomatic proximal DVT.
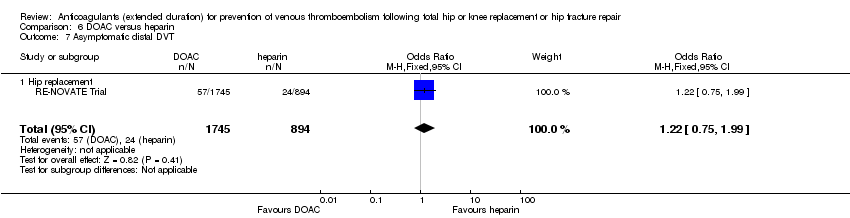
Comparison 6 DOAC versus heparin, Outcome 7 Asymptomatic distal DVT.

Comparison 6 DOAC versus heparin, Outcome 8 All‐cause mortality.

Comparison 6 DOAC versus heparin, Outcome 9 Adverse events.

Comparison 6 DOAC versus heparin, Outcome 10 Bleeding ‐ major.

Comparison 6 DOAC versus heparin, Outcome 11 Bleeding ‐ clinically relevant, non‐major.

Comparison 6 DOAC versus heparin, Outcome 12 Bleeding ‐ minor.

Comparison 6 DOAC versus heparin, Outcome 13 Reoperation.

Comparison 6 DOAC versus heparin, Outcome 14 Wound infection.
| Heparin compared to placebo for prevention of venous thromboembolism following total hip or knee replacement or hip fracture repair | ||||||
| Patient or population: people requiring prevention of venous thromboembolism following total hip or knee replacement or hip fracture repair | ||||||
| Outcomes | Anticipated absolute effects* (95% CI) | Relative effect | Number of participants | Quality of the evidence | Comments | |
| Risk with placebo | Risk with heparin | |||||
| Symptomatic VTE (DVT and PE) | Study population | OR 0.59 | 2329 | ⊕⊕⊕⊕ | — | |
| 33 per 1000 | 20 per 1000 | |||||
| Symptomatic DVT (proximal or distal) | Study population | OR 0.73 | 2019 | ⊕⊕⊕⊝ | — | |
| 24 per 1000 | 18 per 1000 | |||||
| Symptomatic PE | Study population | OR 0.61 | 1595 | ⊕⊕⊝⊝ | — | |
| 6 per 1000 | 4 per 1000 | |||||
| Bleeding ‐ major | Study population | OR 0.59 | 2500 | ⊕⊕⊕⊝ | — | |
| 4 per 1000 | 2 per 1000 | |||||
| Clinically relevant non‐major bleeding | see comment | — | — | — | not reported | |
| Bleeding ‐ minor | Study population | OR 2.01 | 2500 | ⊕⊕⊕⊕ | — | |
| 46 per 1000 | 88 per 1000 | |||||
| *The risk in the intervention group (and its 95% confidence interval) is based on the assumed risk in the comparison group and the relative effect of the intervention (and its 95% CI). | ||||||
| GRADE Working Group grades of evidence | ||||||
| 1 Downgraded by one level, low number of events leading to imprecision of results | ||||||
| Vitamin K antagonists compared to placebo for prevention of venous thromboembolism following total hip or knee replacement or hip fracture repair | ||||||
| Patient or population: people requiring prevention of venous thromboembolism following total hip or knee replacement or hip fracture repair | ||||||
| Outcomes | Anticipated absolute effects* (95% CI) | Relative effect | Number of participants | Quality of the evidence | Comments | |
| Risk with placebo | Risk with vitamin K antagonists | |||||
| Symptomatic VTE (DVT and PE) | Study population | OR 0.10 | 360 | ⊕⊕⊕⊝ | — | |
| 23 per 1000 | 2 per 1000 | |||||
| Symptomatic DVT (proximal or distal) | Study population | OR 0.13 | 360 | ⊕⊕⊕⊝ | — | |
| 17 per 1000 | 2 per 1000 | |||||
| Symptomatic PE | Study population | OR 0.32 | 360 | ⊕⊕⊕⊝ | — | |
| 6 per 1000 | 2 per 1000 | |||||
| Bleeding ‐ major | see comment | OR 2.89 | 360 | ⊕⊕⊝⊝ | no events recorded in placebo group | |
| Clinically relevant non‐major bleeding | see comment | — | — | — | not reported | |
| Minor bleeding | see comment | — | — | — | not reported | |
| *The risk in the intervention group (and its 95% confidence interval) is based on the assumed risk in the comparison group and the relative effect of the intervention (and its 95% CI). | ||||||
| GRADE Working Group grades of evidence | ||||||
| 1 Downgraded by one level, results from a single study only so heterogeneity could not be assessed | ||||||
| DOAC compared to placebo for prevention of venous thromboembolism following total hip or knee replacement or hip fracture repair | ||||||
| Patient or population: people requiring prevention of venous thromboembolism following total hip or knee replacement or hip fracture repair | ||||||
| Outcomes | Anticipated absolute effects* (95% CI) | Relative effect | Number of participants | Quality of the evidence | Comments | |
| Risk with placebo | Risk with DOAC | |||||
| Symptomatic VTE (DVT and PE) | Study population | OR 0.20 | 2419 | ⊕⊕⊕⊝ | — | |
| 12 per 1000 | 3 per 1000 | |||||
| Symptomatic DVT (proximal or distal) | Study population | OR 0.18 | 2459 | ⊕⊕⊕⊕ | — | |
| 9 per 1000 | 2 per 1000 | |||||
| Symptomatic PE | Study population | OR 0.25 | 1733 | ⊕⊕⊝⊝ | — | |
| 5 per 1000 | 1 per 1000 | |||||
| Bleeding ‐ major | Study population | OR 1.00 | 2457 | ⊕⊕⊝⊝ | — | |
| 1 per 1000 | 1 per 1000 | |||||
| Bleeding‐ clinically relevant non‐major | Study population | OR 1.22 | 2457 | ⊕⊕⊕⊝ | — | |
| 27 per 1000 | 33 per 1000 | |||||
| Bleeding ‐ minor | Study population | OR 1.18 | 2457 | ⊕⊕⊕⊝ | — | |
| 28 per 1000 | 32 per 1000 | |||||
| *The risk in the intervention group (and its 95% confidence interval) is based on the assumed risk in the comparison group and the relative effect of the intervention (and its 95% CI). | ||||||
| GRADE Working Group grades of evidence | ||||||
| 1 Downgraded by one level, results from a single study so heterogeneity cannot be assessed | ||||||
| Anticoagulants (chosen at investigators' discretion) compared to placebo for prevention of venous thromboembolism following total hip or knee replacement or hip fracture repair | ||||||
| Patient or population: people requiring prevention of venous thromboembolism following total hip or knee replacement or hip fracture repair | ||||||
| Outcomes | Anticipated absolute effects* (95% CI) | Relative effect | Number of participants | Quality of the evidence | Comments | |
| Risk with placebo | Risk with anticoagulant (chosen at investigators' discretion) | |||||
| Symptomatic VTE (DVT and PE) | Study population | OR 0.50 | 557 | ⊕⊕⊝⊝ | — | |
| 14 per 1000 | 7 per 1000 | |||||
| Symptomatic DVT (proximal or distal) | Study population | OR 0.33 | 557 | ⊕⊕⊝⊝ | — | |
| 11 per 1000 | 4 per 1000 | |||||
| Symptomatic PE | Study population | OR 1.00 | 557 | ⊕⊕⊝⊝ | — | |
| 4 per 1000 | 4 per 1000 | |||||
| Bleeding ‐ major | see comment | OR 5.05 | 557 | ⊕⊕⊝⊝ | no major bleeding recorded in the placebo groups | |
| Clinically relevant non‐major bleeding | see comment | — | — | — | not reported | |
| Minor bleeding | see comment | — | — | — | not reported | |
| *The risk in the intervention group (and its 95% confidence interval) is based on the assumed risk in the comparison group and the relative effect of the intervention (and its 95% CI). | ||||||
| GRADE Working Group grades of evidence | ||||||
| 1 Downgraded by one level, results from a single study so heterogeneity could not be assessed | ||||||
| Vitamin K antagonists compared to heparin for prevention of venous thromboembolism following total hip or knee replacement or hip fracture repair | ||||||
| Patient or population: people requiring prevention of venous thromboembolism following total hip or knee replacement or hip fracture repair | ||||||
| Outcomes | Anticipated absolute effects* (95% CI) | Relative effect | Number of participants | Quality of the evidence | Comments | |
| Risk with heparin | Risk with vitamin K antagonists | |||||
| Symptomatic VTE (DVT and PE) | Study population | OR 1.64 | 1279 | ⊕⊕⊝⊝ | — | |
| 23 per 1000 | 38 per 1000 | |||||
| Symptomatic DVT (proximal or distal) | Study population | OR 1.36 | 1279 | ⊕⊕⊝⊝ | — | |
| 23 per 1000 | 31 per 1000 | |||||
| Symptomatic PE | see comment | OR 9.16 | 1279 | ⊕⊕⊝⊝ | no cases of symptomatic PE reported in the heparin study arm | |
| Bleeding ‐ major | Study population | OR 3.87 | 1272 | ⊕⊕⊝⊝ | — | |
| 16 per 1000 | 58 per 1000 | |||||
| Bleeding ‐ clinically indicated non‐major Treatment duration 28 ‐ 42 days | see comment | — | — | — | clinically indicated non‐major bleeding events not reported in single included study in this comparison | |
| Bleeding ‐ minor | Study population | OR 1.33 | 1279 | ⊕⊕⊝⊝ | — | |
| 20 per 1000 | 27 per 1000 | |||||
| *The risk in the intervention group (and its 95% confidence interval) is based on the assumed risk in the comparison group and the relative effect of the intervention (and its 95% CI). | ||||||
| GRADE Working Group grades of evidence | ||||||
| 1 Downgraded by one level, single study so heterogeneity could not be assessed | ||||||
| DOAC compared to heparin for people requiring prevention of venous thromboembolism following total hip or knee replacement or hip fracture repair | ||||||
| Patient or population: people requiring prevention of venous thromboembolism following total hip or knee replacement or hip fracture repair | ||||||
| Outcomes | Anticipated absolute effects* (95% CI) | Relative effect | Number of participants | Quality of the evidence | Comments | |
| Risk with heparin | Risk with DOAC | |||||
| Symptomatic VTE (DVT and PE) | Study population | OR 0.70 | 15977 | ⊕⊕⊝⊝ | — | |
| 4 per 1000 | 3 per 1000 | |||||
| Symptomatic DVT (proximal or distal) Treatment duration 28 ‐ 42 days | Study population | OR 0.60 | 15977 | ⊕⊕⊝⊝ | — | |
| 3 per 1000 | 2 per 1000 | |||||
| Symptomatic PE | Study population | OR 0.91 | 14731 | ⊕⊕⊕⊝ | — | |
| 2 per 1000 | 2 per 1000 | |||||
| Bleeding ‐ major Treatment duration 28 ‐ 42 days | Study population | OR 1.11 | 16199 | ⊕⊕⊕⊕ | — | |
| 8 per 1000 | 9 per 1000 | |||||
| Bleeding ‐ clinically relevant, non‐major | Study population | OR 1.08 | 15241 | ⊕⊕⊕⊕ | — | |
| 33 per 1000 | 36 per 1000 | |||||
| Bleeding ‐ minor Treatment duration 28 ‐ 42 days | Study population | OR 0.95 | 11766 | ⊕⊕⊕⊕ | — | |
| 66 per 1000 | 63 per 1000 | |||||
| *The risk in the intervention group (and its 95% confidence interval) is based on the assumed risk in the comparison group and the relative effect of the intervention (and its 95% CI). | ||||||
| GRADE Working Group grades of evidence | ||||||
| 1 Downgraded by one level for inconsistency (heterogeneity, I2 = 55%) | ||||||
| Outcome or subgroup title | No. of studies | No. of participants | Statistical method | Effect size |
| 1 Symptomatic VTE (DVT and PE) Show forest plot | 5 | 2329 | Odds Ratio (M‐H, Fixed, 95% CI) | 0.59 [0.35, 1.01] |
| 1.1 Hip replacement | 4 | 1296 | Odds Ratio (M‐H, Fixed, 95% CI) | 0.69 [0.36, 1.30] |
| 1.2 Knee replacement | 1 | 723 | Odds Ratio (M‐H, Fixed, 95% CI) | 0.78 [0.21, 2.92] |
| 1.3 Hip or knee replacement | 1 | 310 | Odds Ratio (M‐H, Fixed, 95% CI) | 0.22 [0.05, 1.06] |
| 2 Symptomatic DVT (proximal or distal) Show forest plot | 4 | 2019 | Odds Ratio (M‐H, Fixed, 95% CI) | 0.73 [0.39, 1.38] |
| 2.1 Hip replacement | 4 | 1296 | Odds Ratio (M‐H, Fixed, 95% CI) | 0.80 [0.41, 1.55] |
| 2.2 Knee replacement | 1 | 723 | Odds Ratio (M‐H, Fixed, 95% CI) | 0.32 [0.03, 3.12] |
| 3 Symptomatic PE Show forest plot | 3 | 1595 | Odds Ratio (M‐H, Fixed, 95% CI) | 0.61 [0.16, 2.33] |
| 3.1 Hip replacement | 3 | 872 | Odds Ratio (M‐H, Fixed, 95% CI) | 0.13 [0.01, 2.56] |
| 3.2 Knee replacement | 1 | 723 | Odds Ratio (M‐H, Fixed, 95% CI) | 1.47 [0.24, 8.83] |
| 4 Total VTE (symptomatic and asymptomatic) Show forest plot | 6 | 2544 | Odds Ratio (M‐H, Fixed, 95% CI) | 0.39 [0.28, 0.56] |
| 4.1 Hip replacement | 5 | 1511 | Odds Ratio (M‐H, Fixed, 95% CI) | 0.37 [0.25, 0.56] |
| 4.2 Knee replacement | 1 | 723 | Odds Ratio (M‐H, Fixed, 95% CI) | 0.78 [0.21, 2.92] |
| 4.3 Hip or knee replacement | 1 | 310 | Odds Ratio (M‐H, Fixed, 95% CI) | 0.38 [0.16, 0.90] |
| 5 Asymptomatic DVT Show forest plot | 5 | 1304 | Odds Ratio (M‐H, Fixed, 95% CI) | 0.38 [0.24, 0.60] |
| 5.1 Hip replacement | 4 | 994 | Odds Ratio (M‐H, Fixed, 95% CI) | 0.35 [0.21, 0.58] |
| 5.2 Hip or knee replacement | 1 | 310 | Odds Ratio (M‐H, Fixed, 95% CI) | 0.54 [0.19, 1.52] |
| 6 All‐cause mortality Show forest plot | 5 | 2518 | Odds Ratio (M‐H, Fixed, 95% CI) | 1.01 [0.31, 3.26] |
| 6.1 Hip replacement | 4 | 1485 | Odds Ratio (M‐H, Fixed, 95% CI) | 0.56 [0.11, 2.75] |
| 6.2 Knee replacement | 1 | 723 | Odds Ratio (M‐H, Fixed, 95% CI) | 0.98 [0.06, 15.65] |
| 6.3 Hip or knee replacement | 1 | 310 | Odds Ratio (M‐H, Fixed, 95% CI) | 4.69 [0.22, 98.42] |
| 7 Adverse events Show forest plot | 2 | 460 | Odds Ratio (M‐H, Fixed, 95% CI) | 1.06 [0.68, 1.64] |
| 7.1 Hip replacement | 2 | 460 | Odds Ratio (M‐H, Fixed, 95% CI) | 1.06 [0.68, 1.64] |
| 8 Bleeding ‐ major Show forest plot | 5 | 2500 | Odds Ratio (M‐H, Fixed, 95% CI) | 0.59 [0.14, 2.46] |
| 8.1 Hip replacement | 4 | 1494 | Odds Ratio (M‐H, Fixed, 95% CI) | 0.32 [0.03, 3.10] |
| 8.2 Knee replacement | 1 | 696 | Odds Ratio (M‐H, Fixed, 95% CI) | 0.99 [0.14, 7.06] |
| 8.3 Hip or knee replacement | 1 | 310 | Odds Ratio (M‐H, Fixed, 95% CI) | 0.0 [0.0, 0.0] |
| 9 Bleeding ‐ minor Show forest plot | 5 | 2500 | Odds Ratio (M‐H, Fixed, 95% CI) | 2.01 [1.43, 2.81] |
| 9.1 Hip replacement | 4 | 1494 | Odds Ratio (M‐H, Fixed, 95% CI) | 2.25 [1.53, 3.30] |
| 9.2 Knee replacement | 1 | 696 | Odds Ratio (M‐H, Fixed, 95% CI) | 1.23 [0.58, 2.59] |
| 9.3 Hip or knee replacement | 1 | 310 | Odds Ratio (M‐H, Fixed, 95% CI) | 2.79 [0.11, 69.13] |
| 10 Reoperation Show forest plot | 1 | 179 | Odds Ratio (M‐H, Fixed, 95% CI) | 0.0 [0.0, 0.0] |
| 10.1 Hip replacement | 1 | 179 | Odds Ratio (M‐H, Fixed, 95% CI) | 0.0 [0.0, 0.0] |
| Outcome or subgroup title | No. of studies | No. of participants | Statistical method | Effect size |
| 1 Symptomatic VTE (DVT and PE) Show forest plot | 1 | 360 | Odds Ratio (M‐H, Fixed, 95% CI) | 0.10 [0.01, 1.94] |
| 1.1 Hip replacement | 1 | 360 | Odds Ratio (M‐H, Fixed, 95% CI) | 0.10 [0.01, 1.94] |
| 2 Symptomatic DVT (proximal or distal) Show forest plot | 1 | 360 | Odds Ratio (M‐H, Fixed, 95% CI) | 0.13 [0.01, 2.62] |
| 2.1 Hip replacement | 1 | 360 | Odds Ratio (M‐H, Fixed, 95% CI) | 0.13 [0.01, 2.62] |
| 3 Symptomatic PE Show forest plot | 1 | 360 | Odds Ratio (M‐H, Fixed, 95% CI) | 0.32 [0.01, 7.84] |
| 3.1 Hip replacement | 1 | 360 | Odds Ratio (M‐H, Fixed, 95% CI) | 0.32 [0.01, 7.84] |
| 4 Total VTE (symptomatic and asymptomatic) Show forest plot | 1 | 360 | Odds Ratio (M‐H, Fixed, 95% CI) | 0.10 [0.01, 0.81] |
| 4.1 Hip replacement | 1 | 360 | Odds Ratio (M‐H, Fixed, 95% CI) | 0.10 [0.01, 0.81] |
| 5 All‐cause mortality Show forest plot | 1 | 360 | Odds Ratio (M‐H, Fixed, 95% CI) | 0.0 [0.0, 0.0] |
| 5.1 Hip replacement | 1 | 360 | Odds Ratio (M‐H, Fixed, 95% CI) | 0.0 [0.0, 0.0] |
| 6 Adverse events Show forest plot | 1 | 360 | Odds Ratio (M‐H, Fixed, 95% CI) | 0.0 [0.0, 0.0] |
| 6.1 Hip replacement | 1 | 360 | Odds Ratio (M‐H, Fixed, 95% CI) | 0.0 [0.0, 0.0] |
| 7 Bleeding ‐ major Show forest plot | 1 | 360 | Odds Ratio (M‐H, Fixed, 95% CI) | 2.89 [0.12, 71.31] |
| 7.1 Hip replacement | 1 | 360 | Odds Ratio (M‐H, Fixed, 95% CI) | 2.89 [0.12, 71.31] |
| Outcome or subgroup title | No. of studies | No. of participants | Statistical method | Effect size |
| 1 Symptomatic VTE (DVT and PE) Show forest plot | 1 | 2419 | Odds Ratio (M‐H, Fixed, 95% CI) | 0.20 [0.06, 0.68] |
| 1.1 Hip replacement | 1 | 2419 | Odds Ratio (M‐H, Fixed, 95% CI) | 0.20 [0.06, 0.68] |
| 2 Symptomatic DVT (proximal or distal) Show forest plot | 2 | 2459 | Odds Ratio (M‐H, Fixed, 95% CI) | 0.18 [0.04, 0.81] |
| 2.1 Hip replacement | 2 | 2459 | Odds Ratio (M‐H, Fixed, 95% CI) | 0.18 [0.04, 0.81] |
| 3 Symptomatic PE Show forest plot | 1 | 1733 | Odds Ratio (M‐H, Fixed, 95% CI) | 0.25 [0.03, 2.25] |
| 3.1 Hip replacement | 1 | 1733 | Odds Ratio (M‐H, Fixed, 95% CI) | 0.25 [0.03, 2.25] |
| 4 Total VTE (symptomatic and asymptomatic) Show forest plot | 1 | 1733 | Odds Ratio (M‐H, Fixed, 95% CI) | 0.19 [0.11, 0.33] |
| 4.1 Hip replacement | 1 | 1733 | Odds Ratio (M‐H, Fixed, 95% CI) | 0.19 [0.11, 0.33] |
| 5 All‐cause mortality Show forest plot | 1 | 1733 | Odds Ratio (M‐H, Fixed, 95% CI) | 0.33 [0.07, 1.66] |
| 5.1 Hip replacement | 1 | 1733 | Odds Ratio (M‐H, Fixed, 95% CI) | 0.33 [0.07, 1.66] |
| 6 Adverse events Show forest plot | 1 | 2457 | Odds Ratio (M‐H, Fixed, 95% CI) | 0.87 [0.74, 1.03] |
| 6.1 Hip replacement | 1 | 2457 | Odds Ratio (M‐H, Fixed, 95% CI) | 0.87 [0.74, 1.03] |
| 7 Bleeding ‐ major Show forest plot | 1 | 2457 | Odds Ratio (M‐H, Fixed, 95% CI) | 1.00 [0.06, 16.02] |
| 7.1 Hip replacement | 1 | 2457 | Odds Ratio (M‐H, Fixed, 95% CI) | 1.00 [0.06, 16.02] |
| 8 Bleeding‐ clinically relevant non‐major Show forest plot | 1 | 2457 | Odds Ratio (M‐H, Fixed, 95% CI) | 1.22 [0.76, 1.95] |
| 8.1 Hip replacement | 1 | 2457 | Odds Ratio (M‐H, Fixed, 95% CI) | 1.22 [0.76, 1.95] |
| 9 Bleeding ‐ minor Show forest plot | 1 | 2457 | Odds Ratio (M‐H, Fixed, 95% CI) | 1.18 [0.74, 1.88] |
| 9.1 Hip replacement | 1 | 2457 | Odds Ratio (M‐H, Fixed, 95% CI) | 1.18 [0.74, 1.88] |
| 10 Reoperation Show forest plot | 1 | 2457 | Odds Ratio (M‐H, Fixed, 95% CI) | 0.0 [0.0, 0.0] |
| 10.1 Hip replacement | 1 | 2457 | Odds Ratio (M‐H, Fixed, 95% CI) | 0.0 [0.0, 0.0] |
| 11 Wound infection Show forest plot | 1 | 2457 | Odds Ratio (M‐H, Fixed, 95% CI) | 1.34 [0.46, 3.86] |
| 11.1 Hip replacement | 1 | 2457 | Odds Ratio (M‐H, Fixed, 95% CI) | 1.34 [0.46, 3.86] |
| Outcome or subgroup title | No. of studies | No. of participants | Statistical method | Effect size |
| 1 Symptomatic VTE (DVT and PE) Show forest plot | 1 | 557 | Odds Ratio (M‐H, Fixed, 95% CI) | 0.50 [0.09, 2.74] |
| 1.1 Knee replacement | 1 | 557 | Odds Ratio (M‐H, Fixed, 95% CI) | 0.50 [0.09, 2.74] |
| 2 Symptomatic DVT (proximal or distal) Show forest plot | 1 | 557 | Odds Ratio (M‐H, Fixed, 95% CI) | 0.33 [0.03, 3.21] |
| 2.1 Knee replacement | 1 | 557 | Odds Ratio (M‐H, Fixed, 95% CI) | 0.33 [0.03, 3.21] |
| 3 Symptomatic PE Show forest plot | 1 | 557 | Odds Ratio (M‐H, Fixed, 95% CI) | 1.00 [0.06, 16.13] |
| 3.1 Knee replacement | 1 | 557 | Odds Ratio (M‐H, Fixed, 95% CI) | 1.00 [0.06, 16.13] |
| 4 Total VTE (symptomatic and asymptomatic) Show forest plot | 1 | 557 | Odds Ratio (M‐H, Fixed, 95% CI) | 0.26 [0.14, 0.50] |
| 4.1 Knee replacement | 1 | 557 | Odds Ratio (M‐H, Fixed, 95% CI) | 0.26 [0.14, 0.50] |
| 5 Asymptomatic DVT Show forest plot | 1 | 557 | Odds Ratio (M‐H, Fixed, 95% CI) | 0.26 [0.13, 0.54] |
| 5.1 Knee replacement | 1 | 557 | Odds Ratio (M‐H, Fixed, 95% CI) | 0.26 [0.13, 0.54] |
| 6 Asymptomatic distal DVT Show forest plot | 1 | 557 | Odds Ratio (M‐H, Fixed, 95% CI) | 0.26 [0.13, 0.54] |
| 6.1 Knee replacement | 1 | 557 | Odds Ratio (M‐H, Fixed, 95% CI) | 0.26 [0.13, 0.54] |
| 7 All‐cause mortality Show forest plot | 1 | 842 | Odds Ratio (M‐H, Fixed, 95% CI) | 0.0 [0.0, 0.0] |
| 7.1 Knee replacement | 1 | 842 | Odds Ratio (M‐H, Fixed, 95% CI) | 0.0 [0.0, 0.0] |
| 8 Bleeding ‐ major Show forest plot | 1 | 557 | Odds Ratio (M‐H, Fixed, 95% CI) | 5.05 [0.24, 105.76] |
| 8.1 Knee replacement | 1 | 557 | Odds Ratio (M‐H, Fixed, 95% CI) | 5.05 [0.24, 105.76] |
| Outcome or subgroup title | No. of studies | No. of participants | Statistical method | Effect size |
| 1 Symptomatic VTE (DVT and PE) Show forest plot | 1 | 1279 | Odds Ratio (M‐H, Fixed, 95% CI) | 1.64 [0.85, 3.16] |
| 1.1 Hip replacement | 1 | 1279 | Odds Ratio (M‐H, Fixed, 95% CI) | 1.64 [0.85, 3.16] |
| 2 Symptomatic DVT (proximal or distal) Show forest plot | 1 | 1279 | Odds Ratio (M‐H, Fixed, 95% CI) | 1.36 [0.69, 2.68] |
| 2.1 Hip replacement | 1 | 1279 | Odds Ratio (M‐H, Fixed, 95% CI) | 1.36 [0.69, 2.68] |
| 3 Symptomatic PE Show forest plot | 1 | 1279 | Odds Ratio (M‐H, Fixed, 95% CI) | 9.16 [0.49, 170.42] |
| 3.1 Hip replacement | 1 | 1279 | Odds Ratio (M‐H, Fixed, 95% CI) | 9.16 [0.49, 170.42] |
| 4 Total VTE (symptomatic and asymptomatic) Show forest plot | 1 | 1279 | Odds Ratio (M‐H, Fixed, 95% CI) | 1.64 [0.85, 3.16] |
| 4.1 Hip replacement | 1 | 1279 | Odds Ratio (M‐H, Fixed, 95% CI) | 1.64 [0.85, 3.16] |
| 5 All‐cause mortality Show forest plot | 1 | 1279 | Odds Ratio (M‐H, Fixed, 95% CI) | 5.07 [0.24, 105.83] |
| 5.1 Hip replacement | 1 | 1279 | Odds Ratio (M‐H, Fixed, 95% CI) | 5.07 [0.24, 105.83] |
| 6 Bleeding ‐ major Show forest plot | 1 | 1272 | Odds Ratio (M‐H, Fixed, 95% CI) | 3.87 [1.91, 7.85] |
| 6.1 Hip replacement | 1 | 1272 | Odds Ratio (M‐H, Fixed, 95% CI) | 3.87 [1.91, 7.85] |
| 7 Bleeding ‐ minor Show forest plot | 1 | 1279 | Odds Ratio (M‐H, Fixed, 95% CI) | 1.33 [0.64, 2.76] |
| 7.1 Hip replacement | 1 | 1279 | Odds Ratio (M‐H, Fixed, 95% CI) | 1.33 [0.64, 2.76] |
| 8 Reoperation Show forest plot | 1 | 1279 | Odds Ratio (M‐H, Fixed, 95% CI) | 4.60 [0.99, 21.38] |
| 8.1 Hip replacement | 1 | 1279 | Odds Ratio (M‐H, Fixed, 95% CI) | 4.60 [0.99, 21.38] |
| Outcome or subgroup title | No. of studies | No. of participants | Statistical method | Effect size |
| 1 Symptomatic VTE (DVT and PE) Show forest plot | 5 | 15977 | Odds Ratio (M‐H, Random, 95% CI) | 0.70 [0.28, 1.70] |
| 1.1 Hip replacement | 5 | 15977 | Odds Ratio (M‐H, Random, 95% CI) | 0.70 [0.28, 1.70] |
| 2 Symptomatic DVT (proximal or distal) Show forest plot | 5 | 15977 | Odds Ratio (M‐H, Random, 95% CI) | 0.60 [0.11, 3.27] |
| 2.1 Hip replacement | 5 | 15977 | Odds Ratio (M‐H, Random, 95% CI) | 0.60 [0.11, 3.27] |
| 3 Symptomatic PE Show forest plot | 5 | 14731 | Odds Ratio (M‐H, Fixed, 95% CI) | 0.91 [0.43, 1.94] |
| 3.1 Hip replacement | 5 | 14731 | Odds Ratio (M‐H, Fixed, 95% CI) | 0.91 [0.43, 1.94] |
| 4 Total VTE (symptomatic and asymptomatic) Show forest plot | 4 | 12447 | Odds Ratio (M‐H, Random, 95% CI) | 0.53 [0.29, 0.97] |
| 4.1 Hip replacement | 4 | 12447 | Odds Ratio (M‐H, Random, 95% CI) | 0.53 [0.29, 0.97] |
| 5 Asymptomatic DVT Show forest plot | 2 | 6559 | Odds Ratio (M‐H, Random, 95% CI) | 0.56 [0.19, 1.59] |
| 5.1 Hip replacement | 2 | 6559 | Odds Ratio (M‐H, Random, 95% CI) | 0.56 [0.19, 1.59] |
| 6 Asymptomatic proximal DVT Show forest plot | 1 | 2704 | Odds Ratio (M‐H, Fixed, 95% CI) | 0.73 [0.46, 1.15] |
| 6.1 Hip replacement | 1 | 2704 | Odds Ratio (M‐H, Fixed, 95% CI) | 0.73 [0.46, 1.15] |
| 7 Asymptomatic distal DVT Show forest plot | 1 | 2639 | Odds Ratio (M‐H, Fixed, 95% CI) | 1.22 [0.75, 1.99] |
| 7.1 Hip replacement | 1 | 2639 | Odds Ratio (M‐H, Fixed, 95% CI) | 1.22 [0.75, 1.99] |
| 8 All‐cause mortality Show forest plot | 5 | 14966 | Odds Ratio (M‐H, Fixed, 95% CI) | 1.63 [0.64, 4.16] |
| 8.1 Hip replacement | 5 | 14966 | Odds Ratio (M‐H, Fixed, 95% CI) | 1.63 [0.64, 4.16] |
| 9 Adverse events Show forest plot | 3 | 9908 | Odds Ratio (M‐H, Fixed, 95% CI) | 0.96 [0.88, 1.05] |
| 9.1 Hip replacement | 3 | 9908 | Odds Ratio (M‐H, Fixed, 95% CI) | 0.96 [0.88, 1.05] |
| 10 Bleeding ‐ major Show forest plot | 5 | 16199 | Odds Ratio (M‐H, Fixed, 95% CI) | 1.11 [0.79, 1.54] |
| 10.1 Hip replacement | 5 | 16199 | Odds Ratio (M‐H, Fixed, 95% CI) | 1.11 [0.79, 1.54] |
| 11 Bleeding ‐ clinically relevant, non‐major Show forest plot | 4 | 15241 | Odds Ratio (M‐H, Fixed, 95% CI) | 1.08 [0.90, 1.28] |
| 11.1 Hip replacement | 4 | 15241 | Odds Ratio (M‐H, Fixed, 95% CI) | 1.08 [0.90, 1.28] |
| 12 Bleeding ‐ minor Show forest plot | 4 | 11766 | Odds Ratio (M‐H, Fixed, 95% CI) | 0.95 [0.82, 1.10] |
| 12.1 Hip replacement | 4 | 11766 | Odds Ratio (M‐H, Fixed, 95% CI) | 0.95 [0.82, 1.10] |
| 13 Reoperation Show forest plot | 4 | 15241 | Odds Ratio (M‐H, Fixed, 95% CI) | 1.06 [0.34, 3.24] |
| 13.1 Hip replacement | 4 | 15241 | Odds Ratio (M‐H, Fixed, 95% CI) | 1.06 [0.34, 3.24] |
| 14 Wound infection Show forest plot | 2 | 6446 | Odds Ratio (M‐H, Fixed, 95% CI) | 0.89 [0.46, 1.72] |
| 14.1 Hip replacement | 2 | 6446 | Odds Ratio (M‐H, Fixed, 95% CI) | 0.89 [0.46, 1.72] |