抗凝剂(延长疗程)预防全髋关节或膝关节置换术或髋部骨折修复术后静脉血栓栓塞
Appendices
Appendix 1. CENTRAL search strategy
| #1 | MeSH descriptor: [Thrombosis] this term only | 1309 |
| #2 | MeSH descriptor: [Thromboembolism] this term only | 1067 |
| #3 | MeSH descriptor: [Venous Thromboembolism] this term only | 461 |
| #4 | MeSH descriptor: [Venous Thrombosis] this term only | 1060 |
| #5 | (thromboprophyla* or thrombus* or thrombotic* or thrombolic* or thromboemboli* or thrombos* or embol*):ti,ab,kw | 17234 |
| #6 | MeSH descriptor: [Pulmonary Embolism] explode all trees | 944 |
| #7 | PE or DVT or VTE:ti,ab,kw | 4161 |
| #8 | (vein* or ven*) near thromb*:ti,ab,kw | 6917 |
| #9 | #1 or #2 or #3 or #4 or #5 or #6 or #7 or #8 | 20147 |
| #10 | MeSH descriptor: [Anticoagulants] explode all trees | 4058 |
| #11 | anticoagul* or anti‐coagu* or antithrombotic* | 9328 |
| #12 | warfarin or (vitamin near/3 antagonist*) or VKA or Nicoumalone or phenindione or acenocoumarol* or Sinthrome or dicoumarol* or nicoumalone or phenprocoumon or Marcoumar or Marcumar or Falithrom or AVK or bishydroxycoumarin* or coumarin* or coumadin* or phenprocoumon* | 4024 |
| #13 | Ximelagatran or Exanta or Exarta or H 376/95 or dabigatran or rivaroxaban or Xarelto | 874 |
| #14 | fondaparinux or Arixtra or BAY59‐7939 or TTP889 or odiparcil or LY517717 or YM150 or DU‐176b | 395 |
| #15 | apixaban or betrixaban or edoxaban or idraparinux | 402 |
| #16 | LMWH or UFH or heparin or nadroparin* or fraxiparin* or enoxaparin | 9899 |
| #17 | Clexane or klexane or lovenox or dalteparin or Fragmin or ardeparin | 762 |
| #18 | normiflo or tinzaparin or logiparin or Innohep or certoparin or sandoparin or reviparin or clivarin* | 432 |
| #19 | danaproid or danaparoid or antixarin or ardeparin* or bemiparin* | 136 |
| #20 | Zibor or cy 222 or embolex or monoembolex or parnaparin* | 128 |
| #21 | rd 11885 or tedelparin or Kabi‐2165 or Kabi 2165 | 78 |
| #22 | emt‐966 or emt‐967 or "pk‐10 169" or pk‐10169 or pk10169 or cy‐216 or cy216 | 83 |
| #23 | seleparin* or tedegliparin or seleparin* or tedegliparin* | 19 |
| #24 | wy90493 or "wy 90493" or "kb 101" or kb101 | 21 |
| #25 | lomoparan or orgaran or parnaparin or fluxum or lohepa or lowhepa or "op 2123" or parvoparin or AVE5026 | 113 |
| #26 | #10 or #11 or #12 or #13 or #14 or #15 or #16 or #17 or #18 or #19 or #20 or #21 or #22 or #23 or #24 or #25 | 17458 |
| #27 | MeSH descriptor: [Hip] explode all trees | 309 |
| #28 | MeSH descriptor: [Knee] explode all trees | 584 |
| #29 | hip:ti,ab,kw (Word variations have been searched) | 11495 |
| #30 | knee:ti,ab,kw (Word variations have been searched) | 13133 |
| #31 | orthop?edic | 6896 |
| #32 | MeSH descriptor: [Orthopedic Procedures] explode all trees | 10000 |
| #33 | #27 or #28 or #29 or #30 or #31 or #32 | 31372 |
| #34 | #9 and #26 and #33 | 1182 |
Appendix 2. Additional Summary of findings table: Heparin compared to placebo for prevention of venous thromboembolism following total hip or knee replacement or hip fracture repair
| Heparin compared to placebo for prevention of venous thromboembolism following total hip or knee replacement or hip fracture repair | ||||||
| Patient or population: people requiring prevention of venous thromboembolism following total hip or knee replacement or hip fracture repair | ||||||
| Outcomes | Anticipated absolute effects* (95% CI) | Relative effect | Number of participants | Quality of the evidence | Comments | |
| Risk with placebo | Risk with heparin | |||||
| Total VTE (symptomatic and asymptomatic) Treatment duration 28 ‐ 42 days | Study population | OR 0.39 | 2544 | ⊕⊕⊕⊕ | — | |
| 83 per 1000 | 34 per 1000 | |||||
| Asymptomatic DVT Treatment duration 28 ‐ 42 days | Study population | OR 0.38 | 1304 | ⊕⊕⊕⊕ | — | |
| 112 per 1000 | 46 per 1000 | |||||
| Asymptomatic proximal DVT Treatment duration 28 ‐ 42 days | see comment | not estimable | — | — | asymptomatic and proximal DVT reported separately but due to available data it was not possible to determine which events fell into which category | |
| Asymptomatic distal DVT Treatment duration 28 ‐ 42 days | see comment | not estimable | — | — | asymptomatic and distal DVT reported separately but due to available data it was not possible to determine which events fell into which category | |
| All‐cause mortality Treatment duration 28 ‐ 42 days | Study population | OR 1.01 | 2518 | ⊕⊕⊕⊝ | — | |
| 4 per 1000 | 4 per 1000 | |||||
| Adverse events Treatment duration 28 ‐ 42 days | Study population | OR 1.06 | 460 | ⊕⊕⊕⊝ | — | |
| 270 per 1000 | 281 per 1000 | |||||
| Reoperation | see comment | — | 179 | — | one study reported no operations in either study arm. Three studies did not report on reoperation and two studies did not report sufficient data to analyse | |
| Wound infection Treatment duration 28 ‐ 42 days | see comment | — | — | — | four studies did not report on wound infection. Two studies did not provide specific details for wound infection | |
| Wound healing Treatment duration 28 ‐ 42 days | see comment | — | — | — | not reported | |
| *The risk in the intervention group (and its 95% confidence interval) is based on the assumed risk in the comparison group and the relative effect of the intervention (and its 95% CI). | ||||||
| GRADE Working Group grades of evidence | ||||||
1 Downgraded by one level, low number of events leading to imprecision of results
2 Downgraded by one level due to imprecision
Appendix 3. Additional Summary of findings table: Vitamin K antagonists compared to placebo for prevention of venous thromboembolism following total hip or knee replacement or hip fracture repair
| Vitamin K antagonists compared to placebo for prevention of venous thromboembolism following total hip or knee replacement or hip fracture repair | ||||||
| Patient or population: people requiring prevention of venous thromboembolism following total hip or knee replacement or hip fracture repair | ||||||
| Outcomes | Anticipated absolute effects* (95% CI) | Relative effect | Number of participants | Quality of the evidence | Comments | |
| Risk with placebo | Risk with vitamin K antagonists | |||||
| Total VTE (symptomatic and asymptomatic) | Study population | OR 0.10 | 360 | ⊕⊕⊕⊝ | — | |
| 51 per 1000 | 5 per 1000 | |||||
| Asymptomatic DVT Treatment duration 28 ‐ 42 days | see comment | — | — | — | not reported in single included study in this comparison | |
| Asymptomatic proximal DVT Treatment duration 28 ‐ 42 days | see comment | — | — | — | not reported in single included study in this comparison | |
| Asymptomatic distal DVT Treatment duration 28 ‐ 42 days | see comment | — | — | — | not reported in single included study in this comparison | |
| All‐cause mortality Treatment duration 28 ‐ 42 days | see comment | — | 360 | — | single included study reported no deaths in either study arm so not possible to assess risk | |
| Adverse events Treatment duration 28 ‐ 42 days | see comment | — | 360 | — | single included study reported no adverse events in either study arm so not possible to assess risk | |
| Reoperation | see comment | — | — | — | not reported in single included study in this comparison | |
| Wound infection Treatment duration 28 ‐ 42 days | see comment | — | — | — | not reported in single included study in this comparison | |
| Wound healing Treatment duration 28 ‐ 42 days | see comment | — | — | — | not reported in single included study in this comparison | |
| *The risk in the intervention group (and its 95% confidence interval) is based on the assumed risk in the comparison group and the relative effect of the intervention (and its 95% CI). | ||||||
| GRADE Working Group grades of evidence | ||||||
1 Downgraded by one level, results from a single study only so heterogeneity could not be assessed
Appendix 4. Additional Summary of findings table: DOAC compared to placebo for prevention of venous thromboembolism following total hip or knee replacement or hip fracture repair
| DOAC compared to placebo for prevention of venous thromboembolism following total hip or knee replacement or hip fracture repair | ||||||
| Patient or population: people requiring prevention of venous thromboembolism following total hip or knee replacement or hip fracture repair | ||||||
| Outcomes | Anticipated absolute effects* (95% CI) | Relative effect | Number of participants | Quality of the evidence | Comments | |
| Risk with placebo | Risk with DOAC | |||||
| Total VTE (symptomatic and asymptomatic) Treatment duration 28 ‐ 42 days | Study population | OR 0.19 | 1733 | ⊕⊕⊕⊝ | — | |
| 86 per 1000 | 18 per 1000 | |||||
| Asymptomatic DVT Treatment duration 28 ‐ 42 days | see comment | — | — | — | not reported in single included study in this comparison | |
| Asymptomatic proximal DVT Treatment duration 28 ‐ 42 days | see comment | — | — | — | not reported in single included study in this comparison | |
| Asymptomatic distal DVT Treatment duration 28 ‐ 42 days | see comment | — | — | — | not reported in single included study in this comparison | |
| All‐cause mortality Treatment duration 28 ‐ 42 days | Study population | OR 0.33 | 1733 | ⊕⊕⊝⊝ | — | |
| 7 per 1000 | 2 per 1000 | |||||
| Adverse events Treatment duration 28 ‐ 42 days | Study population | OR 0.87 | 2457 | ⊕⊕⊕⊝ | — | |
| 657 per 1000 | 625 per 1000 | |||||
| Reoperation | see comment | — | 2457 | — | single study reported no cases of reoperation in the study arms | |
| Wound infection Treatment duration 28 ‐ 42 days | Study population | OR 1.34 | 2457 | ⊕⊕⊝⊝ | — | |
| 5 per 1000 | 7 per 1000 | |||||
| Wound healing Treatment duration 28 ‐ 42 days | see comment | — | — | — | not reported in single included study in this comparison | |
| *The risk in the intervention group (and its 95% confidence interval) is based on the assumed risk in the comparison group and the relative effect of the intervention (and its 95% CI). | ||||||
| GRADE Working Group grades of evidence | ||||||
1 Downgraded by one level, results from a single study so heterogeneity cannot be assessed
2 Downgraded by one level, low number of events leading to wide CI and imprecision of results
Appendix 5. Additional Summary of findings table: Anticoagulants (chosen at investigators' discretion) compared to placebo for prevention of venous thromboembolism following total hip or knee replacement or hip fracture repair
| Anticoagulants (chosen at investigators' discretion) compared to placebo for prevention of venous thromboembolism following total hip or knee replacement or hip fracture repair | ||||||
| Patient or population: people requiring prevention of venous thromboembolism following total hip or knee replacement or hip fracture repair | ||||||
| Outcomes | Anticipated absolute effects* (95% CI) | Relative effect | Number of participants | Quality of the evidence | Comments | |
| Risk with placebo | Risk with anticoagulant (chosen at investigators' discretion) | |||||
| Total VTE (symptomatic and asymptomatic) Treatment duration 28 ‐ 42 days | Study population | OR 0.26 | 557 | ⊕⊕⊕⊝ | — | |
| 158 per 1000 | 46 per 1000 | |||||
| Asymptomatic DVT Treatment duration 28 ‐ 42 days | Study population | OR 0.26 | 557 | ⊕⊕⊕⊝ | — | |
| 125 per 1000 | 36 per 1000 | |||||
| Asymptomatic proximal DVT Treatment duration 28 ‐ 42 days | see comment | — | — | — | not reported in single included study in this comparison | |
| Asymptomatic distal DVT Treatment duration 28 ‐ 42 days | Study population | OR 0.26 | 557 | ⊕⊕⊕⊝ | — | |
| 125 per 1000 | 36 per 1000 | |||||
| All‐cause mortality Treatment duration 28 ‐ 42 days | see comment | — | 842 | — | the single included study reported no deaths in either study arm | |
| Adverse events Treatment duration 28 ‐ 42 days | see comment | — | — | — | not reported in single included study in this comparison | |
| Reoperation | see comment | — | — | — | outcome reported as part of the definition of the outcome major bleeding but data not reported separately | |
| Wound infection Treatment duration 28 ‐ 42 days | see comment | — | — | — | not reported in single included study in this comparison | |
| Wound healing Treatment duration 28 ‐ 42 days | see comment | — | — | — | not reported in single included study in this comparison | |
| *The risk in the intervention group (and its 95% confidence interval) is based on the assumed risk in the comparison group and the relative effect of the intervention (and its 95% CI). | ||||||
| GRADE Working Group grades of evidence | ||||||
1 Downgraded by one level, results from a single study so heterogeneity could not be assessed
Appendix 6. Additional Summary of findings table: Vitamin K antagonists compared to heparin for prevention of venous thromboembolism following total hip or knee replacement or hip fracture repair
| Vitamin K antagonists compared to heparin for prevention of venous thromboembolism following total hip or knee replacement or hip fracture repair | ||||||
| Patient or population: people requiring prevention of venous thromboembolism following total hip or knee replacement or hip fracture repair | ||||||
| Outcomes | Anticipated absolute effects* (95% CI) | Relative effect | Number of participants | Quality of the evidence | Comments | |
| Risk with heparin | Risk with vitamin K antagonists | |||||
| Total VTE (symptomatic and asymptomatic) Treatment duration 28 ‐ 42 days | Study population | OR 1.64 | 1279 | ⊕⊕⊝⊝ | — | |
| 23 per 1000 | 38 per 1000 | |||||
| Asymptomatic DVT Treatment duration 28 ‐ 42 days | see comment | — | — | — | not reported in single included study in this comparison | |
| Asymptomatic proximal DVT Treatment duration 28 ‐ 42 days | see comment | — | — | — | not reported in single included study in this comparison | |
| Asymptomatic distal DVT Treatment duration 28 ‐ 42 days | see comment | — | — | — | not reported in single included study in this comparison | |
| All‐cause mortality Treatment duration 28 ‐ 42 days | see comment | OR 5.07 | 1279 | ⊕⊕⊝⊝ | no cases of death reported in the heparin study arm | |
| Adverse events Treatment duration 28 ‐ 42 days | see comment | — | — | — | not reported in single included study in this comparison | |
| Reoperation | Study population | OR 4.60 | 1279 | ⊕⊕⊝⊝ | — | |
| 3 per 1000 | 14 per 1000 | |||||
| Wound infection Treatment duration 28 ‐ 42 days | see comment | — | — | — | not reported in single included study in this comparison | |
| Wound healing Treatment duration 28 ‐ 42 days | see comment | — | — | — | not reported in single included study in this comparison | |
| *The risk in the intervention group (and its 95% confidence interval) is based on the assumed risk in the comparison group and the relative effect of the intervention (and its 95% CI). | ||||||
| GRADE Working Group grades of evidence | ||||||
1 Downgraded by one level, single study so heterogeneity could not be assessed
2 Downgraded by one level, wide CI
3 Downgraded by one level, low number of events leading to imprecision of results
Appendix 7. Additional Summary of findings table: DOAC compared to heparin for people requiring prevention of venous thromboembolism following total hip or knee replacement or hip fracture repair
| DOAC compared to heparin for people requiring prevention of venous thromboembolism following total hip or knee replacement or hip fracture repair | ||||||
| Patient or population: people requiring prevention of venous thromboembolism following total hip or knee replacement or hip fracture repair | ||||||
| Outcomes | Anticipated absolute effects* (95% CI) | Relative effect | Number of participants | Quality of the evidence | Comments | |
| Risk with heparin | Risk with DOAC | |||||
| Total VTE (symptomatic and asymptomatic) Treatment duration 28 ‐ 42 days | Study population | OR 0.53 | 12447 | ⊕⊕⊕⊝ | — | |
| 41 per 1000 | 22 per 1000 | |||||
| Asymptomatic DVT Treatment duration 28 ‐ 42 days | Study population | OR 0.56 | 6559 | ⊕⊕⊝⊝ | — | |
| 42 per 1000 | 24 per 1000 | |||||
| Asymptomatic proximal DVT Treatment duration 28 ‐ 42 days | Study population | OR 0.73 | 2704 | ⊕⊕⊕⊝ | — | |
| 35 per 1000 | 26 per 1000 | |||||
| Asymptomatic distal DVT Treatment duration 28 ‐ 42 days | Study population | OR 1.22 | 2639 | ⊕⊕⊕⊝ | — | |
| 27 per 1000 | 33 per 1000 | |||||
| All‐cause mortality Treatment duration 28 ‐ 42 days | Study population | OR 1.63 | 14966 | ⊕⊕⊕⊝ | — | |
| 1 per 1000 | 1 per 1000 | |||||
| Adverse events Treatment duration 28 ‐ 42 days | Study population | OR 0.96 | 9908 | ⊕⊕⊕⊕ | — | |
| 691 per 1000 | 682 per 1000 | |||||
| Reoperation Treatment duration 28 ‐ 42 days | Study population | OR 1.06 | 15241 | ⊕⊕⊕⊝ | — | |
| 1 per 1000 | 1 per 1000 | |||||
| Wound infection Treatment duration 28 ‐ 42 days | Study population | OR 0.89 | 6446 | ⊕⊕⊕⊝ | — | |
| 6 per 1000 | 5 per 1000 | |||||
| Wound healing Treatment duration 28 ‐ 42 days | see comment | — | — | — | not reported in five included studies in this comparison | |
| *The risk in the intervention group (and its 95% confidence interval) is based on the assumed risk in the comparison group and the relative effect of the intervention (and its 95% CI). | ||||||
| GRADE Working Group grades of evidence | ||||||
1 Downgraded by one level for inconsistency (heterogeneity, I2 = 87%)
2 Downgraded by two levels for serious inconsistency (heterogeneity, I2 = 92%)
3 Downgraded by one level, single included study so unable to assess heterogeneity
4 Downgraded by one level, few events leading to wide CI and imprecision

Study flow diagram.

Risk of bias graph: review authors' judgements about each risk of bias item presented as percentages across all included studies.

Risk of bias summary: review authors' judgements about each risk of bias item for each included study.

Comparison 1 Heparin versus placebo, Outcome 1 Symptomatic VTE (DVT and PE).

Comparison 1 Heparin versus placebo, Outcome 2 Symptomatic DVT (proximal or distal).

Comparison 1 Heparin versus placebo, Outcome 3 Symptomatic PE.
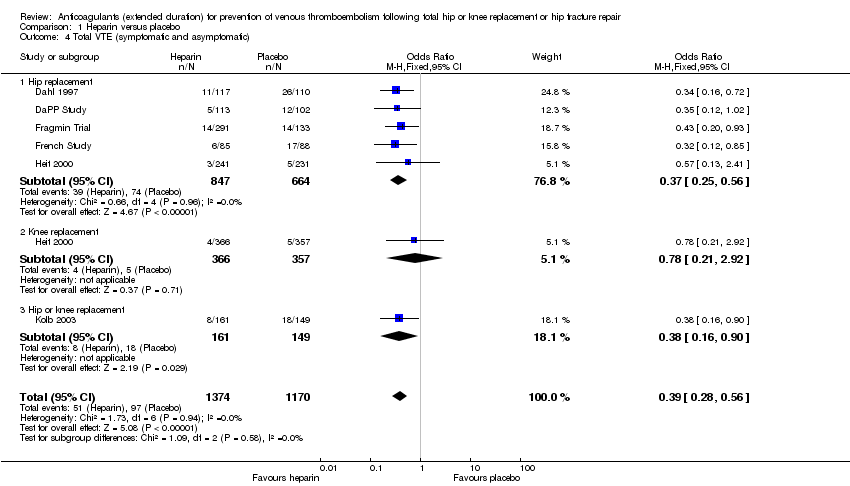
Comparison 1 Heparin versus placebo, Outcome 4 Total VTE (symptomatic and asymptomatic).

Comparison 1 Heparin versus placebo, Outcome 5 Asymptomatic DVT.
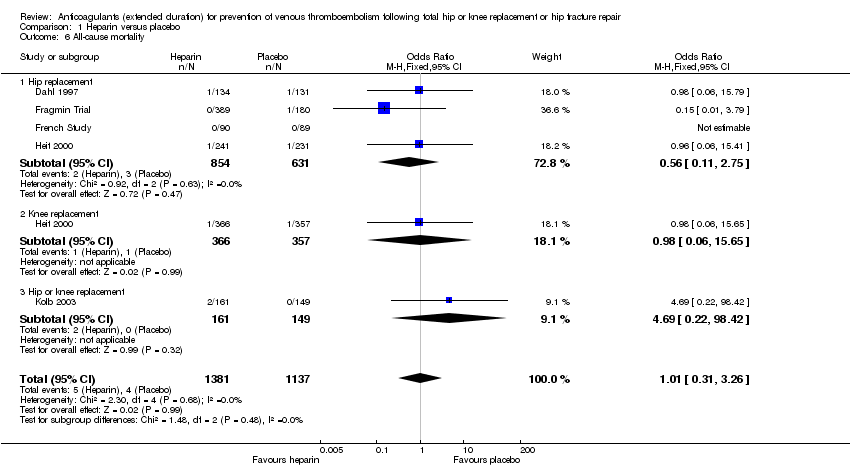
Comparison 1 Heparin versus placebo, Outcome 6 All‐cause mortality.

Comparison 1 Heparin versus placebo, Outcome 7 Adverse events.

Comparison 1 Heparin versus placebo, Outcome 8 Bleeding ‐ major.
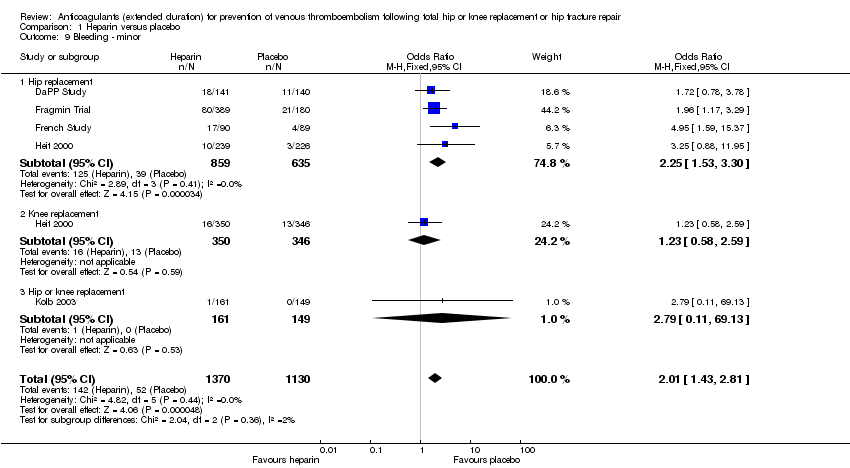
Comparison 1 Heparin versus placebo, Outcome 9 Bleeding ‐ minor.

Comparison 1 Heparin versus placebo, Outcome 10 Reoperation.

Comparison 2 Vitamin K antagonists versus placebo, Outcome 1 Symptomatic VTE (DVT and PE).
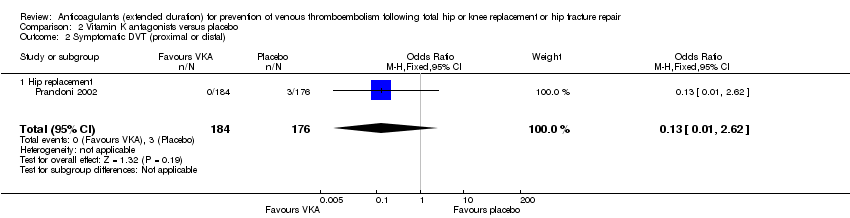
Comparison 2 Vitamin K antagonists versus placebo, Outcome 2 Symptomatic DVT (proximal or distal).
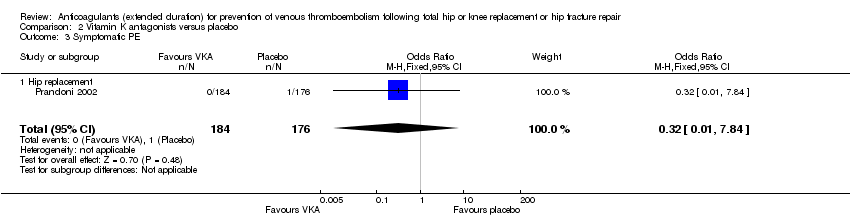
Comparison 2 Vitamin K antagonists versus placebo, Outcome 3 Symptomatic PE.

Comparison 2 Vitamin K antagonists versus placebo, Outcome 4 Total VTE (symptomatic and asymptomatic).

Comparison 2 Vitamin K antagonists versus placebo, Outcome 5 All‐cause mortality.
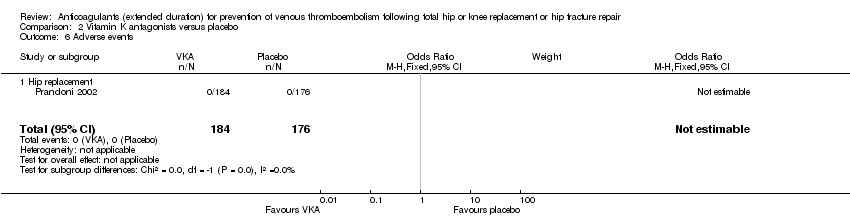
Comparison 2 Vitamin K antagonists versus placebo, Outcome 6 Adverse events.

Comparison 2 Vitamin K antagonists versus placebo, Outcome 7 Bleeding ‐ major.

Comparison 3 DOAC versus placebo, Outcome 1 Symptomatic VTE (DVT and PE).
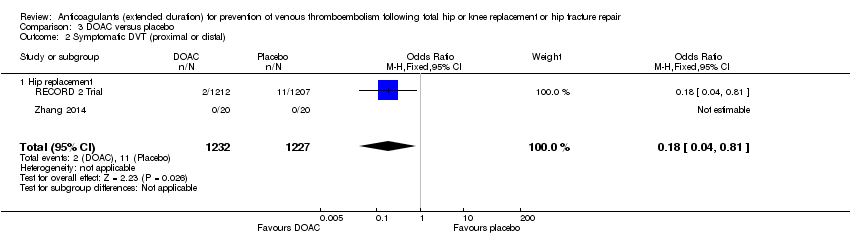
Comparison 3 DOAC versus placebo, Outcome 2 Symptomatic DVT (proximal or distal).
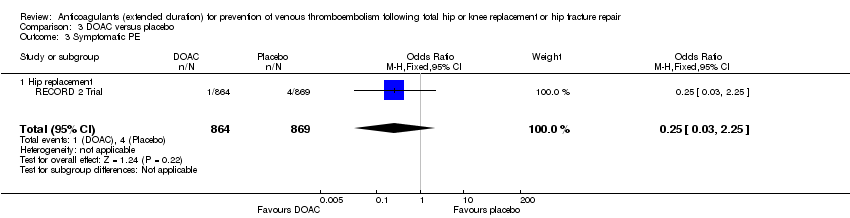
Comparison 3 DOAC versus placebo, Outcome 3 Symptomatic PE.

Comparison 3 DOAC versus placebo, Outcome 4 Total VTE (symptomatic and asymptomatic).

Comparison 3 DOAC versus placebo, Outcome 5 All‐cause mortality.
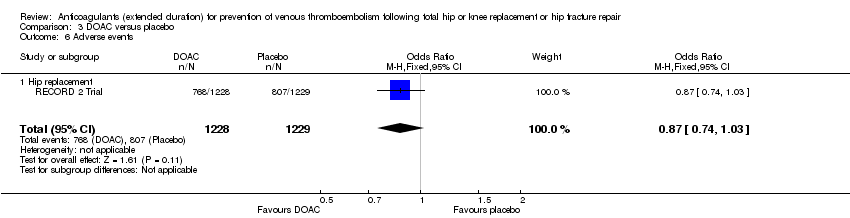
Comparison 3 DOAC versus placebo, Outcome 6 Adverse events.
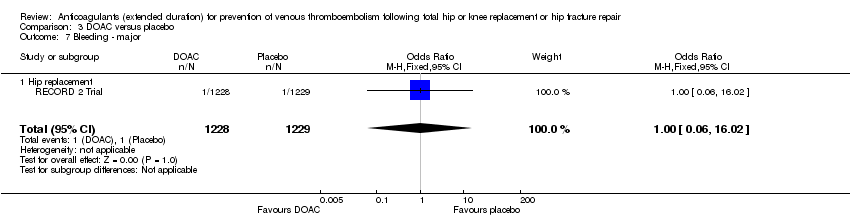
Comparison 3 DOAC versus placebo, Outcome 7 Bleeding ‐ major.

Comparison 3 DOAC versus placebo, Outcome 8 Bleeding‐ clinically relevant non‐major.

Comparison 3 DOAC versus placebo, Outcome 9 Bleeding ‐ minor.
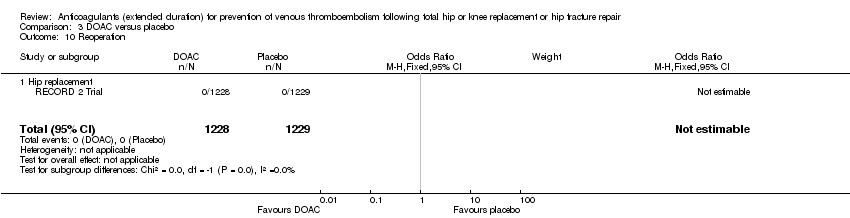
Comparison 3 DOAC versus placebo, Outcome 10 Reoperation.
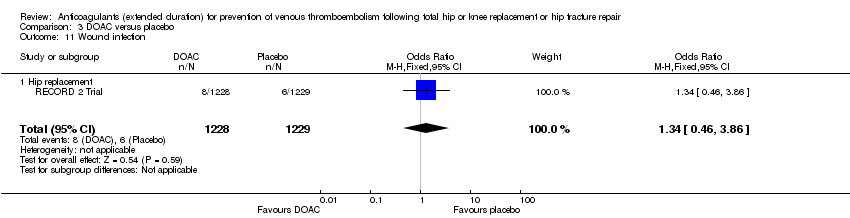
Comparison 3 DOAC versus placebo, Outcome 11 Wound infection.

Comparison 4 Anticoagulant (chosen at investigators' discretion) versus placebo, Outcome 1 Symptomatic VTE (DVT and PE).

Comparison 4 Anticoagulant (chosen at investigators' discretion) versus placebo, Outcome 2 Symptomatic DVT (proximal or distal).

Comparison 4 Anticoagulant (chosen at investigators' discretion) versus placebo, Outcome 3 Symptomatic PE.

Comparison 4 Anticoagulant (chosen at investigators' discretion) versus placebo, Outcome 4 Total VTE (symptomatic and asymptomatic).

Comparison 4 Anticoagulant (chosen at investigators' discretion) versus placebo, Outcome 5 Asymptomatic DVT.
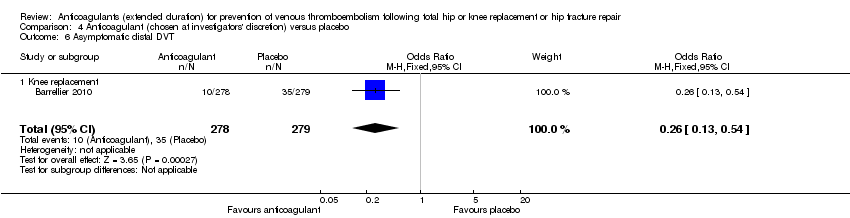
Comparison 4 Anticoagulant (chosen at investigators' discretion) versus placebo, Outcome 6 Asymptomatic distal DVT.

Comparison 4 Anticoagulant (chosen at investigators' discretion) versus placebo, Outcome 7 All‐cause mortality.
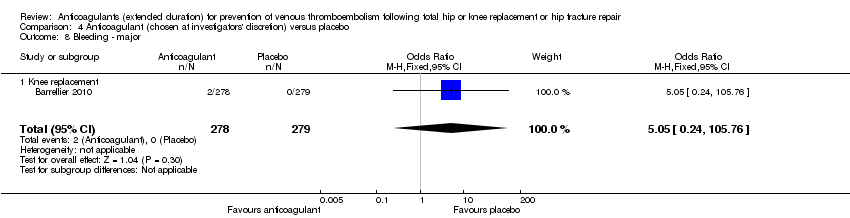
Comparison 4 Anticoagulant (chosen at investigators' discretion) versus placebo, Outcome 8 Bleeding ‐ major.

Comparison 5 Vitamin K antagonists versus heparin, Outcome 1 Symptomatic VTE (DVT and PE).

Comparison 5 Vitamin K antagonists versus heparin, Outcome 2 Symptomatic DVT (proximal or distal).

Comparison 5 Vitamin K antagonists versus heparin, Outcome 3 Symptomatic PE.
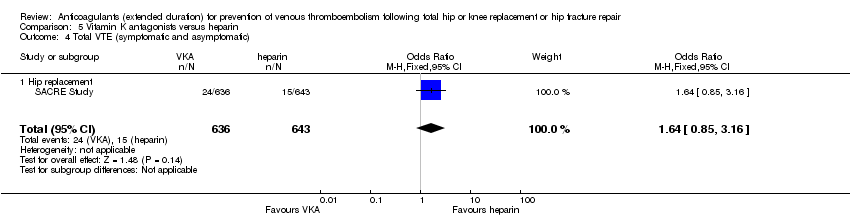
Comparison 5 Vitamin K antagonists versus heparin, Outcome 4 Total VTE (symptomatic and asymptomatic).

Comparison 5 Vitamin K antagonists versus heparin, Outcome 5 All‐cause mortality.

Comparison 5 Vitamin K antagonists versus heparin, Outcome 6 Bleeding ‐ major.
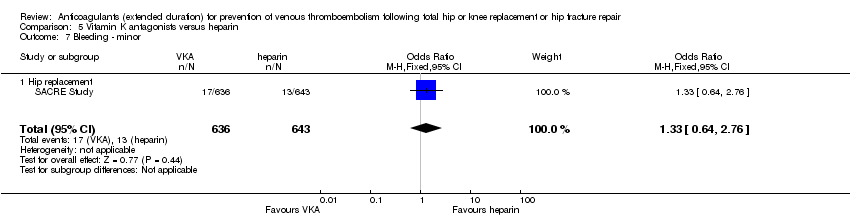
Comparison 5 Vitamin K antagonists versus heparin, Outcome 7 Bleeding ‐ minor.

Comparison 5 Vitamin K antagonists versus heparin, Outcome 8 Reoperation.
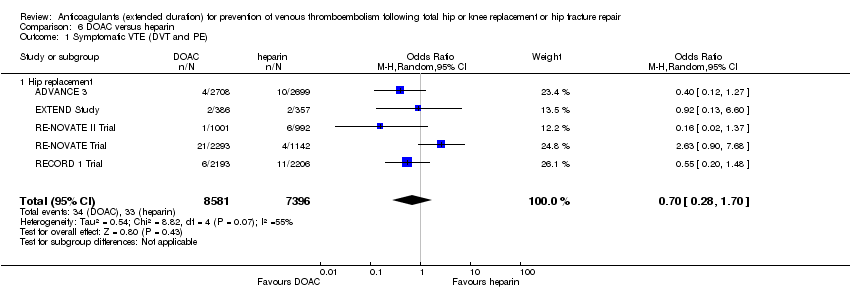
Comparison 6 DOAC versus heparin, Outcome 1 Symptomatic VTE (DVT and PE).

Comparison 6 DOAC versus heparin, Outcome 2 Symptomatic DVT (proximal or distal).

Comparison 6 DOAC versus heparin, Outcome 3 Symptomatic PE.

Comparison 6 DOAC versus heparin, Outcome 4 Total VTE (symptomatic and asymptomatic).

Comparison 6 DOAC versus heparin, Outcome 5 Asymptomatic DVT.

Comparison 6 DOAC versus heparin, Outcome 6 Asymptomatic proximal DVT.
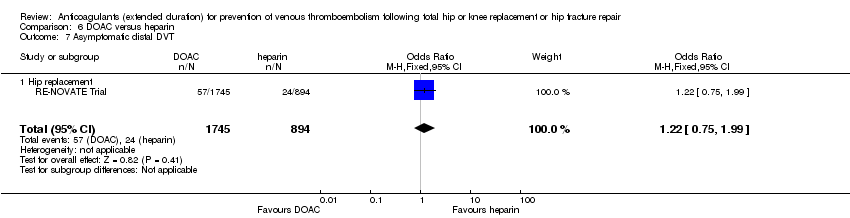
Comparison 6 DOAC versus heparin, Outcome 7 Asymptomatic distal DVT.

Comparison 6 DOAC versus heparin, Outcome 8 All‐cause mortality.

Comparison 6 DOAC versus heparin, Outcome 9 Adverse events.

Comparison 6 DOAC versus heparin, Outcome 10 Bleeding ‐ major.

Comparison 6 DOAC versus heparin, Outcome 11 Bleeding ‐ clinically relevant, non‐major.

Comparison 6 DOAC versus heparin, Outcome 12 Bleeding ‐ minor.

Comparison 6 DOAC versus heparin, Outcome 13 Reoperation.

Comparison 6 DOAC versus heparin, Outcome 14 Wound infection.
| Heparin compared to placebo for prevention of venous thromboembolism following total hip or knee replacement or hip fracture repair | ||||||
| Patient or population: people requiring prevention of venous thromboembolism following total hip or knee replacement or hip fracture repair | ||||||
| Outcomes | Anticipated absolute effects* (95% CI) | Relative effect | Number of participants | Quality of the evidence | Comments | |
| Risk with placebo | Risk with heparin | |||||
| Symptomatic VTE (DVT and PE) | Study population | OR 0.59 | 2329 | ⊕⊕⊕⊕ | — | |
| 33 per 1000 | 20 per 1000 | |||||
| Symptomatic DVT (proximal or distal) | Study population | OR 0.73 | 2019 | ⊕⊕⊕⊝ | — | |
| 24 per 1000 | 18 per 1000 | |||||
| Symptomatic PE | Study population | OR 0.61 | 1595 | ⊕⊕⊝⊝ | — | |
| 6 per 1000 | 4 per 1000 | |||||
| Bleeding ‐ major | Study population | OR 0.59 | 2500 | ⊕⊕⊕⊝ | — | |
| 4 per 1000 | 2 per 1000 | |||||
| Clinically relevant non‐major bleeding | see comment | — | — | — | not reported | |
| Bleeding ‐ minor | Study population | OR 2.01 | 2500 | ⊕⊕⊕⊕ | — | |
| 46 per 1000 | 88 per 1000 | |||||
| *The risk in the intervention group (and its 95% confidence interval) is based on the assumed risk in the comparison group and the relative effect of the intervention (and its 95% CI). | ||||||
| GRADE Working Group grades of evidence | ||||||
| 1 Downgraded by one level, low number of events leading to imprecision of results | ||||||
| Vitamin K antagonists compared to placebo for prevention of venous thromboembolism following total hip or knee replacement or hip fracture repair | ||||||
| Patient or population: people requiring prevention of venous thromboembolism following total hip or knee replacement or hip fracture repair | ||||||
| Outcomes | Anticipated absolute effects* (95% CI) | Relative effect | Number of participants | Quality of the evidence | Comments | |
| Risk with placebo | Risk with vitamin K antagonists | |||||
| Symptomatic VTE (DVT and PE) | Study population | OR 0.10 | 360 | ⊕⊕⊕⊝ | — | |
| 23 per 1000 | 2 per 1000 | |||||
| Symptomatic DVT (proximal or distal) | Study population | OR 0.13 | 360 | ⊕⊕⊕⊝ | — | |
| 17 per 1000 | 2 per 1000 | |||||
| Symptomatic PE | Study population | OR 0.32 | 360 | ⊕⊕⊕⊝ | — | |
| 6 per 1000 | 2 per 1000 | |||||
| Bleeding ‐ major | see comment | OR 2.89 | 360 | ⊕⊕⊝⊝ | no events recorded in placebo group | |
| Clinically relevant non‐major bleeding | see comment | — | — | — | not reported | |
| Minor bleeding | see comment | — | — | — | not reported | |
| *The risk in the intervention group (and its 95% confidence interval) is based on the assumed risk in the comparison group and the relative effect of the intervention (and its 95% CI). | ||||||
| GRADE Working Group grades of evidence | ||||||
| 1 Downgraded by one level, results from a single study only so heterogeneity could not be assessed | ||||||
| DOAC compared to placebo for prevention of venous thromboembolism following total hip or knee replacement or hip fracture repair | ||||||
| Patient or population: people requiring prevention of venous thromboembolism following total hip or knee replacement or hip fracture repair | ||||||
| Outcomes | Anticipated absolute effects* (95% CI) | Relative effect | Number of participants | Quality of the evidence | Comments | |
| Risk with placebo | Risk with DOAC | |||||
| Symptomatic VTE (DVT and PE) | Study population | OR 0.20 | 2419 | ⊕⊕⊕⊝ | — | |
| 12 per 1000 | 3 per 1000 | |||||
| Symptomatic DVT (proximal or distal) | Study population | OR 0.18 | 2459 | ⊕⊕⊕⊕ | — | |
| 9 per 1000 | 2 per 1000 | |||||
| Symptomatic PE | Study population | OR 0.25 | 1733 | ⊕⊕⊝⊝ | — | |
| 5 per 1000 | 1 per 1000 | |||||
| Bleeding ‐ major | Study population | OR 1.00 | 2457 | ⊕⊕⊝⊝ | — | |
| 1 per 1000 | 1 per 1000 | |||||
| Bleeding‐ clinically relevant non‐major | Study population | OR 1.22 | 2457 | ⊕⊕⊕⊝ | — | |
| 27 per 1000 | 33 per 1000 | |||||
| Bleeding ‐ minor | Study population | OR 1.18 | 2457 | ⊕⊕⊕⊝ | — | |
| 28 per 1000 | 32 per 1000 | |||||
| *The risk in the intervention group (and its 95% confidence interval) is based on the assumed risk in the comparison group and the relative effect of the intervention (and its 95% CI). | ||||||
| GRADE Working Group grades of evidence | ||||||
| 1 Downgraded by one level, results from a single study so heterogeneity cannot be assessed | ||||||
| Anticoagulants (chosen at investigators' discretion) compared to placebo for prevention of venous thromboembolism following total hip or knee replacement or hip fracture repair | ||||||
| Patient or population: people requiring prevention of venous thromboembolism following total hip or knee replacement or hip fracture repair | ||||||
| Outcomes | Anticipated absolute effects* (95% CI) | Relative effect | Number of participants | Quality of the evidence | Comments | |
| Risk with placebo | Risk with anticoagulant (chosen at investigators' discretion) | |||||
| Symptomatic VTE (DVT and PE) | Study population | OR 0.50 | 557 | ⊕⊕⊝⊝ | — | |
| 14 per 1000 | 7 per 1000 | |||||
| Symptomatic DVT (proximal or distal) | Study population | OR 0.33 | 557 | ⊕⊕⊝⊝ | — | |
| 11 per 1000 | 4 per 1000 | |||||
| Symptomatic PE | Study population | OR 1.00 | 557 | ⊕⊕⊝⊝ | — | |
| 4 per 1000 | 4 per 1000 | |||||
| Bleeding ‐ major | see comment | OR 5.05 | 557 | ⊕⊕⊝⊝ | no major bleeding recorded in the placebo groups | |
| Clinically relevant non‐major bleeding | see comment | — | — | — | not reported | |
| Minor bleeding | see comment | — | — | — | not reported | |
| *The risk in the intervention group (and its 95% confidence interval) is based on the assumed risk in the comparison group and the relative effect of the intervention (and its 95% CI). | ||||||
| GRADE Working Group grades of evidence | ||||||
| 1 Downgraded by one level, results from a single study so heterogeneity could not be assessed | ||||||
| Vitamin K antagonists compared to heparin for prevention of venous thromboembolism following total hip or knee replacement or hip fracture repair | ||||||
| Patient or population: people requiring prevention of venous thromboembolism following total hip or knee replacement or hip fracture repair | ||||||
| Outcomes | Anticipated absolute effects* (95% CI) | Relative effect | Number of participants | Quality of the evidence | Comments | |
| Risk with heparin | Risk with vitamin K antagonists | |||||
| Symptomatic VTE (DVT and PE) | Study population | OR 1.64 | 1279 | ⊕⊕⊝⊝ | — | |
| 23 per 1000 | 38 per 1000 | |||||
| Symptomatic DVT (proximal or distal) | Study population | OR 1.36 | 1279 | ⊕⊕⊝⊝ | — | |
| 23 per 1000 | 31 per 1000 | |||||
| Symptomatic PE | see comment | OR 9.16 | 1279 | ⊕⊕⊝⊝ | no cases of symptomatic PE reported in the heparin study arm | |
| Bleeding ‐ major | Study population | OR 3.87 | 1272 | ⊕⊕⊝⊝ | — | |
| 16 per 1000 | 58 per 1000 | |||||
| Bleeding ‐ clinically indicated non‐major Treatment duration 28 ‐ 42 days | see comment | — | — | — | clinically indicated non‐major bleeding events not reported in single included study in this comparison | |
| Bleeding ‐ minor | Study population | OR 1.33 | 1279 | ⊕⊕⊝⊝ | — | |
| 20 per 1000 | 27 per 1000 | |||||
| *The risk in the intervention group (and its 95% confidence interval) is based on the assumed risk in the comparison group and the relative effect of the intervention (and its 95% CI). | ||||||
| GRADE Working Group grades of evidence | ||||||
| 1 Downgraded by one level, single study so heterogeneity could not be assessed | ||||||
| DOAC compared to heparin for people requiring prevention of venous thromboembolism following total hip or knee replacement or hip fracture repair | ||||||
| Patient or population: people requiring prevention of venous thromboembolism following total hip or knee replacement or hip fracture repair | ||||||
| Outcomes | Anticipated absolute effects* (95% CI) | Relative effect | Number of participants | Quality of the evidence | Comments | |
| Risk with heparin | Risk with DOAC | |||||
| Symptomatic VTE (DVT and PE) | Study population | OR 0.70 | 15977 | ⊕⊕⊝⊝ | — | |
| 4 per 1000 | 3 per 1000 | |||||
| Symptomatic DVT (proximal or distal) Treatment duration 28 ‐ 42 days | Study population | OR 0.60 | 15977 | ⊕⊕⊝⊝ | — | |
| 3 per 1000 | 2 per 1000 | |||||
| Symptomatic PE | Study population | OR 0.91 | 14731 | ⊕⊕⊕⊝ | — | |
| 2 per 1000 | 2 per 1000 | |||||
| Bleeding ‐ major Treatment duration 28 ‐ 42 days | Study population | OR 1.11 | 16199 | ⊕⊕⊕⊕ | — | |
| 8 per 1000 | 9 per 1000 | |||||
| Bleeding ‐ clinically relevant, non‐major | Study population | OR 1.08 | 15241 | ⊕⊕⊕⊕ | — | |
| 33 per 1000 | 36 per 1000 | |||||
| Bleeding ‐ minor Treatment duration 28 ‐ 42 days | Study population | OR 0.95 | 11766 | ⊕⊕⊕⊕ | — | |
| 66 per 1000 | 63 per 1000 | |||||
| *The risk in the intervention group (and its 95% confidence interval) is based on the assumed risk in the comparison group and the relative effect of the intervention (and its 95% CI). | ||||||
| GRADE Working Group grades of evidence | ||||||
| 1 Downgraded by one level for inconsistency (heterogeneity, I2 = 55%) | ||||||
| Outcome or subgroup title | No. of studies | No. of participants | Statistical method | Effect size |
| 1 Symptomatic VTE (DVT and PE) Show forest plot | 5 | 2329 | Odds Ratio (M‐H, Fixed, 95% CI) | 0.59 [0.35, 1.01] |
| 1.1 Hip replacement | 4 | 1296 | Odds Ratio (M‐H, Fixed, 95% CI) | 0.69 [0.36, 1.30] |
| 1.2 Knee replacement | 1 | 723 | Odds Ratio (M‐H, Fixed, 95% CI) | 0.78 [0.21, 2.92] |
| 1.3 Hip or knee replacement | 1 | 310 | Odds Ratio (M‐H, Fixed, 95% CI) | 0.22 [0.05, 1.06] |
| 2 Symptomatic DVT (proximal or distal) Show forest plot | 4 | 2019 | Odds Ratio (M‐H, Fixed, 95% CI) | 0.73 [0.39, 1.38] |
| 2.1 Hip replacement | 4 | 1296 | Odds Ratio (M‐H, Fixed, 95% CI) | 0.80 [0.41, 1.55] |
| 2.2 Knee replacement | 1 | 723 | Odds Ratio (M‐H, Fixed, 95% CI) | 0.32 [0.03, 3.12] |
| 3 Symptomatic PE Show forest plot | 3 | 1595 | Odds Ratio (M‐H, Fixed, 95% CI) | 0.61 [0.16, 2.33] |
| 3.1 Hip replacement | 3 | 872 | Odds Ratio (M‐H, Fixed, 95% CI) | 0.13 [0.01, 2.56] |
| 3.2 Knee replacement | 1 | 723 | Odds Ratio (M‐H, Fixed, 95% CI) | 1.47 [0.24, 8.83] |
| 4 Total VTE (symptomatic and asymptomatic) Show forest plot | 6 | 2544 | Odds Ratio (M‐H, Fixed, 95% CI) | 0.39 [0.28, 0.56] |
| 4.1 Hip replacement | 5 | 1511 | Odds Ratio (M‐H, Fixed, 95% CI) | 0.37 [0.25, 0.56] |
| 4.2 Knee replacement | 1 | 723 | Odds Ratio (M‐H, Fixed, 95% CI) | 0.78 [0.21, 2.92] |
| 4.3 Hip or knee replacement | 1 | 310 | Odds Ratio (M‐H, Fixed, 95% CI) | 0.38 [0.16, 0.90] |
| 5 Asymptomatic DVT Show forest plot | 5 | 1304 | Odds Ratio (M‐H, Fixed, 95% CI) | 0.38 [0.24, 0.60] |
| 5.1 Hip replacement | 4 | 994 | Odds Ratio (M‐H, Fixed, 95% CI) | 0.35 [0.21, 0.58] |
| 5.2 Hip or knee replacement | 1 | 310 | Odds Ratio (M‐H, Fixed, 95% CI) | 0.54 [0.19, 1.52] |
| 6 All‐cause mortality Show forest plot | 5 | 2518 | Odds Ratio (M‐H, Fixed, 95% CI) | 1.01 [0.31, 3.26] |
| 6.1 Hip replacement | 4 | 1485 | Odds Ratio (M‐H, Fixed, 95% CI) | 0.56 [0.11, 2.75] |
| 6.2 Knee replacement | 1 | 723 | Odds Ratio (M‐H, Fixed, 95% CI) | 0.98 [0.06, 15.65] |
| 6.3 Hip or knee replacement | 1 | 310 | Odds Ratio (M‐H, Fixed, 95% CI) | 4.69 [0.22, 98.42] |
| 7 Adverse events Show forest plot | 2 | 460 | Odds Ratio (M‐H, Fixed, 95% CI) | 1.06 [0.68, 1.64] |
| 7.1 Hip replacement | 2 | 460 | Odds Ratio (M‐H, Fixed, 95% CI) | 1.06 [0.68, 1.64] |
| 8 Bleeding ‐ major Show forest plot | 5 | 2500 | Odds Ratio (M‐H, Fixed, 95% CI) | 0.59 [0.14, 2.46] |
| 8.1 Hip replacement | 4 | 1494 | Odds Ratio (M‐H, Fixed, 95% CI) | 0.32 [0.03, 3.10] |
| 8.2 Knee replacement | 1 | 696 | Odds Ratio (M‐H, Fixed, 95% CI) | 0.99 [0.14, 7.06] |
| 8.3 Hip or knee replacement | 1 | 310 | Odds Ratio (M‐H, Fixed, 95% CI) | 0.0 [0.0, 0.0] |
| 9 Bleeding ‐ minor Show forest plot | 5 | 2500 | Odds Ratio (M‐H, Fixed, 95% CI) | 2.01 [1.43, 2.81] |
| 9.1 Hip replacement | 4 | 1494 | Odds Ratio (M‐H, Fixed, 95% CI) | 2.25 [1.53, 3.30] |
| 9.2 Knee replacement | 1 | 696 | Odds Ratio (M‐H, Fixed, 95% CI) | 1.23 [0.58, 2.59] |
| 9.3 Hip or knee replacement | 1 | 310 | Odds Ratio (M‐H, Fixed, 95% CI) | 2.79 [0.11, 69.13] |
| 10 Reoperation Show forest plot | 1 | 179 | Odds Ratio (M‐H, Fixed, 95% CI) | 0.0 [0.0, 0.0] |
| 10.1 Hip replacement | 1 | 179 | Odds Ratio (M‐H, Fixed, 95% CI) | 0.0 [0.0, 0.0] |
| Outcome or subgroup title | No. of studies | No. of participants | Statistical method | Effect size |
| 1 Symptomatic VTE (DVT and PE) Show forest plot | 1 | 360 | Odds Ratio (M‐H, Fixed, 95% CI) | 0.10 [0.01, 1.94] |
| 1.1 Hip replacement | 1 | 360 | Odds Ratio (M‐H, Fixed, 95% CI) | 0.10 [0.01, 1.94] |
| 2 Symptomatic DVT (proximal or distal) Show forest plot | 1 | 360 | Odds Ratio (M‐H, Fixed, 95% CI) | 0.13 [0.01, 2.62] |
| 2.1 Hip replacement | 1 | 360 | Odds Ratio (M‐H, Fixed, 95% CI) | 0.13 [0.01, 2.62] |
| 3 Symptomatic PE Show forest plot | 1 | 360 | Odds Ratio (M‐H, Fixed, 95% CI) | 0.32 [0.01, 7.84] |
| 3.1 Hip replacement | 1 | 360 | Odds Ratio (M‐H, Fixed, 95% CI) | 0.32 [0.01, 7.84] |
| 4 Total VTE (symptomatic and asymptomatic) Show forest plot | 1 | 360 | Odds Ratio (M‐H, Fixed, 95% CI) | 0.10 [0.01, 0.81] |
| 4.1 Hip replacement | 1 | 360 | Odds Ratio (M‐H, Fixed, 95% CI) | 0.10 [0.01, 0.81] |
| 5 All‐cause mortality Show forest plot | 1 | 360 | Odds Ratio (M‐H, Fixed, 95% CI) | 0.0 [0.0, 0.0] |
| 5.1 Hip replacement | 1 | 360 | Odds Ratio (M‐H, Fixed, 95% CI) | 0.0 [0.0, 0.0] |
| 6 Adverse events Show forest plot | 1 | 360 | Odds Ratio (M‐H, Fixed, 95% CI) | 0.0 [0.0, 0.0] |
| 6.1 Hip replacement | 1 | 360 | Odds Ratio (M‐H, Fixed, 95% CI) | 0.0 [0.0, 0.0] |
| 7 Bleeding ‐ major Show forest plot | 1 | 360 | Odds Ratio (M‐H, Fixed, 95% CI) | 2.89 [0.12, 71.31] |
| 7.1 Hip replacement | 1 | 360 | Odds Ratio (M‐H, Fixed, 95% CI) | 2.89 [0.12, 71.31] |
| Outcome or subgroup title | No. of studies | No. of participants | Statistical method | Effect size |
| 1 Symptomatic VTE (DVT and PE) Show forest plot | 1 | 2419 | Odds Ratio (M‐H, Fixed, 95% CI) | 0.20 [0.06, 0.68] |
| 1.1 Hip replacement | 1 | 2419 | Odds Ratio (M‐H, Fixed, 95% CI) | 0.20 [0.06, 0.68] |
| 2 Symptomatic DVT (proximal or distal) Show forest plot | 2 | 2459 | Odds Ratio (M‐H, Fixed, 95% CI) | 0.18 [0.04, 0.81] |
| 2.1 Hip replacement | 2 | 2459 | Odds Ratio (M‐H, Fixed, 95% CI) | 0.18 [0.04, 0.81] |
| 3 Symptomatic PE Show forest plot | 1 | 1733 | Odds Ratio (M‐H, Fixed, 95% CI) | 0.25 [0.03, 2.25] |
| 3.1 Hip replacement | 1 | 1733 | Odds Ratio (M‐H, Fixed, 95% CI) | 0.25 [0.03, 2.25] |
| 4 Total VTE (symptomatic and asymptomatic) Show forest plot | 1 | 1733 | Odds Ratio (M‐H, Fixed, 95% CI) | 0.19 [0.11, 0.33] |
| 4.1 Hip replacement | 1 | 1733 | Odds Ratio (M‐H, Fixed, 95% CI) | 0.19 [0.11, 0.33] |
| 5 All‐cause mortality Show forest plot | 1 | 1733 | Odds Ratio (M‐H, Fixed, 95% CI) | 0.33 [0.07, 1.66] |
| 5.1 Hip replacement | 1 | 1733 | Odds Ratio (M‐H, Fixed, 95% CI) | 0.33 [0.07, 1.66] |
| 6 Adverse events Show forest plot | 1 | 2457 | Odds Ratio (M‐H, Fixed, 95% CI) | 0.87 [0.74, 1.03] |
| 6.1 Hip replacement | 1 | 2457 | Odds Ratio (M‐H, Fixed, 95% CI) | 0.87 [0.74, 1.03] |
| 7 Bleeding ‐ major Show forest plot | 1 | 2457 | Odds Ratio (M‐H, Fixed, 95% CI) | 1.00 [0.06, 16.02] |
| 7.1 Hip replacement | 1 | 2457 | Odds Ratio (M‐H, Fixed, 95% CI) | 1.00 [0.06, 16.02] |
| 8 Bleeding‐ clinically relevant non‐major Show forest plot | 1 | 2457 | Odds Ratio (M‐H, Fixed, 95% CI) | 1.22 [0.76, 1.95] |
| 8.1 Hip replacement | 1 | 2457 | Odds Ratio (M‐H, Fixed, 95% CI) | 1.22 [0.76, 1.95] |
| 9 Bleeding ‐ minor Show forest plot | 1 | 2457 | Odds Ratio (M‐H, Fixed, 95% CI) | 1.18 [0.74, 1.88] |
| 9.1 Hip replacement | 1 | 2457 | Odds Ratio (M‐H, Fixed, 95% CI) | 1.18 [0.74, 1.88] |
| 10 Reoperation Show forest plot | 1 | 2457 | Odds Ratio (M‐H, Fixed, 95% CI) | 0.0 [0.0, 0.0] |
| 10.1 Hip replacement | 1 | 2457 | Odds Ratio (M‐H, Fixed, 95% CI) | 0.0 [0.0, 0.0] |
| 11 Wound infection Show forest plot | 1 | 2457 | Odds Ratio (M‐H, Fixed, 95% CI) | 1.34 [0.46, 3.86] |
| 11.1 Hip replacement | 1 | 2457 | Odds Ratio (M‐H, Fixed, 95% CI) | 1.34 [0.46, 3.86] |
| Outcome or subgroup title | No. of studies | No. of participants | Statistical method | Effect size |
| 1 Symptomatic VTE (DVT and PE) Show forest plot | 1 | 557 | Odds Ratio (M‐H, Fixed, 95% CI) | 0.50 [0.09, 2.74] |
| 1.1 Knee replacement | 1 | 557 | Odds Ratio (M‐H, Fixed, 95% CI) | 0.50 [0.09, 2.74] |
| 2 Symptomatic DVT (proximal or distal) Show forest plot | 1 | 557 | Odds Ratio (M‐H, Fixed, 95% CI) | 0.33 [0.03, 3.21] |
| 2.1 Knee replacement | 1 | 557 | Odds Ratio (M‐H, Fixed, 95% CI) | 0.33 [0.03, 3.21] |
| 3 Symptomatic PE Show forest plot | 1 | 557 | Odds Ratio (M‐H, Fixed, 95% CI) | 1.00 [0.06, 16.13] |
| 3.1 Knee replacement | 1 | 557 | Odds Ratio (M‐H, Fixed, 95% CI) | 1.00 [0.06, 16.13] |
| 4 Total VTE (symptomatic and asymptomatic) Show forest plot | 1 | 557 | Odds Ratio (M‐H, Fixed, 95% CI) | 0.26 [0.14, 0.50] |
| 4.1 Knee replacement | 1 | 557 | Odds Ratio (M‐H, Fixed, 95% CI) | 0.26 [0.14, 0.50] |
| 5 Asymptomatic DVT Show forest plot | 1 | 557 | Odds Ratio (M‐H, Fixed, 95% CI) | 0.26 [0.13, 0.54] |
| 5.1 Knee replacement | 1 | 557 | Odds Ratio (M‐H, Fixed, 95% CI) | 0.26 [0.13, 0.54] |
| 6 Asymptomatic distal DVT Show forest plot | 1 | 557 | Odds Ratio (M‐H, Fixed, 95% CI) | 0.26 [0.13, 0.54] |
| 6.1 Knee replacement | 1 | 557 | Odds Ratio (M‐H, Fixed, 95% CI) | 0.26 [0.13, 0.54] |
| 7 All‐cause mortality Show forest plot | 1 | 842 | Odds Ratio (M‐H, Fixed, 95% CI) | 0.0 [0.0, 0.0] |
| 7.1 Knee replacement | 1 | 842 | Odds Ratio (M‐H, Fixed, 95% CI) | 0.0 [0.0, 0.0] |
| 8 Bleeding ‐ major Show forest plot | 1 | 557 | Odds Ratio (M‐H, Fixed, 95% CI) | 5.05 [0.24, 105.76] |
| 8.1 Knee replacement | 1 | 557 | Odds Ratio (M‐H, Fixed, 95% CI) | 5.05 [0.24, 105.76] |
| Outcome or subgroup title | No. of studies | No. of participants | Statistical method | Effect size |
| 1 Symptomatic VTE (DVT and PE) Show forest plot | 1 | 1279 | Odds Ratio (M‐H, Fixed, 95% CI) | 1.64 [0.85, 3.16] |
| 1.1 Hip replacement | 1 | 1279 | Odds Ratio (M‐H, Fixed, 95% CI) | 1.64 [0.85, 3.16] |
| 2 Symptomatic DVT (proximal or distal) Show forest plot | 1 | 1279 | Odds Ratio (M‐H, Fixed, 95% CI) | 1.36 [0.69, 2.68] |
| 2.1 Hip replacement | 1 | 1279 | Odds Ratio (M‐H, Fixed, 95% CI) | 1.36 [0.69, 2.68] |
| 3 Symptomatic PE Show forest plot | 1 | 1279 | Odds Ratio (M‐H, Fixed, 95% CI) | 9.16 [0.49, 170.42] |
| 3.1 Hip replacement | 1 | 1279 | Odds Ratio (M‐H, Fixed, 95% CI) | 9.16 [0.49, 170.42] |
| 4 Total VTE (symptomatic and asymptomatic) Show forest plot | 1 | 1279 | Odds Ratio (M‐H, Fixed, 95% CI) | 1.64 [0.85, 3.16] |
| 4.1 Hip replacement | 1 | 1279 | Odds Ratio (M‐H, Fixed, 95% CI) | 1.64 [0.85, 3.16] |
| 5 All‐cause mortality Show forest plot | 1 | 1279 | Odds Ratio (M‐H, Fixed, 95% CI) | 5.07 [0.24, 105.83] |
| 5.1 Hip replacement | 1 | 1279 | Odds Ratio (M‐H, Fixed, 95% CI) | 5.07 [0.24, 105.83] |
| 6 Bleeding ‐ major Show forest plot | 1 | 1272 | Odds Ratio (M‐H, Fixed, 95% CI) | 3.87 [1.91, 7.85] |
| 6.1 Hip replacement | 1 | 1272 | Odds Ratio (M‐H, Fixed, 95% CI) | 3.87 [1.91, 7.85] |
| 7 Bleeding ‐ minor Show forest plot | 1 | 1279 | Odds Ratio (M‐H, Fixed, 95% CI) | 1.33 [0.64, 2.76] |
| 7.1 Hip replacement | 1 | 1279 | Odds Ratio (M‐H, Fixed, 95% CI) | 1.33 [0.64, 2.76] |
| 8 Reoperation Show forest plot | 1 | 1279 | Odds Ratio (M‐H, Fixed, 95% CI) | 4.60 [0.99, 21.38] |
| 8.1 Hip replacement | 1 | 1279 | Odds Ratio (M‐H, Fixed, 95% CI) | 4.60 [0.99, 21.38] |
| Outcome or subgroup title | No. of studies | No. of participants | Statistical method | Effect size |
| 1 Symptomatic VTE (DVT and PE) Show forest plot | 5 | 15977 | Odds Ratio (M‐H, Random, 95% CI) | 0.70 [0.28, 1.70] |
| 1.1 Hip replacement | 5 | 15977 | Odds Ratio (M‐H, Random, 95% CI) | 0.70 [0.28, 1.70] |
| 2 Symptomatic DVT (proximal or distal) Show forest plot | 5 | 15977 | Odds Ratio (M‐H, Random, 95% CI) | 0.60 [0.11, 3.27] |
| 2.1 Hip replacement | 5 | 15977 | Odds Ratio (M‐H, Random, 95% CI) | 0.60 [0.11, 3.27] |
| 3 Symptomatic PE Show forest plot | 5 | 14731 | Odds Ratio (M‐H, Fixed, 95% CI) | 0.91 [0.43, 1.94] |
| 3.1 Hip replacement | 5 | 14731 | Odds Ratio (M‐H, Fixed, 95% CI) | 0.91 [0.43, 1.94] |
| 4 Total VTE (symptomatic and asymptomatic) Show forest plot | 4 | 12447 | Odds Ratio (M‐H, Random, 95% CI) | 0.53 [0.29, 0.97] |
| 4.1 Hip replacement | 4 | 12447 | Odds Ratio (M‐H, Random, 95% CI) | 0.53 [0.29, 0.97] |
| 5 Asymptomatic DVT Show forest plot | 2 | 6559 | Odds Ratio (M‐H, Random, 95% CI) | 0.56 [0.19, 1.59] |
| 5.1 Hip replacement | 2 | 6559 | Odds Ratio (M‐H, Random, 95% CI) | 0.56 [0.19, 1.59] |
| 6 Asymptomatic proximal DVT Show forest plot | 1 | 2704 | Odds Ratio (M‐H, Fixed, 95% CI) | 0.73 [0.46, 1.15] |
| 6.1 Hip replacement | 1 | 2704 | Odds Ratio (M‐H, Fixed, 95% CI) | 0.73 [0.46, 1.15] |
| 7 Asymptomatic distal DVT Show forest plot | 1 | 2639 | Odds Ratio (M‐H, Fixed, 95% CI) | 1.22 [0.75, 1.99] |
| 7.1 Hip replacement | 1 | 2639 | Odds Ratio (M‐H, Fixed, 95% CI) | 1.22 [0.75, 1.99] |
| 8 All‐cause mortality Show forest plot | 5 | 14966 | Odds Ratio (M‐H, Fixed, 95% CI) | 1.63 [0.64, 4.16] |
| 8.1 Hip replacement | 5 | 14966 | Odds Ratio (M‐H, Fixed, 95% CI) | 1.63 [0.64, 4.16] |
| 9 Adverse events Show forest plot | 3 | 9908 | Odds Ratio (M‐H, Fixed, 95% CI) | 0.96 [0.88, 1.05] |
| 9.1 Hip replacement | 3 | 9908 | Odds Ratio (M‐H, Fixed, 95% CI) | 0.96 [0.88, 1.05] |
| 10 Bleeding ‐ major Show forest plot | 5 | 16199 | Odds Ratio (M‐H, Fixed, 95% CI) | 1.11 [0.79, 1.54] |
| 10.1 Hip replacement | 5 | 16199 | Odds Ratio (M‐H, Fixed, 95% CI) | 1.11 [0.79, 1.54] |
| 11 Bleeding ‐ clinically relevant, non‐major Show forest plot | 4 | 15241 | Odds Ratio (M‐H, Fixed, 95% CI) | 1.08 [0.90, 1.28] |
| 11.1 Hip replacement | 4 | 15241 | Odds Ratio (M‐H, Fixed, 95% CI) | 1.08 [0.90, 1.28] |
| 12 Bleeding ‐ minor Show forest plot | 4 | 11766 | Odds Ratio (M‐H, Fixed, 95% CI) | 0.95 [0.82, 1.10] |
| 12.1 Hip replacement | 4 | 11766 | Odds Ratio (M‐H, Fixed, 95% CI) | 0.95 [0.82, 1.10] |
| 13 Reoperation Show forest plot | 4 | 15241 | Odds Ratio (M‐H, Fixed, 95% CI) | 1.06 [0.34, 3.24] |
| 13.1 Hip replacement | 4 | 15241 | Odds Ratio (M‐H, Fixed, 95% CI) | 1.06 [0.34, 3.24] |
| 14 Wound infection Show forest plot | 2 | 6446 | Odds Ratio (M‐H, Fixed, 95% CI) | 0.89 [0.46, 1.72] |
| 14.1 Hip replacement | 2 | 6446 | Odds Ratio (M‐H, Fixed, 95% CI) | 0.89 [0.46, 1.72] |