Risperidon (depo) za shizofreniju
Referencias
References to studies included in this review
References to studies excluded from this review
References to studies awaiting assessment
Additional references
References to other published versions of this review
Characteristics of studies
Characteristics of included studies [ordered by study ID]
| Methods | Allocation: random. Blinding: single blind, rater blind. Duration: 12 weeks. Design: parallel. Setting: inpatient, large psychiatric teaching hospital, Taiwan. | |
| Participants | Diagnosis: schizophrenia (DSM‐IV). Age: 18‐65 years. N = 50. Sex: 25 M and 25 F. History: symptomatically stable defined as PANSS total < 80, CGI‐no change in score between screening and baseline, previous treatment with oral risperidone for > 3 months. Included: 'good health' based on physical examination, medical history and blood biochemistry and haematology. Exclusion: History of NMS or organic CNS disorder; current seizure disorder; current risk of violent behaviour against others; current suicidal ideas or suicidal ideas in the last 6 months. Consent and ethics: study performed in accordance with the Declaration of Helsinki and approved by Ethics Review Committee. All participants provided written informed consent before starting the study. | |
| Interventions | 1. Risperidone depot: 25 mg, 37.5 mg or 50 mg once every 2 weeks, n = 25. 2. Risperidone oral: mean 3.8 +/‐ 1.6 mg/day, n = 25. | |
| Outcomes | Quality of life (SF‐36). Adverse events (recorded spontaneously); AIMS; BARS; SAS; UKU; movement disorder. Mental state: PANSS. Global state: CGI‐S, GAF. Leaving study early. Unable to use ‐ Satisfaction with treatment ‐ non‐peer reviewed scale. Pain at injection site (visual analogue scale) ‐ no SD reported. | |
| Notes | ||
| Risk of bias | ||
| Bias | Authors' judgement | Support for judgement |
| Random sequence generation (selection bias) | Unclear risk | Quote: "this trial was a randomized, parallel‐group, rater‐blind study of 52 weeks duration." No information on how randomisation was achieved. |
| Allocation concealment (selection bias) | Unclear risk | No information. |
| Blinding (performance bias and detection bias) | High risk | Implied to be an open‐label study. Not explicit, but implied open‐label with regard to participants and study drug administrators. Detection: "rater blind", but no information on how the blinding was maintained. |
| Incomplete outcome data (attrition bias) | Low risk | N = 49 participants completed the study (98%). |
| Selective reporting (reporting bias) | Low risk | All outcomes listed in methods appear to be reported. |
| Other bias | High risk | Funding: supported by Jassen‐Cilag Taiwan, Johnson & Johnson co. |
| Methods | Allocation: random. Setting: inpatient, 95 sites, UK, mainland Europe, North America, Africa. | |
| Participants | Diagnosis: schizophrenia (DSM‐IV). Age: mean 40 ± 15 years, range 18‐65. Included: stable CGI scores for the previous 4 weeks of the oral risperidone run‐in period. Consent and ethics: study performed in accordance with the Declaration of Helsinki; consent obtained from participant, relative, guardian or legal representative at study entry. | |
| Interventions | 1. Risperidone depot: 25, 50 or 75 mg, every two weeks + daily placebo tablets, n = 319. | |
| Outcomes | Global state: needing use of benzodiazepines or sedative drugs; CGI (dichotomised). Mental state: PANSS. Unable to use ‐ | |
| Notes | * Blindness was maintained with different doses by using the same volume of diluent. ** Numbers randomised not consistent in presentations (426 vs 640). | |
| Risk of bias | ||
| Bias | Authors' judgement | Support for judgement |
| Random sequence generation (selection bias) | Low risk | Quote: "randomization was stratified according to site, PANSS score, ESRS total score, use of depot antipsychotics in the previous 6 months and daily dose of oral risperidone at randomization" (p112). |
| Allocation concealment (selection bias) | Unclear risk | Not described. |
| Blinding (performance bias and detection bias) | Unclear risk | Placebo tablets and injections used to blind participants. "Double blind" stated but it is not clearly expressed who exactly was blinded, cannot be sure if rater blinded. |
| Incomplete outcome data (attrition bias) | Low risk | N = 541 participants completed the study (85%). Completer‐only data for PANSS. |
| Selective reporting (reporting bias) | Unclear risk | All outcomes reported, however not all presented as usable data, particularly continuous data, with no means or SD. |
| Other bias | High risk | Funding: supported by Janssen Research Foundation, Beerse, Belgium. |
| Methods | Allocation: random. Blinding: open‐label, blinded clinical raters. Duration: 6 months (+ 6 months naturalistic follow‐up). Design: parallel. Setting: National Institute of Mental Health Schizophrenia Trials Network and five sites in Conneticut's public mental health system, USA. | |
| Participants | Diagnosis: schizophrenia (DSM‐IV). Age: ≥18 years, mean age 48 yrs (risperidone depot: 48.5 ± 12.2; haloperidol/fluphenazine depot: 47.3 ± 9.1). N = 62. Sex: 44 M (22 in each group), 18 F. History: currently taking fluphenazine decanoate or haloperidol decanoate, "may benefit from changing medication" and "willing to change", able to afford own medication, at least one 3‐monthly clinic visit in past 6 months. Included: eligible patients were those who might benefit from switching to risperidone microspheres (with sub‐optimal response to treatment because of persistent psychopathology or significant side effects); people where change in medical opinion was a reasonable clinical opinion, but not required; willingness to change antipsychotic medication; access to medication without financial burden; at least 1 clinic visit every 3 months for past 6 months. Excluded: symptom severity indicating immediate change; exacerbation in previous 3/12; pregnancy; pending criminal charges; non‐independent living; antipsychotic polypharmacy. Consent and ethics: written informed consent after thorough description of the study to participants and assessment of understanding consent materials. | |
| Interventions | 1. Risperidone depot: 25, 37.5 or 50 mg/ 2 weeks, n = 32. 2. Haloperidol decanoate OR fluphenazine*, n = 30. *No data on dosages actually prescribed in this arm ‐ "clinician's judgement". | |
| Outcomes | Primary ‐ time to all‐cause treatment discontinuation. Mental state: PANSS (completer‐only). Hospitalisation by 6 months. Adverse events: Arizona Sexual Experiences Scale; weight; prolactin (completer‐only, skew data). Unable to use ‐ AIMS (adapted scale used). Subjective Side‐effect Rating Scale (no data reported). EPS (SAS); tardive dyskinesia (incomplete data for all participants ‐ only 44% accounted for). Tardive dyskinesia (more than 50% participants did not complete assessment). | |
| Notes | ||
| Risk of bias | ||
| Bias | Authors' judgement | Support for judgement |
| Random sequence generation (selection bias) | Low risk | Randomised, quote, "stratified by gender and baseline decanoate. No exceptions were made to the predetermined randomisation streams" (p670). |
| Allocation concealment (selection bias) | Unclear risk | No details given of how this was achieved. Quote, "eligible patients were those who might benefit from a switch to risperidone microspheres" (p670). |
| Blinding (performance bias and detection bias) | High risk | Open‐label study with assessment by blinded clinical raters. |
| Incomplete outcome data (attrition bias) | High risk | Data relating to loss to follow‐up are given and overall attrition is < 50%. Lost to follow‐up n = 8: reasons for discontinuation included increase in psychiatric symptoms (n = 4), EPS concerns (n = 1), participant preference (n = 2), hypertension and weight gain (n = 1). However, not all participants completed continuous outcome measures; LOCF carried forward used in primary study citation, completer‐only data provided with means and SD for additional requested information (unpublished). |
| Selective reporting (reporting bias) | High risk | Not all data reported, including means and SDs for most continuous outcomes. |
| Other bias | Unclear risk | Funding: quote, "research presented in this article was funded by the National Institute of Mental Health grant number MH71663 and MH59312." One author (Schooler) "has previously received grant/research support from... Janssen‐Cilag, and Johnson & Johnson." |
| Methods | Allocation: random. Blinding: double. Duration: 53 weeks. Design: parallel. Setting: international, multi‐centre, 19 countries: North America, Australia, New Zealand, Western and Eastern Europe. | |
| Participants | Diagnosis: schizophrenia (DSM‐IV). Age: ≥ 18 years of age. N = 749. Sex: 444 M, 305 F. History: DSM‐IV diagnosis of schizophrenia for at least one year before screening. Included: PANSS score between 60‐120; acutely symptomatic at screening and baseline; BMI ≥ 15 kg. Excluded: DSM‐IV Axis I diagnosis other than schizophrenia; decrease of ≥ 25% in the PANSS total score between screening and baseline; substance dependence during the three months preceding screening; history of treatment resistance; history of neuroleptic malignant syndrome or any significant or unstable systematic disease; suicidal or violent behaviour; pregnant or nursing or women planning pregnancy. Consent and ethics: Independent Ethics Committee or Institutional Review Board at each study site approved the protocol. Study conducted in accordance with Declaration of Helsinki and consistent with Good Clinical Practice (GCP) and applicable regulatory requirements. All participants provided written informed consent before entry. | |
| Interventions | 1. Risperidone depot*: IM, 25, 37.5 mg or 50 mg (placebo injections matched to risperidone depot on day 1, with first active injection delayed until day 8), n = 370. 2. Paliperidone palmitate (PP): IM, 25, 50, 75 or 100 mg eq (placebo injections matched to PP on day 22 then monthly thereafter), n = 379. *1‐6 mg oral risperidone/ placebo supplementation was given for the first 4 weeks of the double‐blind treatment period. Oral risperidone (1‐4 mg) supplementation was also given at any dose increase from day 36 onwards, continuing up to week 3. | |
| Outcomes | Adverse effects: various events, AIMS, BARS, SAS scores, laboratory results: various mean change in serum levels, EKGs, evaluations of injection site (all adverse data relate to participants who received at least one dose of the study drug). Leaving the study early. Death. Unable to use ‐ Primary outcome: Non inferiority of PP with risperidone (high attrition and unable to obtain data). Secondary outcomes: average change in PANSS total score (high attrition and unable to obtain data). Global state: relapse, change in CGI‐S (high attrition and unable to obtain data). Social functioning: Change in PSP (high attrition and unable to obtain data). Mental state: average change in PANSS (high attrition and unable to obtain data). | |
| Notes | Antiparkinson medication (at permitted maximum daily doses) as rescue treatment for EPS; oral lorazepam (2‐6 mg) or other short‐acting benzodiazepines for agitation, anxiety or sleep difficulties; oral propranolol for akithisia were permitted. Antidepressents permitted if used at a stable dose for at least 30 days before screening. | |
| Risk of bias | ||
| Bias | Authors' judgement | Support for judgement |
| Random sequence generation (selection bias) | Unclear risk | Randomised: "computer generated randomisation schedule (prepared by the sponsor), balanced by using permuted blocks of treatments, stratified by centre and implemented using an interactive voice response system (IVRS)". |
| Allocation concealment (selection bias) | Low risk | Use of interactive voice response system. |
| Blinding (performance bias and detection bias) | Low risk | Participants were not allowed to view the preparation or administration of the injection. Blinded raters used to measure outcomes. |
| Incomplete outcome data (attrition bias) | High risk | High study attrition (55%): PP group drop‐out rate at n = 224 (n = 95 lack of efficacy; n = 29 adverse events; n = 55 patient choice; n = 13 lost to follow‐up; n = 1 pregnancy; n = 2 death; n = 29 other); risperidone depot group drop‐out rate at n = 186 (n = 56 lack of efficacy; n = 25 adverse events; n = 62 patient choice; n = 11 lost to follow‐up; n = 1 pregnancy; n = 0 death; n‐31 other). |
| Selective reporting (reporting bias) | Unclear risk | Missing outcomes in a supplementary table (not obtainable ‐ contact made with study author, but no reply). |
| Other bias | High risk | Funding: sponsored by Johnson & Johnson Pharmaceutical Research and Development, L.L.C. The sponsor provided a formal review of the manuscript. Two study authors (Mr Remmerie and Dr Eerdekens) were employees of Johnson & Johnson Pharmaceutical Research and Developement, Division of Janssen Pharmaceutica. |
| Methods | Allocation: random. Blinding: open‐label. Duration: 2 year. Design: parallel. Setting: international, multi‐centre, 25 countries (Europe). | |
| Participants | Diagnosis: schizophrenia or schizoaffective (DSM‐IV). N = 710. Age: ≥ 18 years, mean 40.6 +/‐ 12.5 in depot risperidone group; 42.6 +/‐ 13.1 quetiapine group; 40.9 +/‐ 12.94 in aripiprazole group. Sex: 442 M, 270 F. History: symptomatically stable. Included: switching therapy because of insufficient symptom control with current treatment, side effects or patient request; symptomatically stable‐ using stable dose of antipsychotic for ≥ 4 weeks and living in same residence for ≥ 30 days. Excluded: previous non‐response to risperidone, quetiapine or ≥ 2 antipsychotics despite adequate drug plasma levels; DSM IV axis I diagnosis other than schizophrenia or schizoaffective disorder; phenylketonuria or hypersensitivity to risperidone or quetiapine; drug or alcohol dependence during preceding 1 month; acute risk of suicide or history of suicide attempt. Consent and ethics: study conducted in accordance with guidelines of the International Conference on Harmonisation for Good Clinical Practice. Study protocol and consent were approved by ethics committees/ institutional review boards; informed consent obtained from all participants before enrolment. | |
| Interventions | 1. Risperidone depot: 25‐50 mg IM every 2 weeks, n = 329. 2. Quetiapine oral: 25 mg twice a day: day 1, 300‐ 400 mg by day 4, max 750 mg a day, n = 337. 3. Aripiprazole oral: 10‐30 mg per day, n = 46. | |
| Outcomes | Adverse events. Leaving the study early. Death. Unable to use ‐ (all due to high attrition) Time to relapse. Global state: CGI. Mental state: PANSS. Functioning assessment: SOFAS. | |
| Notes | ||
| Risk of bias | ||
| Bias | Authors' judgement | Support for judgement |
| Random sequence generation (selection bias) | Low risk | Stratified randomisation according to previous treatment. |
| Allocation concealment (selection bias) | Unclear risk | No details given. |
| Blinding (performance bias and detection bias) | High risk | Open‐label study. No evidence for any rater blinding‐ follow‐up methods differed between treatment groups (phone calls for quetiapine group and in person with depot risperidone). |
| Incomplete outcome data (attrition bias) | High risk | High attrition: treatment completed by n = 151/329 in risperidone depot; n = 120/337 oral quetiapine; n = 9 oral aripiprazole. Total follow‐up of n = 280/710 (39%) ‐ only leaving study early and adverse event data used. |
| Selective reporting (reporting bias) | Unclear risk | Some outcomes comprising relapse are not reported on their own. |
| Other bias | High risk | Funding: study sponsored by Janssen‐Cilag Medical Affairs EMEA. |
| Methods | Allocation: random. Setting: inpatient and outpatient, multi‐centre (41 centres in the USA). | |
| Participants | Diagnosis: schizophrenia (DSM‐IV). Included: baselines PANSS of 60 to 120; good general health; standard laboratory test results 'within reference ranges or not clinically significant'. Consent: trial conducted in accordance with 'current ICH‐Good Clinical Practice guidelines and the Declaration of Helsinki and its subsequent revisions'; written informed consent obtained from each participant or guardian/ legal representative. | |
| Interventions | 1. Risperidone depot: 25 mg 2 weekly + 2 mg/day oral risperidone for 3/52, n = 99. | |
| Outcomes | Adverse events: ESRS and others as reported by participants. Leaving the study early. Unable to use ‐ Global state: CGI. | |
| Notes | ||
| Risk of bias | ||
| Bias | Authors' judgement | Support for judgement |
| Random sequence generation (selection bias) | Low risk | Randomised: quote, "a dynamic method (22) was used to randomly assign patients to treatment groups. Stratification factors included investigator, inpatient/outpatient status, and Positive and Negative Syndrome Scale (23) total score at randomization." |
| Allocation concealment (selection bias) | Unclear risk | No details of allocation concealment. |
| Blinding (performance bias and detection bias) | Unclear risk | "Double blind study" but not clear who exactly was blinded, no indication given of whether the raters were blinded. Study controlled with "placebo injections that were identical in appearance [to the study drug injections]". |
| Incomplete outcome data (attrition bias) | High risk | Greater than 50% attrition by study end. |
| Selective reporting (reporting bias) | Unclear risk | Unclear risk |
| Other bias | High risk | Funding: "supported by Johnson & Johnson Pharmaceutical Research and development, Titusville, N.J." |
| Methods | Allocation: random. Blinding: open‐label. Duration: 12 months. Design: parallel. Setting: international, multi‐centre (48 centres in Australia, Belguim, France, Germany, Greece, Luxumbourg, Poland, Russia, Spain, The Netherlands and UK). | |
| Participants | Diagnosis: schizophrenia or schizoaffective disorder (DSM‐IV). N = 629* (n = 11 not treated). Age: mean˜35 years, minimum 18 years. Sex: 312 M, 235 F. History: acute exacerbation of psychosis in previous 2 months and another episode during previous 2 years. Excluded: prior treatment with clozapine or depot antipsychotic. Included: PANSS total score > 50; at least 18 years of age; BMI not exceeding 40 mg/kg2. resistance or sensitivity to risperidone or olanzapine pregnant or breast feeding women, child bearing age women if not using contraception Consent: study protocol and amendments reviewed by independent ethics committees/ institutional review boards; conducted in accordance with Declaration of Helsinki and guidelines of International Conference on Harmonisation of Technical Requirements for Registration of Pharmaceuticals for Human Use. Written informed consent required. | |
| Interventions | 1. Risperidone depot: 25, 50 or 75 mg*, n = 318. 2. Oral olanzapine: 5‐20 mg/day, n = 300. | |
| Outcomes | Mental state: PANSS. Specific adverse events; movement disorder; death and serious adverse events. Leaving the study early. | |
| Notes | *After study initiation protocol was amended to restrict the doses of depot risperidone to 25 or 50 mg; 64 patients who had already received 75 mg of depot risperidone were withdrawn from the study. | |
| Risk of bias | ||
| Bias | Authors' judgement | Support for judgement |
| Random sequence generation (selection bias) | Low risk | Randomised, "using a central dynamic randomisation procedure. Randomisation was based on a minimisation algorithm that used a probability of assignment other than 0.5 to maintain balance of treatment groups within levels of each stratification factor" (p132). stratification factors of PANSS total score, number of previous psychiatric hospitalisations, BMI, inpatient or outpatient status, using a central dynamic randomisation procedure. |
| Allocation concealment (selection bias) | Low risk | Interactive voice response system (IVRS) used to obtain randomisation number. |
| Blinding (performance bias and detection bias) | High risk | Open‐label study. No evidence of rater blinding. |
| Incomplete outcome data (attrition bias) | High risk | N = 618 originally randomised and treated; n = 264 (42%) completed at 12 months. LOCF used for endpoint data including n = 361 participants (58%). |
| Selective reporting (reporting bias) | High risk | Protocol amended to restrict risperidone doses to 20 or 50 mg after investigators found that, quote, "75 mg doses provide no greater benefit than lower doses" (p132). The n = 64 participants receiving 75 mg doses completed the study, their data were withdrawn and they were invited to enrol in an open‐label extension study. |
| Other bias | High risk | Funding: "M.I., A.K. and K.K. are employees of Johnson & Johnson... study was supported by Johnson & Johnson Pharmaceutical Research and Development" (p138). |
| Methods | Allocation: random. Blinding: open‐label. Duration: 12 weeks (with 7 week washout pre‐randomisation). Design: parallel. Setting: multi‐centre, China. | |
| Participants | Diagnosis: schizophrenia (DSM‐IV). N = 452. Age: ≥18 years of age. Sex: 181 M, 271 F. History: DSM‐IV diagnosis of schizophrenia for at least one year before screening. Included: PANSS total score between 60 to 120; BMI of 17.0 kg/m2 or greater. Excluded: DSM IV axis I diagnosis other than schizophrenia; 25% decrease in total PANSS score between screening and baseline; active substance dependence within 3 months; significant risk of suicidal or violent behaviour; presence or history of any significant or unstable systemic disease; history of treatment resistance towards two different antipsychotic treatments; pregnancy or planning; clozapine within 3 months before baseline; RIS‐LAI within 6 weeks before screening; PP within 10 months before baseline; ECT within 60 days before screening. Consent: Independent Ethics Committee or Institutional Review Board at each study site approved the protocol; study conducted in accordance with ethical principles of Declaration of Helsinki, consistent Good Clinical Practices and applicable regulatory requirements. Written informed consent required. | |
| Interventions | 1. Risperidone depot: once every two weeks, mean dose 29.8 ± 4.67 mg, n = 223. 2. Paliperidone palmitate: once monthly injections, mean dose 115.8 ± 9.07 mg, n = 229. (Plus supplementary oral risperidone for risperidone depot participants: mean daily dose 2.5 ± 0.98 mg from days 1 to 28; 1.8 ± 0.52 mg from day 36 to 57; 1.7 ± 0.47 mg from day 64 to 85).* | |
| Outcomes | Global state: CGI‐S scale score change from baseline. Mental state: change in PANSS total score; number of patients with a 30% or more reduction in PANSS total score. Adverse events: treatment‐emergent adverse events; EPSE; prolactin‐related. General functioning; Personal and Social Performance (PSP). | |
| Notes | *Other medications permitted, including: antiparkinson medication; benzodiazepines; beta‐blockers; treatment for insomnia; topical anaesthetic cream; antidepressants; individual psychotherapy. | |
| Risk of bias | ||
| Bias | Authors' judgement | Support for judgement |
| Random sequence generation (selection bias) | Low risk | Randomised: (1:1) "based on a computer‐generated randomization schedule balanced by using permuted blocks of treatments." |
| Allocation concealment (selection bias) | Unclear risk | Not described. |
| Blinding (performance bias and detection bias) | High risk | Open‐label. Rater blinding: "all efficacy assessments were administered and evaluated by independent, blinded and trained raters at each site." |
| Incomplete outcome data (attrition bias) | Low risk | N = 350 (77%) completed the study; n = 64 withdrawn from the PP groups for adverse events (n = 4), pregnancy (n = 2), protocol deviation (n = 3), lack of efficacy (n = 22), lost to follow‐up (n = 9), withdrew consent (n = 16), other reasons (n = 8). From the risperidone depot group, n = 38 were withdrawn for adverse events (n = 5), protocol deviation (n = 1), lack of efficacy (n = 9), lost to follow‐up (n = 14), withdrew consent (n = 5), other reasons (n = 4). ITT used. |
| Selective reporting (reporting bias) | Unclear risk | Not known. |
| Other bias | High risk | Funding: "funded by Xian‐Janssen Pharmaceutical Limited, Beijing, PR China. The sponsor provided a formal review of the manuscript." A number of the authors were employed by Xian‐Janssen or Johnson & Johnson at time of publication. |
| Methods | Allocation: random. Blinding: open‐label, rater blind. Duration: 2 years. Design: parallel. Setting: international, multi‐centre (USA, South America, India). | |
| Participants | Diagnosis: schizophrenia (DSM‐IV). N = 355. Age: ≥18 years of age. Sex: 210 M, 139 F. History: not described. Included: DSM‐IV schizophrenia not controlled by current medication (judged by clinician); 2+ relapses (defined as "psychiatric hospitalisation caused by worsening of psychiatric symptoms; a change in antipsychotic treatment or significant increase in antipsychotic dose because of inadequate efficacy; a newly emergent, clinically important symptom such as 'suicidality'; or a clinically notable increase in the frequency or intensity of subject contact") in the past 2 years. Stable for 2 months before randomisation. Excluded: PANSS ≥100, current hospitalisation, major medication changes, or worsening of psychiatric symptoms within two months before study entry. Current treatment with clozapine, carbamazepine or depot antipsychotics. Evidence of alcohol or drug dependence (DSM‐IV Axis I criteria) within six months before entry. Consent: study conducted in accordance with Declaration of Helsinki and Good Clinical Practice; approved by Institutional Review Board or independent ethics committee at each centre. Written informed consent required. | |
| Interventions | 1. Risperidone depot: 25‐50 mg/2 weeks, n = 177. 2. Oral aripiprazole: 5‐30 mg/daily, n = 172.* | |
| Outcomes | Global state: mean time to relapse/time in remission. Mental state: PANSS. Specific adverse events; weight; movement disorders; death; serious adverse events. Laboratory tests. | |
| Notes | *Other medications permitted, including antidepressants, anxiolytics, mood stabilisers. At clinician's judgement, if psychotics symptoms worsened, another antipsychotic was added (excluding clozapine) for up to seven days; this treatment continued if considered appropriate by investigators. If this proved ineffective, the investigator had the option to use another different secondary antipsychotic. | |
| Risk of bias | ||
| Bias | Authors' judgement | Support for judgement |
| Random sequence generation (selection bias) | Unclear risk | Randomised: "subjects were randomly assigned in a 1:1 ratio" but no details on how this was achieved. |
| Allocation concealment (selection bias) | Unclear risk | Concealment not described. |
| Blinding (performance bias and detection bias) | High risk | Open‐label, participants and study drug administrators were not blinded, but with blinded raters. |
| Incomplete outcome data (attrition bias) | Low risk | "The proportions of injectable RLAT and aripiprazole subjects who discontinued the study before completing two years were 29.6% and 28.4%, respectively" and reasons for discontinuation are given. Of the original n = 355 randomised, n = 346 were included in ITT analysis. |
| Selective reporting (reporting bias) | Unclear risk | None detected. |
| Other bias | High risk | Study authors employed by Janssen: "Dr. Macfadden was with Ortho‐McNeil Janssen Scientific Affairs, LLC, Titusville, New Jersey, at the time of this analysis; Drs. Ma and Haskins are with Johnson & Johnson Pharmaceutical Research and Development, LLC, Titusville, New Jersey; and Drs. Bossie and Alphs are with Ortho‐McNeil Janssen Scientific Affairs, LLC, Titusville, New Jersey." |
| Methods | Allocation: random. Blinding: double. Duration: 13 weeks. Design: parallel, double dummy, non‐inferiority comparative study. Setting: international multi‐centre, 89 centres from 14 countries (Bulgaria; Czech Republic; Estonia; Hungary; Lithuania; Poland; Russia; Ukraine; USA; Austria; France; Germany; Spain; India). | |
| Participants | Diagnosis: schizophrenia (DSM‐IV). N = 1220. Age: ≥18 years of age. Sex: 701 M, 513 F. History: 65% PP and 69% RIS‐LAI participants were receiving atypical antipsychotics prior to study, with oral risperidone used by similar percentage of participants in each group; Included: PANSS total score between 60 and 120, BMI ≥17 kg/m2 and <40 kg/m2; schizophrenia DSM‐IV criteria for >1 year. Excluded: DSM‐IV Axis I diagnoses other than schizophrenia; decrease in at least 25% in PANSS total from screening to baseline; substance dependence within 3 months before screening; history of treatment resistance; significant unstable systemic disease; suicidal or violent behaviour; previously received injections of PP and treatment with any other 'disallowed' medications (including mood stabilisers, lithium and anticonvulsants); exposure to an experimental drug, biologic or medical device within past 6 months pre‐screening; pregnancy/ planning or currently nursing. Consent: Independent Ethics Committee or Institutional Review Board at each study site approved protocol and amended protocol. Study conducted in accordance with Declaration of Helsinki and Good Clinical Practice guidelines. Written informed consent required. | |
| Interventions | 1. Risperidone depot: bi‐weekly, oral supplementation (1 mg; mean final dose 3.3 ± 1.59 mg) and placebo injections (matched to PP); 25, 37.5 and 50 mg; mean final dose 31.7 ± 9.28 mg, n = 613. 2. Paliperidone palmitate (PP): initiation regimen*, monthly PP injections, placebo injections (matched to RIS) and placebo oral supplementation; 50, 100 and 150 mg equivalents; mean final dose 104.5 ±3 0.51 mg, n = 607. | |
| Outcomes | Global state: CGI‐ S score change; Shedule for Deficit Syndrome. Mental state: PANSS total score change; responder rate with more than 30% reduction in PANSS. Adverse events: treatment‐emergent adverse events; EPS rating scales; Simpson and Angus Rating scale; BARS; AIMS. General functioning: Personal and Social Performance (PSP). | |
| Notes | *PP deltoid injections day 1, 150 mg eq, day 8, 100 mg eq and subsequent flexible dosing (50, 100 or 150 mg eq) once a month | |
| Risk of bias | ||
| Bias | Authors' judgement | Support for judgement |
| Random sequence generation (selection bias) | Low risk | Randomised: 1:1, computer‐generated randomisation scheme, stratified by centre, implemented by an interactive voice response system. |
| Allocation concealment (selection bias) | Low risk | Interactive voice response system used. |
| Blinding (performance bias and detection bias) | Low risk | Study drug administrator was the only person to contact IVRS to receive medication number and was not allowed to communicate patient‐related information to study site personal or to perform any efficacy and safety assessment. Patient and staff performing study‐related procedures were to be precluded from seeing the contents of syringe or observing the injection. |
| Incomplete outcome data (attrition bias) | Low risk | N = 927 (76%) completed the study (n = 456 in PP; n = 471 in RIS‐LAI); n = 151 withdrawn from PP group (n = 55 withdrawn consent, n = 40 lack of efficacy, n = 20 adverse events, n = 11 lost to follow‐up, n = 2 death, n = 1 pregnancy, n = 22 'other'); n = 142 withdrawn from RIS‐LAI group (n = 52 withdrawn consent, n = 43 lack of efficacy, n = 10 adverse event, n = 18, lost to follow‐up, n = 19 'other'). 'Safety analysis' conducted (n = 1214), which included all participants that had received at least one dose of the study drug. |
| Selective reporting (reporting bias) | Unclear risk | Unclear. |
| Other bias | High risk | Funding: "Johnson & Johnson Pharmaceutical Research and Development, L.L.C. funded this study and was responsible for study design and data collection, analysis and its interpretation..." (p225). Many of the authors are employees of Johnson & Johnson Pharmaceutical Research and Development, L.L.C. |
| Methods | Allocation: random. Blinding: open‐label. Duration: 24 months. Design: parallel. Setting: multi‐centre, Canada. | |
| Participants | Diagnosis: schizophrenia, schizophreniform disorder or schizoaffective disorder (DSM‐IV). N = 85. Age: risperidone depot mean 22.5 +/‐ 3.12 years of age; oral SGA mean 23.0 +/‐ 2.93 years of age. Sex: 65 M, 12 F. History: early onset (within the past 3 years) of psychosis. Included: no inclusion criteria stated. Excluded: no exclusion criteria stated. Consent: no details. | |
| Interventions | 1. Risperidone depot: every 2 weeks, median dose at 18 weeks 25 mg; at 9, 12 and final visit 37.5 mg, n = 45. 2. Oral second generation antipsychotics (risperidone, olanzapine or quetiapine) (dosage not specified), n = 40. | |
| Outcomes | Leaving the study early (discontinuation). Global state (relapse). Specific adverse events. Unable to use ‐ Mental state: PANSS; Global state: CGI‐S; Anxiety: Hamilton Anxiety scale; SAFS (unclear as to participant numbers within groups). Time to stabilisation (no SD). | |
| Notes | Note: extractable data limited due to only available results from this study derived from conference poster. | |
| Risk of bias | ||
| Bias | Authors' judgement | Support for judgement |
| Random sequence generation (selection bias) | Unclear risk | Quote, "patients were randomized" ‐ no further details. |
| Allocation concealment (selection bias) | Unclear risk | Not described. |
| Blinding (performance bias and detection bias) | High risk | Open‐label described ‐ no further details. |
| Incomplete outcome data (attrition bias) | High risk | N = 46 (54%) discontinued the study; |
| Selective reporting (reporting bias) | Unclear risk | Conference poster, therefore results for all outcomes were not provided. |
| Other bias | High risk | Quinn AM and Mitchell D are both employees of Janssen Inc and Johnson and Johnson Stockholders; Camacho F is consultant to Janssen Inc; Chue P has received research and travel grants from Janssen, Pfizer, Eli Lilly, AstraZeneca, Sunovion, Lundbeck, GlaxoSmithKline, Bristol Mayers Squibb, Mylan, Novartis and Hoffman La Roche, Mella. |
| Methods | Allocation: random. Blinding: single (rater). Duration: 2 years. Design: parallel. Setting: multi‐centre, 14 Veteran Affairs (VA) medical centres, inpatient, USA. | |
| Participants | Diagnosis: schizophrenia or schizoaffective disorder (DSM‐IV). N = 382. Age: ≥ 18 years of age. Sex: not stated. History: 64% participants reported problems with medication adherence in past (43% patient‐reported, and 60% physician‐reported); 37% participants reported active problems with alcohol or drug use (25% patient‐reported, and 36% physician‐reported). Included: at risk of hospitalisation as evidenced by current hospitalisation; hospitalisation in the previous 2 years, or increased use of services to prevent relapse. Excluded: detoxification in the previous month; past intolerance to risperidone or IM injections; current treatment with long‐acting injectable antipsychotics; oral clozapine, warfarin or a combination of those agents; serious medical conditions; unstable living arrangements; and a history of assault or suicidal behavior requiring urgent intervention. Consent: guardian or participant consent permitted; participants' decisional capacity assessed with MacArthur Competence Assessment Tool. | |
| Interventions | 1. Risperidone depot: 25 mg to 50 mg every 2 weeks; dosage increments of 12.5 mg permitted every 4 weeks at discretion of treating physician, n = 190. 2. Oral antipsychotics: as prescribed by treating physician, n = 192*. | |
| Outcomes | Service utilisation: hospitalisation; outpatient care. Global state: use of benzodiazepines or sedative drugs. Adverse events: death; other specific events. Not receiving allocation study medication. Leaving the study early: any reason. Unable to use ‐ Global state: CGI (follow‐up rates less than 50%). Metal State: Total PANSS score and Positive, negative and general subscale (follow‐up rates less than 50%). Quality of life: Heinrichs‐Carpenter Quality of Life Scale, Personal and Social Performance scale (PSP), Quality of well being scale (follow‐up rates less than 50%). Adverse events: BARS; Abnormal involuntary movements rating scale; Simpson and Angus rating scale for extrapyramidal side effects (follow‐up rates less than 50%). | |
| Notes | *Concomitant psychotropic medication (anti‐anxiety, anti‐depressants, oral antipsychotics and mood stabilisers, as well as anticholinergic medications were permitted. | |
| Risk of bias | ||
| Bias | Authors' judgement | Support for judgement |
| Random sequence generation (selection bias) | Low risk | Randomly permuted blocks of various size, centrally conducted and stratified according to site. |
| Allocation concealment (selection bias) | Unclear risk | Not described. |
| Blinding (performance bias and detection bias) | High risk | Single blind (implied). Blinded video conference assessment for some measures, but others assessed in unblinded meetings. |
| Incomplete outcome data (attrition bias) | High risk | Of n = 382 randomised, n = 237 completed the study; including n = 75 oral antipsychotic treatment (n = 7 declined participation and did not receive intervention; n = 65 'lost to follow‐up or discontinued'; n = 3 excluded because participant did not have a Social Security number or baseline data), and n = 74 in risperidone depot group (n = 2 declined participation and did not receive intervention; n = 71 'lost to follow‐up or discontinued'; n = 1 excluded because participant did not have a Social Security number or baseline data). ITT analysis used ‐ follow‐up rates in this analysis group included n = 223 (60%) at year 1; n = 170 (46%) at 18 months; n = 107 (29%) at 24 months. Of the deaths, in the risperidone group, n = 1 died in his sleep and n = 1 took his own life; in the oral antipsychotic group, n = 1 died from chronic obstructive pulmonary disease and n = 1 from accidental drowning. |
| Selective reporting (reporting bias) | Low risk | Supplemental pages cover all outcomes. |
| Other bias | Unclear risk | Industry funded study but stated that Janssen had no involvement beyond financial and intervention drug provision. |
AIMS: Abnormal Involuntary Movement Scale
BARS: Barnes Akathisia Rating Scale
BMI: body mass index
CGI: Clinical Global Impression
CNS: central nervous system
DSM‐IV: Diagnostic and Statistical Mannual version 1V
EPS: extrapyramidal symptoms
ESRS: Extrapyramidal Symptom Rating Scale
GAF: Global Assessment of Functioning
IM: intramuscular
ITT: intention to‐treat
LOCF: last observation carried forward
N =: number of participants
NMS: neuroleptic malignant syndrome
PANSS: Positive And Negative Symptom Scale
PP: paliperidone palmitate
PSP: Personal and Social Performance Scale
RIS‐LAI: risperidone long‐acting injectable
SAFS: Social and Functioning Assessment Scale
SAS: Simpson and Angus Rating scale
SD: Standard Deviation
SF36: short form 36
SGA: Second‐generation antipsychotic
SOFAS: Social and Occupational Functioning Assessment Scale
UKU:Udvalg for Kliniske Undersgelser side effects rating scale
Characteristics of excluded studies [ordered by study ID]
| Study | Reason for exclusion |
| Allocation: not a randomised controlled trial. | |
| Allocation: randomised. | |
| Allocation: not randomised; review article. | |
| Allocation: randomised. Participants: people with schizophrenia. Intervention: not depot risperidone. 1. PF‐02545920: 5 mg and 15 mg (titrated fixed doses. 3 mg (titrated). | |
| Allocation: not randomised; open‐label. | |
| Allocation: not randomised; review. | |
| Allocation: randomised. | |
| Allocation: randomised. | |
| Allocation: not a randomised controlled trial. | |
| Allocation: randomised. | |
| Allocation: randomised. Participants: people with schizophrenia. Intervention: long‐acting injectable risperidone or oral atypical antipsychotics. Outcomes: no useable data, only levels of insight and relapse at baseline. | |
| Allocation: non‐randomised comparison of two samples taken from randomised trials. | |
| Allocation: randomised. Intervention: AZD8529 40 mg, risperidone (oral) 4 mg, or placebo, not depot risperidone. | |
| Allocation: randomised. | |
| Allocation: randomised. Participants: people with early stage schizophrenia. Intervention: minocycline or placebo, not depot risperidone. | |
| Allocation: not randomised. | |
| Allocation: randomised. Participants: people with schizophrenia. Interventions: 25 mg or 50 mg of risperidone depot no other comparison group (post‐hoc analysis from another study). | |
| Allocation: randomised. Participnats: females with schizotypal personality disorder, not schizophrenia. | |
| Allocation: not randomised, a review of studies. | |
| Allocation: non‐random, pilot study. | |
| Allocation: randomised. | |
| Allocation: randomised. | |
| Allocation: randomised. Participants: people with subclinical levels of schizophrenia‐like symptoms Intervention: nicotine, risperidone, amisulpride or placebo, not depot risperidone. | |
| Allocation: randomised. Participants: people with schizophrenia. Interventions: two doses of depot risperidone, no control. | |
| Allocation: randomised. | |
| Interventions: participants switched to depot risperidone with no other comparison group. | |
| Allocation: randomised to recommendation of treatment. | |
| Allocation: non‐randomised; depot risperidone was the only intervention. |
Characteristics of studies awaiting assessment [ordered by study ID]
| Methods | Randomised. |
| Participants | People with schizophrenia. |
| Interventions | Long‐acting risperidone, placebo. |
| Outcomes | Unsure |
| Notes | Both conference abstracts, reports quality of life data with depot risperidone but it may be part of one of the included studies (Kane 2002*). Authors have been contacted for more details |
| Methods | Allocation: randomised. Blinding: unclear. Setting: not stated. Duration: not stated. |
| Participants | Diagnosis: schizophrenia, first episode N = 87 Age: not stated Sex: not stated History: not stated Included: not stated Excluded: not stated Consent: not stated |
| Interventions | 1. Risperidone depot, n = 18 2. Oral antipsychotic treatment, n = 21 |
| Outcomes | PAS Scale, neuropsychological battery, diagnostic assessment (SCID‐I) and stability at one year follow‐up, clinical assessment (PANSS; CGI; SUMD; HDRS and YMRS), functional assessment (GAF), quality of life (WHO/DAS), hospitalisations, urgency episodes and treatment compliance |
| Notes | Unable to extract any usable data from the published conference poster and abstract. Number of total included participants does not match numbers randomised. |
| Methods | Allocation: unsure |
| Participants | Diagnosis: schizophrenia |
| Interventions | 1. Risperidone depot 2. Risperidone tablets |
| Outcomes | Unsure. |
| Notes | Unable to find any details: authors have been contacted for more details |
CGI: Clinical Global Impression
GAF: Global Assessment of Functioning
HDRS: Hamilton Rating Scale for Depression
PANSS: Positive and Negative Syndrome Scale
PAS: Psychogeriatric Assessment Scale
SCID‐1: Structured Clinical Interview for DSM‐IV Axis I Disorders
SUMD: Scale to Assess Unawareness of Mental Disorder
YMRS: Young Mania Rating Scale
Data and analyses
| Outcome or subgroup title | No. of studies | No. of participants | Statistical method | Effect size |
| 1 Mental state: 1. Change (exacerbation) in specific symptoms Show forest plot | 1 | Risk Ratio (M‐H, Random, 95% CI) | Subtotals only | |
| Analysis 1.1  Comparison 1 RISPERIDONE DEPOT vs PLACEBO, Outcome 1 Mental state: 1. Change (exacerbation) in specific symptoms. | ||||
| 1.1 anxiety ‐ short term | 1 | 400 | Risk Ratio (M‐H, Random, 95% CI) | 0.58 [0.32, 1.05] |
| 1.2 agitation ‐ short term | 1 | 400 | Risk Ratio (M‐H, Random, 95% CI) | 0.60 [0.39, 0.92] |
| 1.3 hallucinations ‐ short term | 1 | 400 | Risk Ratio (M‐H, Random, 95% CI) | 1.23 [0.47, 3.22] |
| 1.4 nervousness ‐ short term | 1 | 400 | Risk Ratio (M‐H, Random, 95% CI) | 0.39 [0.12, 1.25] |
| 1.5 psychosis ‐ short term | 1 | 400 | Risk Ratio (M‐H, Random, 95% CI) | 0.52 [0.33, 0.83] |
| 2 Leaving the study early: 1. Any reason (by time period) Show forest plot | 1 | Risk Ratio (M‐H, Random, 95% CI) | Subtotals only | |
| Analysis 1.2  Comparison 1 RISPERIDONE DEPOT vs PLACEBO, Outcome 2 Leaving the study early: 1. Any reason (by time period). | ||||
| 2.1 very early on (<1 injection) | 1 | 400 | Risk Ratio (M‐H, Random, 95% CI) | 1.30 [0.55, 3.08] |
| 2.2 by 12 weeks | 1 | 400 | Risk Ratio (M‐H, Random, 95% CI) | 0.74 [0.63, 0.88] |
| 3 Leaving the study early: 2. Any reason (by doses) Show forest plot | 1 | Risk Ratio (M‐H, Random, 95% CI) | Subtotals only | |
| Analysis 1.3  Comparison 1 RISPERIDONE DEPOT vs PLACEBO, Outcome 3 Leaving the study early: 2. Any reason (by doses). | ||||
| 3.1 all doses risperidone depot ‐ short term | 1 | 400 | Risk Ratio (M‐H, Random, 95% CI) | 0.74 [0.63, 0.88] |
| 3.2 25mg risperidone depot ‐ short term | 1 | 197 | Risk Ratio (M‐H, Random, 95% CI) | 0.74 [0.59, 0.94] |
| 3.3 50mg risperidone depot ‐ short term | 1 | 201 | Risk Ratio (M‐H, Random, 95% CI) | 0.74 [0.59, 0.93] |
| 3.4 75mg risperidone depot ‐ short term | 1 | 198 | Risk Ratio (M‐H, Random, 95% CI) | 0.75 [0.60, 0.94] |
| 4 Leaving the study early: 3. Because of insufficient response (by doses) Show forest plot | 1 | Risk Ratio (M‐H, Random, 95% CI) | Subtotals only | |
| Analysis 1.4 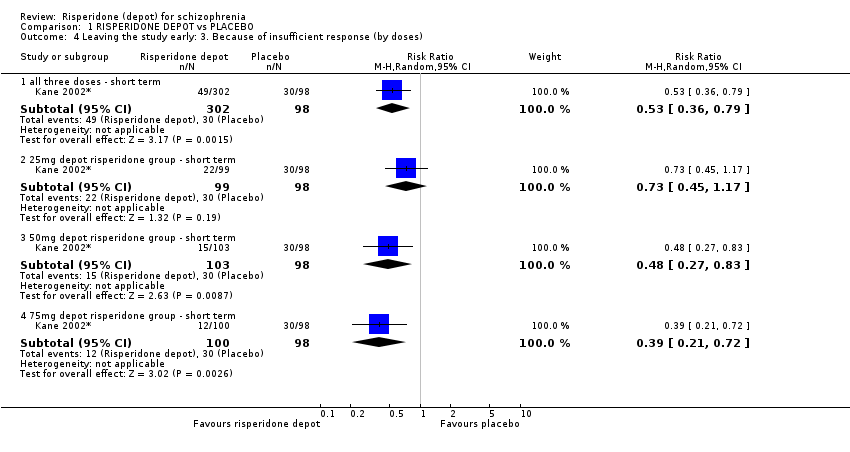 Comparison 1 RISPERIDONE DEPOT vs PLACEBO, Outcome 4 Leaving the study early: 3. Because of insufficient response (by doses). | ||||
| 4.1 all three doses ‐ short term | 1 | 400 | Risk Ratio (M‐H, Random, 95% CI) | 0.53 [0.36, 0.79] |
| 4.2 25mg depot risperidone group ‐ short term | 1 | 197 | Risk Ratio (M‐H, Random, 95% CI) | 0.73 [0.45, 1.17] |
| 4.3 50mg depot risperidone group ‐ short term | 1 | 201 | Risk Ratio (M‐H, Random, 95% CI) | 0.48 [0.27, 0.83] |
| 4.4 75mg depot risperidone group ‐ short term | 1 | 198 | Risk Ratio (M‐H, Random, 95% CI) | 0.39 [0.21, 0.72] |
| 5 Adverse events: 1. General: a. Death Show forest plot | 1 | Risk Ratio (M‐H, Random, 95% CI) | Subtotals only | |
| Analysis 1.5  Comparison 1 RISPERIDONE DEPOT vs PLACEBO, Outcome 5 Adverse events: 1. General: a. Death. | ||||
| 5.1 short term | 1 | 400 | Risk Ratio (M‐H, Random, 95% CI) | 0.11 [0.00, 2.65] |
| 6 Adverse events: 1. General: b. Severe adverse event (by doses) Show forest plot | 1 | Risk Ratio (M‐H, Random, 95% CI) | Subtotals only | |
| Analysis 1.6  Comparison 1 RISPERIDONE DEPOT vs PLACEBO, Outcome 6 Adverse events: 1. General: b. Severe adverse event (by doses). | ||||
| 6.1 any dose risperidone depot ‐ short term | 1 | 400 | Risk Ratio (M‐H, Random, 95% CI) | 0.59 [0.38, 0.93] |
| 6.2 25mg risperidone depot ‐ short term | 1 | 197 | Risk Ratio (M‐H, Random, 95% CI) | 0.56 [0.30, 1.04] |
| 6.3 50mg risperidone depot ‐ short term | 1 | 201 | Risk Ratio (M‐H, Random, 95% CI) | 0.58 [0.32, 1.06] |
| 6.4 75mg risperidone depot ‐ short term | 1 | 198 | Risk Ratio (M‐H, Random, 95% CI) | 0.64 [0.36, 1.15] |
| 7 Adverse events: 1. General: c. Adverse event necessitating withdrawal from study (by doses) Show forest plot | 1 | Risk Ratio (M‐H, Random, 95% CI) | Subtotals only | |
| Analysis 1.7 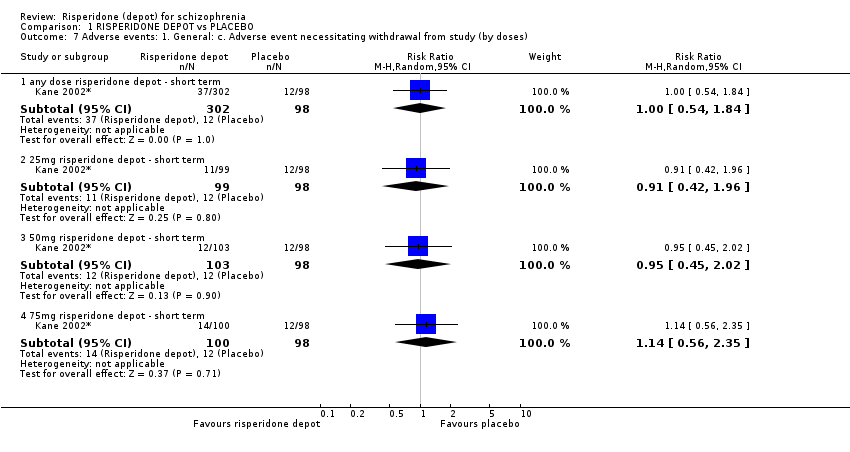 Comparison 1 RISPERIDONE DEPOT vs PLACEBO, Outcome 7 Adverse events: 1. General: c. Adverse event necessitating withdrawal from study (by doses). | ||||
| 7.1 any dose risperidone depot ‐ short term | 1 | 400 | Risk Ratio (M‐H, Random, 95% CI) | 1.00 [0.54, 1.84] |
| 7.2 25mg risperidone depot ‐ short term | 1 | 197 | Risk Ratio (M‐H, Random, 95% CI) | 0.91 [0.42, 1.96] |
| 7.3 50mg risperidone depot ‐ short term | 1 | 201 | Risk Ratio (M‐H, Random, 95% CI) | 0.95 [0.45, 2.02] |
| 7.4 75mg risperidone depot ‐ short term | 1 | 198 | Risk Ratio (M‐H, Random, 95% CI) | 1.14 [0.56, 2.35] |
| 8 Adverse events: 2. Specific: a. Cardiovascular Show forest plot | 1 | Risk Ratio (M‐H, Random, 95% CI) | Subtotals only | |
| Analysis 1.8 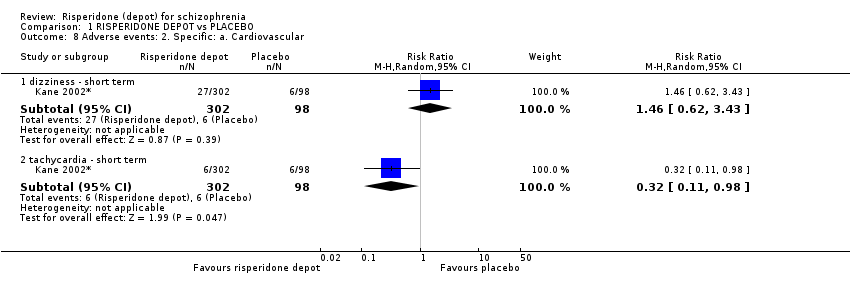 Comparison 1 RISPERIDONE DEPOT vs PLACEBO, Outcome 8 Adverse events: 2. Specific: a. Cardiovascular. | ||||
| 8.1 dizziness ‐ short term | 1 | 400 | Risk Ratio (M‐H, Random, 95% CI) | 1.46 [0.62, 3.43] |
| 8.2 tachycardia ‐ short term | 1 | 400 | Risk Ratio (M‐H, Random, 95% CI) | 0.32 [0.11, 0.98] |
| 9 Adverse events: 2. Specific: b. Gastrointestinal Show forest plot | 1 | Risk Ratio (M‐H, Random, 95% CI) | Subtotals only | |
| Analysis 1.9  Comparison 1 RISPERIDONE DEPOT vs PLACEBO, Outcome 9 Adverse events: 2. Specific: b. Gastrointestinal. | ||||
| 9.1 constipation ‐ short term | 1 | 400 | Risk Ratio (M‐H, Random, 95% CI) | 6.17 [0.84, 45.46] |
| 9.2 diarrhoea ‐ short term | 1 | 400 | Risk Ratio (M‐H, Random, 95% CI) | 0.87 [0.23, 3.20] |
| 9.3 nausea ‐ short term | 1 | 400 | Risk Ratio (M‐H, Random, 95% CI) | 1.04 [0.39, 2.76] |
| 9.4 vomiting ‐ short term | 1 | 400 | Risk Ratio (M‐H, Random, 95% CI) | 0.59 [0.23, 1.57] |
| 10 Adverse events: 2. Specific: c. Movement disorders: a. Extrapyramidal disorder ‐ spontaneously reported (by doses) Show forest plot | 1 | Risk Ratio (M‐H, Random, 95% CI) | Subtotals only | |
| Analysis 1.10 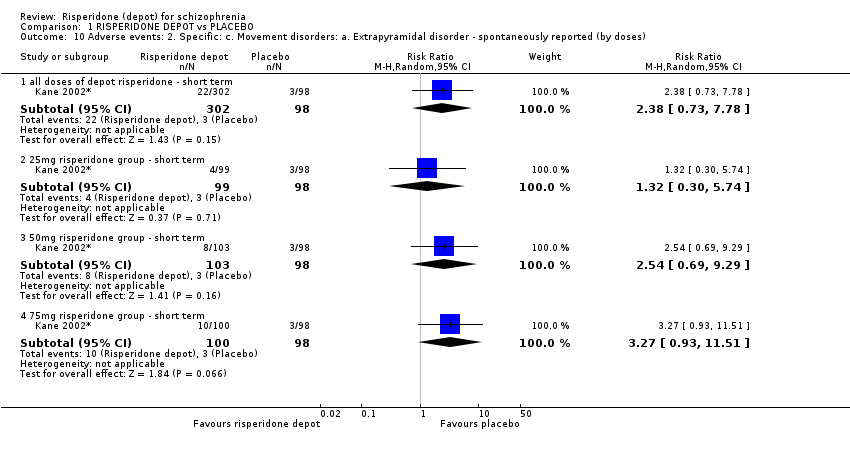 Comparison 1 RISPERIDONE DEPOT vs PLACEBO, Outcome 10 Adverse events: 2. Specific: c. Movement disorders: a. Extrapyramidal disorder ‐ spontaneously reported (by doses). | ||||
| 10.1 all doses of depot risperidone ‐ short term | 1 | 400 | Risk Ratio (M‐H, Random, 95% CI) | 2.38 [0.73, 7.78] |
| 10.2 25mg risperidone group ‐ short term | 1 | 197 | Risk Ratio (M‐H, Random, 95% CI) | 1.32 [0.30, 5.74] |
| 10.3 50mg risperidone group ‐ short term | 1 | 201 | Risk Ratio (M‐H, Random, 95% CI) | 2.54 [0.69, 9.29] |
| 10.4 75mg risperidone group ‐ short term | 1 | 198 | Risk Ratio (M‐H, Random, 95% CI) | 3.27 [0.93, 11.51] |
| 11 Adverse events: 2. Specific: d. Movement disorders: b. Hyperkinesia (by doses) Show forest plot | 1 | Risk Ratio (M‐H, Random, 95% CI) | Subtotals only | |
| Analysis 1.11  Comparison 1 RISPERIDONE DEPOT vs PLACEBO, Outcome 11 Adverse events: 2. Specific: d. Movement disorders: b. Hyperkinesia (by doses). | ||||
| 11.1 all doses of risperidone ‐ short term | 1 | 400 | Risk Ratio (M‐H, Random, 95% CI) | 1.70 [0.60, 4.84] |
| 11.2 25mg risperidone group ‐ short term | 1 | 197 | Risk Ratio (M‐H, Random, 95% CI) | 0.49 [0.09, 2.64] |
| 11.3 50mg risperidone group ‐ short term | 1 | 201 | Risk Ratio (M‐H, Random, 95% CI) | 2.14 [0.68, 6.73] |
| 11.4 75mg of risperidone group ‐ short term | 1 | 198 | Risk Ratio (M‐H, Random, 95% CI) | 2.45 [0.79, 7.55] |
| 12 Adverse events: 2. Specific: e. Movement disorders: c. Hypertonia (by doses) Show forest plot | 1 | Risk Ratio (M‐H, Random, 95% CI) | Subtotals only | |
| Analysis 1.12  Comparison 1 RISPERIDONE DEPOT vs PLACEBO, Outcome 12 Adverse events: 2. Specific: e. Movement disorders: c. Hypertonia (by doses). | ||||
| 12.1 all doses of depot risperidone ‐ short term | 1 | 400 | Risk Ratio (M‐H, Random, 95% CI) | 1.23 [0.47, 3.22] |
| 12.2 25mg risperidone ‐ short term | 1 | 197 | Risk Ratio (M‐H, Random, 95% CI) | 0.79 [0.22, 2.86] |
| 12.3 50mg risperidone ‐ short term | 1 | 201 | Risk Ratio (M‐H, Random, 95% CI) | 0.95 [0.28, 3.19] |
| 12.4 75mg risperidone ‐ short term | 1 | 198 | Risk Ratio (M‐H, Random, 95% CI) | 1.96 [0.70, 5.53] |
| 13 Adverse events: 2. Specific: f. Pain Show forest plot | 1 | Risk Ratio (M‐H, Random, 95% CI) | Subtotals only | |
| Analysis 1.13  Comparison 1 RISPERIDONE DEPOT vs PLACEBO, Outcome 13 Adverse events: 2. Specific: f. Pain. | ||||
| 13.1 headache ‐ short term | 1 | 400 | Risk Ratio (M‐H, Random, 95% CI) | 1.57 [0.88, 2.80] |
| 13.2 pain ‐ unspecified ‐ short term | 1 | 400 | Risk Ratio (M‐H, Random, 95% CI) | 1.38 [0.48, 4.00] |
| 14 Adverse events: 2. Specific: g. Salivation Show forest plot | 1 | Risk Ratio (M‐H, Random, 95% CI) | Subtotals only | |
| Analysis 1.14 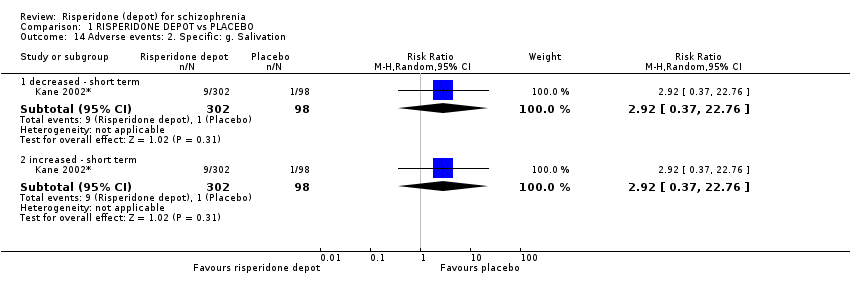 Comparison 1 RISPERIDONE DEPOT vs PLACEBO, Outcome 14 Adverse events: 2. Specific: g. Salivation. | ||||
| 14.1 decreased ‐ short term | 1 | 400 | Risk Ratio (M‐H, Random, 95% CI) | 2.92 [0.37, 22.76] |
| 14.2 increased ‐ short term | 1 | 400 | Risk Ratio (M‐H, Random, 95% CI) | 2.92 [0.37, 22.76] |
| 15 Adverse events: 2. Specific: h. Sleep disturbances Show forest plot | 1 | Risk Ratio (M‐H, Random, 95% CI) | Subtotals only | |
| Analysis 1.15  Comparison 1 RISPERIDONE DEPOT vs PLACEBO, Outcome 15 Adverse events: 2. Specific: h. Sleep disturbances. | ||||
| 15.1 insomnia ‐ short term | 1 | 400 | Risk Ratio (M‐H, Random, 95% CI) | 1.04 [0.60, 1.82] |
| 15.2 somnolence ‐ short term | 1 | 400 | Risk Ratio (M‐H, Random, 95% CI) | 2.27 [0.69, 7.45] |
| 16 Adverse events: 2. Specific: i. Weight gain Show forest plot | 1 | Risk Ratio (M‐H, Random, 95% CI) | Subtotals only | |
| Analysis 1.16  Comparison 1 RISPERIDONE DEPOT vs PLACEBO, Outcome 16 Adverse events: 2. Specific: i. Weight gain. | ||||
| 16.1 all doses of depot risperidone ‐ short term | 1 | 400 | Risk Ratio (M‐H, Random, 95% CI) | 2.11 [0.48, 9.18] |
| 16.2 25mg risperidone ‐ short term | 1 | 197 | Risk Ratio (M‐H, Random, 95% CI) | 2.47 [0.49, 12.45] |
| 16.3 50mg risperidone ‐ short term | 1 | 201 | Risk Ratio (M‐H, Random, 95% CI) | 1.90 [0.36, 10.16] |
| 16.4 75mg risperidone ‐ short term | 1 | 198 | Risk Ratio (M‐H, Random, 95% CI) | 1.96 [0.37, 10.46] |
| 17 Adverse events: 2. Specific: j. Others Show forest plot | 1 | Risk Ratio (M‐H, Random, 95% CI) | Subtotals only | |
| Analysis 1.17  Comparison 1 RISPERIDONE DEPOT vs PLACEBO, Outcome 17 Adverse events: 2. Specific: j. Others. | ||||
| 17.1 coughing ‐ short term | 1 | 400 | Risk Ratio (M‐H, Random, 95% CI) | 0.97 [0.32, 2.95] |
| 17.2 fatigue ‐ short term | 1 | 400 | Risk Ratio (M‐H, Random, 95% CI) | 8.82 [0.53, 147.05] |
| 17.3 injury ‐ short term | 1 | 400 | Risk Ratio (M‐H, Random, 95% CI) | 0.38 [0.13, 1.10] |
| 17.4 rhinitis ‐ short term | 1 | 400 | Risk Ratio (M‐H, Random, 95% CI) | 1.01 [0.47, 2.17] |
| Outcome or subgroup title | No. of studies | No. of participants | Statistical method | Effect size | |||||||||||||||||||||||||
| 1 Global state: 1. Relapse (any reason) Show forest plot | 1 | Risk Ratio (M‐H, Random, 95% CI) | Subtotals only | ||||||||||||||||||||||||||
| Analysis 2.1  Comparison 2 RISPERIDONE DEPOT vs GENERAL ORAL ANTIPSYCHOTICS, Outcome 1 Global state: 1. Relapse (any reason). | |||||||||||||||||||||||||||||
| 1.1 long term | 1 | 63 | Risk Ratio (M‐H, Random, 95% CI) | 2.13 [0.84, 5.43] | |||||||||||||||||||||||||
| 2 Global state: 2. Needing use of benzodiazepine or sedative drugs Show forest plot | 1 | Risk Ratio (M‐H, Random, 95% CI) | Subtotals only | ||||||||||||||||||||||||||
| Analysis 2.2 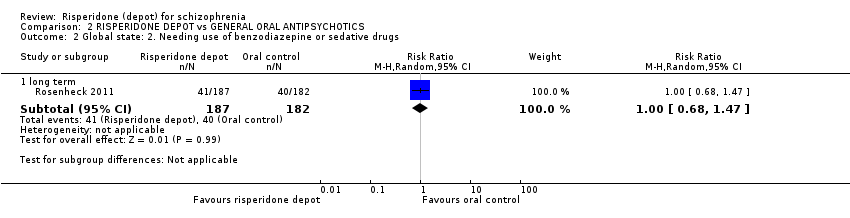 Comparison 2 RISPERIDONE DEPOT vs GENERAL ORAL ANTIPSYCHOTICS, Outcome 2 Global state: 2. Needing use of benzodiazepine or sedative drugs. | |||||||||||||||||||||||||||||
| 2.1 long term | 1 | 369 | Risk Ratio (M‐H, Random, 95% CI) | 1.00 [0.68, 1.47] | |||||||||||||||||||||||||
| 3 Service utilisation: 1. Hospitalisation Show forest plot | 1 | Risk Ratio (M‐H, Random, 95% CI) | Subtotals only | ||||||||||||||||||||||||||
| Analysis 2.3 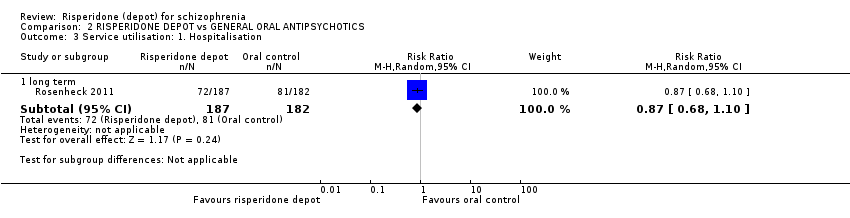 Comparison 2 RISPERIDONE DEPOT vs GENERAL ORAL ANTIPSYCHOTICS, Outcome 3 Service utilisation: 1. Hospitalisation. | |||||||||||||||||||||||||||||
| 3.1 long term | 1 | 369 | Risk Ratio (M‐H, Random, 95% CI) | 0.87 [0.68, 1.10] | |||||||||||||||||||||||||
| 4 Service utilisation: 2. Outpatient care ‐ number of outpatient visits (skewed data) Show forest plot | Other data | No numeric data | |||||||||||||||||||||||||||
| Analysis 2.4
Comparison 2 RISPERIDONE DEPOT vs GENERAL ORAL ANTIPSYCHOTICS, Outcome 4 Service utilisation: 2. Outpatient care ‐ number of outpatient visits (skewed data). | |||||||||||||||||||||||||||||
| 4.1 long term | Other data | No numeric data | |||||||||||||||||||||||||||
| 5 Not receiving allocated study medication Show forest plot | 1 | Risk Ratio (M‐H, Random, 95% CI) | Subtotals only | ||||||||||||||||||||||||||
| Analysis 2.5 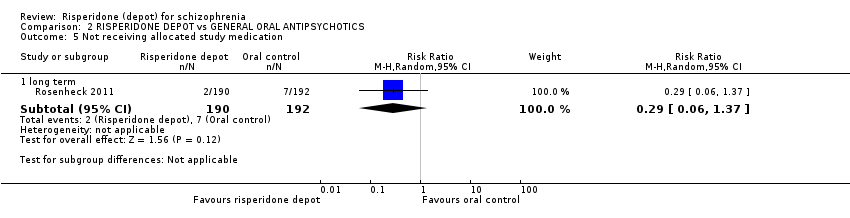 Comparison 2 RISPERIDONE DEPOT vs GENERAL ORAL ANTIPSYCHOTICS, Outcome 5 Not receiving allocated study medication. | |||||||||||||||||||||||||||||
| 5.1 long term | 1 | 382 | Risk Ratio (M‐H, Random, 95% CI) | 0.29 [0.06, 1.37] | |||||||||||||||||||||||||
| 6 Leaving the study early: 1. Any reason Show forest plot | 2 | 467 | Risk Ratio (M‐H, Random, 95% CI) | 1.24 [0.98, 1.57] | |||||||||||||||||||||||||
| Analysis 2.6  Comparison 2 RISPERIDONE DEPOT vs GENERAL ORAL ANTIPSYCHOTICS, Outcome 6 Leaving the study early: 1. Any reason. | |||||||||||||||||||||||||||||
| 6.1 long term | 2 | 467 | Risk Ratio (M‐H, Random, 95% CI) | 1.24 [0.98, 1.57] | |||||||||||||||||||||||||
| 7 Leaving the study early: 2. Specific Show forest plot | 1 | Risk Ratio (M‐H, Random, 95% CI) | Subtotals only | ||||||||||||||||||||||||||
| Analysis 2.7  Comparison 2 RISPERIDONE DEPOT vs GENERAL ORAL ANTIPSYCHOTICS, Outcome 7 Leaving the study early: 2. Specific. | |||||||||||||||||||||||||||||
| 7.1 insufficient response ‐ long term | 1 | 382 | Risk Ratio (M‐H, Random, 95% CI) | 0.61 [0.15, 2.50] | |||||||||||||||||||||||||
| 7.2 withdrawn consent ‐ long term | 1 | 382 | Risk Ratio (M‐H, Random, 95% CI) | 1.41 [0.86, 2.31] | |||||||||||||||||||||||||
| 8 Adverse events: 1. General: a. Death Show forest plot | 1 | Risk Ratio (M‐H, Random, 95% CI) | Subtotals only | ||||||||||||||||||||||||||
| Analysis 2.8  Comparison 2 RISPERIDONE DEPOT vs GENERAL ORAL ANTIPSYCHOTICS, Outcome 8 Adverse events: 1. General: a. Death. | |||||||||||||||||||||||||||||
| 8.1 long term | 1 | 382 | Risk Ratio (M‐H, Random, 95% CI) | 1.01 [0.14, 7.10] | |||||||||||||||||||||||||
| 9 Adverse events: 2. Specific Show forest plot | 2 | Risk Ratio (M‐H, Random, 95% CI) | Subtotals only | ||||||||||||||||||||||||||
| Analysis 2.9  Comparison 2 RISPERIDONE DEPOT vs GENERAL ORAL ANTIPSYCHOTICS, Outcome 9 Adverse events: 2. Specific. | |||||||||||||||||||||||||||||
| 9.1 anxiety ‐ long term | 1 | 85 | Risk Ratio (M‐H, Random, 95% CI) | 1.40 [0.42, 4.60] | |||||||||||||||||||||||||
| 9.2 diabetes mellitus ‐ long term | 1 | 369 | Risk Ratio (M‐H, Random, 95% CI) | 1.70 [0.73, 3.96] | |||||||||||||||||||||||||
| 9.3 dizziness ‐ long term | 1 | 85 | Risk Ratio (M‐H, Random, 95% CI) | 1.49 [0.53, 4.19] | |||||||||||||||||||||||||
| 9.4 fatigue/somnolence ‐ long term | 1 | 85 | Risk Ratio (M‐H, Random, 95% CI) | 2.05 [0.78, 5.40] | |||||||||||||||||||||||||
| 9.5 gastrointestinal ‐ long term | 1 | 369 | Risk Ratio (M‐H, Random, 95% CI) | 1.10 [0.95, 1.28] | |||||||||||||||||||||||||
| 9.6 general disorders and administration site conditions ‐ long term | 1 | 369 | Risk Ratio (M‐H, Random, 95% CI) | 1.31 [1.02, 1.69] | |||||||||||||||||||||||||
| 9.7 headache ‐ long term | 1 | 85 | Risk Ratio (M‐H, Random, 95% CI) | 2.80 [1.12, 7.00] | |||||||||||||||||||||||||
| 9.8 insomnia ‐ long term | 1 | 85 | Risk Ratio (M‐H, Random, 95% CI) | 1.73 [0.77, 3.91] | |||||||||||||||||||||||||
| 9.9 nausea/ vomiting ‐ long term | 1 | 85 | Risk Ratio (M‐H, Random, 95% CI) | 1.86 [0.50, 6.97] | |||||||||||||||||||||||||
| 9.10 prolactin related ‐ long term | 1 | 85 | Risk Ratio (M‐H, Random, 95% CI) | 10.27 [0.59, 180.05] | |||||||||||||||||||||||||
| 9.11 weight increase ‐ long term | 1 | 85 | Risk Ratio (M‐H, Random, 95% CI) | 1.33 [0.56, 3.17] | |||||||||||||||||||||||||
| 10 Adverse events: Nervous system disorders (inc. EPS) Show forest plot | 1 | Risk Ratio (M‐H, Random, 95% CI) | Subtotals only | ||||||||||||||||||||||||||
| Analysis 2.10  Comparison 2 RISPERIDONE DEPOT vs GENERAL ORAL ANTIPSYCHOTICS, Outcome 10 Adverse events: Nervous system disorders (inc. EPS). | |||||||||||||||||||||||||||||
| 10.1 long term | 1 | 369 | Risk Ratio (M‐H, Random, 95% CI) | 1.34 [1.13, 1.58] | |||||||||||||||||||||||||
| Outcome or subgroup title | No. of studies | No. of participants | Statistical method | Effect size |
| 1 Global state: 1. Moderate to severely ill at end of study period (CGI rating) Show forest plot | 1 | Risk Ratio (M‐H, Random, 95% CI) | Subtotals only | |
| Analysis 3.1  Comparison 3 RISPERIDONE DEPOT vs ORAL RISPERIDONE, Outcome 1 Global state: 1. Moderate to severely ill at end of study period (CGI rating). | ||||
| 1.1 short term | 1 | 640 | Risk Ratio (M‐H, Random, 95% CI) | 1.06 [0.92, 1.22] |
| 2 Global state: 2. Mean change from baseline (CGI‐S, high score = worse) Show forest plot | 1 | Mean Difference (IV, Random, 95% CI) | Subtotals only | |
| Analysis 3.2  Comparison 3 RISPERIDONE DEPOT vs ORAL RISPERIDONE, Outcome 2 Global state: 2. Mean change from baseline (CGI‐S, high score = worse). | ||||
| 2.1 short term | 1 | 50 | Mean Difference (IV, Random, 95% CI) | ‐0.04 [‐0.25, 0.17] |
| 3 Global state: 3. Mean (SD) GAF score change to endpoint Show forest plot | 1 | Mean Difference (IV, Random, 95% CI) | Subtotals only | |
| Analysis 3.3 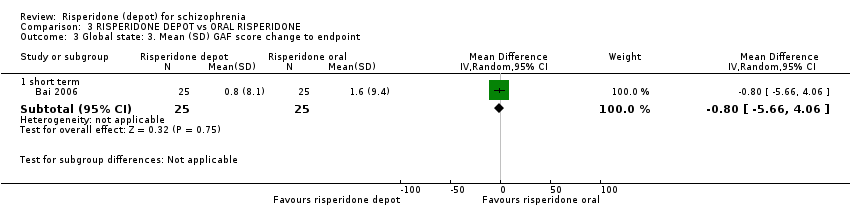 Comparison 3 RISPERIDONE DEPOT vs ORAL RISPERIDONE, Outcome 3 Global state: 3. Mean (SD) GAF score change to endpoint. | ||||
| 3.1 short term | 1 | 50 | Mean Difference (IV, Random, 95% CI) | ‐0.8 [‐5.66, 4.06] |
| 4 Global state: 4. Needing use of benzodiazepine or sedative drugs Show forest plot | 2 | 690 | Risk Ratio (M‐H, Random, 95% CI) | 0.87 [0.74, 1.02] |
| Analysis 3.4  Comparison 3 RISPERIDONE DEPOT vs ORAL RISPERIDONE, Outcome 4 Global state: 4. Needing use of benzodiazepine or sedative drugs. | ||||
| 4.1 short term | 2 | 690 | Risk Ratio (M‐H, Random, 95% CI) | 0.87 [0.74, 1.02] |
| 5 Mental state: 1. Average change/endpoint scores (PANSS, high score = worse) Show forest plot | 2 | Mean Difference (IV, Random, 95% CI) | Subtotals only | |
| Analysis 3.5  Comparison 3 RISPERIDONE DEPOT vs ORAL RISPERIDONE, Outcome 5 Mental state: 1. Average change/endpoint scores (PANSS, high score = worse). | ||||
| 5.1 mean total (non ITT data) | 1 | 541 | Mean Difference (IV, Random, 95% CI) | 0.0 [‐2.91, 2.91] |
| 5.2 average change: 1. total (non ITT data) | 2 | 591 | Mean Difference (IV, Random, 95% CI) | 1.05 [‐0.77, 2.88] |
| 5.3 average change: 2. positive (non‐ITT data) | 2 | 591 | Mean Difference (IV, Random, 95% CI) | 0.83 [‐0.69, 2.35] |
| 5.4 average change: 3. negative (non ITT data) | 2 | 591 | Mean Difference (IV, Random, 95% CI) | 0.03 [‐0.76, 0.82] |
| 5.5 average change: 4. disorganised thoughts | 1 | 541 | Mean Difference (IV, Random, 95% CI) | 0.10 [‐0.45, 0.65] |
| 5.6 average change: 5. hostility/excitement | 1 | 541 | Mean Difference (IV, Random, 95% CI) | 0.10 [‐0.18, 0.38] |
| 5.7 average change: 6. anxiety/depression | 1 | 541 | Mean Difference (IV, Random, 95% CI) | 0.10 [‐0.45, 0.65] |
| 6 Leaving the study early: 1. Any reason Show forest plot | 2 | 690 | Risk Ratio (M‐H, Random, 95% CI) | 1.28 [0.92, 1.79] |
| Analysis 3.6  Comparison 3 RISPERIDONE DEPOT vs ORAL RISPERIDONE, Outcome 6 Leaving the study early: 1. Any reason. | ||||
| 6.1 short term | 2 | 690 | Risk Ratio (M‐H, Random, 95% CI) | 1.28 [0.92, 1.79] |
| 7 Leaving the study early: 2. Specific Show forest plot | 1 | Risk Ratio (M‐H, Random, 95% CI) | Subtotals only | |
| Analysis 3.7  Comparison 3 RISPERIDONE DEPOT vs ORAL RISPERIDONE, Outcome 7 Leaving the study early: 2. Specific. | ||||
| 7.1 adverse events ‐ short term | 1 | 640 | Risk Ratio (M‐H, Random, 95% CI) | 1.21 [0.62, 2.35] |
| 7.2 insufficient response ‐ short term | 1 | 640 | Risk Ratio (M‐H, Random, 95% CI) | 1.51 [0.63, 3.64] |
| 7.3 withdrawn consent ‐ short term | 1 | 640 | Risk Ratio (M‐H, Random, 95% CI) | 1.32 [0.65, 2.66] |
| 8 Quality of life: Mean (SD) SF‐36 score change/endpoint (high score = better) Show forest plot | 1 | Mean Difference (IV, Random, 95% CI) | Subtotals only | |
| Analysis 3.8 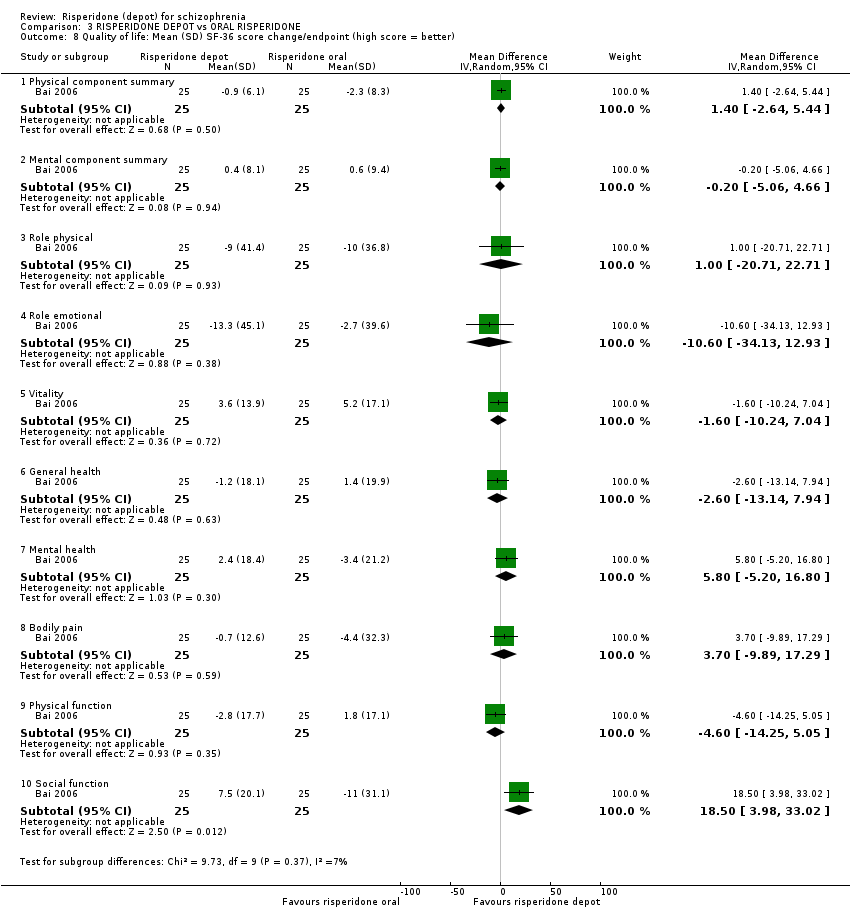 Comparison 3 RISPERIDONE DEPOT vs ORAL RISPERIDONE, Outcome 8 Quality of life: Mean (SD) SF‐36 score change/endpoint (high score = better). | ||||
| 8.1 Physical component summary | 1 | 50 | Mean Difference (IV, Random, 95% CI) | 1.4 [‐2.64, 5.44] |
| 8.2 Mental component summary | 1 | 50 | Mean Difference (IV, Random, 95% CI) | ‐0.20 [‐5.06, 4.66] |
| 8.3 Role physical | 1 | 50 | Mean Difference (IV, Random, 95% CI) | 1.0 [‐20.71, 22.71] |
| 8.4 Role emotional | 1 | 50 | Mean Difference (IV, Random, 95% CI) | ‐10.60 [‐34.13, 12.93] |
| 8.5 Vitality | 1 | 50 | Mean Difference (IV, Random, 95% CI) | ‐1.6 [‐10.24, 7.04] |
| 8.6 General health | 1 | 50 | Mean Difference (IV, Random, 95% CI) | ‐2.60 [‐13.14, 7.94] |
| 8.7 Mental health | 1 | 50 | Mean Difference (IV, Random, 95% CI) | 5.8 [‐5.20, 16.80] |
| 8.8 Bodily pain | 1 | 50 | Mean Difference (IV, Random, 95% CI) | 3.70 [‐9.89, 17.29] |
| 8.9 Physical function | 1 | 50 | Mean Difference (IV, Random, 95% CI) | ‐4.6 [‐14.25, 5.05] |
| 8.10 Social function | 1 | 50 | Mean Difference (IV, Random, 95% CI) | 18.5 [3.98, 33.02] |
| 9 Adverse events: 1. General Show forest plot | 1 | Risk Ratio (M‐H, Random, 95% CI) | Subtotals only | |
| Analysis 3.9 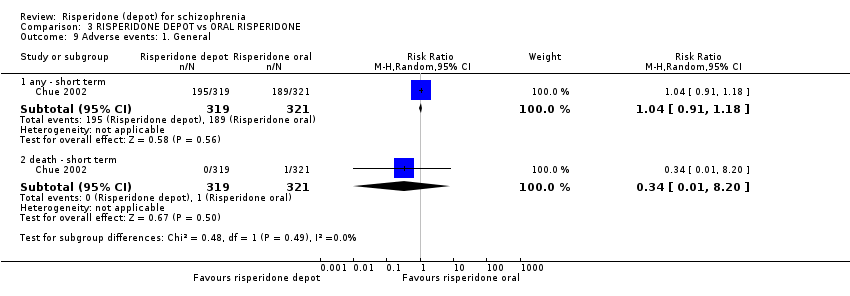 Comparison 3 RISPERIDONE DEPOT vs ORAL RISPERIDONE, Outcome 9 Adverse events: 1. General. | ||||
| 9.1 any ‐ short term | 1 | 640 | Risk Ratio (M‐H, Random, 95% CI) | 1.04 [0.91, 1.18] |
| 9.2 death ‐ short term | 1 | 640 | Risk Ratio (M‐H, Random, 95% CI) | 0.34 [0.01, 8.20] |
| 10 Adverse events: 1. General: UKU average change score (high = worse) Show forest plot | 1 | Mean Difference (IV, Random, 95% CI) | Subtotals only | |
| Analysis 3.10  Comparison 3 RISPERIDONE DEPOT vs ORAL RISPERIDONE, Outcome 10 Adverse events: 1. General: UKU average change score (high = worse). | ||||
| 10.1 short term | 1 | 50 | Mean Difference (IV, Random, 95% CI) | ‐1.99 [‐3.59, ‐0.39] |
| 11 Adverse events: 2. Specific Show forest plot | 1 | Risk Ratio (M‐H, Random, 95% CI) | Subtotals only | |
| Analysis 3.11  Comparison 3 RISPERIDONE DEPOT vs ORAL RISPERIDONE, Outcome 11 Adverse events: 2. Specific. | ||||
| 11.1 anxiety | 1 | 640 | Risk Ratio (M‐H, Random, 95% CI) | 1.40 [0.84, 2.34] |
| 11.2 psychosis | 1 | 640 | Risk Ratio (M‐H, Random, 95% CI) | 1.14 [0.58, 2.24] |
| 11.3 prolactin related | 1 | 640 | Risk Ratio (M‐H, Random, 95% CI) | 0.50 [0.15, 1.65] |
| 11.4 impotence/ejaculation failure | 1 | 640 | Risk Ratio (M‐H, Random, 95% CI) | 0.34 [0.01, 8.20] |
| 11.5 dysmenorrhoea | 1 | 640 | Risk Ratio (M‐H, Random, 95% CI) | 1.01 [0.06, 16.02] |
| 11.6 hyperprolactinaemia | 1 | 640 | Risk Ratio (M‐H, Random, 95% CI) | 0.20 [0.01, 4.18] |
| 11.7 galactorrhoea | 1 | 640 | Risk Ratio (M‐H, Random, 95% CI) | 1.01 [0.14, 7.10] |
| 11.8 headache | 1 | 640 | Risk Ratio (M‐H, Random, 95% CI) | 1.14 [0.66, 1.95] |
| 11.9 insomnia | 1 | 640 | Risk Ratio (M‐H, Random, 95% CI) | 1.08 [0.66, 1.74] |
| 11.10 sexual dysfunction | 1 | 640 | Risk Ratio (M‐H, Random, 95% CI) | 0.50 [0.05, 5.52] |
| 12 Adverse events: 2. Specific: Mean (SD) weight increase in kg Show forest plot | 1 | Mean Difference (IV, Random, 95% CI) | Subtotals only | |
| Analysis 3.12  Comparison 3 RISPERIDONE DEPOT vs ORAL RISPERIDONE, Outcome 12 Adverse events: 2. Specific: Mean (SD) weight increase in kg. | ||||
| 12.1 short term | 1 | 640 | Mean Difference (IV, Random, 95% CI) | 0.2 [‐0.35, 0.75] |
| 13 Adverse events: 3. Movement disorder Show forest plot | 2 | Risk Ratio (M‐H, Random, 95% CI) | Subtotals only | |
| Analysis 3.13  Comparison 3 RISPERIDONE DEPOT vs ORAL RISPERIDONE, Outcome 13 Adverse events: 3. Movement disorder. | ||||
| 13.1 any extra pyramidal symptoms ‐ short term | 1 | 640 | Risk Ratio (M‐H, Random, 95% CI) | 1.05 [0.59, 1.88] |
| 13.2 participants requiring anti‐cholinergic drugs ‐ short term | 2 | 690 | Risk Ratio (M‐H, Random, 95% CI) | 1.03 [0.66, 1.60] |
| 13.3 tardive dyskinesia ‐ short term | 1 | 640 | Risk Ratio (M‐H, Random, 95% CI) | 9.06 [0.49, 167.52] |
| 14 Adverse events: Mean (SD) change in movement disorder rating scales Show forest plot | 1 | Mean Difference (IV, Random, 95% CI) | Subtotals only | |
| Analysis 3.14  Comparison 3 RISPERIDONE DEPOT vs ORAL RISPERIDONE, Outcome 14 Adverse events: Mean (SD) change in movement disorder rating scales. | ||||
| 14.1 AIMS | 1 | 50 | Mean Difference (IV, Random, 95% CI) | 1.16 [‐1.23, 3.55] |
| 14.2 BARS | 1 | 50 | Mean Difference (IV, Random, 95% CI) | 0.16 [‐0.65, 0.97] |
| 14.3 SAS | 1 | 50 | Mean Difference (IV, Random, 95% CI) | ‐0.55 [‐3.71, 2.61] |
| Outcome or subgroup title | No. of studies | No. of participants | Statistical method | Effect size |
| 1 Leaving the study early: 1. Any reason Show forest plot | 1 | Risk Ratio (M‐H, Random, 95% CI) | Subtotals only | |
| Analysis 4.1  Comparison 4 RISPERIDONE DEPOT vs ORAL QUETIAPINE, Outcome 1 Leaving the study early: 1. Any reason. | ||||
| 1.1 long term | 1 | 666 | Risk Ratio (M‐H, Random, 95% CI) | 0.84 [0.74, 0.95] |
| 2 Leaving the study early: 2. Specific Show forest plot | 1 | Risk Ratio (M‐H, Random, 95% CI) | Subtotals only | |
| Analysis 4.2  Comparison 4 RISPERIDONE DEPOT vs ORAL QUETIAPINE, Outcome 2 Leaving the study early: 2. Specific. | ||||
| 2.1 due to relapse ‐ long term | 1 | 666 | Risk Ratio (M‐H, Random, 95% CI) | 0.54 [0.40, 0.73] |
| 3 Adverse events: 1. General Show forest plot | 1 | Risk Ratio (M‐H, Random, 95% CI) | Subtotals only | |
| Analysis 4.3  Comparison 4 RISPERIDONE DEPOT vs ORAL QUETIAPINE, Outcome 3 Adverse events: 1. General. | ||||
| 3.1 any | 1 | 666 | Risk Ratio (M‐H, Random, 95% CI) | 0.98 [0.89, 1.09] |
| 3.2 serious | 1 | 666 | Risk Ratio (M‐H, Random, 95% CI) | 0.84 [0.62, 1.13] |
| 3.3 death | 1 | 666 | Risk Ratio (M‐H, Random, 95% CI) | 1.54 [0.26, 9.14] |
| 4 Adverse events: 2. Specifc Show forest plot | 1 | Risk Ratio (M‐H, Random, 95% CI) | Subtotals only | |
| Analysis 4.4  Comparison 4 RISPERIDONE DEPOT vs ORAL QUETIAPINE, Outcome 4 Adverse events: 2. Specifc. | ||||
| 4.1 psychiatric symptoms | 1 | 666 | Risk Ratio (M‐H, Random, 95% CI) | 1.00 [0.84, 1.19] |
| 4.2 prolactin related | 1 | 666 | Risk Ratio (M‐H, Random, 95% CI) | 3.07 [1.13, 8.36] |
| 4.3 hyperprolactinaemia | 1 | 666 | Risk Ratio (M‐H, Random, 95% CI) | 8.81 [3.53, 21.96] |
| 4.4 serious psychiatric symptoms | 1 | 666 | Risk Ratio (M‐H, Random, 95% CI) | 0.82 [0.58, 1.16] |
| 4.5 weight increase | 1 | 666 | Risk Ratio (M‐H, Random, 95% CI) | 1.12 [0.63, 1.99] |
| 4.6 headache | 1 | 666 | Risk Ratio (M‐H, Random, 95% CI) | 1.21 [0.64, 2.26] |
| 4.7 fatigue/somnolence | 1 | 666 | Risk Ratio (M‐H, Random, 95% CI) | 0.16 [0.07, 0.38] |
| 5 Adverse events: 2. Specific: Mean (SD) weight increase in kg Show forest plot | 1 | Mean Difference (IV, Random, 95% CI) | Subtotals only | |
| Analysis 4.5 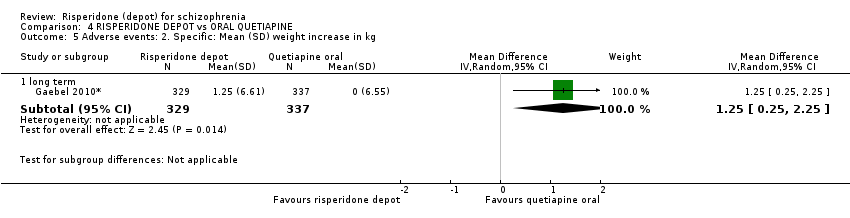 Comparison 4 RISPERIDONE DEPOT vs ORAL QUETIAPINE, Outcome 5 Adverse events: 2. Specific: Mean (SD) weight increase in kg. | ||||
| 5.1 long term | 1 | 666 | Mean Difference (IV, Random, 95% CI) | 1.25 [0.25, 2.25] |
| 6 Adverse events: 3. Movement disorder Show forest plot | 1 | Risk Ratio (M‐H, Random, 95% CI) | Subtotals only | |
| Analysis 4.6  Comparison 4 RISPERIDONE DEPOT vs ORAL QUETIAPINE, Outcome 6 Adverse events: 3. Movement disorder. | ||||
| 6.1 any extra pyramidal symptom | 1 | 666 | Risk Ratio (M‐H, Random, 95% CI) | 1.83 [1.07, 3.15] |
| 6.2 tremor | 1 | 666 | Risk Ratio (M‐H, Random, 95% CI) | 5.12 [1.13, 23.20] |
| 6.3 tardive dyskinesia | 1 | 666 | Risk Ratio (M‐H, Random, 95% CI) | 0.34 [0.04, 3.27] |
| 6.4 dystonia | 1 | 666 | Risk Ratio (M‐H, Random, 95% CI) | 0.51 [0.05, 5.62] |
| 6.5 parkinsonism | 1 | 666 | Risk Ratio (M‐H, Random, 95% CI) | 2.56 [1.01, 6.52] |
| 6.6 hyperkinesia | 1 | 666 | Risk Ratio (M‐H, Random, 95% CI) | 1.66 [0.70, 3.96] |
| Outcome or subgroup title | No. of studies | No. of participants | Statistical method | Effect size |
| 1 Global state: 1. Relapse (any reason) Show forest plot | 1 | Risk Ratio (M‐H, Random, 95% CI) | Subtotals only | |
| Analysis 5.1 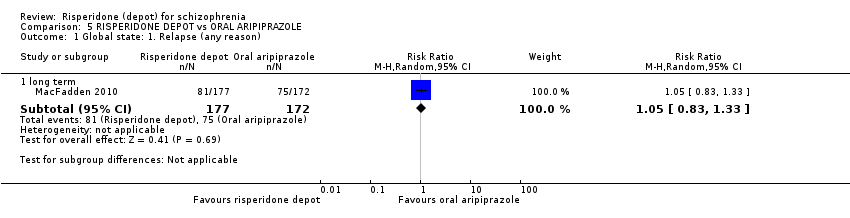 Comparison 5 RISPERIDONE DEPOT vs ORAL ARIPIPRAZOLE, Outcome 1 Global state: 1. Relapse (any reason). | ||||
| 1.1 long term | 1 | 349 | Risk Ratio (M‐H, Random, 95% CI) | 1.05 [0.83, 1.33] |
| 2 Global state: 3. Mean time in remission (days) Show forest plot | 1 | Mean Difference (IV, Random, 95% CI) | Subtotals only | |
| Analysis 5.2 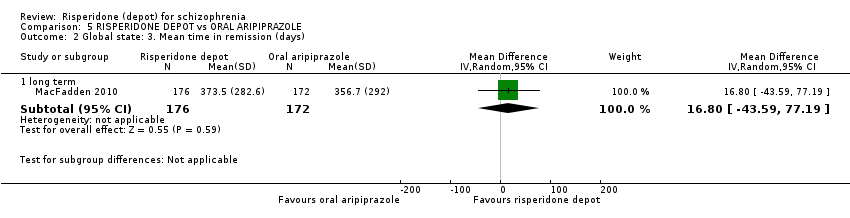 Comparison 5 RISPERIDONE DEPOT vs ORAL ARIPIPRAZOLE, Outcome 2 Global state: 3. Mean time in remission (days). | ||||
| 2.1 long term | 1 | 348 | Mean Difference (IV, Random, 95% CI) | 16.80 [‐43.59, 77.19] |
| 3 Mental state: 1. Average change scores (PANSS, high score = worse) Show forest plot | 1 | Mean Difference (IV, Random, 95% CI) | Subtotals only | |
| Analysis 5.3  Comparison 5 RISPERIDONE DEPOT vs ORAL ARIPIPRAZOLE, Outcome 3 Mental state: 1. Average change scores (PANSS, high score = worse). | ||||
| 3.1 long term | 1 | 349 | Mean Difference (IV, Random, 95% CI) | ‐0.10 [‐3.15, 2.95] |
| 4 Leaving the study early: 1. Any reason Show forest plot | 2 | 723 | Risk Ratio (M‐H, Random, 95% CI) | 0.83 [0.53, 1.30] |
| Analysis 5.4 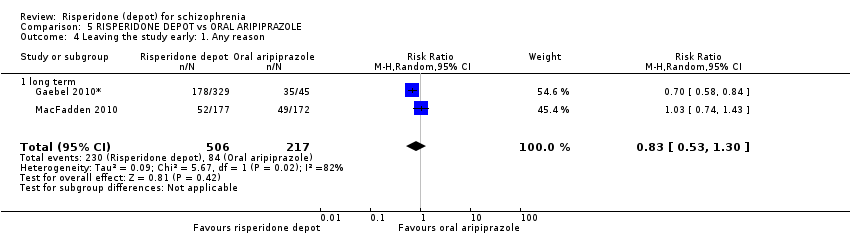 Comparison 5 RISPERIDONE DEPOT vs ORAL ARIPIPRAZOLE, Outcome 4 Leaving the study early: 1. Any reason. | ||||
| 4.1 long term | 2 | 723 | Risk Ratio (M‐H, Random, 95% CI) | 0.83 [0.53, 1.30] |
| 5 Leaving the study early: 2. Specific Show forest plot | 2 | Risk Ratio (M‐H, Random, 95% CI) | Subtotals only | |
| Analysis 5.5 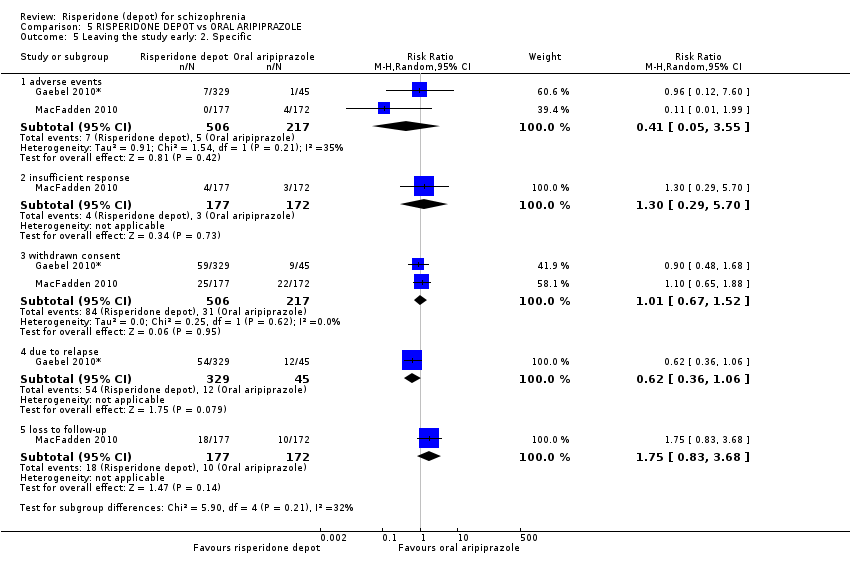 Comparison 5 RISPERIDONE DEPOT vs ORAL ARIPIPRAZOLE, Outcome 5 Leaving the study early: 2. Specific. | ||||
| 5.1 adverse events | 2 | 723 | Risk Ratio (M‐H, Random, 95% CI) | 0.41 [0.05, 3.55] |
| 5.2 insufficient response | 1 | 349 | Risk Ratio (M‐H, Random, 95% CI) | 1.30 [0.29, 5.70] |
| 5.3 withdrawn consent | 2 | 723 | Risk Ratio (M‐H, Random, 95% CI) | 1.01 [0.67, 1.52] |
| 5.4 due to relapse | 1 | 374 | Risk Ratio (M‐H, Random, 95% CI) | 0.62 [0.36, 1.06] |
| 5.5 loss to follow‐up | 1 | 349 | Risk Ratio (M‐H, Random, 95% CI) | 1.75 [0.83, 3.68] |
| 6 Adverse events: 1. General Show forest plot | 2 | Risk Ratio (M‐H, Random, 95% CI) | Subtotals only | |
| Analysis 5.6  Comparison 5 RISPERIDONE DEPOT vs ORAL ARIPIPRAZOLE, Outcome 6 Adverse events: 1. General. | ||||
| 6.1 any | 2 | 729 | Risk Ratio (M‐H, Random, 95% CI) | 0.99 [0.87, 1.14] |
| 6.2 serious | 2 | 729 | Risk Ratio (M‐H, Random, 95% CI) | 0.96 [0.66, 1.39] |
| 6.3 death | 2 | 729 | Risk Ratio (M‐H, Random, 95% CI) | 0.98 [0.13, 7.36] |
| 7 Adverse events: 2. Specific Show forest plot | 2 | Risk Ratio (M‐H, Random, 95% CI) | Subtotals only | |
| Analysis 5.7 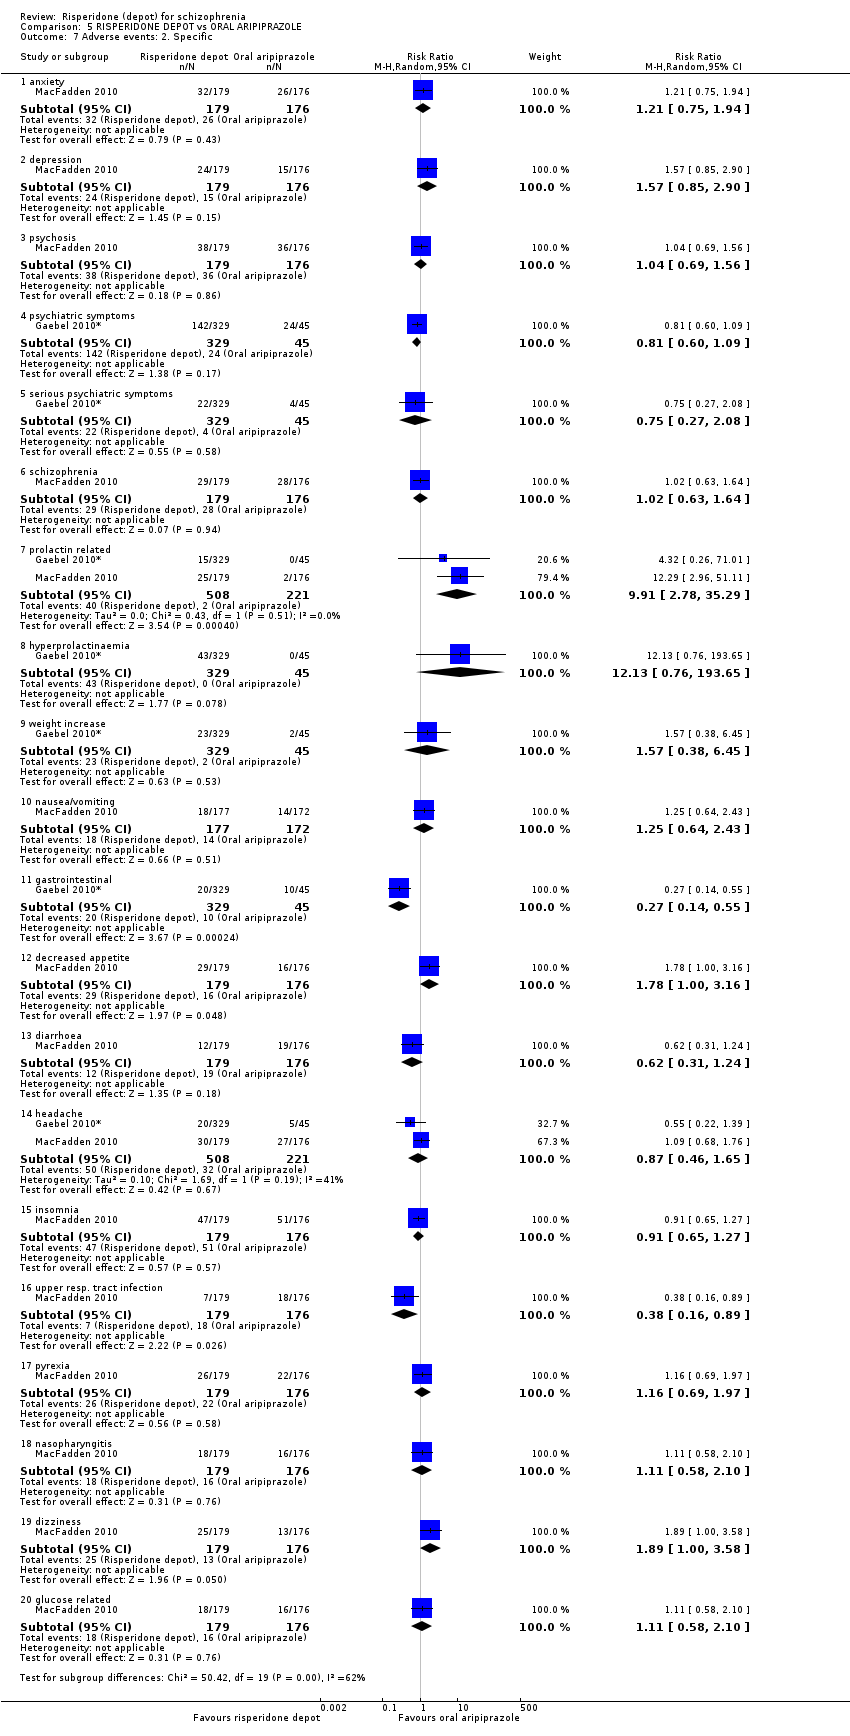 Comparison 5 RISPERIDONE DEPOT vs ORAL ARIPIPRAZOLE, Outcome 7 Adverse events: 2. Specific. | ||||
| 7.1 anxiety | 1 | 355 | Risk Ratio (M‐H, Random, 95% CI) | 1.21 [0.75, 1.94] |
| 7.2 depression | 1 | 355 | Risk Ratio (M‐H, Random, 95% CI) | 1.57 [0.85, 2.90] |
| 7.3 psychosis | 1 | 355 | Risk Ratio (M‐H, Random, 95% CI) | 1.04 [0.69, 1.56] |
| 7.4 psychiatric symptoms | 1 | 374 | Risk Ratio (M‐H, Random, 95% CI) | 0.81 [0.60, 1.09] |
| 7.5 serious psychiatric symptoms | 1 | 374 | Risk Ratio (M‐H, Random, 95% CI) | 0.75 [0.27, 2.08] |
| 7.6 schizophrenia | 1 | 355 | Risk Ratio (M‐H, Random, 95% CI) | 1.02 [0.63, 1.64] |
| 7.7 prolactin related | 2 | 729 | Risk Ratio (M‐H, Random, 95% CI) | 9.91 [2.78, 35.29] |
| 7.8 hyperprolactinaemia | 1 | 374 | Risk Ratio (M‐H, Random, 95% CI) | 12.13 [0.76, 193.65] |
| 7.9 weight increase | 1 | 374 | Risk Ratio (M‐H, Random, 95% CI) | 1.57 [0.38, 6.45] |
| 7.10 nausea/vomiting | 1 | 349 | Risk Ratio (M‐H, Random, 95% CI) | 1.25 [0.64, 2.43] |
| 7.11 gastrointestinal | 1 | 374 | Risk Ratio (M‐H, Random, 95% CI) | 0.27 [0.14, 0.55] |
| 7.12 decreased appetite | 1 | 355 | Risk Ratio (M‐H, Random, 95% CI) | 1.78 [1.00, 3.16] |
| 7.13 diarrhoea | 1 | 355 | Risk Ratio (M‐H, Random, 95% CI) | 0.62 [0.31, 1.24] |
| 7.14 headache | 2 | 729 | Risk Ratio (M‐H, Random, 95% CI) | 0.87 [0.46, 1.65] |
| 7.15 insomnia | 1 | 355 | Risk Ratio (M‐H, Random, 95% CI) | 0.91 [0.65, 1.27] |
| 7.16 upper resp. tract infection | 1 | 355 | Risk Ratio (M‐H, Random, 95% CI) | 0.38 [0.16, 0.89] |
| 7.17 pyrexia | 1 | 355 | Risk Ratio (M‐H, Random, 95% CI) | 1.16 [0.69, 1.97] |
| 7.18 nasopharyngitis | 1 | 355 | Risk Ratio (M‐H, Random, 95% CI) | 1.11 [0.58, 2.10] |
| 7.19 dizziness | 1 | 355 | Risk Ratio (M‐H, Random, 95% CI) | 1.89 [1.00, 3.58] |
| 7.20 glucose related | 1 | 355 | Risk Ratio (M‐H, Random, 95% CI) | 1.11 [0.58, 2.10] |
| 8 Adverse events: 2. Specific 12. Mean (SD) weight increase in kg Show forest plot | 1 | Mean Difference (IV, Random, 95% CI) | Subtotals only | |
| Analysis 5.8  Comparison 5 RISPERIDONE DEPOT vs ORAL ARIPIPRAZOLE, Outcome 8 Adverse events: 2. Specific 12. Mean (SD) weight increase in kg. | ||||
| 8.1 long term | 1 | 355 | Mean Difference (IV, Random, 95% CI) | 1.0 [‐0.42, 2.42] |
| 9 Adverse events: 3. Movement disorder Show forest plot | 2 | Risk Ratio (M‐H, Random, 95% CI) | Subtotals only | |
| Analysis 5.9  Comparison 5 RISPERIDONE DEPOT vs ORAL ARIPIPRAZOLE, Outcome 9 Adverse events: 3. Movement disorder. | ||||
| 9.1 any extra pyramidal symptoms | 2 | 729 | Risk Ratio (M‐H, Random, 95% CI) | 1.19 [0.91, 1.55] |
| 9.2 tremor | 1 | 355 | Risk Ratio (M‐H, Random, 95% CI) | 0.96 [0.65, 1.41] |
| 9.3 akathisia | 1 | 355 | Risk Ratio (M‐H, Random, 95% CI) | 0.98 [0.55, 1.76] |
| Outcome or subgroup title | No. of studies | No. of participants | Statistical method | Effect size |
| 1 Mental state: 1. Average change scores (PANNS, high score = worse) Show forest plot | 1 | Mean Difference (IV, Random, 95% CI) | Subtotals only | |
| Analysis 6.1 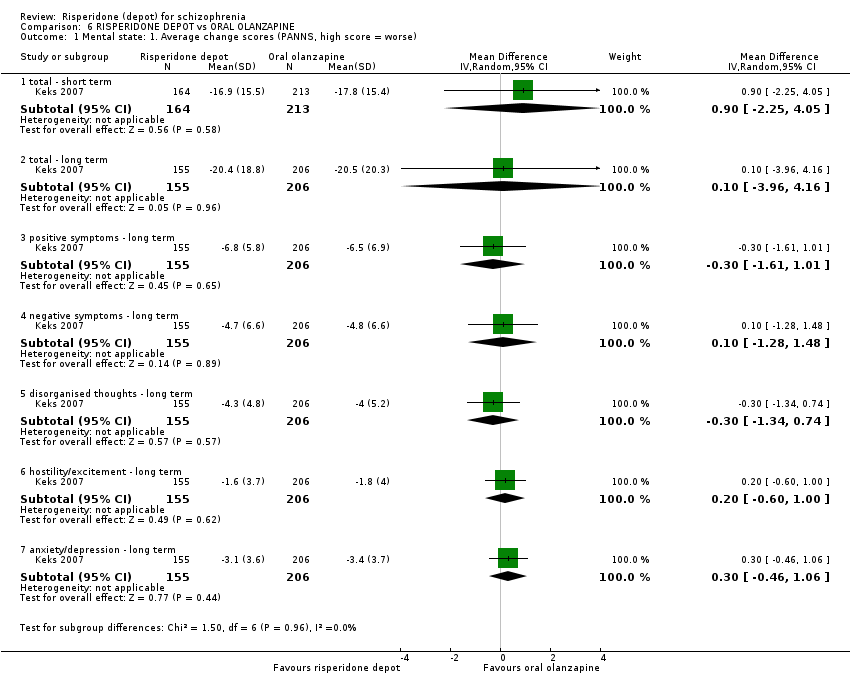 Comparison 6 RISPERIDONE DEPOT vs ORAL OLANZAPINE, Outcome 1 Mental state: 1. Average change scores (PANNS, high score = worse). | ||||
| 1.1 total ‐ short term | 1 | 377 | Mean Difference (IV, Random, 95% CI) | 0.90 [‐2.25, 4.05] |
| 1.2 total ‐ long term | 1 | 361 | Mean Difference (IV, Random, 95% CI) | 0.10 [‐3.96, 4.16] |
| 1.3 positive symptoms ‐ long term | 1 | 361 | Mean Difference (IV, Random, 95% CI) | ‐0.30 [‐1.61, 1.01] |
| 1.4 negative symptoms ‐ long term | 1 | 361 | Mean Difference (IV, Random, 95% CI) | 0.10 [‐1.28, 1.48] |
| 1.5 disorganised thoughts ‐ long term | 1 | 361 | Mean Difference (IV, Random, 95% CI) | ‐0.30 [‐1.34, 0.74] |
| 1.6 hostility/excitement ‐ long term | 1 | 361 | Mean Difference (IV, Random, 95% CI) | 0.20 [‐0.60, 1.00] |
| 1.7 anxiety/depression ‐ long term | 1 | 361 | Mean Difference (IV, Random, 95% CI) | 0.30 [‐0.46, 1.06] |
| 2 Leaving the study early: 1. Any reason Show forest plot | 1 | Risk Ratio (M‐H, Random, 95% CI) | Subtotals only | |
| Analysis 6.2  Comparison 6 RISPERIDONE DEPOT vs ORAL OLANZAPINE, Outcome 2 Leaving the study early: 1. Any reason. | ||||
| 2.1 long term | 1 | 618 | Risk Ratio (M‐H, Random, 95% CI) | 1.32 [1.10, 1.58] |
| 3 Leaving the study early: 2. Specific Show forest plot | 1 | Risk Ratio (M‐H, Random, 95% CI) | Subtotals only | |
| Analysis 6.3  Comparison 6 RISPERIDONE DEPOT vs ORAL OLANZAPINE, Outcome 3 Leaving the study early: 2. Specific. | ||||
| 3.1 adverse events | 1 | 547 | Risk Ratio (M‐H, Random, 95% CI) | 0.71 [0.28, 1.77] |
| 3.2 insufficient response | 1 | 547 | Risk Ratio (M‐H, Random, 95% CI) | 0.81 [0.49, 1.35] |
| 3.3 withdrawn consent | 1 | 547 | Risk Ratio (M‐H, Random, 95% CI) | 2.54 [1.56, 4.16] |
| 3.4 due to weight gain | 1 | 547 | Risk Ratio (M‐H, Random, 95% CI) | 0.24 [0.03, 2.07] |
| 4 Adverse events: 1. General Show forest plot | 1 | Risk Ratio (M‐H, Random, 95% CI) | Subtotals only | |
| Analysis 6.4  Comparison 6 RISPERIDONE DEPOT vs ORAL OLANZAPINE, Outcome 4 Adverse events: 1. General. | ||||
| 4.1 serious | 1 | 547 | Risk Ratio (M‐H, Random, 95% CI) | 1.10 [0.80, 1.51] |
| 4.2 death | 1 | 618 | Risk Ratio (M‐H, Random, 95% CI) | 0.31 [0.06, 1.55] |
| 5 Adverse events: 2. Specific Show forest plot | 1 | Risk Ratio (M‐H, Random, 95% CI) | Subtotals only | |
| Analysis 6.5  Comparison 6 RISPERIDONE DEPOT vs ORAL OLANZAPINE, Outcome 5 Adverse events: 2. Specific. | ||||
| 5.1 agitation | 1 | 532 | Risk Ratio (M‐H, Random, 95% CI) | 1.98 [1.06, 3.68] |
| 5.2 anxiety | 1 | 532 | Risk Ratio (M‐H, Random, 95% CI) | 0.87 [0.58, 1.31] |
| 5.3 depression | 1 | 532 | Risk Ratio (M‐H, Random, 95% CI) | 1.45 [0.99, 2.12] |
| 5.4 psychosis | 1 | 532 | Risk Ratio (M‐H, Random, 95% CI) | 1.15 [0.87, 1.52] |
| 5.5 impotence/ejaculation failure | 1 | 547 | Risk Ratio (M‐H, Random, 95% CI) | 1.21 [0.17, 8.56] |
| 5.6 galactorrhoea | 1 | 547 | Risk Ratio (M‐H, Random, 95% CI) | 3.04 [0.59, 15.52] |
| 5.7 serious psychiatric symptoms | 1 | 547 | Risk Ratio (M‐H, Random, 95% CI) | 1.01 [0.64, 1.59] |
| 5.8 serious anxiety | 1 | 547 | Risk Ratio (M‐H, Random, 95% CI) | 1.42 [0.48, 4.16] |
| 5.9 suicide attempt | 1 | 547 | Risk Ratio (M‐H, Random, 95% CI) | 1.35 [0.56, 3.27] |
| 5.10 serious injury | 1 | 547 | Risk Ratio (M‐H, Random, 95% CI) | 2.02 [0.49, 8.39] |
| 5.11 weight increase | 1 | 547 | Risk Ratio (M‐H, Random, 95% CI) | 0.56 [0.42, 0.75] |
| 5.12 headache | 1 | 532 | Risk Ratio (M‐H, Random, 95% CI) | 1.56 [0.81, 3.01] |
| 5.13 insomnia | 1 | 532 | Risk Ratio (M‐H, Random, 95% CI) | 4.59 [2.61, 8.07] |
| 5.14 fatigue/somnolence | 1 | 532 | Risk Ratio (M‐H, Random, 95% CI) | 0.71 [0.35, 1.41] |
| 5.15 nasopharyngitis | 1 | 532 | Risk Ratio (M‐H, Random, 95% CI) | 1.17 [0.61, 2.21] |
| 5.16 diabetes mellitus | 1 | 547 | Risk Ratio (M‐H, Random, 95% CI) | 1.21 [0.08, 19.32] |
| 5.17 hyperglycaemia | 1 | 494 | Risk Ratio (M‐H, Random, 95% CI) | 1.0 [0.25, 3.95] |
| 5.18 hypoglycaemia | 1 | 547 | Risk Ratio (M‐H, Random, 95% CI) | 0.40 [0.02, 9.89] |
| 6 Adverse events: 3. Movement disorder Show forest plot | 1 | Risk Ratio (M‐H, Random, 95% CI) | Subtotals only | |
| Analysis 6.6 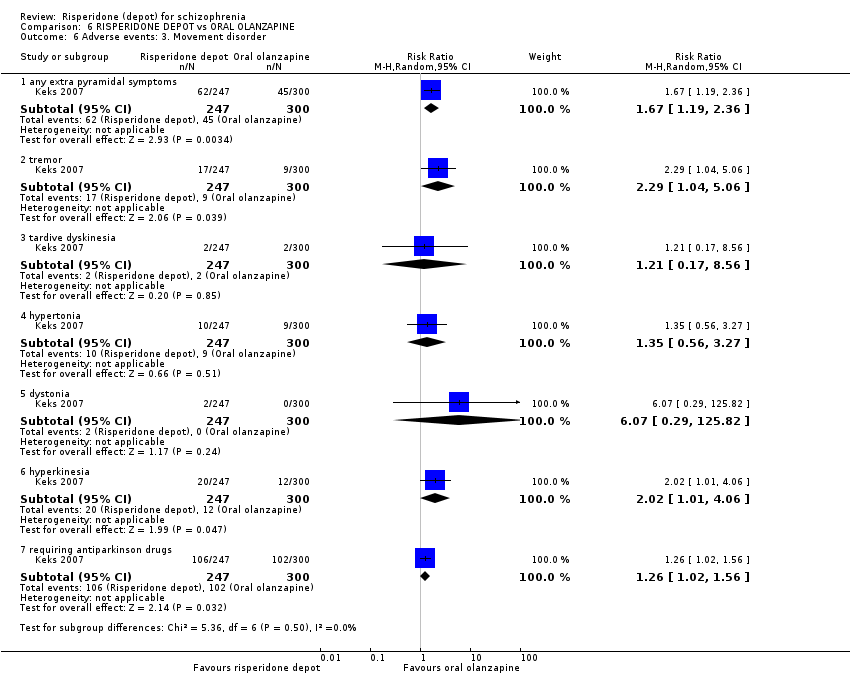 Comparison 6 RISPERIDONE DEPOT vs ORAL OLANZAPINE, Outcome 6 Adverse events: 3. Movement disorder. | ||||
| 6.1 any extra pyramidal symptoms | 1 | 547 | Risk Ratio (M‐H, Random, 95% CI) | 1.67 [1.19, 2.36] |
| 6.2 tremor | 1 | 547 | Risk Ratio (M‐H, Random, 95% CI) | 2.29 [1.04, 5.06] |
| 6.3 tardive dyskinesia | 1 | 547 | Risk Ratio (M‐H, Random, 95% CI) | 1.21 [0.17, 8.56] |
| 6.4 hypertonia | 1 | 547 | Risk Ratio (M‐H, Random, 95% CI) | 1.35 [0.56, 3.27] |
| 6.5 dystonia | 1 | 547 | Risk Ratio (M‐H, Random, 95% CI) | 6.07 [0.29, 125.82] |
| 6.6 hyperkinesia | 1 | 547 | Risk Ratio (M‐H, Random, 95% CI) | 2.02 [1.01, 4.06] |
| 6.7 requiring antiparkinson drugs | 1 | 547 | Risk Ratio (M‐H, Random, 95% CI) | 1.26 [1.02, 1.56] |
| Outcome or subgroup title | No. of studies | No. of participants | Statistical method | Effect size |
| 1 Global state: 1. Relapse (any reason) Show forest plot | 2 | Risk Ratio (M‐H, Random, 95% CI) | Subtotals only | |
| Analysis 7.1  Comparison 7 RISPERIDONE DEPOT vs ALL ORAL ANTIPSYCHOTICS (PRIMARY OUTCOMES), Outcome 1 Global state: 1. Relapse (any reason). | ||||
| 1.1 vs aripiprazole ‐ long term | 1 | 349 | Risk Ratio (M‐H, Random, 95% CI) | 1.05 [0.83, 1.33] |
| 1.2 vs general oral antipsychotics ‐ long term | 1 | 63 | Risk Ratio (M‐H, Random, 95% CI) | 2.13 [0.84, 5.43] |
| 2 Mental state: 1. Average change scores (PANSS, high score = worse) 1. total Show forest plot | 4 | Mean Difference (IV, Random, 95% CI) | Subtotals only | |
| Analysis 7.2  Comparison 7 RISPERIDONE DEPOT vs ALL ORAL ANTIPSYCHOTICS (PRIMARY OUTCOMES), Outcome 2 Mental state: 1. Average change scores (PANSS, high score = worse) 1. total. | ||||
| 2.1 vs oral risperidone (non ITT data) ‐ short term | 2 | 591 | Mean Difference (IV, Random, 95% CI) | 1.05 [‐0.77, 2.88] |
| 2.2 vs olanzapine ‐ short term | 1 | 377 | Mean Difference (IV, Random, 95% CI) | 0.90 [‐2.25, 4.05] |
| 2.3 vs olanzapine ‐ long term | 1 | 361 | Mean Difference (IV, Random, 95% CI) | 0.10 [‐3.96, 4.16] |
| 2.4 vs aripiprazole ‐ long term | 1 | 349 | Mean Difference (IV, Random, 95% CI) | ‐0.10 [‐3.15, 2.95] |
| 3 Leaving the study early: 1. Any reason Show forest plot | 7 | Risk Ratio (M‐H, Random, 95% CI) | Subtotals only | |
| Analysis 7.3  Comparison 7 RISPERIDONE DEPOT vs ALL ORAL ANTIPSYCHOTICS (PRIMARY OUTCOMES), Outcome 3 Leaving the study early: 1. Any reason. | ||||
| 3.1 vs aripiprazole | 2 | 723 | Risk Ratio (M‐H, Random, 95% CI) | 0.83 [0.53, 1.30] |
| 3.2 vs quetiapine | 1 | 666 | Risk Ratio (M‐H, Random, 95% CI) | 0.84 [0.74, 0.95] |
| 3.3 vs oral risperidone | 2 | 690 | Risk Ratio (M‐H, Random, 95% CI) | 1.28 [0.92, 1.79] |
| 3.4 vs any new generation antipsychotic | 1 | 77 | Risk Ratio (M‐H, Random, 95% CI) | 0.72 [0.55, 0.95] |
| 3.5 vs olanzapine | 1 | 618 | Risk Ratio (M‐H, Random, 95% CI) | 1.32 [1.10, 1.58] |
| 3.6 vs any oral antipsychotic | 1 | 382 | Risk Ratio (M‐H, Random, 95% CI) | 1.25 [0.93, 1.68] |
| 4 Adverse events: 1. Death Show forest plot | 5 | Risk Ratio (M‐H, Random, 95% CI) | Subtotals only | |
| Analysis 7.4  Comparison 7 RISPERIDONE DEPOT vs ALL ORAL ANTIPSYCHOTICS (PRIMARY OUTCOMES), Outcome 4 Adverse events: 1. Death. | ||||
| 4.1 vs olanzapine | 1 | 618 | Risk Ratio (M‐H, Random, 95% CI) | 0.31 [0.06, 1.55] |
| 4.2 vs oral risperidone | 1 | 640 | Risk Ratio (M‐H, Random, 95% CI) | 0.34 [0.01, 8.20] |
| 4.3 vs any oral antipsychotic | 1 | 382 | Risk Ratio (M‐H, Random, 95% CI) | 1.01 [0.14, 7.10] |
| 4.4 vs aripiprazole | 2 | 729 | Risk Ratio (M‐H, Random, 95% CI) | 0.98 [0.13, 7.36] |
| 4.5 vs quetiapine | 1 | 666 | Risk Ratio (M‐H, Random, 95% CI) | 1.54 [0.26, 9.14] |
| 5 Adverse events: 1. General: a. any Show forest plot | 3 | Risk Ratio (M‐H, Random, 95% CI) | Subtotals only | |
| Analysis 7.5  Comparison 7 RISPERIDONE DEPOT vs ALL ORAL ANTIPSYCHOTICS (PRIMARY OUTCOMES), Outcome 5 Adverse events: 1. General: a. any. | ||||
| 5.1 vs aripiprazole | 2 | 729 | Risk Ratio (M‐H, Random, 95% CI) | 0.99 [0.87, 1.14] |
| 5.2 vs oral risperidone | 1 | 640 | Risk Ratio (M‐H, Random, 95% CI) | 1.04 [0.91, 1.18] |
| 5.3 vs quetiapine | 1 | 666 | Risk Ratio (M‐H, Random, 95% CI) | 0.98 [0.89, 1.09] |
| 6 Adverse events: 1. General: b. serious Show forest plot | 3 | Risk Ratio (M‐H, Random, 95% CI) | Subtotals only | |
| Analysis 7.6  Comparison 7 RISPERIDONE DEPOT vs ALL ORAL ANTIPSYCHOTICS (PRIMARY OUTCOMES), Outcome 6 Adverse events: 1. General: b. serious. | ||||
| 6.1 vs quetiapine | 1 | 666 | Risk Ratio (M‐H, Random, 95% CI) | 0.84 [0.62, 1.13] |
| 6.2 vs aripiprazole | 2 | 729 | Risk Ratio (M‐H, Random, 95% CI) | 0.96 [0.66, 1.39] |
| 6.3 vs olanzapine | 1 | 547 | Risk Ratio (M‐H, Random, 95% CI) | 1.10 [0.80, 1.51] |
| 7 Adverse events: 2. Movement disorder: a. any extra pyramidal symptoms Show forest plot | 4 | Risk Ratio (M‐H, Random, 95% CI) | Subtotals only | |
| Analysis 7.7  Comparison 7 RISPERIDONE DEPOT vs ALL ORAL ANTIPSYCHOTICS (PRIMARY OUTCOMES), Outcome 7 Adverse events: 2. Movement disorder: a. any extra pyramidal symptoms. | ||||
| 7.1 vs aripiprazole | 2 | 729 | Risk Ratio (M‐H, Random, 95% CI) | 1.19 [0.91, 1.55] |
| 7.2 vs quetiapine | 1 | 666 | Risk Ratio (M‐H, Random, 95% CI) | 1.83 [1.07, 3.15] |
| 7.3 vs olanzapine | 1 | 547 | Risk Ratio (M‐H, Random, 95% CI) | 1.67 [1.19, 2.36] |
| 7.4 vs oral risperidone | 1 | 640 | Risk Ratio (M‐H, Random, 95% CI) | 1.05 [0.59, 1.88] |
| Outcome or subgroup title | No. of studies | No. of participants | Statistical method | Effect size |
| 1 Global State: 1. CGI‐S mean change from baseline (high score = worse) Show forest plot | 2 | 1326 | Mean Difference (IV, Random, 95% CI) | ‐0.07 [‐0.26, 0.11] |
| Analysis 8.1  Comparison 8 RISPERIDONE DEPOT vs ATYPICAL DEPOT ANTIPSYCHOTICS (PALIPERIDONE PALMITATE), Outcome 1 Global State: 1. CGI‐S mean change from baseline (high score = worse). | ||||
| 1.1 medium term | 2 | 1326 | Mean Difference (IV, Random, 95% CI) | ‐0.07 [‐0.26, 0.11] |
| 2 Global state: 2. Schedule for Deficit Syndrome (SDS) scale (mean change from baseline, high score = worse) Show forest plot | 1 | Mean Difference (IV, Random, 95% CI) | Subtotals only | |
| Analysis 8.2  Comparison 8 RISPERIDONE DEPOT vs ATYPICAL DEPOT ANTIPSYCHOTICS (PALIPERIDONE PALMITATE), Outcome 2 Global state: 2. Schedule for Deficit Syndrome (SDS) scale (mean change from baseline, high score = worse). | ||||
| 2.1 medium term | 1 | 913 | Mean Difference (IV, Random, 95% CI) | 0.10 [‐0.29, 0.49] |
| 3 Mental state: 1. PANSS scores (high score = worse) ‐ medium term Show forest plot | 2 | Mean Difference (IV, Random, 95% CI) | Subtotals only | |
| Analysis 8.3  Comparison 8 RISPERIDONE DEPOT vs ATYPICAL DEPOT ANTIPSYCHOTICS (PALIPERIDONE PALMITATE), Outcome 3 Mental state: 1. PANSS scores (high score = worse) ‐ medium term. | ||||
| 3.1 total mean change to endpoint (ITT and per protocol data)* | 2 | 1326 | Mean Difference (IV, Random, 95% CI) | 1.12 [‐2.79, 5.02] |
| 3.2 positive symptoms score change to endpoint | 2 | 1326 | Mean Difference (IV, Random, 95% CI) | 0.66 [‐1.39, 2.71] |
| 3.3 negative symptoms score change to endpoint (ITT data) | 2 | 1326 | Mean Difference (IV, Random, 95% CI) | 0.06 [‐0.47, 0.59] |
| 3.4 disorganised thoughts score change to endpoint (ITT data) | 2 | 1326 | Mean Difference (IV, Random, 95% CI) | 0.02 [‐0.55, 0.59] |
| 3.5 uncontrolled hostility/excitement score change to endpoint (ITT data) | 2 | 1326 | Mean Difference (IV, Random, 95% CI) | ‐0.04 [‐0.50, 0.41] |
| 3.6 anxiety/depression score change to endpoint (ITT data) | 2 | 1326 | Mean Difference (IV, Random, 95% CI) | 0.01 [‐0.67, 0.69] |
| 4 Mental state: 2. Improved by 30% in total PANSS score (ITT data) Show forest plot | 2 | Risk Ratio (M‐H, Random, 95% CI) | Subtotals only | |
| Analysis 8.4 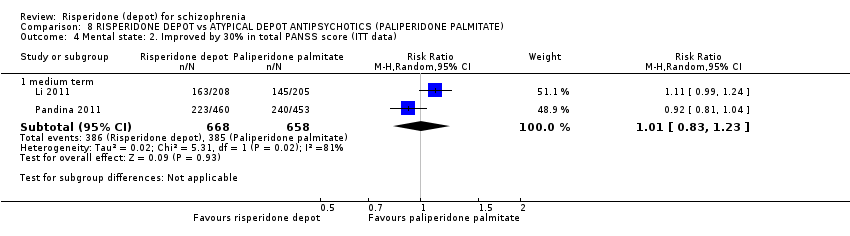 Comparison 8 RISPERIDONE DEPOT vs ATYPICAL DEPOT ANTIPSYCHOTICS (PALIPERIDONE PALMITATE), Outcome 4 Mental state: 2. Improved by 30% in total PANSS score (ITT data). | ||||
| 4.1 medium term | 2 | 1326 | Risk Ratio (M‐H, Random, 95% CI) | 1.01 [0.83, 1.23] |
| 5 General functioning: Personal and Social Performance (PSP) scale (high score = better) Show forest plot | 2 | 1326 | Mean Difference (IV, Random, 95% CI) | 0.65 [‐0.69, 1.98] |
| Analysis 8.5  Comparison 8 RISPERIDONE DEPOT vs ATYPICAL DEPOT ANTIPSYCHOTICS (PALIPERIDONE PALMITATE), Outcome 5 General functioning: Personal and Social Performance (PSP) scale (high score = better). | ||||
| 5.1 mean endpoint ‐ medium term | 2 | 1326 | Mean Difference (IV, Random, 95% CI) | 0.65 [‐0.69, 1.98] |
| 6 Leaving the study early: 1. Any reason Show forest plot | 3 | Risk Ratio (M‐H, Random, 95% CI) | Subtotals only | |
| Analysis 8.6  Comparison 8 RISPERIDONE DEPOT vs ATYPICAL DEPOT ANTIPSYCHOTICS (PALIPERIDONE PALMITATE), Outcome 6 Leaving the study early: 1. Any reason. | ||||
| 6.1 Lack of efficacy ‐ medium term | 2 | 1672 | Risk Ratio (M‐H, Random, 95% CI) | 0.71 [0.29, 1.75] |
| 6.2 Lack of efficacy ‐ long term | 1 | 749 | Risk Ratio (M‐H, Random, 95% CI) | 0.60 [0.45, 0.81] |
| 6.3 Adverse events ‐ medium term | 2 | 1672 | Risk Ratio (M‐H, Random, 95% CI) | 0.68 [0.28, 1.65] |
| 6.4 Adverse events ‐ long term | 1 | 749 | Risk Ratio (M‐H, Random, 95% CI) | 0.88 [0.53, 1.48] |
| 6.5 Patient choice/withdrawn consent ‐ medium term | 2 | 1672 | Risk Ratio (M‐H, Random, 95% CI) | 0.61 [0.22, 1.71] |
| 6.6 Patient choice/withdrawn consent ‐ long term | 1 | 749 | Risk Ratio (M‐H, Random, 95% CI) | 1.15 [0.83, 1.61] |
| 6.7 Lost to follow‐up ‐ medium term | 2 | 1672 | Risk Ratio (M‐H, Random, 95% CI) | 1.61 [0.93, 2.79] |
| 6.8 Lost to follow‐up ‐ long term | 1 | 749 | Risk Ratio (M‐H, Random, 95% CI) | 0.87 [0.39, 1.91] |
| 6.9 Pregnancy ‐ medium term | 2 | 1672 | Risk Ratio (M‐H, Random, 95% CI) | 0.26 [0.03, 2.32] |
| 6.10 Pregnancy ‐ long term | 1 | 749 | Risk Ratio (M‐H, Random, 95% CI) | 1.02 [0.06, 16.32] |
| 6.11 Death ‐ long term | 1 | 749 | Risk Ratio (M‐H, Random, 95% CI) | 0.20 [0.01, 4.25] |
| 6.12 Other ‐ medium term | 2 | 1672 | Risk Ratio (M‐H, Random, 95% CI) | 0.77 [0.45, 1.32] |
| 6.13 Other ‐ long term | 1 | 749 | Risk Ratio (M‐H, Random, 95% CI) | 1.09 [0.67, 1.78] |
| 6.14 Any reason ‐ medium term | 2 | 1672 | Risk Ratio (M‐H, Random, 95% CI) | 0.77 [0.51, 1.17] |
| 6.15 Any reason ‐ long term | 1 | 749 | Risk Ratio (M‐H, Random, 95% CI) | 0.85 [0.75, 0.97] |
| 7 Adverse events: 1. General Show forest plot | 3 | Risk Ratio (M‐H, Random, 95% CI) | Subtotals only | |
| Analysis 8.7 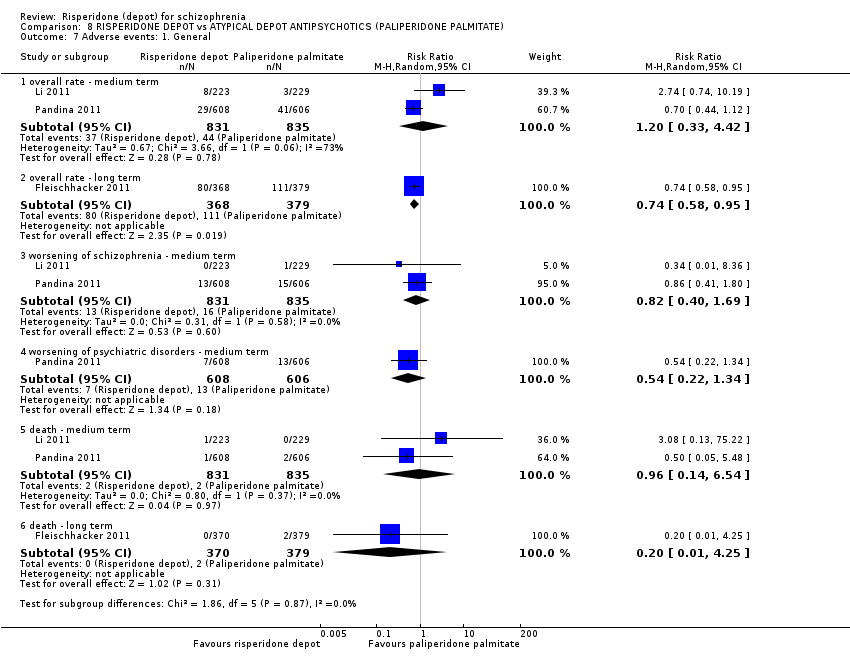 Comparison 8 RISPERIDONE DEPOT vs ATYPICAL DEPOT ANTIPSYCHOTICS (PALIPERIDONE PALMITATE), Outcome 7 Adverse events: 1. General. | ||||
| 7.1 overall rate ‐ medium term | 2 | 1666 | Risk Ratio (M‐H, Random, 95% CI) | 1.20 [0.33, 4.42] |
| 7.2 overall rate ‐ long term | 1 | 747 | Risk Ratio (M‐H, Random, 95% CI) | 0.74 [0.58, 0.95] |
| 7.3 worsening of schizophrenia ‐ medium term | 2 | 1666 | Risk Ratio (M‐H, Random, 95% CI) | 0.82 [0.40, 1.69] |
| 7.4 worsening of psychiatric disorders ‐ medium term | 1 | 1214 | Risk Ratio (M‐H, Random, 95% CI) | 0.54 [0.22, 1.34] |
| 7.5 death ‐ medium term | 2 | 1666 | Risk Ratio (M‐H, Random, 95% CI) | 0.96 [0.14, 6.54] |
| 7.6 death ‐ long term | 1 | 749 | Risk Ratio (M‐H, Random, 95% CI) | 0.20 [0.01, 4.25] |
| 8 Adverse events: 2. Specific Show forest plot | 3 | Risk Ratio (M‐H, Random, 95% CI) | Subtotals only | |
| Analysis 8.8 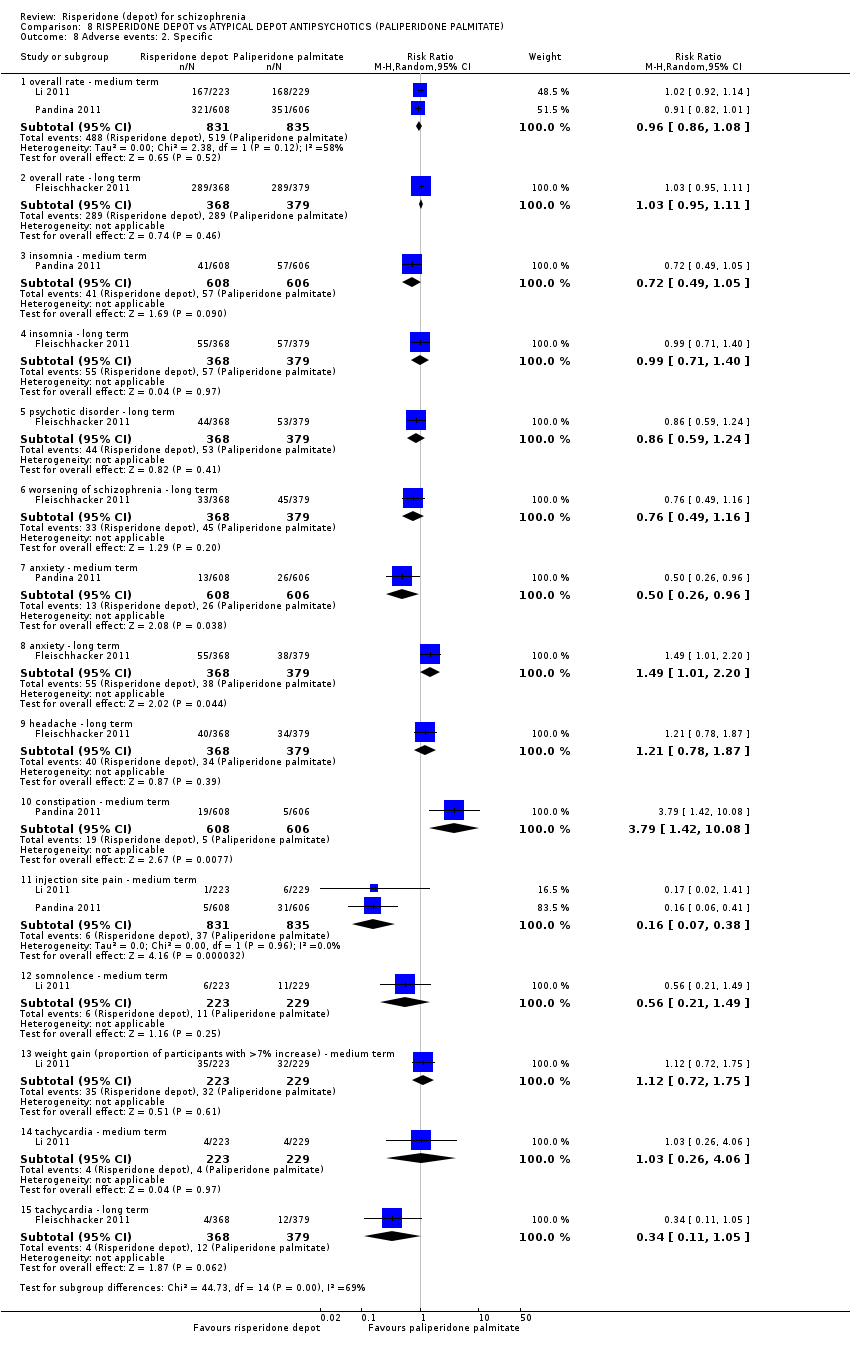 Comparison 8 RISPERIDONE DEPOT vs ATYPICAL DEPOT ANTIPSYCHOTICS (PALIPERIDONE PALMITATE), Outcome 8 Adverse events: 2. Specific. | ||||
| 8.1 overall rate ‐ medium term | 2 | 1666 | Risk Ratio (M‐H, Random, 95% CI) | 0.96 [0.86, 1.08] |
| 8.2 overall rate ‐ long term | 1 | 747 | Risk Ratio (M‐H, Random, 95% CI) | 1.03 [0.95, 1.11] |
| 8.3 insomnia ‐ medium term | 1 | 1214 | Risk Ratio (M‐H, Random, 95% CI) | 0.72 [0.49, 1.05] |
| 8.4 insomnia ‐ long term | 1 | 747 | Risk Ratio (M‐H, Random, 95% CI) | 0.99 [0.71, 1.40] |
| 8.5 psychotic disorder ‐ long term | 1 | 747 | Risk Ratio (M‐H, Random, 95% CI) | 0.86 [0.59, 1.24] |
| 8.6 worsening of schizophrenia ‐ long term | 1 | 747 | Risk Ratio (M‐H, Random, 95% CI) | 0.76 [0.49, 1.16] |
| 8.7 anxiety ‐ medium term | 1 | 1214 | Risk Ratio (M‐H, Random, 95% CI) | 0.50 [0.26, 0.96] |
| 8.8 anxiety ‐ long term | 1 | 747 | Risk Ratio (M‐H, Random, 95% CI) | 1.49 [1.01, 2.20] |
| 8.9 headache ‐ long term | 1 | 747 | Risk Ratio (M‐H, Random, 95% CI) | 1.21 [0.78, 1.87] |
| 8.10 constipation ‐ medium term | 1 | 1214 | Risk Ratio (M‐H, Random, 95% CI) | 3.79 [1.42, 10.08] |
| 8.11 injection site pain ‐ medium term | 2 | 1666 | Risk Ratio (M‐H, Random, 95% CI) | 0.16 [0.07, 0.38] |
| 8.12 somnolence ‐ medium term | 1 | 452 | Risk Ratio (M‐H, Random, 95% CI) | 0.56 [0.21, 1.49] |
| 8.13 weight gain (proportion of participants with >7% increase) ‐ medium term | 1 | 452 | Risk Ratio (M‐H, Random, 95% CI) | 1.12 [0.72, 1.75] |
| 8.14 tachycardia ‐ medium term | 1 | 452 | Risk Ratio (M‐H, Random, 95% CI) | 1.03 [0.26, 4.06] |
| 8.15 tachycardia ‐ long term | 1 | 747 | Risk Ratio (M‐H, Random, 95% CI) | 0.34 [0.11, 1.05] |
| 9 Adverse events: 3. Prolactin related Show forest plot | 3 | Risk Ratio (M‐H, Random, 95% CI) | Subtotals only | |
| Analysis 8.9 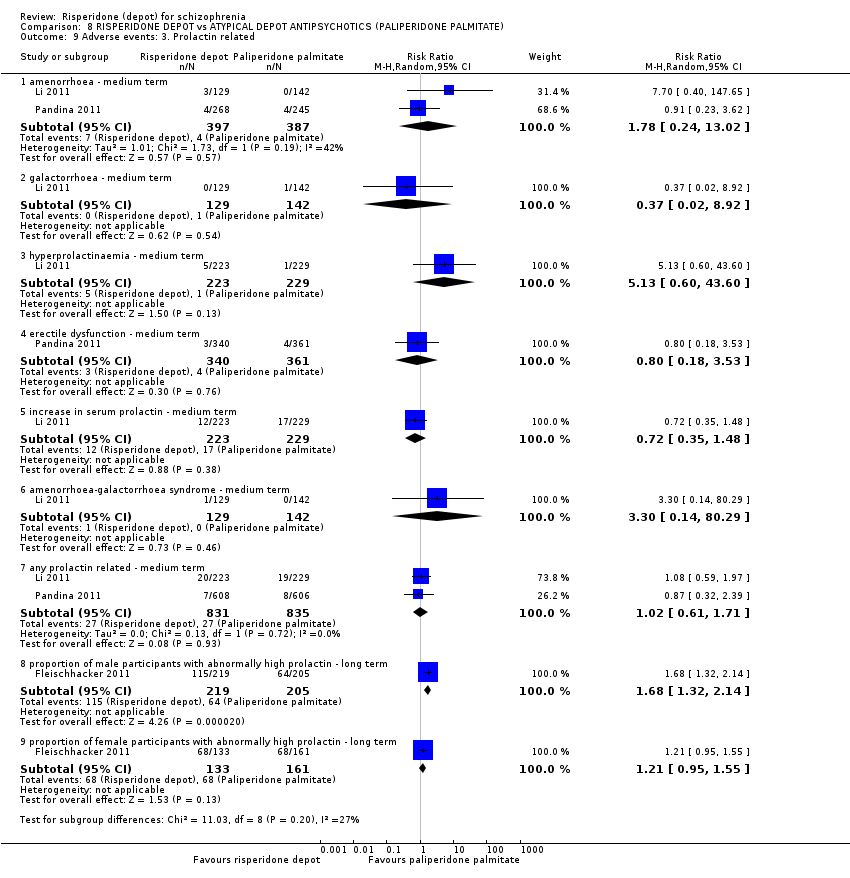 Comparison 8 RISPERIDONE DEPOT vs ATYPICAL DEPOT ANTIPSYCHOTICS (PALIPERIDONE PALMITATE), Outcome 9 Adverse events: 3. Prolactin related. | ||||
| 9.1 amenorrhoea ‐ medium term | 2 | 784 | Risk Ratio (M‐H, Random, 95% CI) | 1.78 [0.24, 13.02] |
| 9.2 galactorrhoea ‐ medium term | 1 | 271 | Risk Ratio (M‐H, Random, 95% CI) | 0.37 [0.02, 8.92] |
| 9.3 hyperprolactinaemia ‐ medium term | 1 | 452 | Risk Ratio (M‐H, Random, 95% CI) | 5.13 [0.60, 43.60] |
| 9.4 erectile dysfunction ‐ medium term | 1 | 701 | Risk Ratio (M‐H, Random, 95% CI) | 0.80 [0.18, 3.53] |
| 9.5 increase in serum prolactin ‐ medium term | 1 | 452 | Risk Ratio (M‐H, Random, 95% CI) | 0.72 [0.35, 1.48] |
| 9.6 amenorrhoea‐galactorrhoea syndrome ‐ medium term | 1 | 271 | Risk Ratio (M‐H, Random, 95% CI) | 3.3 [0.14, 80.29] |
| 9.7 any prolactin related ‐ medium term | 2 | 1666 | Risk Ratio (M‐H, Random, 95% CI) | 1.02 [0.61, 1.71] |
| 9.8 proportion of male participants with abnormally high prolactin ‐ long term | 1 | 424 | Risk Ratio (M‐H, Random, 95% CI) | 1.68 [1.32, 2.14] |
| 9.9 proportion of female participants with abnormally high prolactin ‐ long term | 1 | 294 | Risk Ratio (M‐H, Random, 95% CI) | 1.21 [0.95, 1.55] |
| 10 Adverse events: 4. Movement disorder Show forest plot | 3 | Risk Ratio (M‐H, Random, 95% CI) | Subtotals only | |
| Analysis 8.10  Comparison 8 RISPERIDONE DEPOT vs ATYPICAL DEPOT ANTIPSYCHOTICS (PALIPERIDONE PALMITATE), Outcome 10 Adverse events: 4. Movement disorder. | ||||
| 10.1 akathisia ‐ medium term | 1 | 452 | Risk Ratio (M‐H, Random, 95% CI) | 1.51 [0.98, 2.31] |
| 10.2 tremor ‐ medium term | 1 | 452 | Risk Ratio (M‐H, Random, 95% CI) | 1.71 [1.07, 2.74] |
| 10.3 tardive dyskinesia ‐ medium term | 1 | 1214 | Risk Ratio (M‐H, Random, 95% CI) | 1.00 [0.06, 15.90] |
| 10.4 requiring use of anti‐EPS medication ‐ medium term | 2 | 1666 | Risk Ratio (M‐H, Random, 95% CI) | 1.46 [1.18, 1.80] |
| 10.5 hyperkinesia ‐ long term | 1 | 747 | Risk Ratio (M‐H, Random, 95% CI) | 1.66 [1.00, 2.73] |
| 10.6 neuroleptic malignant syndrome ‐ long term | 1 | 747 | Risk Ratio (M‐H, Random, 95% CI) | 0.34 [0.01, 8.40] |
| 11 Adverse events: 5. Body weight (mean increase) Show forest plot | 3 | 2350 | Mean Difference (IV, Random, 95% CI) | 0.18 [‐0.36, 0.72] |
| Analysis 8.11  Comparison 8 RISPERIDONE DEPOT vs ATYPICAL DEPOT ANTIPSYCHOTICS (PALIPERIDONE PALMITATE), Outcome 11 Adverse events: 5. Body weight (mean increase). | ||||
| 11.1 medium term | 2 | 1666 | Mean Difference (IV, Random, 95% CI) | ‐0.07 [‐0.38, 0.24] |
| 11.2 long term | 1 | 684 | Mean Difference (IV, Random, 95% CI) | 1.0 [0.13, 1.87] |
| 12 Adverse events: 6. Mean prolactin level increase (ng/mL) Show forest plot | 2 | Mean Difference (IV, Random, 95% CI) | Subtotals only | |
| Analysis 8.12 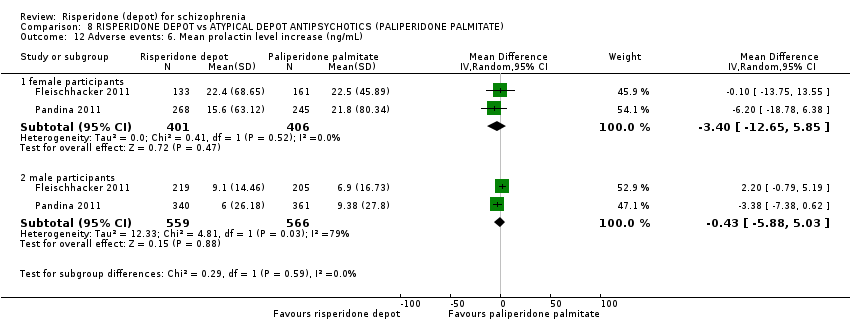 Comparison 8 RISPERIDONE DEPOT vs ATYPICAL DEPOT ANTIPSYCHOTICS (PALIPERIDONE PALMITATE), Outcome 12 Adverse events: 6. Mean prolactin level increase (ng/mL). | ||||
| 12.1 female participants | 2 | 807 | Mean Difference (IV, Random, 95% CI) | ‐3.40 [‐12.65, 5.85] |
| 12.2 male participants | 2 | 1125 | Mean Difference (IV, Random, 95% CI) | ‐0.43 [‐5.88, 5.03] |
| 13 Adverse events: 7. Glucose related Show forest plot | 3 | Risk Ratio (M‐H, Random, 95% CI) | Subtotals only | |
| Analysis 8.13 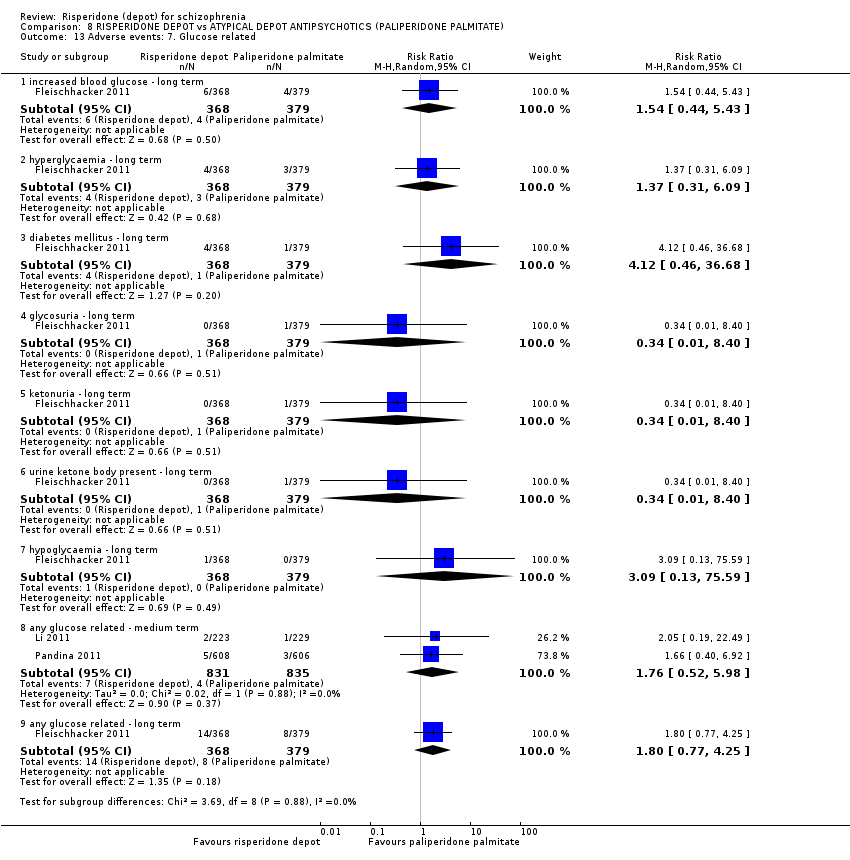 Comparison 8 RISPERIDONE DEPOT vs ATYPICAL DEPOT ANTIPSYCHOTICS (PALIPERIDONE PALMITATE), Outcome 13 Adverse events: 7. Glucose related. | ||||
| 13.1 increased blood glucose ‐ long term | 1 | 747 | Risk Ratio (M‐H, Random, 95% CI) | 1.54 [0.44, 5.43] |
| 13.2 hyperglycaemia ‐ long term | 1 | 747 | Risk Ratio (M‐H, Random, 95% CI) | 1.37 [0.31, 6.09] |
| 13.3 diabetes mellitus ‐ long term | 1 | 747 | Risk Ratio (M‐H, Random, 95% CI) | 4.12 [0.46, 36.68] |
| 13.4 glycosuria ‐ long term | 1 | 747 | Risk Ratio (M‐H, Random, 95% CI) | 0.34 [0.01, 8.40] |
| 13.5 ketonuria ‐ long term | 1 | 747 | Risk Ratio (M‐H, Random, 95% CI) | 0.34 [0.01, 8.40] |
| 13.6 urine ketone body present ‐ long term | 1 | 747 | Risk Ratio (M‐H, Random, 95% CI) | 0.34 [0.01, 8.40] |
| 13.7 hypoglycaemia ‐ long term | 1 | 747 | Risk Ratio (M‐H, Random, 95% CI) | 3.09 [0.13, 75.59] |
| 13.8 any glucose related ‐ medium term | 2 | 1666 | Risk Ratio (M‐H, Random, 95% CI) | 1.76 [0.52, 5.98] |
| 13.9 any glucose related ‐ long term | 1 | 747 | Risk Ratio (M‐H, Random, 95% CI) | 1.80 [0.77, 4.25] |
| 14 Adverse events: 8. Injection site pain (mean (sd) Visual Analogue Scale score (0‐100mm)) Show forest plot | 1 | Mean Difference (IV, Random, 95% CI) | Subtotals only | |
| Analysis 8.14 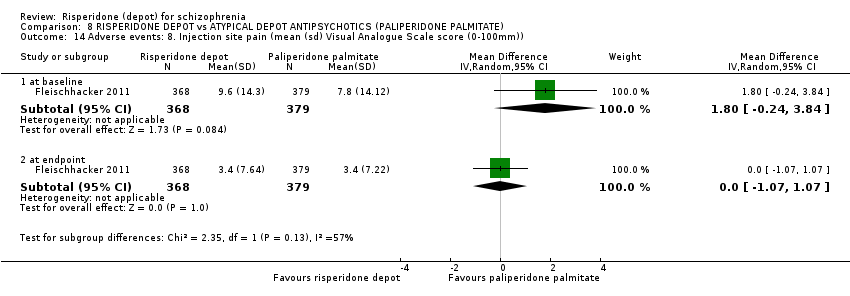 Comparison 8 RISPERIDONE DEPOT vs ATYPICAL DEPOT ANTIPSYCHOTICS (PALIPERIDONE PALMITATE), Outcome 14 Adverse events: 8. Injection site pain (mean (sd) Visual Analogue Scale score (0‐100mm)). | ||||
| 14.1 at baseline | 1 | 747 | Mean Difference (IV, Random, 95% CI) | 1.80 [‐0.24, 3.84] |
| 14.2 at endpoint | 1 | 747 | Mean Difference (IV, Random, 95% CI) | 0.0 [‐1.07, 1.07] |
| Outcome or subgroup title | No. of studies | No. of participants | Statistical method | Effect size | ||||||||||||||||||||||||||||||||||||||||||||||||||||||||||||||||||||||||||||||||||||||||||||||||||||
| 1 Mental state: 1. Total endpoint scores (PANNS, high score = worse) Show forest plot | 1 | Mean Difference (IV, Random, 95% CI) | Subtotals only | |||||||||||||||||||||||||||||||||||||||||||||||||||||||||||||||||||||||||||||||||||||||||||||||||||||
| Analysis 9.1 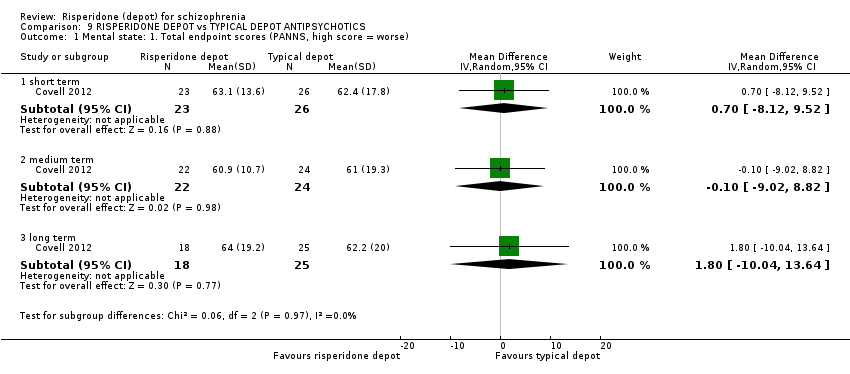 Comparison 9 RISPERIDONE DEPOT vs TYPICAL DEPOT ANTIPSYCHOTICS, Outcome 1 Mental state: 1. Total endpoint scores (PANNS, high score = worse). | ||||||||||||||||||||||||||||||||||||||||||||||||||||||||||||||||||||||||||||||||||||||||||||||||||||||||
| 1.1 short term | 1 | 49 | Mean Difference (IV, Random, 95% CI) | 0.70 [‐8.12, 9.52] | ||||||||||||||||||||||||||||||||||||||||||||||||||||||||||||||||||||||||||||||||||||||||||||||||||||
| 1.2 medium term | 1 | 46 | Mean Difference (IV, Random, 95% CI) | ‐0.10 [‐9.02, 8.82] | ||||||||||||||||||||||||||||||||||||||||||||||||||||||||||||||||||||||||||||||||||||||||||||||||||||
| 1.3 long term | 1 | 43 | Mean Difference (IV, Random, 95% CI) | 1.80 [‐10.04, 13.64] | ||||||||||||||||||||||||||||||||||||||||||||||||||||||||||||||||||||||||||||||||||||||||||||||||||||
| 2 Leaving the study early Show forest plot | 1 | Risk Ratio (M‐H, Random, 95% CI) | Subtotals only | |||||||||||||||||||||||||||||||||||||||||||||||||||||||||||||||||||||||||||||||||||||||||||||||||||||
| Analysis 9.2 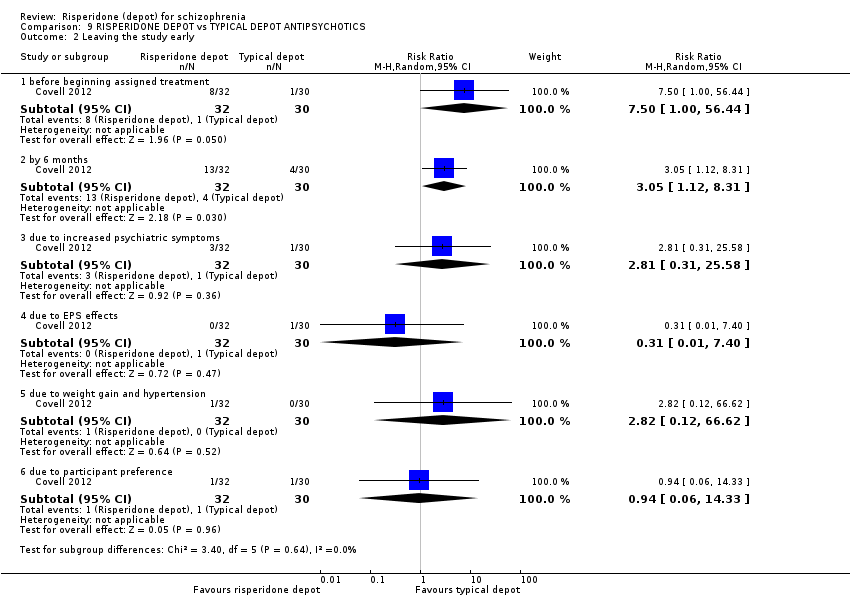 Comparison 9 RISPERIDONE DEPOT vs TYPICAL DEPOT ANTIPSYCHOTICS, Outcome 2 Leaving the study early. | ||||||||||||||||||||||||||||||||||||||||||||||||||||||||||||||||||||||||||||||||||||||||||||||||||||||||
| 2.1 before beginning assigned treatment | 1 | 62 | Risk Ratio (M‐H, Random, 95% CI) | 7.50 [1.00, 56.44] | ||||||||||||||||||||||||||||||||||||||||||||||||||||||||||||||||||||||||||||||||||||||||||||||||||||
| 2.2 by 6 months | 1 | 62 | Risk Ratio (M‐H, Random, 95% CI) | 3.05 [1.12, 8.31] | ||||||||||||||||||||||||||||||||||||||||||||||||||||||||||||||||||||||||||||||||||||||||||||||||||||
| 2.3 due to increased psychiatric symptoms | 1 | 62 | Risk Ratio (M‐H, Random, 95% CI) | 2.81 [0.31, 25.58] | ||||||||||||||||||||||||||||||||||||||||||||||||||||||||||||||||||||||||||||||||||||||||||||||||||||
| 2.4 due to EPS effects | 1 | 62 | Risk Ratio (M‐H, Random, 95% CI) | 0.31 [0.01, 7.40] | ||||||||||||||||||||||||||||||||||||||||||||||||||||||||||||||||||||||||||||||||||||||||||||||||||||
| 2.5 due to weight gain and hypertension | 1 | 62 | Risk Ratio (M‐H, Random, 95% CI) | 2.82 [0.12, 66.62] | ||||||||||||||||||||||||||||||||||||||||||||||||||||||||||||||||||||||||||||||||||||||||||||||||||||
| 2.6 due to participant preference | 1 | 62 | Risk Ratio (M‐H, Random, 95% CI) | 0.94 [0.06, 14.33] | ||||||||||||||||||||||||||||||||||||||||||||||||||||||||||||||||||||||||||||||||||||||||||||||||||||
| 3 Hospitalisation by 6 months Show forest plot | 1 | Risk Ratio (M‐H, Random, 95% CI) | Subtotals only | |||||||||||||||||||||||||||||||||||||||||||||||||||||||||||||||||||||||||||||||||||||||||||||||||||||
| Analysis 9.3 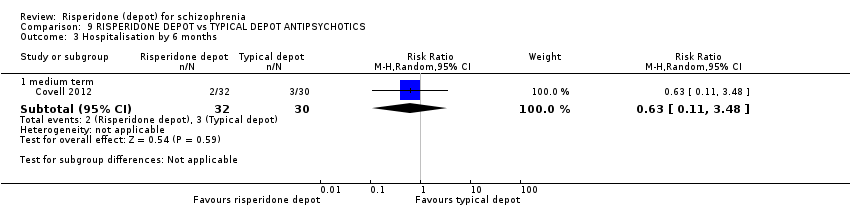 Comparison 9 RISPERIDONE DEPOT vs TYPICAL DEPOT ANTIPSYCHOTICS, Outcome 3 Hospitalisation by 6 months. | ||||||||||||||||||||||||||||||||||||||||||||||||||||||||||||||||||||||||||||||||||||||||||||||||||||||||
| 3.1 medium term | 1 | 62 | Risk Ratio (M‐H, Random, 95% CI) | 0.63 [0.11, 3.48] | ||||||||||||||||||||||||||||||||||||||||||||||||||||||||||||||||||||||||||||||||||||||||||||||||||||
| 4 Adverse events: 1. Continuous outcomes (skew) Show forest plot | Other data | No numeric data | ||||||||||||||||||||||||||||||||||||||||||||||||||||||||||||||||||||||||||||||||||||||||||||||||||||||
| Analysis 9.4
Comparison 9 RISPERIDONE DEPOT vs TYPICAL DEPOT ANTIPSYCHOTICS, Outcome 4 Adverse events: 1. Continuous outcomes (skew). | ||||||||||||||||||||||||||||||||||||||||||||||||||||||||||||||||||||||||||||||||||||||||||||||||||||||||
| 4.1 Change in BMI ‐ short term (skew) | Other data | No numeric data | ||||||||||||||||||||||||||||||||||||||||||||||||||||||||||||||||||||||||||||||||||||||||||||||||||||||
| 4.2 Change in BMI ‐ medium term (skew) | Other data | No numeric data | ||||||||||||||||||||||||||||||||||||||||||||||||||||||||||||||||||||||||||||||||||||||||||||||||||||||
| 4.3 Change in BMI ‐ long term (skew) | Other data | No numeric data | ||||||||||||||||||||||||||||||||||||||||||||||||||||||||||||||||||||||||||||||||||||||||||||||||||||||
| 4.4 Prolactin endpoint levels (ng/mL) ‐ short term (skew) | Other data | No numeric data | ||||||||||||||||||||||||||||||||||||||||||||||||||||||||||||||||||||||||||||||||||||||||||||||||||||||
| 4.5 Prolactin endpoint levels (ng/mL) ‐ medium term (skew) | Other data | No numeric data | ||||||||||||||||||||||||||||||||||||||||||||||||||||||||||||||||||||||||||||||||||||||||||||||||||||||
| 4.6 Prolactin endpoint levels (ng/mL) ‐ long term (skew) | Other data | No numeric data | ||||||||||||||||||||||||||||||||||||||||||||||||||||||||||||||||||||||||||||||||||||||||||||||||||||||
| 5 Adverse events: 2. Sexual experiencesm, total endpoint (ASEX, high score = worse) Show forest plot | 1 | Mean Difference (IV, Fixed, 95% CI) | Subtotals only | |||||||||||||||||||||||||||||||||||||||||||||||||||||||||||||||||||||||||||||||||||||||||||||||||||||
| Analysis 9.5  Comparison 9 RISPERIDONE DEPOT vs TYPICAL DEPOT ANTIPSYCHOTICS, Outcome 5 Adverse events: 2. Sexual experiencesm, total endpoint (ASEX, high score = worse). | ||||||||||||||||||||||||||||||||||||||||||||||||||||||||||||||||||||||||||||||||||||||||||||||||||||||||
| 5.1 short term | 1 | 44 | Mean Difference (IV, Fixed, 95% CI) | 1.70 [‐1.26, 4.66] | ||||||||||||||||||||||||||||||||||||||||||||||||||||||||||||||||||||||||||||||||||||||||||||||||||||
| 5.2 medium term | 1 | 41 | Mean Difference (IV, Fixed, 95% CI) | 1.30 [‐2.30, 4.90] | ||||||||||||||||||||||||||||||||||||||||||||||||||||||||||||||||||||||||||||||||||||||||||||||||||||
| 5.3 long term | 1 | 40 | Mean Difference (IV, Fixed, 95% CI) | ‐0.10 [‐4.08, 3.88] | ||||||||||||||||||||||||||||||||||||||||||||||||||||||||||||||||||||||||||||||||||||||||||||||||||||

Study flow diagram: 2010 and 2012, 2015 updated search


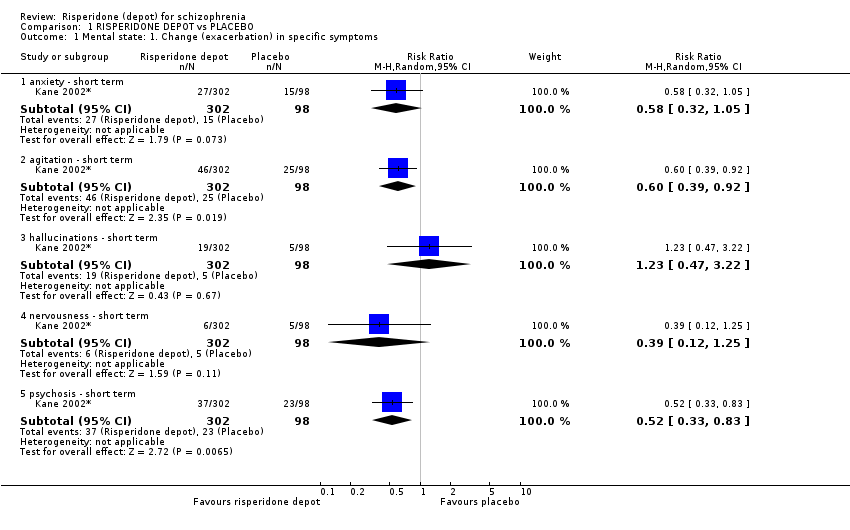
Comparison 1 RISPERIDONE DEPOT vs PLACEBO, Outcome 1 Mental state: 1. Change (exacerbation) in specific symptoms.
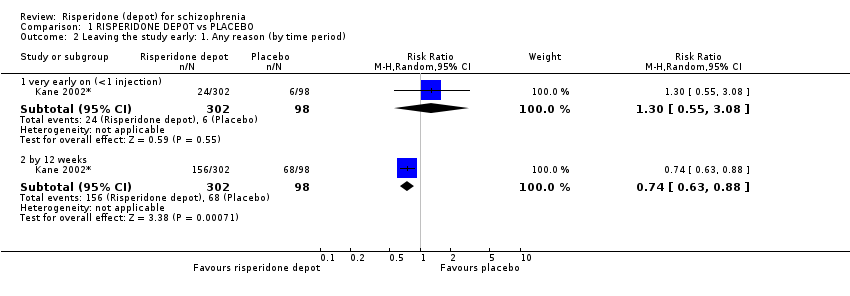
Comparison 1 RISPERIDONE DEPOT vs PLACEBO, Outcome 2 Leaving the study early: 1. Any reason (by time period).
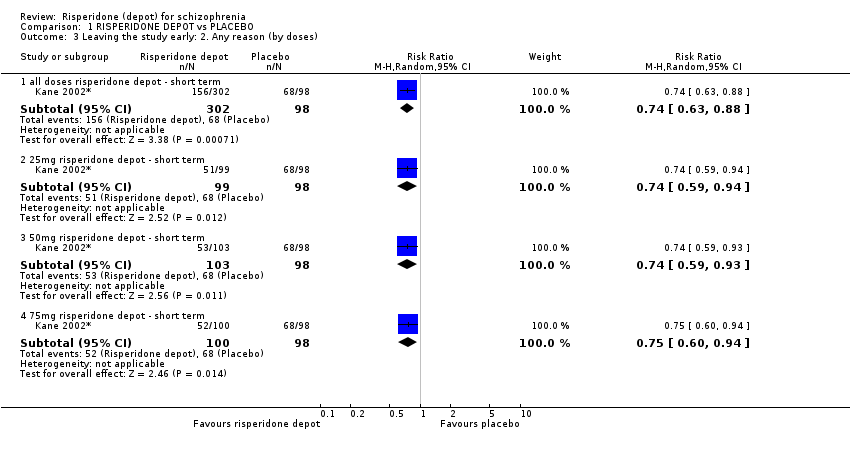
Comparison 1 RISPERIDONE DEPOT vs PLACEBO, Outcome 3 Leaving the study early: 2. Any reason (by doses).

Comparison 1 RISPERIDONE DEPOT vs PLACEBO, Outcome 4 Leaving the study early: 3. Because of insufficient response (by doses).
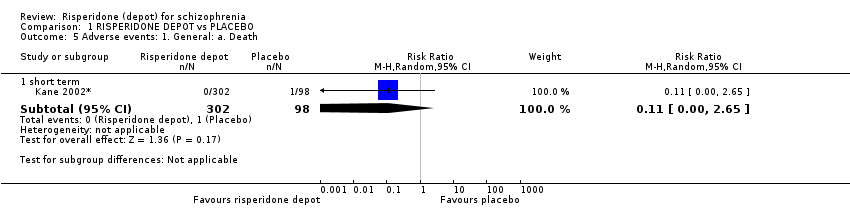
Comparison 1 RISPERIDONE DEPOT vs PLACEBO, Outcome 5 Adverse events: 1. General: a. Death.

Comparison 1 RISPERIDONE DEPOT vs PLACEBO, Outcome 6 Adverse events: 1. General: b. Severe adverse event (by doses).

Comparison 1 RISPERIDONE DEPOT vs PLACEBO, Outcome 7 Adverse events: 1. General: c. Adverse event necessitating withdrawal from study (by doses).

Comparison 1 RISPERIDONE DEPOT vs PLACEBO, Outcome 8 Adverse events: 2. Specific: a. Cardiovascular.

Comparison 1 RISPERIDONE DEPOT vs PLACEBO, Outcome 9 Adverse events: 2. Specific: b. Gastrointestinal.

Comparison 1 RISPERIDONE DEPOT vs PLACEBO, Outcome 10 Adverse events: 2. Specific: c. Movement disorders: a. Extrapyramidal disorder ‐ spontaneously reported (by doses).
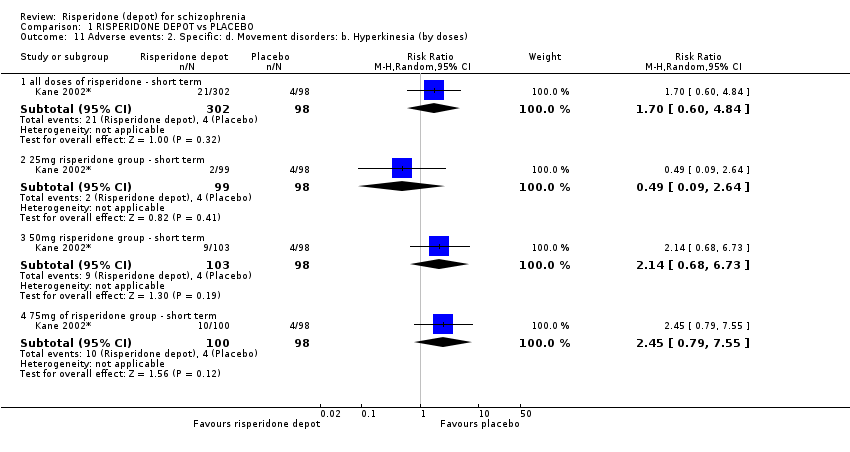
Comparison 1 RISPERIDONE DEPOT vs PLACEBO, Outcome 11 Adverse events: 2. Specific: d. Movement disorders: b. Hyperkinesia (by doses).

Comparison 1 RISPERIDONE DEPOT vs PLACEBO, Outcome 12 Adverse events: 2. Specific: e. Movement disorders: c. Hypertonia (by doses).

Comparison 1 RISPERIDONE DEPOT vs PLACEBO, Outcome 13 Adverse events: 2. Specific: f. Pain.

Comparison 1 RISPERIDONE DEPOT vs PLACEBO, Outcome 14 Adverse events: 2. Specific: g. Salivation.

Comparison 1 RISPERIDONE DEPOT vs PLACEBO, Outcome 15 Adverse events: 2. Specific: h. Sleep disturbances.

Comparison 1 RISPERIDONE DEPOT vs PLACEBO, Outcome 16 Adverse events: 2. Specific: i. Weight gain.
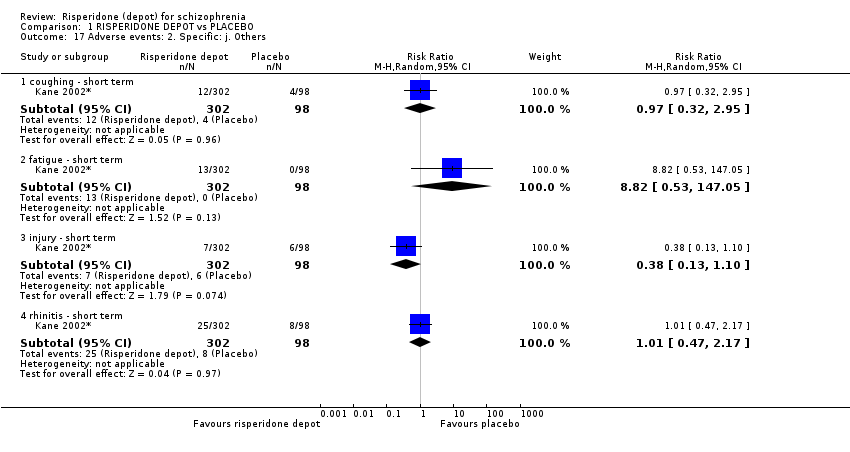
Comparison 1 RISPERIDONE DEPOT vs PLACEBO, Outcome 17 Adverse events: 2. Specific: j. Others.

Comparison 2 RISPERIDONE DEPOT vs GENERAL ORAL ANTIPSYCHOTICS, Outcome 1 Global state: 1. Relapse (any reason).

Comparison 2 RISPERIDONE DEPOT vs GENERAL ORAL ANTIPSYCHOTICS, Outcome 2 Global state: 2. Needing use of benzodiazepine or sedative drugs.

Comparison 2 RISPERIDONE DEPOT vs GENERAL ORAL ANTIPSYCHOTICS, Outcome 3 Service utilisation: 1. Hospitalisation.
| Study | Intervention | Mean | SD | N |
| long term | ||||
| Rosenheck 2011 | Risperidone depot | 122.4 | 130.9 | 187 |
| Rosenheck 2011 | Oral control | 136.5 | 137 | 182 |
Comparison 2 RISPERIDONE DEPOT vs GENERAL ORAL ANTIPSYCHOTICS, Outcome 4 Service utilisation: 2. Outpatient care ‐ number of outpatient visits (skewed data).

Comparison 2 RISPERIDONE DEPOT vs GENERAL ORAL ANTIPSYCHOTICS, Outcome 5 Not receiving allocated study medication.

Comparison 2 RISPERIDONE DEPOT vs GENERAL ORAL ANTIPSYCHOTICS, Outcome 6 Leaving the study early: 1. Any reason.

Comparison 2 RISPERIDONE DEPOT vs GENERAL ORAL ANTIPSYCHOTICS, Outcome 7 Leaving the study early: 2. Specific.

Comparison 2 RISPERIDONE DEPOT vs GENERAL ORAL ANTIPSYCHOTICS, Outcome 8 Adverse events: 1. General: a. Death.

Comparison 2 RISPERIDONE DEPOT vs GENERAL ORAL ANTIPSYCHOTICS, Outcome 9 Adverse events: 2. Specific.

Comparison 2 RISPERIDONE DEPOT vs GENERAL ORAL ANTIPSYCHOTICS, Outcome 10 Adverse events: Nervous system disorders (inc. EPS).

Comparison 3 RISPERIDONE DEPOT vs ORAL RISPERIDONE, Outcome 1 Global state: 1. Moderate to severely ill at end of study period (CGI rating).

Comparison 3 RISPERIDONE DEPOT vs ORAL RISPERIDONE, Outcome 2 Global state: 2. Mean change from baseline (CGI‐S, high score = worse).

Comparison 3 RISPERIDONE DEPOT vs ORAL RISPERIDONE, Outcome 3 Global state: 3. Mean (SD) GAF score change to endpoint.

Comparison 3 RISPERIDONE DEPOT vs ORAL RISPERIDONE, Outcome 4 Global state: 4. Needing use of benzodiazepine or sedative drugs.

Comparison 3 RISPERIDONE DEPOT vs ORAL RISPERIDONE, Outcome 5 Mental state: 1. Average change/endpoint scores (PANSS, high score = worse).
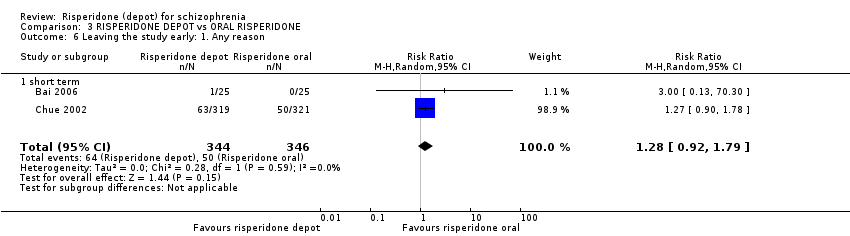
Comparison 3 RISPERIDONE DEPOT vs ORAL RISPERIDONE, Outcome 6 Leaving the study early: 1. Any reason.
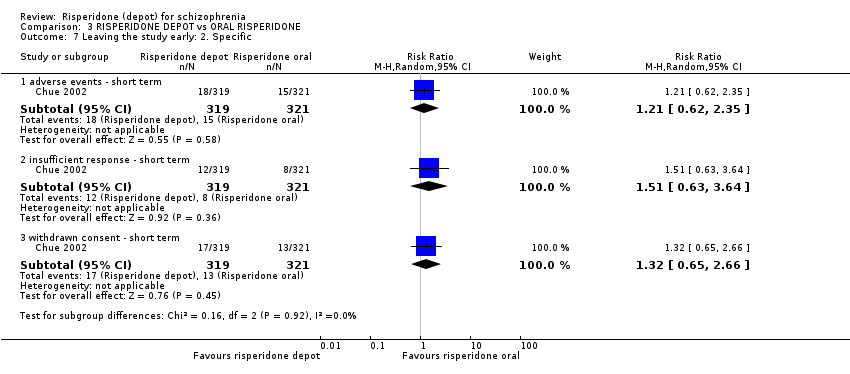
Comparison 3 RISPERIDONE DEPOT vs ORAL RISPERIDONE, Outcome 7 Leaving the study early: 2. Specific.

Comparison 3 RISPERIDONE DEPOT vs ORAL RISPERIDONE, Outcome 8 Quality of life: Mean (SD) SF‐36 score change/endpoint (high score = better).

Comparison 3 RISPERIDONE DEPOT vs ORAL RISPERIDONE, Outcome 9 Adverse events: 1. General.
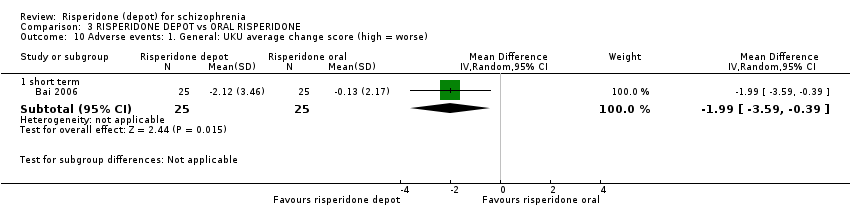
Comparison 3 RISPERIDONE DEPOT vs ORAL RISPERIDONE, Outcome 10 Adverse events: 1. General: UKU average change score (high = worse).
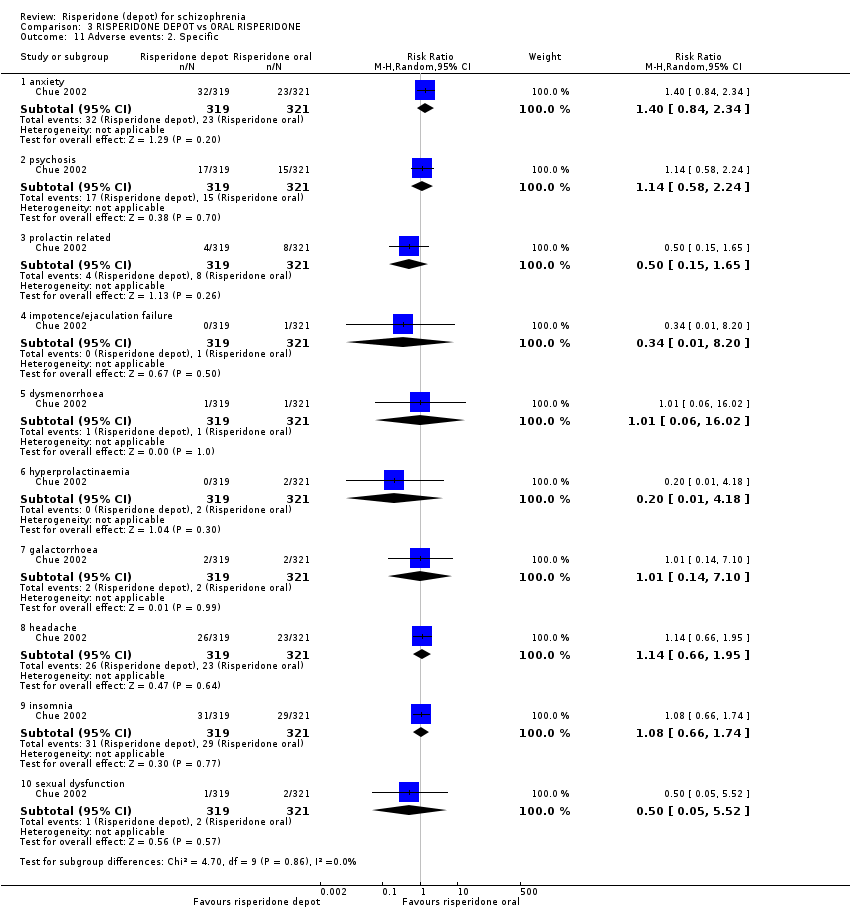
Comparison 3 RISPERIDONE DEPOT vs ORAL RISPERIDONE, Outcome 11 Adverse events: 2. Specific.

Comparison 3 RISPERIDONE DEPOT vs ORAL RISPERIDONE, Outcome 12 Adverse events: 2. Specific: Mean (SD) weight increase in kg.
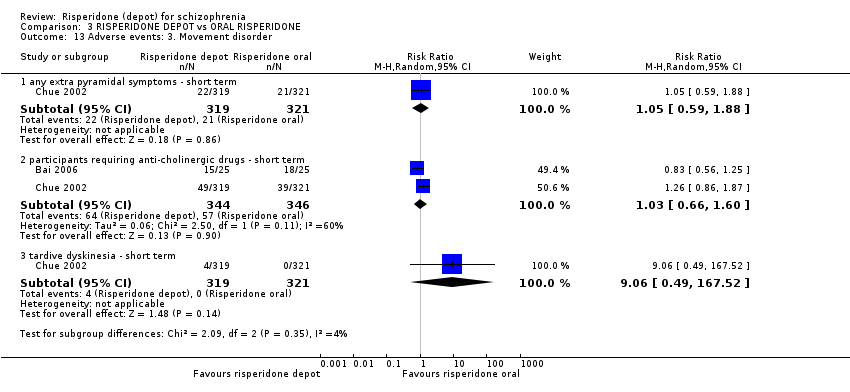
Comparison 3 RISPERIDONE DEPOT vs ORAL RISPERIDONE, Outcome 13 Adverse events: 3. Movement disorder.
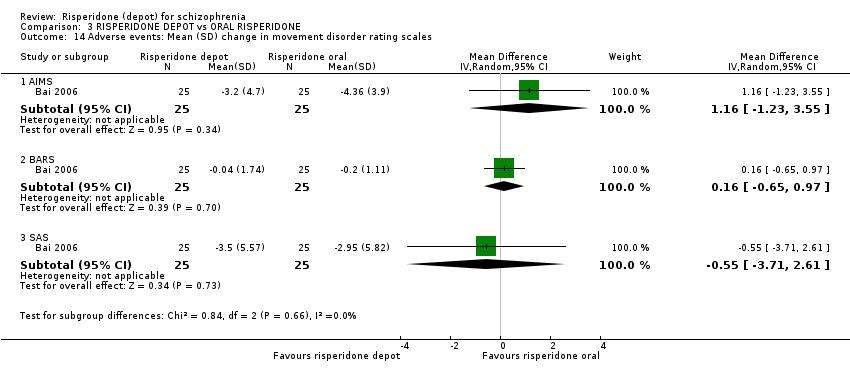
Comparison 3 RISPERIDONE DEPOT vs ORAL RISPERIDONE, Outcome 14 Adverse events: Mean (SD) change in movement disorder rating scales.
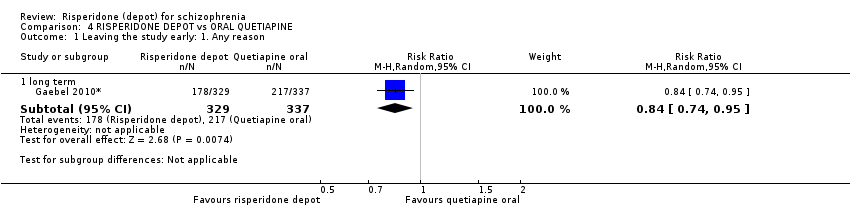
Comparison 4 RISPERIDONE DEPOT vs ORAL QUETIAPINE, Outcome 1 Leaving the study early: 1. Any reason.
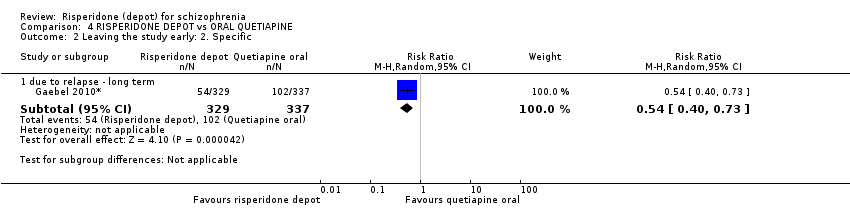
Comparison 4 RISPERIDONE DEPOT vs ORAL QUETIAPINE, Outcome 2 Leaving the study early: 2. Specific.

Comparison 4 RISPERIDONE DEPOT vs ORAL QUETIAPINE, Outcome 3 Adverse events: 1. General.
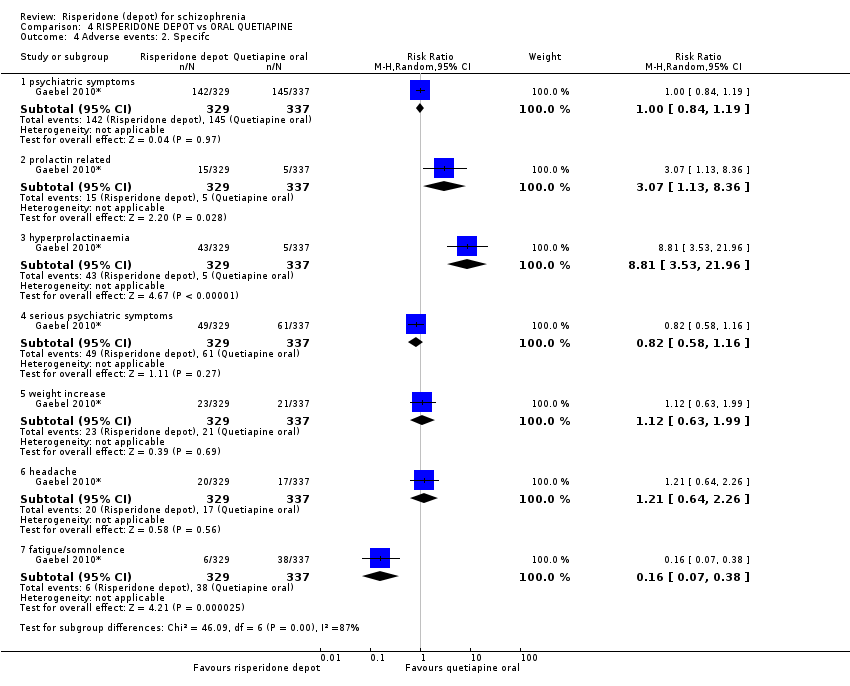
Comparison 4 RISPERIDONE DEPOT vs ORAL QUETIAPINE, Outcome 4 Adverse events: 2. Specifc.

Comparison 4 RISPERIDONE DEPOT vs ORAL QUETIAPINE, Outcome 5 Adverse events: 2. Specific: Mean (SD) weight increase in kg.
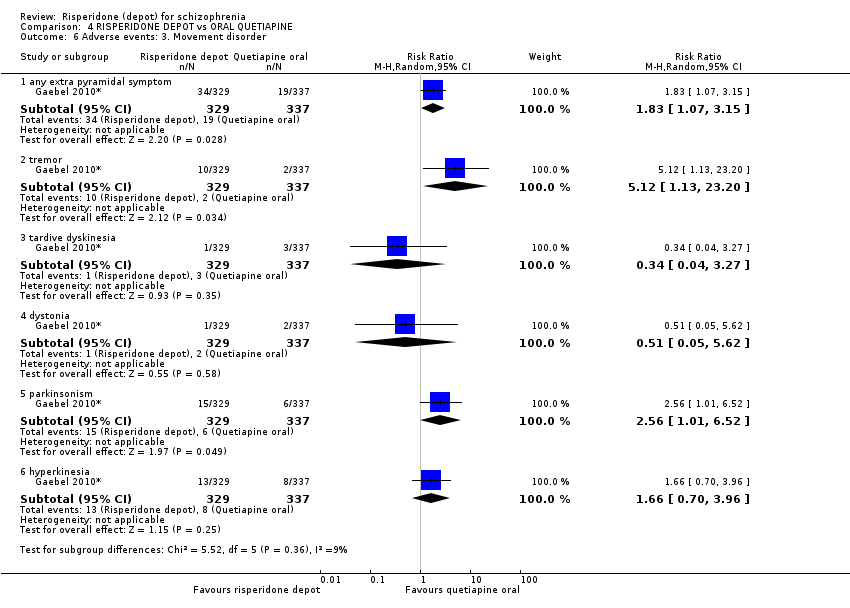
Comparison 4 RISPERIDONE DEPOT vs ORAL QUETIAPINE, Outcome 6 Adverse events: 3. Movement disorder.

Comparison 5 RISPERIDONE DEPOT vs ORAL ARIPIPRAZOLE, Outcome 1 Global state: 1. Relapse (any reason).

Comparison 5 RISPERIDONE DEPOT vs ORAL ARIPIPRAZOLE, Outcome 2 Global state: 3. Mean time in remission (days).

Comparison 5 RISPERIDONE DEPOT vs ORAL ARIPIPRAZOLE, Outcome 3 Mental state: 1. Average change scores (PANSS, high score = worse).

Comparison 5 RISPERIDONE DEPOT vs ORAL ARIPIPRAZOLE, Outcome 4 Leaving the study early: 1. Any reason.

Comparison 5 RISPERIDONE DEPOT vs ORAL ARIPIPRAZOLE, Outcome 5 Leaving the study early: 2. Specific.
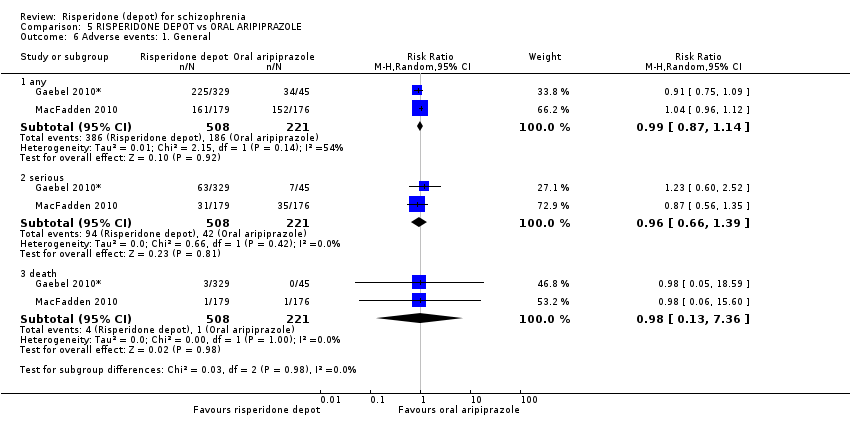
Comparison 5 RISPERIDONE DEPOT vs ORAL ARIPIPRAZOLE, Outcome 6 Adverse events: 1. General.

Comparison 5 RISPERIDONE DEPOT vs ORAL ARIPIPRAZOLE, Outcome 7 Adverse events: 2. Specific.

Comparison 5 RISPERIDONE DEPOT vs ORAL ARIPIPRAZOLE, Outcome 8 Adverse events: 2. Specific 12. Mean (SD) weight increase in kg.
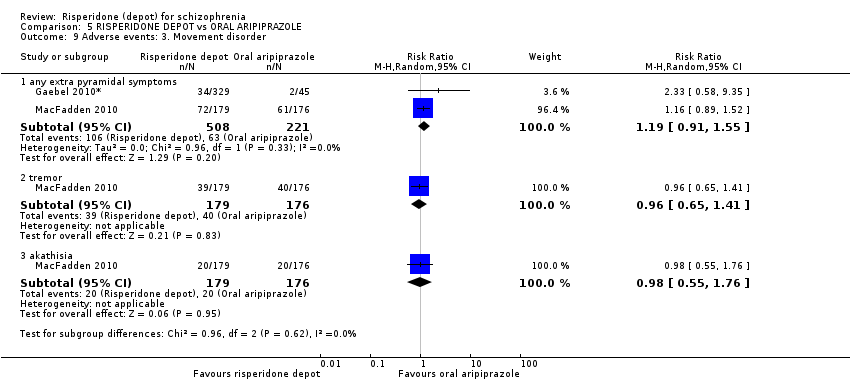
Comparison 5 RISPERIDONE DEPOT vs ORAL ARIPIPRAZOLE, Outcome 9 Adverse events: 3. Movement disorder.

Comparison 6 RISPERIDONE DEPOT vs ORAL OLANZAPINE, Outcome 1 Mental state: 1. Average change scores (PANNS, high score = worse).
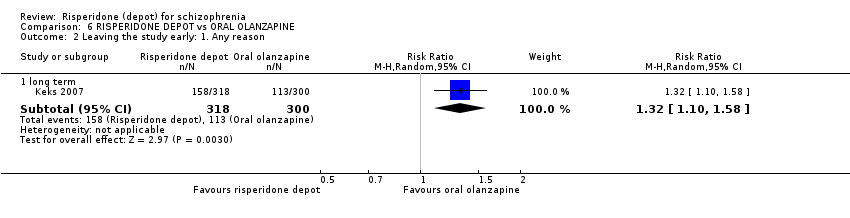
Comparison 6 RISPERIDONE DEPOT vs ORAL OLANZAPINE, Outcome 2 Leaving the study early: 1. Any reason.

Comparison 6 RISPERIDONE DEPOT vs ORAL OLANZAPINE, Outcome 3 Leaving the study early: 2. Specific.
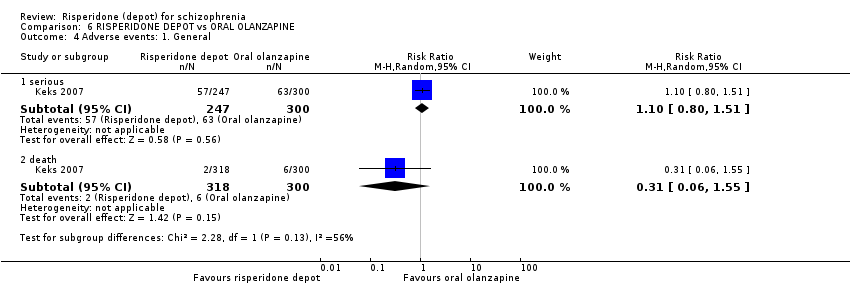
Comparison 6 RISPERIDONE DEPOT vs ORAL OLANZAPINE, Outcome 4 Adverse events: 1. General.

Comparison 6 RISPERIDONE DEPOT vs ORAL OLANZAPINE, Outcome 5 Adverse events: 2. Specific.

Comparison 6 RISPERIDONE DEPOT vs ORAL OLANZAPINE, Outcome 6 Adverse events: 3. Movement disorder.

Comparison 7 RISPERIDONE DEPOT vs ALL ORAL ANTIPSYCHOTICS (PRIMARY OUTCOMES), Outcome 1 Global state: 1. Relapse (any reason).
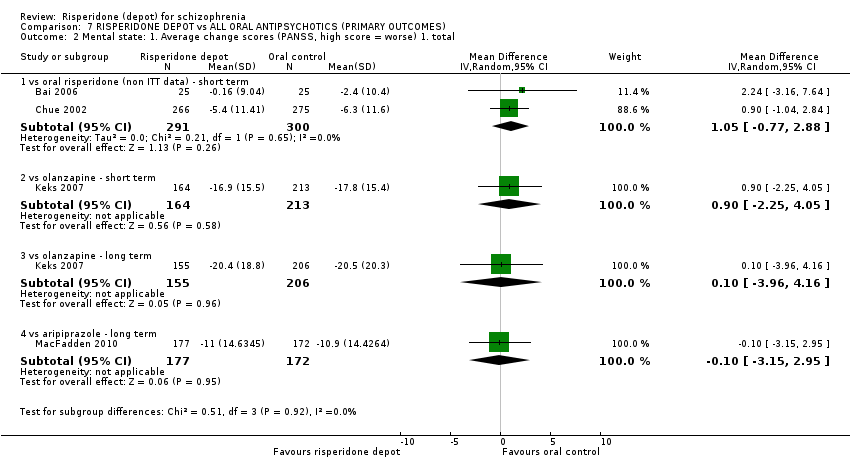
Comparison 7 RISPERIDONE DEPOT vs ALL ORAL ANTIPSYCHOTICS (PRIMARY OUTCOMES), Outcome 2 Mental state: 1. Average change scores (PANSS, high score = worse) 1. total.
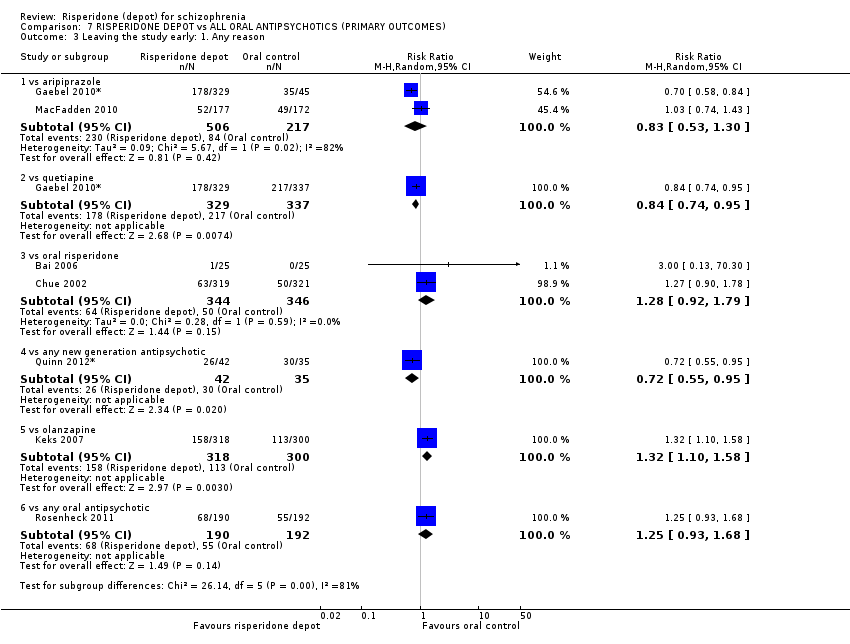
Comparison 7 RISPERIDONE DEPOT vs ALL ORAL ANTIPSYCHOTICS (PRIMARY OUTCOMES), Outcome 3 Leaving the study early: 1. Any reason.
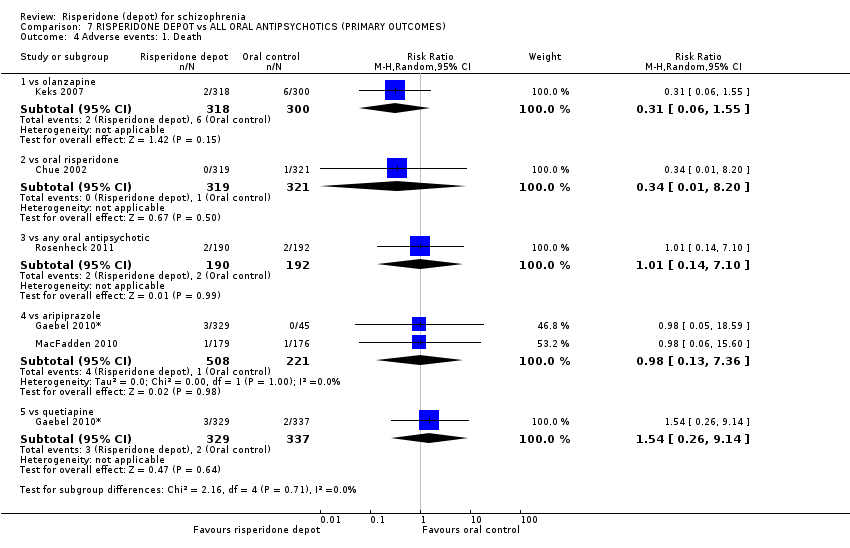
Comparison 7 RISPERIDONE DEPOT vs ALL ORAL ANTIPSYCHOTICS (PRIMARY OUTCOMES), Outcome 4 Adverse events: 1. Death.

Comparison 7 RISPERIDONE DEPOT vs ALL ORAL ANTIPSYCHOTICS (PRIMARY OUTCOMES), Outcome 5 Adverse events: 1. General: a. any.
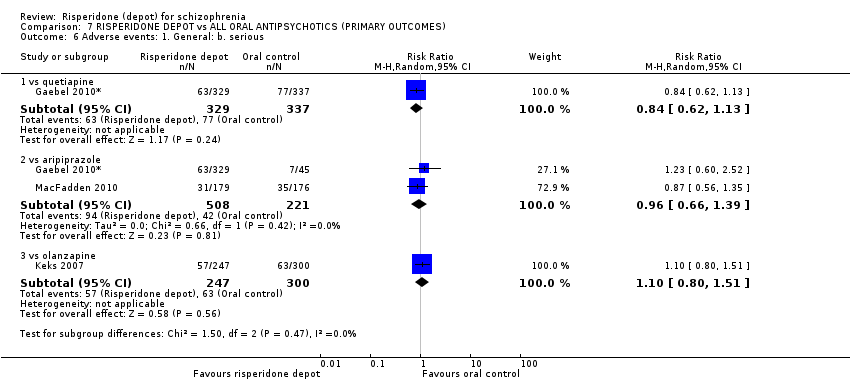
Comparison 7 RISPERIDONE DEPOT vs ALL ORAL ANTIPSYCHOTICS (PRIMARY OUTCOMES), Outcome 6 Adverse events: 1. General: b. serious.

Comparison 7 RISPERIDONE DEPOT vs ALL ORAL ANTIPSYCHOTICS (PRIMARY OUTCOMES), Outcome 7 Adverse events: 2. Movement disorder: a. any extra pyramidal symptoms.

Comparison 8 RISPERIDONE DEPOT vs ATYPICAL DEPOT ANTIPSYCHOTICS (PALIPERIDONE PALMITATE), Outcome 1 Global State: 1. CGI‐S mean change from baseline (high score = worse).
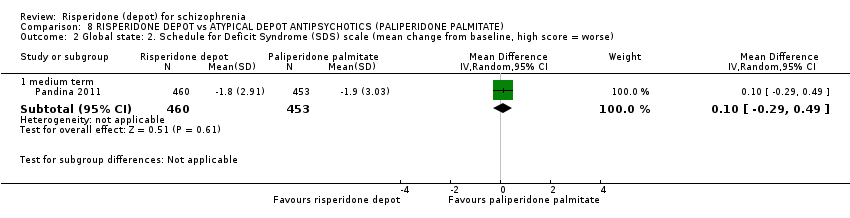
Comparison 8 RISPERIDONE DEPOT vs ATYPICAL DEPOT ANTIPSYCHOTICS (PALIPERIDONE PALMITATE), Outcome 2 Global state: 2. Schedule for Deficit Syndrome (SDS) scale (mean change from baseline, high score = worse).

Comparison 8 RISPERIDONE DEPOT vs ATYPICAL DEPOT ANTIPSYCHOTICS (PALIPERIDONE PALMITATE), Outcome 3 Mental state: 1. PANSS scores (high score = worse) ‐ medium term.

Comparison 8 RISPERIDONE DEPOT vs ATYPICAL DEPOT ANTIPSYCHOTICS (PALIPERIDONE PALMITATE), Outcome 4 Mental state: 2. Improved by 30% in total PANSS score (ITT data).

Comparison 8 RISPERIDONE DEPOT vs ATYPICAL DEPOT ANTIPSYCHOTICS (PALIPERIDONE PALMITATE), Outcome 5 General functioning: Personal and Social Performance (PSP) scale (high score = better).
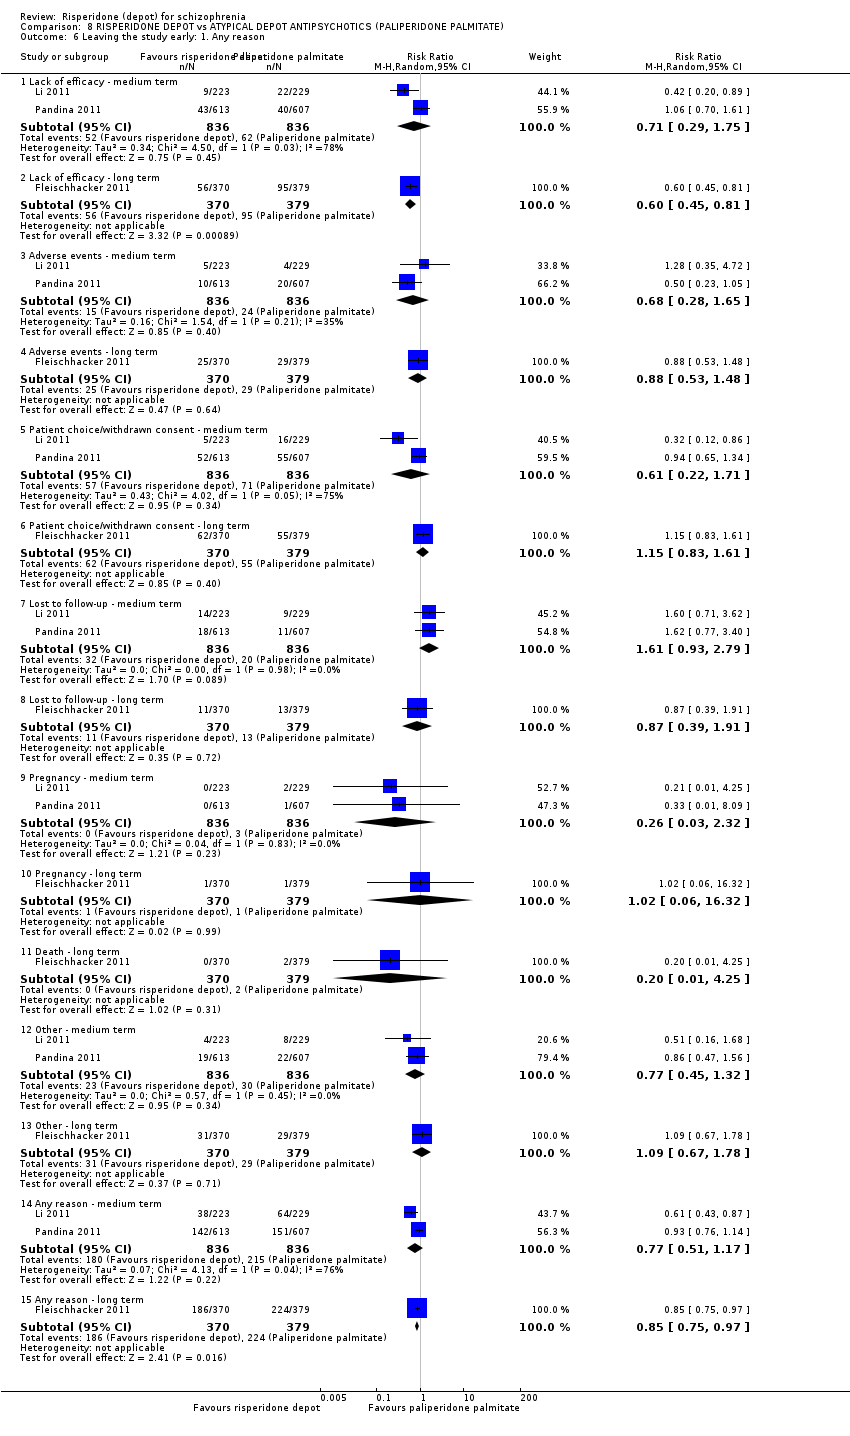
Comparison 8 RISPERIDONE DEPOT vs ATYPICAL DEPOT ANTIPSYCHOTICS (PALIPERIDONE PALMITATE), Outcome 6 Leaving the study early: 1. Any reason.

Comparison 8 RISPERIDONE DEPOT vs ATYPICAL DEPOT ANTIPSYCHOTICS (PALIPERIDONE PALMITATE), Outcome 7 Adverse events: 1. General.

Comparison 8 RISPERIDONE DEPOT vs ATYPICAL DEPOT ANTIPSYCHOTICS (PALIPERIDONE PALMITATE), Outcome 8 Adverse events: 2. Specific.

Comparison 8 RISPERIDONE DEPOT vs ATYPICAL DEPOT ANTIPSYCHOTICS (PALIPERIDONE PALMITATE), Outcome 9 Adverse events: 3. Prolactin related.
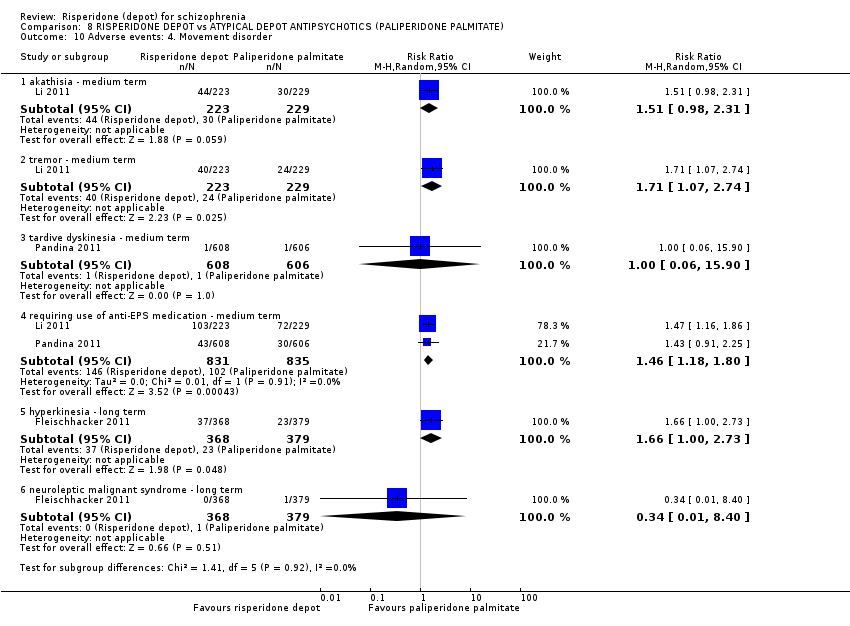
Comparison 8 RISPERIDONE DEPOT vs ATYPICAL DEPOT ANTIPSYCHOTICS (PALIPERIDONE PALMITATE), Outcome 10 Adverse events: 4. Movement disorder.

Comparison 8 RISPERIDONE DEPOT vs ATYPICAL DEPOT ANTIPSYCHOTICS (PALIPERIDONE PALMITATE), Outcome 11 Adverse events: 5. Body weight (mean increase).

Comparison 8 RISPERIDONE DEPOT vs ATYPICAL DEPOT ANTIPSYCHOTICS (PALIPERIDONE PALMITATE), Outcome 12 Adverse events: 6. Mean prolactin level increase (ng/mL).

Comparison 8 RISPERIDONE DEPOT vs ATYPICAL DEPOT ANTIPSYCHOTICS (PALIPERIDONE PALMITATE), Outcome 13 Adverse events: 7. Glucose related.

Comparison 8 RISPERIDONE DEPOT vs ATYPICAL DEPOT ANTIPSYCHOTICS (PALIPERIDONE PALMITATE), Outcome 14 Adverse events: 8. Injection site pain (mean (sd) Visual Analogue Scale score (0‐100mm)).

Comparison 9 RISPERIDONE DEPOT vs TYPICAL DEPOT ANTIPSYCHOTICS, Outcome 1 Mental state: 1. Total endpoint scores (PANNS, high score = worse).

Comparison 9 RISPERIDONE DEPOT vs TYPICAL DEPOT ANTIPSYCHOTICS, Outcome 2 Leaving the study early.

Comparison 9 RISPERIDONE DEPOT vs TYPICAL DEPOT ANTIPSYCHOTICS, Outcome 3 Hospitalisation by 6 months.
| Study | Intervention | Mean | SD | N |
| Change in BMI ‐ short term (skew) | ||||
| Covell 2012 | Risperidone depot | 1.29 | 1.9 | 23 |
| Covell 2012 | Typical depot antipsychotics | 0.48 | 1.4 | 26 |
| Change in BMI ‐ medium term (skew) | ||||
| Covell 2012 | Risperidone depot | 1.53 | 2.2 | 22 |
| Covell 2012 | Typical depot antipsychotics | 0.53 | 1.3 | 24 |
| Change in BMI ‐ long term (skew) | ||||
| Covell 2012 | Risperidone depot | 1.04 | 2.0 | 17 |
| Covell 2012 | Typical depot antipsychotics | ‐0.28 | 1.7 | 24 |
| Prolactin endpoint levels (ng/mL) ‐ short term (skew) | ||||
| Covell 2012 | Risperidone depot | 22.5 | 19.1 | 19 |
| Covell 2012 | Typical depot antipsychotics | 15.1 | 7.6 | 22 |
| Prolactin endpoint levels (ng/mL) ‐ medium term (skew) | ||||
| Covell 2012 | Risperidone depot | 23.4 | 13.8 | 18 |
| Covell 2012 | Typical depot antipsychotics | 16 | 7.5 | 21 |
| Prolactin endpoint levels (ng/mL) ‐ long term (skew) | ||||
| Covell 2012 | Risperidone depot | 19 | 10.6 | 14 |
| Covell 2012 | Typical depot antipsychotics | 15.2 | 5.1 | 18 |
Comparison 9 RISPERIDONE DEPOT vs TYPICAL DEPOT ANTIPSYCHOTICS, Outcome 4 Adverse events: 1. Continuous outcomes (skew).

Comparison 9 RISPERIDONE DEPOT vs TYPICAL DEPOT ANTIPSYCHOTICS, Outcome 5 Adverse events: 2. Sexual experiencesm, total endpoint (ASEX, high score = worse).
| Methods | Allocation: randomised, fully explicit description of methods of randomisation and allocation concealment. |
| Participants | Diagnosis: schizophrenia (ICD/DSM/CCMD). |
| Interventions | 1. Depot risperidone. N = 150. 2. Standard care. N = 150. |
| Outcomes | General: time to all‐cause treatment failure marked by its discontinuation, relapse, general impression of clinician (CGI), career/other, compliance with treatment., healthy days, |
| Notes | * Powered to be able to identify a difference of ˜ 20% between groups for primary outcome with adequate degree of certainty. |
| BPRS: Brief Psychiatric Rating Scale | |
| Excluded study | Comparison | Existing review | Suggested future review titles |
| Oral risperidone vs conventional antipsychotic drugs (haloperidol, fluphenazine, chlorpromazine, trifluoperazine), not depot risperidone. | Risperidone vs typical antipsychotic medication for schizophrenia (Hunter 2003). | Risperidone vs haloperidol, risperidone vs fluphenazine, risperidone vs chlorpromazine, risperidone vs trifluoperazine. | |
| Oral risperidone vs atypical antipsychotics (olanzapine), not depot risperidone. | Risperidone vs olanzapine for schizophrenia (Jayaram 2006). | ||
| Dose comparison (25 mg vs 50 mg of risperidone depot). | Risperidone dose for schizophrenia (Li 2009). | This could also generate further comparisons for this current review. |
| RISPERIDONE DEPOT compared with PLACEBO for schizophrenia | ||||||
| Patient or population: patients with schizophrenia | ||||||
| Outcomes | Illustrative comparative risks* (95% CI) | Relative effect | No of Participants | Quality of the evidence | Comments | |
| Assumed risk | Corresponding risk | |||||
| PLACEBO | RISPERIDONE DEPOT | |||||
| Global state: Relapse ‐ long term ‐ not measured | See comment | See comment | Not estimable | ‐ | See comment | No study reported this outcome. |
| Mental state: clinically significant improvement in mental state ‐ long term1 ‐ not reported | See comment | See comment | Not estimable1 | ‐ | See comment | Study reported PANSS responder rate, but unusable due to high attrition. |
| Leaving the study early: Any reason ‐ all doses risperidone depot ‐ short term | 694 per 1000 | 513 per 1000 | RR 0.74 | 400 | ⊕⊝⊝⊝ | |
| Adverse events: General: Severe adverse event ‐ any dose risperidone depot ‐ short term | 235 per 10004 | 138 per 1000 | RR 0.59 | 400 | ⊕⊝⊝⊝ | |
| Adverse events: Specific: Weight gain ‐ all doses of depot risperidone ‐ short term | 20 per 1000 | 43 per 1000 | RR 2.11 | 400 | ⊕⊝⊝⊝ | |
| *The basis for the assumed risk (e.g. the median control group risk across studies) is provided in footnotes. The corresponding risk (and its 95% confidence interval) is based on the assumed risk in the comparison group and the relative effect of the intervention (and its 95% CI). | ||||||
| GRADE Working Group grades of evidence | ||||||
| 1 Not reported: only included study (Kane 2002*) reported PANSS responder rate, but these data were unusable due to high levels of attrition. | ||||||
| RISPERIDONE DEPOT compared with GENERAL ORAL ANTIPSYCHOTICS for schizophrenia | ||||||
| Patient or population: patients with schizophrenia | ||||||
| Outcomes | Illustrative comparative risks* (95% CI) | Relative effect | No of Participants | Quality of the evidence | Comments | |
| Assumed risk | Corresponding risk | |||||
| GENERAL ORAL ANTIPSYCHOTICS | RISPERIDONE DEPOT | |||||
| Global state: Relapse (any reason) ‐ long term | Moderate | RR 2.13 | 63 | ⊕⊝⊝⊝ | Criteria for relapse were derived from Csernansky 2002.<BR/> | |
| 161 per 10001 | 343 per 1000 | |||||
| Mental state: clinically significant improvement in mental state ‐ long term | See comment | See comment | Not estimable | 0 | See comment | Outcomes relating to mental state were unusable due to high study attrition. |
| Leaving the study early: Any reason ‐ long term | Study population | RR 1.24 | 467 | ⊕⊕⊕⊝ | ||
| 322 per 10004 | 399 per 1000 | |||||
| Moderate | ||||||
| 387 per 10004 | 480 per 1000 | |||||
| Adverse events: General: Severe adverse event ‐ any dose risperidone depot ‐ short term | See comment | See comment | Not estimable | 0 | See comment | "Severe adverse events" were not explicitly reported. |
| Adverse events: Specific ‐ prolactin‐related ‐ long term | Low | RR 10.27 | 85 | ⊕⊝⊝⊝ | ||
| 10 per 10005 | 103 per 1000 | |||||
| Moderate | ||||||
| 100 per 10005 | 1000 per 1000 | |||||
| High | ||||||
| 200 per 10005 | 1000 per 1000 | |||||
| Adverse events: Specific ‐ weight increase ‐ long term | Study population | RR 1.33 | 85 | ⊕⊝⊝⊝ | ||
| 171 per 10004 | 227 per 1000 | |||||
| Moderate | ||||||
| 171 per 10004 | 227 per 1000 | |||||
| Adverse events: Nervous system disorders (inc. EPS) ‐ long term | Study population | RR 1.34 | 369 | ⊕⊝⊝⊝ | ||
| 171 per 10004 | 227 per 1000 | |||||
| Moderate | ||||||
| 171 per 10004 | 227 per 1000 | |||||
| *The basis for the assumed risk (e.g. the median control group risk across studies) is provided in footnotes. The corresponding risk (and its 95% confidence interval) is based on the assumed risk in the comparison group and the relative effect of the intervention (and its 95% CI). | ||||||
| GRADE Working Group grades of evidence | ||||||
| 1 Assumed risk: mean baseline presented for one individual study. | ||||||
| RISPERIDONE DEPOT compared with ORAL RISPERIDONE for schizophrenia | ||||||
| Patient or population: patients with schizophrenia | ||||||
| Outcomes | Illustrative comparative risks* (95% CI) | Relative effect | No of Participants | Quality of the evidence | Comments | |
| Assumed risk | Corresponding risk | |||||
| ORAL RISPERIDONE | RISPERIDONE DEPOT | |||||
| Global state: Relapse ‐ long term | See comment | See comment | Not estimable | 0 | See comment | Outcomes relating to relapse were not available for this comparison. |
| Mental state: average PANSS total score at endpoint (non‐ITT data) | The mean mental state: average PANSS total score at endpoint (non‐ITT data) in the intervention groups was | 591 | ⊕⊕⊕⊝ | |||
| Leaving the study early: Any reason ‐ short term | Study population | RR 1.28 | 690 | ⊕⊕⊕⊝ | ||
| 145 per 10002 | 185 per 1000 | |||||
| Moderate | ||||||
| 78 per 10002 | 100 per 1000 | |||||
| Adverse events: General: Severe adverse event ‐ any dose risperidone depot ‐ short term | See comment | See comment | Not estimable | 0 | See comment | "Severe adverse events" were not explicitly reported by these studies. |
| Adverse events: Movement disorder ‐ any extra pyramidal symptoms ‐ short term | Study population | RR 1.05 | 640 | ⊕⊕⊕⊝ | ||
| 65 per 10003 | 69 per 1000 | |||||
| Moderate | ||||||
| 65 per 10003 | 68 per 1000 | |||||
| Adverse events: Specific: Mean (SD) weight increase in kg ‐ short term | The mean adverse events: specific: mean (SD) weight increase in kg ‐ short term in the control groups was | The mean adverse events: specific: mean (SD) weight increase in kg ‐ short term in the intervention groups was | 640 | ⊕⊕⊕⊝ | ||
| Adverse events: Specific ‐ prolactin‐related | Moderate | RR 0.5 | 640 | ⊕⊕⊕⊝ | ||
| 25 per 10003 | 12 per 1000 | |||||
| *The basis for the assumed risk (e.g. the median control group risk across studies) is provided in footnotes. The corresponding risk (and its 95% confidence interval) is based on the assumed risk in the comparison group and the relative effect of the intervention (and its 95% CI). | ||||||
| GRADE Working Group grades of evidence | ||||||
| 1 Risk of bias: 'serious' ‐ both studies received funding support from the manufacturers of risperidone depot | ||||||
| RISPERIDONE DEPOT compared with ORAL QUETIAPINE for schizophrenia | ||||||
| Patient or population: patients with schizophrenia | ||||||
| Outcomes | Illustrative comparative risks* (95% CI) | Relative effect | No of Participants | Quality of the evidence | Comments | |
| Assumed risk | Corresponding risk | |||||
| ORAL QUETIAPINE | RISPERIDONE DEPOT | |||||
| Global state: Relapse ‐ long term | See comment | See comment | Not estimable | 0 | See comment | Criteria for relapse were derived from Csernansky 2002. <BR/> Outcomes relating to relapse were reported, but were unusable due to study attrition. |
| Mental state: clinically significant improvement in mental state ‐ long term | See comment | See comment | Not estimable | 0 | See comment | Outcomes relating to mental state were unusable due to high study attrition. |
| Leaving the study early: Any reason ‐ long term | Moderate | RR 0.84 | 666 | ⊕⊕⊕⊝ | ||
| 644 per 10001 | 541 per 1000 | |||||
| Adverse events: General ‐ serious | Moderate | RR 0.84 | 666 | ⊕⊕⊝⊝ | ||
| 229 per 10001 | 192 per 1000 | |||||
| Adverse events: Movement disorder ‐ any extra pyramidal symptom | Moderate | RR 1.83 | 666 | ⊕⊕⊝⊝ | ||
| 56 per 10001 | 102 per 1000 | |||||
| Adverse events: Specific: Mean (SD) weight increase in kg ‐ long term | The mean adverse events: specific: mean (SD) weight increase in kg ‐ long term in the intervention groups was | 666 | ⊕⊕⊝⊝ | |||
| Adverse events: Specific ‐ prolactin‐related | Study population | RR 3.07 | 666 | ⊕⊕⊝⊝ | ||
| 15 per 10001 | 46 per 1000 | |||||
| Moderate | ||||||
| 15 per 10001 | 46 per 1000 | |||||
| *The basis for the assumed risk (e.g. the median control group risk across studies) is provided in footnotes. The corresponding risk (and its 95% confidence interval) is based on the assumed risk in the comparison group and the relative effect of the intervention (and its 95% CI). | ||||||
| GRADE Working Group grades of evidence | ||||||
| 1 Assumed risk: mean baseline risk used for one included study. | ||||||
| RISPERIDONE DEPOT compared with ORAL ARIPIPRAZOLE for schizophrenia | ||||||
| Patient or population: patients with schizophrenia | ||||||
| Outcomes | Illustrative comparative risks* (95% CI) | Relative effect | No of Participants | Quality of the evidence | Comments | |
| Assumed risk | Corresponding risk | |||||
| ORAL ARIPIPRAZOLE | RISPERIDONE DEPOT | |||||
| Global state: Relapse (any reason) ‐ long term | Moderate | RR 1.05 | 349 | ⊕⊕⊝⊝ | Criteria for relapse were derived from Csernansky 2002. | |
| 436 per 10001 | 458 per 1000 | |||||
| Mental state: Average change scores‐ long term | The mean mental state: average change scores‐ long term in the intervention groups was | 349 | ⊕⊕⊝⊝ | |||
| Leaving the study early: Any reason ‐ long term | Study population | RR 0.83 | 723 | ⊕⊝⊝⊝ | ||
| 387 per 10004 | 321 per 1000 | |||||
| Moderate | ||||||
| 531 per 10004 | 441 per 1000 | |||||
| Adverse events: General ‐ serious | Study population | RR 0.96 | 729 | ⊕⊝⊝⊝ | ||
| 190 per 10004 | 182 per 1000 | |||||
| Moderate | ||||||
| 177 per 10004 | 170 per 1000 | |||||
| Adverse events: Movement disorder ‐ any extra pyramidal symptoms | Study population | RR 1.19 | 729 | ⊕⊝⊝⊝ | ||
| 285 per 10004 | 339 per 1000 | |||||
| Moderate | ||||||
| 196 per 10004 | 233 per 1000 | |||||
| Adverse events: Specific ‐ weight increase | Moderate | RR 1.57 | 374 | ⊕⊕⊝⊝ | ||
| 44 per 10001 | 69 per 1000 | |||||
| Adverse events: Specific ‐ prolactin‐related | Study population | RR 9.91 | 729 | ⊕⊝⊝⊝ | ||
| 9 per 10004 | 90 per 1000 | |||||
| Moderate | ||||||
| 6 per 10004 | 59 per 1000 | |||||
| *The basis for the assumed risk (e.g. the median control group risk across studies) is provided in footnotes. The corresponding risk (and its 95% confidence interval) is based on the assumed risk in the comparison group and the relative effect of the intervention (and its 95% CI). | ||||||
| GRADE Working Group grades of evidence | ||||||
| 1 Assumed risk: mean baseline risk presented for one individual study. | ||||||
| RISPERIDONE DEPOT compared with ORAL OLANZAPINE for schizophrenia | ||||||
| Patient or population: patients with schizophrenia | ||||||
| Outcomes | Illustrative comparative risks* (95% CI) | Relative effect | No of Participants | Quality of the evidence | Comments | |
| Assumed risk | Corresponding risk | |||||
| ORAL OLANZAPINE | RISPERIDONE DEPOT | |||||
| Global state: Relapse ‐ long term | See comment | See comment | Not estimable | 0 | See comment | Outcomes relating to relapse were not reported for this comparison. |
| Mental state: Average change scores ‐ long term | The mean mental state: average change scores ‐ long term in the intervention groups was | 361 | ⊕⊕⊝⊝ | |||
| Leaving the study early: Any reason ‐ long term | Study population | RR 1.32 | 618 | ⊕⊕⊝⊝ | ||
| 377 per 10004 | 497 per 1000 | |||||
| Moderate | ||||||
| 377 per 10004 | 498 per 1000 | |||||
| Adverse events: General ‐ serious | Moderate | RR 1.1 | 547 | ⊕⊕⊝⊝ | ||
| 210 per 10004 | 231 per 1000 | |||||
| Adverse events: Movement disorder ‐ any extra pyramidal symptoms | Moderate | RR 1.67 | 547 | ⊕⊕⊝⊝ | ||
| 150 per 10004 | 250 per 1000 | |||||
| Adverse events: Specific ‐ weight increase | Moderate | RR 0.56 | 547 | ⊕⊕⊝⊝ | ||
| 360 per 10004 | 202 per 1000 | |||||
| *The basis for the assumed risk (e.g. the median control group risk across studies) is provided in footnotes. The corresponding risk (and its 95% confidence interval) is based on the assumed risk in the comparison group and the relative effect of the intervention (and its 95% CI). | ||||||
| GRADE Working Group grades of evidence | ||||||
| 1 Risk of bias: 'very serious' ‐ serious risk of bias due to study attrition in excess of 50%. | ||||||
| RISPERIDONE DEPOT compared with ATYPICAL DEPOT ANTIPSYCHOTICS (PALIPERIDONE PALMITATE) for schizophrenia | ||||||
| Patient or population: patients with schizophrenia | ||||||
| Outcomes | Illustrative comparative risks* (95% CI) | Relative effect | No of Participants | Quality of the evidence | Comments | |
| Assumed risk | Corresponding risk | |||||
| ATYPICAL DEPOT ANTIPSYCHOTICS (PALIPERIDONE PALMITATE) | RISPERIDONE DEPOT | |||||
| Global state: Relapse ‐ long term | See comment | See comment | Not estimable | 0 | See comment | Outcomes relating to relapse were not reported for this comparison. |
| Mental state: PANSS responders (ITT data) ‐ medium term | Study population | RR 1.01 | 1326 | ⊕⊕⊕⊝ | ||
| 585 per 10001 | 591 per 1000 | |||||
| Moderate | ||||||
| 619 per 10001 | 625 per 1000 | |||||
| Leaving the study early: lack of efficacy ‐ long term | Study population | RR 0.60 | 749 | ⊕⊕⊝⊝ | ||
| 361 per 10001 | 307 per 1000 | |||||
| Moderate | ||||||
| 280 per 10001 | 238 per 1000 | |||||
| Adverse events: Movement disorder requiring the use of anti‐EPS medication ‐ medium term | Study population | RR 1.46 | 1666 | ⊕⊕⊕⊝ | ||
| 122 per 10001 | 178 per 1000 | |||||
| Moderate | ||||||
| 182 per 10001 | 266 per 1000 | |||||
| Adverse events: Body weight (mean increase) ‐ medium/long term | The mean adverse events: body weight (mean increase) ‐ medium/long term in the intervention groups was | 2350 | ⊕⊕⊝⊝ | |||
| Adverse events: Any prolactin‐related ‐ medium term | Study population | RR 1.02 | 1666 | ⊕⊕⊕⊝ | ||
| 32 per 10001 | 33 per 1000 | |||||
| Moderate | ||||||
| 48 per 10001 | 49 per 1000 | |||||
| Adverse events: Any glucose‐related ‐ medium/long term | 10 per 10001 | 18 per 1000 | RR 1.79 | 2413 | ⊕⊕⊝⊝ | |
| *The basis for the assumed risk (e.g. the median control group risk across studies) is provided in footnotes. The corresponding risk (and its 95% confidence interval) is based on the assumed risk in the comparison group and the relative effect of the intervention (and its 95% CI). | ||||||
| GRADE Working Group grades of evidence | ||||||
| 1 Assumed risk: median control group risk from the studies. | ||||||
| RISPERIDONE DEPOT compared with TYPICAL DEPOT ANTIPSYCHOTICS for schizophrenia | ||||||
| Patient or population: patients with schizophrenia | ||||||
| Outcomes | Illustrative comparative risks* (95% CI) | Relative effect | No of Participants | Quality of the evidence | Comments | |
| Assumed risk | Corresponding risk | |||||
| TYPICAL DEPOT ANTIPSYCHOTICS | RISPERIDONE DEPOT | |||||
| Global state: Relapse ‐ long term | See comment | See comment | Not estimable | 0 | See comment | Outcomes relating to relapse were not reported for this comparison. |
| Mental state: Total average scores (PANSS, high score = worse) ‐ long term | The mean mental state: total average scores (PANSS, high score = worse) ‐ long term in the intervention groups was | 43 | ⊕⊕⊝⊝ | |||
| Leaving the study early for any reason ‐ long term | Study population | RR 3.05 | 62 | ⊕⊕⊝⊝ | ||
| 133 per 10003 | 407 per 1000 | |||||
| Moderate | ||||||
| 133 per 10003 | 406 per 1000 | |||||
| Adverse events: General: Severe adverse event | See comment | See comment | Not estimable | 0 | See comment | "Severe adverse events" were not explicitly reported for this comparison. |
| Adverse events: related to movement disorder, weight gain, prolactin levels and glucose metabolism ‐ medium/long term ‐ not reported | See comment | See comment | Not estimable | ‐ | See comment | Outcomes relating to specific adverse events were not reported in such as way as to be useable. |
| *The basis for the assumed risk (e.g. the median control group risk across studies) is provided in footnotes. The corresponding risk (and its 95% confidence interval) is based on the assumed risk in the comparison group and the relative effect of the intervention (and its 95% CI). | ||||||
| GRADE Working Group grades of evidence | ||||||
| 1 Risk of bias: 'serious' ‐ due to the open‐label nature of this study. | ||||||
| Outcome or subgroup title | No. of studies | No. of participants | Statistical method | Effect size |
| 1 Mental state: 1. Change (exacerbation) in specific symptoms Show forest plot | 1 | Risk Ratio (M‐H, Random, 95% CI) | Subtotals only | |
| 1.1 anxiety ‐ short term | 1 | 400 | Risk Ratio (M‐H, Random, 95% CI) | 0.58 [0.32, 1.05] |
| 1.2 agitation ‐ short term | 1 | 400 | Risk Ratio (M‐H, Random, 95% CI) | 0.60 [0.39, 0.92] |
| 1.3 hallucinations ‐ short term | 1 | 400 | Risk Ratio (M‐H, Random, 95% CI) | 1.23 [0.47, 3.22] |
| 1.4 nervousness ‐ short term | 1 | 400 | Risk Ratio (M‐H, Random, 95% CI) | 0.39 [0.12, 1.25] |
| 1.5 psychosis ‐ short term | 1 | 400 | Risk Ratio (M‐H, Random, 95% CI) | 0.52 [0.33, 0.83] |
| 2 Leaving the study early: 1. Any reason (by time period) Show forest plot | 1 | Risk Ratio (M‐H, Random, 95% CI) | Subtotals only | |
| 2.1 very early on (<1 injection) | 1 | 400 | Risk Ratio (M‐H, Random, 95% CI) | 1.30 [0.55, 3.08] |
| 2.2 by 12 weeks | 1 | 400 | Risk Ratio (M‐H, Random, 95% CI) | 0.74 [0.63, 0.88] |
| 3 Leaving the study early: 2. Any reason (by doses) Show forest plot | 1 | Risk Ratio (M‐H, Random, 95% CI) | Subtotals only | |
| 3.1 all doses risperidone depot ‐ short term | 1 | 400 | Risk Ratio (M‐H, Random, 95% CI) | 0.74 [0.63, 0.88] |
| 3.2 25mg risperidone depot ‐ short term | 1 | 197 | Risk Ratio (M‐H, Random, 95% CI) | 0.74 [0.59, 0.94] |
| 3.3 50mg risperidone depot ‐ short term | 1 | 201 | Risk Ratio (M‐H, Random, 95% CI) | 0.74 [0.59, 0.93] |
| 3.4 75mg risperidone depot ‐ short term | 1 | 198 | Risk Ratio (M‐H, Random, 95% CI) | 0.75 [0.60, 0.94] |
| 4 Leaving the study early: 3. Because of insufficient response (by doses) Show forest plot | 1 | Risk Ratio (M‐H, Random, 95% CI) | Subtotals only | |
| 4.1 all three doses ‐ short term | 1 | 400 | Risk Ratio (M‐H, Random, 95% CI) | 0.53 [0.36, 0.79] |
| 4.2 25mg depot risperidone group ‐ short term | 1 | 197 | Risk Ratio (M‐H, Random, 95% CI) | 0.73 [0.45, 1.17] |
| 4.3 50mg depot risperidone group ‐ short term | 1 | 201 | Risk Ratio (M‐H, Random, 95% CI) | 0.48 [0.27, 0.83] |
| 4.4 75mg depot risperidone group ‐ short term | 1 | 198 | Risk Ratio (M‐H, Random, 95% CI) | 0.39 [0.21, 0.72] |
| 5 Adverse events: 1. General: a. Death Show forest plot | 1 | Risk Ratio (M‐H, Random, 95% CI) | Subtotals only | |
| 5.1 short term | 1 | 400 | Risk Ratio (M‐H, Random, 95% CI) | 0.11 [0.00, 2.65] |
| 6 Adverse events: 1. General: b. Severe adverse event (by doses) Show forest plot | 1 | Risk Ratio (M‐H, Random, 95% CI) | Subtotals only | |
| 6.1 any dose risperidone depot ‐ short term | 1 | 400 | Risk Ratio (M‐H, Random, 95% CI) | 0.59 [0.38, 0.93] |
| 6.2 25mg risperidone depot ‐ short term | 1 | 197 | Risk Ratio (M‐H, Random, 95% CI) | 0.56 [0.30, 1.04] |
| 6.3 50mg risperidone depot ‐ short term | 1 | 201 | Risk Ratio (M‐H, Random, 95% CI) | 0.58 [0.32, 1.06] |
| 6.4 75mg risperidone depot ‐ short term | 1 | 198 | Risk Ratio (M‐H, Random, 95% CI) | 0.64 [0.36, 1.15] |
| 7 Adverse events: 1. General: c. Adverse event necessitating withdrawal from study (by doses) Show forest plot | 1 | Risk Ratio (M‐H, Random, 95% CI) | Subtotals only | |
| 7.1 any dose risperidone depot ‐ short term | 1 | 400 | Risk Ratio (M‐H, Random, 95% CI) | 1.00 [0.54, 1.84] |
| 7.2 25mg risperidone depot ‐ short term | 1 | 197 | Risk Ratio (M‐H, Random, 95% CI) | 0.91 [0.42, 1.96] |
| 7.3 50mg risperidone depot ‐ short term | 1 | 201 | Risk Ratio (M‐H, Random, 95% CI) | 0.95 [0.45, 2.02] |
| 7.4 75mg risperidone depot ‐ short term | 1 | 198 | Risk Ratio (M‐H, Random, 95% CI) | 1.14 [0.56, 2.35] |
| 8 Adverse events: 2. Specific: a. Cardiovascular Show forest plot | 1 | Risk Ratio (M‐H, Random, 95% CI) | Subtotals only | |
| 8.1 dizziness ‐ short term | 1 | 400 | Risk Ratio (M‐H, Random, 95% CI) | 1.46 [0.62, 3.43] |
| 8.2 tachycardia ‐ short term | 1 | 400 | Risk Ratio (M‐H, Random, 95% CI) | 0.32 [0.11, 0.98] |
| 9 Adverse events: 2. Specific: b. Gastrointestinal Show forest plot | 1 | Risk Ratio (M‐H, Random, 95% CI) | Subtotals only | |
| 9.1 constipation ‐ short term | 1 | 400 | Risk Ratio (M‐H, Random, 95% CI) | 6.17 [0.84, 45.46] |
| 9.2 diarrhoea ‐ short term | 1 | 400 | Risk Ratio (M‐H, Random, 95% CI) | 0.87 [0.23, 3.20] |
| 9.3 nausea ‐ short term | 1 | 400 | Risk Ratio (M‐H, Random, 95% CI) | 1.04 [0.39, 2.76] |
| 9.4 vomiting ‐ short term | 1 | 400 | Risk Ratio (M‐H, Random, 95% CI) | 0.59 [0.23, 1.57] |
| 10 Adverse events: 2. Specific: c. Movement disorders: a. Extrapyramidal disorder ‐ spontaneously reported (by doses) Show forest plot | 1 | Risk Ratio (M‐H, Random, 95% CI) | Subtotals only | |
| 10.1 all doses of depot risperidone ‐ short term | 1 | 400 | Risk Ratio (M‐H, Random, 95% CI) | 2.38 [0.73, 7.78] |
| 10.2 25mg risperidone group ‐ short term | 1 | 197 | Risk Ratio (M‐H, Random, 95% CI) | 1.32 [0.30, 5.74] |
| 10.3 50mg risperidone group ‐ short term | 1 | 201 | Risk Ratio (M‐H, Random, 95% CI) | 2.54 [0.69, 9.29] |
| 10.4 75mg risperidone group ‐ short term | 1 | 198 | Risk Ratio (M‐H, Random, 95% CI) | 3.27 [0.93, 11.51] |
| 11 Adverse events: 2. Specific: d. Movement disorders: b. Hyperkinesia (by doses) Show forest plot | 1 | Risk Ratio (M‐H, Random, 95% CI) | Subtotals only | |
| 11.1 all doses of risperidone ‐ short term | 1 | 400 | Risk Ratio (M‐H, Random, 95% CI) | 1.70 [0.60, 4.84] |
| 11.2 25mg risperidone group ‐ short term | 1 | 197 | Risk Ratio (M‐H, Random, 95% CI) | 0.49 [0.09, 2.64] |
| 11.3 50mg risperidone group ‐ short term | 1 | 201 | Risk Ratio (M‐H, Random, 95% CI) | 2.14 [0.68, 6.73] |
| 11.4 75mg of risperidone group ‐ short term | 1 | 198 | Risk Ratio (M‐H, Random, 95% CI) | 2.45 [0.79, 7.55] |
| 12 Adverse events: 2. Specific: e. Movement disorders: c. Hypertonia (by doses) Show forest plot | 1 | Risk Ratio (M‐H, Random, 95% CI) | Subtotals only | |
| 12.1 all doses of depot risperidone ‐ short term | 1 | 400 | Risk Ratio (M‐H, Random, 95% CI) | 1.23 [0.47, 3.22] |
| 12.2 25mg risperidone ‐ short term | 1 | 197 | Risk Ratio (M‐H, Random, 95% CI) | 0.79 [0.22, 2.86] |
| 12.3 50mg risperidone ‐ short term | 1 | 201 | Risk Ratio (M‐H, Random, 95% CI) | 0.95 [0.28, 3.19] |
| 12.4 75mg risperidone ‐ short term | 1 | 198 | Risk Ratio (M‐H, Random, 95% CI) | 1.96 [0.70, 5.53] |
| 13 Adverse events: 2. Specific: f. Pain Show forest plot | 1 | Risk Ratio (M‐H, Random, 95% CI) | Subtotals only | |
| 13.1 headache ‐ short term | 1 | 400 | Risk Ratio (M‐H, Random, 95% CI) | 1.57 [0.88, 2.80] |
| 13.2 pain ‐ unspecified ‐ short term | 1 | 400 | Risk Ratio (M‐H, Random, 95% CI) | 1.38 [0.48, 4.00] |
| 14 Adverse events: 2. Specific: g. Salivation Show forest plot | 1 | Risk Ratio (M‐H, Random, 95% CI) | Subtotals only | |
| 14.1 decreased ‐ short term | 1 | 400 | Risk Ratio (M‐H, Random, 95% CI) | 2.92 [0.37, 22.76] |
| 14.2 increased ‐ short term | 1 | 400 | Risk Ratio (M‐H, Random, 95% CI) | 2.92 [0.37, 22.76] |
| 15 Adverse events: 2. Specific: h. Sleep disturbances Show forest plot | 1 | Risk Ratio (M‐H, Random, 95% CI) | Subtotals only | |
| 15.1 insomnia ‐ short term | 1 | 400 | Risk Ratio (M‐H, Random, 95% CI) | 1.04 [0.60, 1.82] |
| 15.2 somnolence ‐ short term | 1 | 400 | Risk Ratio (M‐H, Random, 95% CI) | 2.27 [0.69, 7.45] |
| 16 Adverse events: 2. Specific: i. Weight gain Show forest plot | 1 | Risk Ratio (M‐H, Random, 95% CI) | Subtotals only | |
| 16.1 all doses of depot risperidone ‐ short term | 1 | 400 | Risk Ratio (M‐H, Random, 95% CI) | 2.11 [0.48, 9.18] |
| 16.2 25mg risperidone ‐ short term | 1 | 197 | Risk Ratio (M‐H, Random, 95% CI) | 2.47 [0.49, 12.45] |
| 16.3 50mg risperidone ‐ short term | 1 | 201 | Risk Ratio (M‐H, Random, 95% CI) | 1.90 [0.36, 10.16] |
| 16.4 75mg risperidone ‐ short term | 1 | 198 | Risk Ratio (M‐H, Random, 95% CI) | 1.96 [0.37, 10.46] |
| 17 Adverse events: 2. Specific: j. Others Show forest plot | 1 | Risk Ratio (M‐H, Random, 95% CI) | Subtotals only | |
| 17.1 coughing ‐ short term | 1 | 400 | Risk Ratio (M‐H, Random, 95% CI) | 0.97 [0.32, 2.95] |
| 17.2 fatigue ‐ short term | 1 | 400 | Risk Ratio (M‐H, Random, 95% CI) | 8.82 [0.53, 147.05] |
| 17.3 injury ‐ short term | 1 | 400 | Risk Ratio (M‐H, Random, 95% CI) | 0.38 [0.13, 1.10] |
| 17.4 rhinitis ‐ short term | 1 | 400 | Risk Ratio (M‐H, Random, 95% CI) | 1.01 [0.47, 2.17] |
| Outcome or subgroup title | No. of studies | No. of participants | Statistical method | Effect size |
| 1 Global state: 1. Relapse (any reason) Show forest plot | 1 | Risk Ratio (M‐H, Random, 95% CI) | Subtotals only | |
| 1.1 long term | 1 | 63 | Risk Ratio (M‐H, Random, 95% CI) | 2.13 [0.84, 5.43] |
| 2 Global state: 2. Needing use of benzodiazepine or sedative drugs Show forest plot | 1 | Risk Ratio (M‐H, Random, 95% CI) | Subtotals only | |
| 2.1 long term | 1 | 369 | Risk Ratio (M‐H, Random, 95% CI) | 1.00 [0.68, 1.47] |
| 3 Service utilisation: 1. Hospitalisation Show forest plot | 1 | Risk Ratio (M‐H, Random, 95% CI) | Subtotals only | |
| 3.1 long term | 1 | 369 | Risk Ratio (M‐H, Random, 95% CI) | 0.87 [0.68, 1.10] |
| 4 Service utilisation: 2. Outpatient care ‐ number of outpatient visits (skewed data) Show forest plot | Other data | No numeric data | ||
| 4.1 long term | Other data | No numeric data | ||
| 5 Not receiving allocated study medication Show forest plot | 1 | Risk Ratio (M‐H, Random, 95% CI) | Subtotals only | |
| 5.1 long term | 1 | 382 | Risk Ratio (M‐H, Random, 95% CI) | 0.29 [0.06, 1.37] |
| 6 Leaving the study early: 1. Any reason Show forest plot | 2 | 467 | Risk Ratio (M‐H, Random, 95% CI) | 1.24 [0.98, 1.57] |
| 6.1 long term | 2 | 467 | Risk Ratio (M‐H, Random, 95% CI) | 1.24 [0.98, 1.57] |
| 7 Leaving the study early: 2. Specific Show forest plot | 1 | Risk Ratio (M‐H, Random, 95% CI) | Subtotals only | |
| 7.1 insufficient response ‐ long term | 1 | 382 | Risk Ratio (M‐H, Random, 95% CI) | 0.61 [0.15, 2.50] |
| 7.2 withdrawn consent ‐ long term | 1 | 382 | Risk Ratio (M‐H, Random, 95% CI) | 1.41 [0.86, 2.31] |
| 8 Adverse events: 1. General: a. Death Show forest plot | 1 | Risk Ratio (M‐H, Random, 95% CI) | Subtotals only | |
| 8.1 long term | 1 | 382 | Risk Ratio (M‐H, Random, 95% CI) | 1.01 [0.14, 7.10] |
| 9 Adverse events: 2. Specific Show forest plot | 2 | Risk Ratio (M‐H, Random, 95% CI) | Subtotals only | |
| 9.1 anxiety ‐ long term | 1 | 85 | Risk Ratio (M‐H, Random, 95% CI) | 1.40 [0.42, 4.60] |
| 9.2 diabetes mellitus ‐ long term | 1 | 369 | Risk Ratio (M‐H, Random, 95% CI) | 1.70 [0.73, 3.96] |
| 9.3 dizziness ‐ long term | 1 | 85 | Risk Ratio (M‐H, Random, 95% CI) | 1.49 [0.53, 4.19] |
| 9.4 fatigue/somnolence ‐ long term | 1 | 85 | Risk Ratio (M‐H, Random, 95% CI) | 2.05 [0.78, 5.40] |
| 9.5 gastrointestinal ‐ long term | 1 | 369 | Risk Ratio (M‐H, Random, 95% CI) | 1.10 [0.95, 1.28] |
| 9.6 general disorders and administration site conditions ‐ long term | 1 | 369 | Risk Ratio (M‐H, Random, 95% CI) | 1.31 [1.02, 1.69] |
| 9.7 headache ‐ long term | 1 | 85 | Risk Ratio (M‐H, Random, 95% CI) | 2.80 [1.12, 7.00] |
| 9.8 insomnia ‐ long term | 1 | 85 | Risk Ratio (M‐H, Random, 95% CI) | 1.73 [0.77, 3.91] |
| 9.9 nausea/ vomiting ‐ long term | 1 | 85 | Risk Ratio (M‐H, Random, 95% CI) | 1.86 [0.50, 6.97] |
| 9.10 prolactin related ‐ long term | 1 | 85 | Risk Ratio (M‐H, Random, 95% CI) | 10.27 [0.59, 180.05] |
| 9.11 weight increase ‐ long term | 1 | 85 | Risk Ratio (M‐H, Random, 95% CI) | 1.33 [0.56, 3.17] |
| 10 Adverse events: Nervous system disorders (inc. EPS) Show forest plot | 1 | Risk Ratio (M‐H, Random, 95% CI) | Subtotals only | |
| 10.1 long term | 1 | 369 | Risk Ratio (M‐H, Random, 95% CI) | 1.34 [1.13, 1.58] |
| Outcome or subgroup title | No. of studies | No. of participants | Statistical method | Effect size |
| 1 Global state: 1. Moderate to severely ill at end of study period (CGI rating) Show forest plot | 1 | Risk Ratio (M‐H, Random, 95% CI) | Subtotals only | |
| 1.1 short term | 1 | 640 | Risk Ratio (M‐H, Random, 95% CI) | 1.06 [0.92, 1.22] |
| 2 Global state: 2. Mean change from baseline (CGI‐S, high score = worse) Show forest plot | 1 | Mean Difference (IV, Random, 95% CI) | Subtotals only | |
| 2.1 short term | 1 | 50 | Mean Difference (IV, Random, 95% CI) | ‐0.04 [‐0.25, 0.17] |
| 3 Global state: 3. Mean (SD) GAF score change to endpoint Show forest plot | 1 | Mean Difference (IV, Random, 95% CI) | Subtotals only | |
| 3.1 short term | 1 | 50 | Mean Difference (IV, Random, 95% CI) | ‐0.8 [‐5.66, 4.06] |
| 4 Global state: 4. Needing use of benzodiazepine or sedative drugs Show forest plot | 2 | 690 | Risk Ratio (M‐H, Random, 95% CI) | 0.87 [0.74, 1.02] |
| 4.1 short term | 2 | 690 | Risk Ratio (M‐H, Random, 95% CI) | 0.87 [0.74, 1.02] |
| 5 Mental state: 1. Average change/endpoint scores (PANSS, high score = worse) Show forest plot | 2 | Mean Difference (IV, Random, 95% CI) | Subtotals only | |
| 5.1 mean total (non ITT data) | 1 | 541 | Mean Difference (IV, Random, 95% CI) | 0.0 [‐2.91, 2.91] |
| 5.2 average change: 1. total (non ITT data) | 2 | 591 | Mean Difference (IV, Random, 95% CI) | 1.05 [‐0.77, 2.88] |
| 5.3 average change: 2. positive (non‐ITT data) | 2 | 591 | Mean Difference (IV, Random, 95% CI) | 0.83 [‐0.69, 2.35] |
| 5.4 average change: 3. negative (non ITT data) | 2 | 591 | Mean Difference (IV, Random, 95% CI) | 0.03 [‐0.76, 0.82] |
| 5.5 average change: 4. disorganised thoughts | 1 | 541 | Mean Difference (IV, Random, 95% CI) | 0.10 [‐0.45, 0.65] |
| 5.6 average change: 5. hostility/excitement | 1 | 541 | Mean Difference (IV, Random, 95% CI) | 0.10 [‐0.18, 0.38] |
| 5.7 average change: 6. anxiety/depression | 1 | 541 | Mean Difference (IV, Random, 95% CI) | 0.10 [‐0.45, 0.65] |
| 6 Leaving the study early: 1. Any reason Show forest plot | 2 | 690 | Risk Ratio (M‐H, Random, 95% CI) | 1.28 [0.92, 1.79] |
| 6.1 short term | 2 | 690 | Risk Ratio (M‐H, Random, 95% CI) | 1.28 [0.92, 1.79] |
| 7 Leaving the study early: 2. Specific Show forest plot | 1 | Risk Ratio (M‐H, Random, 95% CI) | Subtotals only | |
| 7.1 adverse events ‐ short term | 1 | 640 | Risk Ratio (M‐H, Random, 95% CI) | 1.21 [0.62, 2.35] |
| 7.2 insufficient response ‐ short term | 1 | 640 | Risk Ratio (M‐H, Random, 95% CI) | 1.51 [0.63, 3.64] |
| 7.3 withdrawn consent ‐ short term | 1 | 640 | Risk Ratio (M‐H, Random, 95% CI) | 1.32 [0.65, 2.66] |
| 8 Quality of life: Mean (SD) SF‐36 score change/endpoint (high score = better) Show forest plot | 1 | Mean Difference (IV, Random, 95% CI) | Subtotals only | |
| 8.1 Physical component summary | 1 | 50 | Mean Difference (IV, Random, 95% CI) | 1.4 [‐2.64, 5.44] |
| 8.2 Mental component summary | 1 | 50 | Mean Difference (IV, Random, 95% CI) | ‐0.20 [‐5.06, 4.66] |
| 8.3 Role physical | 1 | 50 | Mean Difference (IV, Random, 95% CI) | 1.0 [‐20.71, 22.71] |
| 8.4 Role emotional | 1 | 50 | Mean Difference (IV, Random, 95% CI) | ‐10.60 [‐34.13, 12.93] |
| 8.5 Vitality | 1 | 50 | Mean Difference (IV, Random, 95% CI) | ‐1.6 [‐10.24, 7.04] |
| 8.6 General health | 1 | 50 | Mean Difference (IV, Random, 95% CI) | ‐2.60 [‐13.14, 7.94] |
| 8.7 Mental health | 1 | 50 | Mean Difference (IV, Random, 95% CI) | 5.8 [‐5.20, 16.80] |
| 8.8 Bodily pain | 1 | 50 | Mean Difference (IV, Random, 95% CI) | 3.70 [‐9.89, 17.29] |
| 8.9 Physical function | 1 | 50 | Mean Difference (IV, Random, 95% CI) | ‐4.6 [‐14.25, 5.05] |
| 8.10 Social function | 1 | 50 | Mean Difference (IV, Random, 95% CI) | 18.5 [3.98, 33.02] |
| 9 Adverse events: 1. General Show forest plot | 1 | Risk Ratio (M‐H, Random, 95% CI) | Subtotals only | |
| 9.1 any ‐ short term | 1 | 640 | Risk Ratio (M‐H, Random, 95% CI) | 1.04 [0.91, 1.18] |
| 9.2 death ‐ short term | 1 | 640 | Risk Ratio (M‐H, Random, 95% CI) | 0.34 [0.01, 8.20] |
| 10 Adverse events: 1. General: UKU average change score (high = worse) Show forest plot | 1 | Mean Difference (IV, Random, 95% CI) | Subtotals only | |
| 10.1 short term | 1 | 50 | Mean Difference (IV, Random, 95% CI) | ‐1.99 [‐3.59, ‐0.39] |
| 11 Adverse events: 2. Specific Show forest plot | 1 | Risk Ratio (M‐H, Random, 95% CI) | Subtotals only | |
| 11.1 anxiety | 1 | 640 | Risk Ratio (M‐H, Random, 95% CI) | 1.40 [0.84, 2.34] |
| 11.2 psychosis | 1 | 640 | Risk Ratio (M‐H, Random, 95% CI) | 1.14 [0.58, 2.24] |
| 11.3 prolactin related | 1 | 640 | Risk Ratio (M‐H, Random, 95% CI) | 0.50 [0.15, 1.65] |
| 11.4 impotence/ejaculation failure | 1 | 640 | Risk Ratio (M‐H, Random, 95% CI) | 0.34 [0.01, 8.20] |
| 11.5 dysmenorrhoea | 1 | 640 | Risk Ratio (M‐H, Random, 95% CI) | 1.01 [0.06, 16.02] |
| 11.6 hyperprolactinaemia | 1 | 640 | Risk Ratio (M‐H, Random, 95% CI) | 0.20 [0.01, 4.18] |
| 11.7 galactorrhoea | 1 | 640 | Risk Ratio (M‐H, Random, 95% CI) | 1.01 [0.14, 7.10] |
| 11.8 headache | 1 | 640 | Risk Ratio (M‐H, Random, 95% CI) | 1.14 [0.66, 1.95] |
| 11.9 insomnia | 1 | 640 | Risk Ratio (M‐H, Random, 95% CI) | 1.08 [0.66, 1.74] |
| 11.10 sexual dysfunction | 1 | 640 | Risk Ratio (M‐H, Random, 95% CI) | 0.50 [0.05, 5.52] |
| 12 Adverse events: 2. Specific: Mean (SD) weight increase in kg Show forest plot | 1 | Mean Difference (IV, Random, 95% CI) | Subtotals only | |
| 12.1 short term | 1 | 640 | Mean Difference (IV, Random, 95% CI) | 0.2 [‐0.35, 0.75] |
| 13 Adverse events: 3. Movement disorder Show forest plot | 2 | Risk Ratio (M‐H, Random, 95% CI) | Subtotals only | |
| 13.1 any extra pyramidal symptoms ‐ short term | 1 | 640 | Risk Ratio (M‐H, Random, 95% CI) | 1.05 [0.59, 1.88] |
| 13.2 participants requiring anti‐cholinergic drugs ‐ short term | 2 | 690 | Risk Ratio (M‐H, Random, 95% CI) | 1.03 [0.66, 1.60] |
| 13.3 tardive dyskinesia ‐ short term | 1 | 640 | Risk Ratio (M‐H, Random, 95% CI) | 9.06 [0.49, 167.52] |
| 14 Adverse events: Mean (SD) change in movement disorder rating scales Show forest plot | 1 | Mean Difference (IV, Random, 95% CI) | Subtotals only | |
| 14.1 AIMS | 1 | 50 | Mean Difference (IV, Random, 95% CI) | 1.16 [‐1.23, 3.55] |
| 14.2 BARS | 1 | 50 | Mean Difference (IV, Random, 95% CI) | 0.16 [‐0.65, 0.97] |
| 14.3 SAS | 1 | 50 | Mean Difference (IV, Random, 95% CI) | ‐0.55 [‐3.71, 2.61] |
| Outcome or subgroup title | No. of studies | No. of participants | Statistical method | Effect size |
| 1 Leaving the study early: 1. Any reason Show forest plot | 1 | Risk Ratio (M‐H, Random, 95% CI) | Subtotals only | |
| 1.1 long term | 1 | 666 | Risk Ratio (M‐H, Random, 95% CI) | 0.84 [0.74, 0.95] |
| 2 Leaving the study early: 2. Specific Show forest plot | 1 | Risk Ratio (M‐H, Random, 95% CI) | Subtotals only | |
| 2.1 due to relapse ‐ long term | 1 | 666 | Risk Ratio (M‐H, Random, 95% CI) | 0.54 [0.40, 0.73] |
| 3 Adverse events: 1. General Show forest plot | 1 | Risk Ratio (M‐H, Random, 95% CI) | Subtotals only | |
| 3.1 any | 1 | 666 | Risk Ratio (M‐H, Random, 95% CI) | 0.98 [0.89, 1.09] |
| 3.2 serious | 1 | 666 | Risk Ratio (M‐H, Random, 95% CI) | 0.84 [0.62, 1.13] |
| 3.3 death | 1 | 666 | Risk Ratio (M‐H, Random, 95% CI) | 1.54 [0.26, 9.14] |
| 4 Adverse events: 2. Specifc Show forest plot | 1 | Risk Ratio (M‐H, Random, 95% CI) | Subtotals only | |
| 4.1 psychiatric symptoms | 1 | 666 | Risk Ratio (M‐H, Random, 95% CI) | 1.00 [0.84, 1.19] |
| 4.2 prolactin related | 1 | 666 | Risk Ratio (M‐H, Random, 95% CI) | 3.07 [1.13, 8.36] |
| 4.3 hyperprolactinaemia | 1 | 666 | Risk Ratio (M‐H, Random, 95% CI) | 8.81 [3.53, 21.96] |
| 4.4 serious psychiatric symptoms | 1 | 666 | Risk Ratio (M‐H, Random, 95% CI) | 0.82 [0.58, 1.16] |
| 4.5 weight increase | 1 | 666 | Risk Ratio (M‐H, Random, 95% CI) | 1.12 [0.63, 1.99] |
| 4.6 headache | 1 | 666 | Risk Ratio (M‐H, Random, 95% CI) | 1.21 [0.64, 2.26] |
| 4.7 fatigue/somnolence | 1 | 666 | Risk Ratio (M‐H, Random, 95% CI) | 0.16 [0.07, 0.38] |
| 5 Adverse events: 2. Specific: Mean (SD) weight increase in kg Show forest plot | 1 | Mean Difference (IV, Random, 95% CI) | Subtotals only | |
| 5.1 long term | 1 | 666 | Mean Difference (IV, Random, 95% CI) | 1.25 [0.25, 2.25] |
| 6 Adverse events: 3. Movement disorder Show forest plot | 1 | Risk Ratio (M‐H, Random, 95% CI) | Subtotals only | |
| 6.1 any extra pyramidal symptom | 1 | 666 | Risk Ratio (M‐H, Random, 95% CI) | 1.83 [1.07, 3.15] |
| 6.2 tremor | 1 | 666 | Risk Ratio (M‐H, Random, 95% CI) | 5.12 [1.13, 23.20] |
| 6.3 tardive dyskinesia | 1 | 666 | Risk Ratio (M‐H, Random, 95% CI) | 0.34 [0.04, 3.27] |
| 6.4 dystonia | 1 | 666 | Risk Ratio (M‐H, Random, 95% CI) | 0.51 [0.05, 5.62] |
| 6.5 parkinsonism | 1 | 666 | Risk Ratio (M‐H, Random, 95% CI) | 2.56 [1.01, 6.52] |
| 6.6 hyperkinesia | 1 | 666 | Risk Ratio (M‐H, Random, 95% CI) | 1.66 [0.70, 3.96] |
| Outcome or subgroup title | No. of studies | No. of participants | Statistical method | Effect size |
| 1 Global state: 1. Relapse (any reason) Show forest plot | 1 | Risk Ratio (M‐H, Random, 95% CI) | Subtotals only | |
| 1.1 long term | 1 | 349 | Risk Ratio (M‐H, Random, 95% CI) | 1.05 [0.83, 1.33] |
| 2 Global state: 3. Mean time in remission (days) Show forest plot | 1 | Mean Difference (IV, Random, 95% CI) | Subtotals only | |
| 2.1 long term | 1 | 348 | Mean Difference (IV, Random, 95% CI) | 16.80 [‐43.59, 77.19] |
| 3 Mental state: 1. Average change scores (PANSS, high score = worse) Show forest plot | 1 | Mean Difference (IV, Random, 95% CI) | Subtotals only | |
| 3.1 long term | 1 | 349 | Mean Difference (IV, Random, 95% CI) | ‐0.10 [‐3.15, 2.95] |
| 4 Leaving the study early: 1. Any reason Show forest plot | 2 | 723 | Risk Ratio (M‐H, Random, 95% CI) | 0.83 [0.53, 1.30] |
| 4.1 long term | 2 | 723 | Risk Ratio (M‐H, Random, 95% CI) | 0.83 [0.53, 1.30] |
| 5 Leaving the study early: 2. Specific Show forest plot | 2 | Risk Ratio (M‐H, Random, 95% CI) | Subtotals only | |
| 5.1 adverse events | 2 | 723 | Risk Ratio (M‐H, Random, 95% CI) | 0.41 [0.05, 3.55] |
| 5.2 insufficient response | 1 | 349 | Risk Ratio (M‐H, Random, 95% CI) | 1.30 [0.29, 5.70] |
| 5.3 withdrawn consent | 2 | 723 | Risk Ratio (M‐H, Random, 95% CI) | 1.01 [0.67, 1.52] |
| 5.4 due to relapse | 1 | 374 | Risk Ratio (M‐H, Random, 95% CI) | 0.62 [0.36, 1.06] |
| 5.5 loss to follow‐up | 1 | 349 | Risk Ratio (M‐H, Random, 95% CI) | 1.75 [0.83, 3.68] |
| 6 Adverse events: 1. General Show forest plot | 2 | Risk Ratio (M‐H, Random, 95% CI) | Subtotals only | |
| 6.1 any | 2 | 729 | Risk Ratio (M‐H, Random, 95% CI) | 0.99 [0.87, 1.14] |
| 6.2 serious | 2 | 729 | Risk Ratio (M‐H, Random, 95% CI) | 0.96 [0.66, 1.39] |
| 6.3 death | 2 | 729 | Risk Ratio (M‐H, Random, 95% CI) | 0.98 [0.13, 7.36] |
| 7 Adverse events: 2. Specific Show forest plot | 2 | Risk Ratio (M‐H, Random, 95% CI) | Subtotals only | |
| 7.1 anxiety | 1 | 355 | Risk Ratio (M‐H, Random, 95% CI) | 1.21 [0.75, 1.94] |
| 7.2 depression | 1 | 355 | Risk Ratio (M‐H, Random, 95% CI) | 1.57 [0.85, 2.90] |
| 7.3 psychosis | 1 | 355 | Risk Ratio (M‐H, Random, 95% CI) | 1.04 [0.69, 1.56] |
| 7.4 psychiatric symptoms | 1 | 374 | Risk Ratio (M‐H, Random, 95% CI) | 0.81 [0.60, 1.09] |
| 7.5 serious psychiatric symptoms | 1 | 374 | Risk Ratio (M‐H, Random, 95% CI) | 0.75 [0.27, 2.08] |
| 7.6 schizophrenia | 1 | 355 | Risk Ratio (M‐H, Random, 95% CI) | 1.02 [0.63, 1.64] |
| 7.7 prolactin related | 2 | 729 | Risk Ratio (M‐H, Random, 95% CI) | 9.91 [2.78, 35.29] |
| 7.8 hyperprolactinaemia | 1 | 374 | Risk Ratio (M‐H, Random, 95% CI) | 12.13 [0.76, 193.65] |
| 7.9 weight increase | 1 | 374 | Risk Ratio (M‐H, Random, 95% CI) | 1.57 [0.38, 6.45] |
| 7.10 nausea/vomiting | 1 | 349 | Risk Ratio (M‐H, Random, 95% CI) | 1.25 [0.64, 2.43] |
| 7.11 gastrointestinal | 1 | 374 | Risk Ratio (M‐H, Random, 95% CI) | 0.27 [0.14, 0.55] |
| 7.12 decreased appetite | 1 | 355 | Risk Ratio (M‐H, Random, 95% CI) | 1.78 [1.00, 3.16] |
| 7.13 diarrhoea | 1 | 355 | Risk Ratio (M‐H, Random, 95% CI) | 0.62 [0.31, 1.24] |
| 7.14 headache | 2 | 729 | Risk Ratio (M‐H, Random, 95% CI) | 0.87 [0.46, 1.65] |
| 7.15 insomnia | 1 | 355 | Risk Ratio (M‐H, Random, 95% CI) | 0.91 [0.65, 1.27] |
| 7.16 upper resp. tract infection | 1 | 355 | Risk Ratio (M‐H, Random, 95% CI) | 0.38 [0.16, 0.89] |
| 7.17 pyrexia | 1 | 355 | Risk Ratio (M‐H, Random, 95% CI) | 1.16 [0.69, 1.97] |
| 7.18 nasopharyngitis | 1 | 355 | Risk Ratio (M‐H, Random, 95% CI) | 1.11 [0.58, 2.10] |
| 7.19 dizziness | 1 | 355 | Risk Ratio (M‐H, Random, 95% CI) | 1.89 [1.00, 3.58] |
| 7.20 glucose related | 1 | 355 | Risk Ratio (M‐H, Random, 95% CI) | 1.11 [0.58, 2.10] |
| 8 Adverse events: 2. Specific 12. Mean (SD) weight increase in kg Show forest plot | 1 | Mean Difference (IV, Random, 95% CI) | Subtotals only | |
| 8.1 long term | 1 | 355 | Mean Difference (IV, Random, 95% CI) | 1.0 [‐0.42, 2.42] |
| 9 Adverse events: 3. Movement disorder Show forest plot | 2 | Risk Ratio (M‐H, Random, 95% CI) | Subtotals only | |
| 9.1 any extra pyramidal symptoms | 2 | 729 | Risk Ratio (M‐H, Random, 95% CI) | 1.19 [0.91, 1.55] |
| 9.2 tremor | 1 | 355 | Risk Ratio (M‐H, Random, 95% CI) | 0.96 [0.65, 1.41] |
| 9.3 akathisia | 1 | 355 | Risk Ratio (M‐H, Random, 95% CI) | 0.98 [0.55, 1.76] |
| Outcome or subgroup title | No. of studies | No. of participants | Statistical method | Effect size |
| 1 Mental state: 1. Average change scores (PANNS, high score = worse) Show forest plot | 1 | Mean Difference (IV, Random, 95% CI) | Subtotals only | |
| 1.1 total ‐ short term | 1 | 377 | Mean Difference (IV, Random, 95% CI) | 0.90 [‐2.25, 4.05] |
| 1.2 total ‐ long term | 1 | 361 | Mean Difference (IV, Random, 95% CI) | 0.10 [‐3.96, 4.16] |
| 1.3 positive symptoms ‐ long term | 1 | 361 | Mean Difference (IV, Random, 95% CI) | ‐0.30 [‐1.61, 1.01] |
| 1.4 negative symptoms ‐ long term | 1 | 361 | Mean Difference (IV, Random, 95% CI) | 0.10 [‐1.28, 1.48] |
| 1.5 disorganised thoughts ‐ long term | 1 | 361 | Mean Difference (IV, Random, 95% CI) | ‐0.30 [‐1.34, 0.74] |
| 1.6 hostility/excitement ‐ long term | 1 | 361 | Mean Difference (IV, Random, 95% CI) | 0.20 [‐0.60, 1.00] |
| 1.7 anxiety/depression ‐ long term | 1 | 361 | Mean Difference (IV, Random, 95% CI) | 0.30 [‐0.46, 1.06] |
| 2 Leaving the study early: 1. Any reason Show forest plot | 1 | Risk Ratio (M‐H, Random, 95% CI) | Subtotals only | |
| 2.1 long term | 1 | 618 | Risk Ratio (M‐H, Random, 95% CI) | 1.32 [1.10, 1.58] |
| 3 Leaving the study early: 2. Specific Show forest plot | 1 | Risk Ratio (M‐H, Random, 95% CI) | Subtotals only | |
| 3.1 adverse events | 1 | 547 | Risk Ratio (M‐H, Random, 95% CI) | 0.71 [0.28, 1.77] |
| 3.2 insufficient response | 1 | 547 | Risk Ratio (M‐H, Random, 95% CI) | 0.81 [0.49, 1.35] |
| 3.3 withdrawn consent | 1 | 547 | Risk Ratio (M‐H, Random, 95% CI) | 2.54 [1.56, 4.16] |
| 3.4 due to weight gain | 1 | 547 | Risk Ratio (M‐H, Random, 95% CI) | 0.24 [0.03, 2.07] |
| 4 Adverse events: 1. General Show forest plot | 1 | Risk Ratio (M‐H, Random, 95% CI) | Subtotals only | |
| 4.1 serious | 1 | 547 | Risk Ratio (M‐H, Random, 95% CI) | 1.10 [0.80, 1.51] |
| 4.2 death | 1 | 618 | Risk Ratio (M‐H, Random, 95% CI) | 0.31 [0.06, 1.55] |
| 5 Adverse events: 2. Specific Show forest plot | 1 | Risk Ratio (M‐H, Random, 95% CI) | Subtotals only | |
| 5.1 agitation | 1 | 532 | Risk Ratio (M‐H, Random, 95% CI) | 1.98 [1.06, 3.68] |
| 5.2 anxiety | 1 | 532 | Risk Ratio (M‐H, Random, 95% CI) | 0.87 [0.58, 1.31] |
| 5.3 depression | 1 | 532 | Risk Ratio (M‐H, Random, 95% CI) | 1.45 [0.99, 2.12] |
| 5.4 psychosis | 1 | 532 | Risk Ratio (M‐H, Random, 95% CI) | 1.15 [0.87, 1.52] |
| 5.5 impotence/ejaculation failure | 1 | 547 | Risk Ratio (M‐H, Random, 95% CI) | 1.21 [0.17, 8.56] |
| 5.6 galactorrhoea | 1 | 547 | Risk Ratio (M‐H, Random, 95% CI) | 3.04 [0.59, 15.52] |
| 5.7 serious psychiatric symptoms | 1 | 547 | Risk Ratio (M‐H, Random, 95% CI) | 1.01 [0.64, 1.59] |
| 5.8 serious anxiety | 1 | 547 | Risk Ratio (M‐H, Random, 95% CI) | 1.42 [0.48, 4.16] |
| 5.9 suicide attempt | 1 | 547 | Risk Ratio (M‐H, Random, 95% CI) | 1.35 [0.56, 3.27] |
| 5.10 serious injury | 1 | 547 | Risk Ratio (M‐H, Random, 95% CI) | 2.02 [0.49, 8.39] |
| 5.11 weight increase | 1 | 547 | Risk Ratio (M‐H, Random, 95% CI) | 0.56 [0.42, 0.75] |
| 5.12 headache | 1 | 532 | Risk Ratio (M‐H, Random, 95% CI) | 1.56 [0.81, 3.01] |
| 5.13 insomnia | 1 | 532 | Risk Ratio (M‐H, Random, 95% CI) | 4.59 [2.61, 8.07] |
| 5.14 fatigue/somnolence | 1 | 532 | Risk Ratio (M‐H, Random, 95% CI) | 0.71 [0.35, 1.41] |
| 5.15 nasopharyngitis | 1 | 532 | Risk Ratio (M‐H, Random, 95% CI) | 1.17 [0.61, 2.21] |
| 5.16 diabetes mellitus | 1 | 547 | Risk Ratio (M‐H, Random, 95% CI) | 1.21 [0.08, 19.32] |
| 5.17 hyperglycaemia | 1 | 494 | Risk Ratio (M‐H, Random, 95% CI) | 1.0 [0.25, 3.95] |
| 5.18 hypoglycaemia | 1 | 547 | Risk Ratio (M‐H, Random, 95% CI) | 0.40 [0.02, 9.89] |
| 6 Adverse events: 3. Movement disorder Show forest plot | 1 | Risk Ratio (M‐H, Random, 95% CI) | Subtotals only | |
| 6.1 any extra pyramidal symptoms | 1 | 547 | Risk Ratio (M‐H, Random, 95% CI) | 1.67 [1.19, 2.36] |
| 6.2 tremor | 1 | 547 | Risk Ratio (M‐H, Random, 95% CI) | 2.29 [1.04, 5.06] |
| 6.3 tardive dyskinesia | 1 | 547 | Risk Ratio (M‐H, Random, 95% CI) | 1.21 [0.17, 8.56] |
| 6.4 hypertonia | 1 | 547 | Risk Ratio (M‐H, Random, 95% CI) | 1.35 [0.56, 3.27] |
| 6.5 dystonia | 1 | 547 | Risk Ratio (M‐H, Random, 95% CI) | 6.07 [0.29, 125.82] |
| 6.6 hyperkinesia | 1 | 547 | Risk Ratio (M‐H, Random, 95% CI) | 2.02 [1.01, 4.06] |
| 6.7 requiring antiparkinson drugs | 1 | 547 | Risk Ratio (M‐H, Random, 95% CI) | 1.26 [1.02, 1.56] |
| Outcome or subgroup title | No. of studies | No. of participants | Statistical method | Effect size |
| 1 Global state: 1. Relapse (any reason) Show forest plot | 2 | Risk Ratio (M‐H, Random, 95% CI) | Subtotals only | |
| 1.1 vs aripiprazole ‐ long term | 1 | 349 | Risk Ratio (M‐H, Random, 95% CI) | 1.05 [0.83, 1.33] |
| 1.2 vs general oral antipsychotics ‐ long term | 1 | 63 | Risk Ratio (M‐H, Random, 95% CI) | 2.13 [0.84, 5.43] |
| 2 Mental state: 1. Average change scores (PANSS, high score = worse) 1. total Show forest plot | 4 | Mean Difference (IV, Random, 95% CI) | Subtotals only | |
| 2.1 vs oral risperidone (non ITT data) ‐ short term | 2 | 591 | Mean Difference (IV, Random, 95% CI) | 1.05 [‐0.77, 2.88] |
| 2.2 vs olanzapine ‐ short term | 1 | 377 | Mean Difference (IV, Random, 95% CI) | 0.90 [‐2.25, 4.05] |
| 2.3 vs olanzapine ‐ long term | 1 | 361 | Mean Difference (IV, Random, 95% CI) | 0.10 [‐3.96, 4.16] |
| 2.4 vs aripiprazole ‐ long term | 1 | 349 | Mean Difference (IV, Random, 95% CI) | ‐0.10 [‐3.15, 2.95] |
| 3 Leaving the study early: 1. Any reason Show forest plot | 7 | Risk Ratio (M‐H, Random, 95% CI) | Subtotals only | |
| 3.1 vs aripiprazole | 2 | 723 | Risk Ratio (M‐H, Random, 95% CI) | 0.83 [0.53, 1.30] |
| 3.2 vs quetiapine | 1 | 666 | Risk Ratio (M‐H, Random, 95% CI) | 0.84 [0.74, 0.95] |
| 3.3 vs oral risperidone | 2 | 690 | Risk Ratio (M‐H, Random, 95% CI) | 1.28 [0.92, 1.79] |
| 3.4 vs any new generation antipsychotic | 1 | 77 | Risk Ratio (M‐H, Random, 95% CI) | 0.72 [0.55, 0.95] |
| 3.5 vs olanzapine | 1 | 618 | Risk Ratio (M‐H, Random, 95% CI) | 1.32 [1.10, 1.58] |
| 3.6 vs any oral antipsychotic | 1 | 382 | Risk Ratio (M‐H, Random, 95% CI) | 1.25 [0.93, 1.68] |
| 4 Adverse events: 1. Death Show forest plot | 5 | Risk Ratio (M‐H, Random, 95% CI) | Subtotals only | |
| 4.1 vs olanzapine | 1 | 618 | Risk Ratio (M‐H, Random, 95% CI) | 0.31 [0.06, 1.55] |
| 4.2 vs oral risperidone | 1 | 640 | Risk Ratio (M‐H, Random, 95% CI) | 0.34 [0.01, 8.20] |
| 4.3 vs any oral antipsychotic | 1 | 382 | Risk Ratio (M‐H, Random, 95% CI) | 1.01 [0.14, 7.10] |
| 4.4 vs aripiprazole | 2 | 729 | Risk Ratio (M‐H, Random, 95% CI) | 0.98 [0.13, 7.36] |
| 4.5 vs quetiapine | 1 | 666 | Risk Ratio (M‐H, Random, 95% CI) | 1.54 [0.26, 9.14] |
| 5 Adverse events: 1. General: a. any Show forest plot | 3 | Risk Ratio (M‐H, Random, 95% CI) | Subtotals only | |
| 5.1 vs aripiprazole | 2 | 729 | Risk Ratio (M‐H, Random, 95% CI) | 0.99 [0.87, 1.14] |
| 5.2 vs oral risperidone | 1 | 640 | Risk Ratio (M‐H, Random, 95% CI) | 1.04 [0.91, 1.18] |
| 5.3 vs quetiapine | 1 | 666 | Risk Ratio (M‐H, Random, 95% CI) | 0.98 [0.89, 1.09] |
| 6 Adverse events: 1. General: b. serious Show forest plot | 3 | Risk Ratio (M‐H, Random, 95% CI) | Subtotals only | |
| 6.1 vs quetiapine | 1 | 666 | Risk Ratio (M‐H, Random, 95% CI) | 0.84 [0.62, 1.13] |
| 6.2 vs aripiprazole | 2 | 729 | Risk Ratio (M‐H, Random, 95% CI) | 0.96 [0.66, 1.39] |
| 6.3 vs olanzapine | 1 | 547 | Risk Ratio (M‐H, Random, 95% CI) | 1.10 [0.80, 1.51] |
| 7 Adverse events: 2. Movement disorder: a. any extra pyramidal symptoms Show forest plot | 4 | Risk Ratio (M‐H, Random, 95% CI) | Subtotals only | |
| 7.1 vs aripiprazole | 2 | 729 | Risk Ratio (M‐H, Random, 95% CI) | 1.19 [0.91, 1.55] |
| 7.2 vs quetiapine | 1 | 666 | Risk Ratio (M‐H, Random, 95% CI) | 1.83 [1.07, 3.15] |
| 7.3 vs olanzapine | 1 | 547 | Risk Ratio (M‐H, Random, 95% CI) | 1.67 [1.19, 2.36] |
| 7.4 vs oral risperidone | 1 | 640 | Risk Ratio (M‐H, Random, 95% CI) | 1.05 [0.59, 1.88] |
| Outcome or subgroup title | No. of studies | No. of participants | Statistical method | Effect size |
| 1 Global State: 1. CGI‐S mean change from baseline (high score = worse) Show forest plot | 2 | 1326 | Mean Difference (IV, Random, 95% CI) | ‐0.07 [‐0.26, 0.11] |
| 1.1 medium term | 2 | 1326 | Mean Difference (IV, Random, 95% CI) | ‐0.07 [‐0.26, 0.11] |
| 2 Global state: 2. Schedule for Deficit Syndrome (SDS) scale (mean change from baseline, high score = worse) Show forest plot | 1 | Mean Difference (IV, Random, 95% CI) | Subtotals only | |
| 2.1 medium term | 1 | 913 | Mean Difference (IV, Random, 95% CI) | 0.10 [‐0.29, 0.49] |
| 3 Mental state: 1. PANSS scores (high score = worse) ‐ medium term Show forest plot | 2 | Mean Difference (IV, Random, 95% CI) | Subtotals only | |
| 3.1 total mean change to endpoint (ITT and per protocol data)* | 2 | 1326 | Mean Difference (IV, Random, 95% CI) | 1.12 [‐2.79, 5.02] |
| 3.2 positive symptoms score change to endpoint | 2 | 1326 | Mean Difference (IV, Random, 95% CI) | 0.66 [‐1.39, 2.71] |
| 3.3 negative symptoms score change to endpoint (ITT data) | 2 | 1326 | Mean Difference (IV, Random, 95% CI) | 0.06 [‐0.47, 0.59] |
| 3.4 disorganised thoughts score change to endpoint (ITT data) | 2 | 1326 | Mean Difference (IV, Random, 95% CI) | 0.02 [‐0.55, 0.59] |
| 3.5 uncontrolled hostility/excitement score change to endpoint (ITT data) | 2 | 1326 | Mean Difference (IV, Random, 95% CI) | ‐0.04 [‐0.50, 0.41] |
| 3.6 anxiety/depression score change to endpoint (ITT data) | 2 | 1326 | Mean Difference (IV, Random, 95% CI) | 0.01 [‐0.67, 0.69] |
| 4 Mental state: 2. Improved by 30% in total PANSS score (ITT data) Show forest plot | 2 | Risk Ratio (M‐H, Random, 95% CI) | Subtotals only | |
| 4.1 medium term | 2 | 1326 | Risk Ratio (M‐H, Random, 95% CI) | 1.01 [0.83, 1.23] |
| 5 General functioning: Personal and Social Performance (PSP) scale (high score = better) Show forest plot | 2 | 1326 | Mean Difference (IV, Random, 95% CI) | 0.65 [‐0.69, 1.98] |
| 5.1 mean endpoint ‐ medium term | 2 | 1326 | Mean Difference (IV, Random, 95% CI) | 0.65 [‐0.69, 1.98] |
| 6 Leaving the study early: 1. Any reason Show forest plot | 3 | Risk Ratio (M‐H, Random, 95% CI) | Subtotals only | |
| 6.1 Lack of efficacy ‐ medium term | 2 | 1672 | Risk Ratio (M‐H, Random, 95% CI) | 0.71 [0.29, 1.75] |
| 6.2 Lack of efficacy ‐ long term | 1 | 749 | Risk Ratio (M‐H, Random, 95% CI) | 0.60 [0.45, 0.81] |
| 6.3 Adverse events ‐ medium term | 2 | 1672 | Risk Ratio (M‐H, Random, 95% CI) | 0.68 [0.28, 1.65] |
| 6.4 Adverse events ‐ long term | 1 | 749 | Risk Ratio (M‐H, Random, 95% CI) | 0.88 [0.53, 1.48] |
| 6.5 Patient choice/withdrawn consent ‐ medium term | 2 | 1672 | Risk Ratio (M‐H, Random, 95% CI) | 0.61 [0.22, 1.71] |
| 6.6 Patient choice/withdrawn consent ‐ long term | 1 | 749 | Risk Ratio (M‐H, Random, 95% CI) | 1.15 [0.83, 1.61] |
| 6.7 Lost to follow‐up ‐ medium term | 2 | 1672 | Risk Ratio (M‐H, Random, 95% CI) | 1.61 [0.93, 2.79] |
| 6.8 Lost to follow‐up ‐ long term | 1 | 749 | Risk Ratio (M‐H, Random, 95% CI) | 0.87 [0.39, 1.91] |
| 6.9 Pregnancy ‐ medium term | 2 | 1672 | Risk Ratio (M‐H, Random, 95% CI) | 0.26 [0.03, 2.32] |
| 6.10 Pregnancy ‐ long term | 1 | 749 | Risk Ratio (M‐H, Random, 95% CI) | 1.02 [0.06, 16.32] |
| 6.11 Death ‐ long term | 1 | 749 | Risk Ratio (M‐H, Random, 95% CI) | 0.20 [0.01, 4.25] |
| 6.12 Other ‐ medium term | 2 | 1672 | Risk Ratio (M‐H, Random, 95% CI) | 0.77 [0.45, 1.32] |
| 6.13 Other ‐ long term | 1 | 749 | Risk Ratio (M‐H, Random, 95% CI) | 1.09 [0.67, 1.78] |
| 6.14 Any reason ‐ medium term | 2 | 1672 | Risk Ratio (M‐H, Random, 95% CI) | 0.77 [0.51, 1.17] |
| 6.15 Any reason ‐ long term | 1 | 749 | Risk Ratio (M‐H, Random, 95% CI) | 0.85 [0.75, 0.97] |
| 7 Adverse events: 1. General Show forest plot | 3 | Risk Ratio (M‐H, Random, 95% CI) | Subtotals only | |
| 7.1 overall rate ‐ medium term | 2 | 1666 | Risk Ratio (M‐H, Random, 95% CI) | 1.20 [0.33, 4.42] |
| 7.2 overall rate ‐ long term | 1 | 747 | Risk Ratio (M‐H, Random, 95% CI) | 0.74 [0.58, 0.95] |
| 7.3 worsening of schizophrenia ‐ medium term | 2 | 1666 | Risk Ratio (M‐H, Random, 95% CI) | 0.82 [0.40, 1.69] |
| 7.4 worsening of psychiatric disorders ‐ medium term | 1 | 1214 | Risk Ratio (M‐H, Random, 95% CI) | 0.54 [0.22, 1.34] |
| 7.5 death ‐ medium term | 2 | 1666 | Risk Ratio (M‐H, Random, 95% CI) | 0.96 [0.14, 6.54] |
| 7.6 death ‐ long term | 1 | 749 | Risk Ratio (M‐H, Random, 95% CI) | 0.20 [0.01, 4.25] |
| 8 Adverse events: 2. Specific Show forest plot | 3 | Risk Ratio (M‐H, Random, 95% CI) | Subtotals only | |
| 8.1 overall rate ‐ medium term | 2 | 1666 | Risk Ratio (M‐H, Random, 95% CI) | 0.96 [0.86, 1.08] |
| 8.2 overall rate ‐ long term | 1 | 747 | Risk Ratio (M‐H, Random, 95% CI) | 1.03 [0.95, 1.11] |
| 8.3 insomnia ‐ medium term | 1 | 1214 | Risk Ratio (M‐H, Random, 95% CI) | 0.72 [0.49, 1.05] |
| 8.4 insomnia ‐ long term | 1 | 747 | Risk Ratio (M‐H, Random, 95% CI) | 0.99 [0.71, 1.40] |
| 8.5 psychotic disorder ‐ long term | 1 | 747 | Risk Ratio (M‐H, Random, 95% CI) | 0.86 [0.59, 1.24] |
| 8.6 worsening of schizophrenia ‐ long term | 1 | 747 | Risk Ratio (M‐H, Random, 95% CI) | 0.76 [0.49, 1.16] |
| 8.7 anxiety ‐ medium term | 1 | 1214 | Risk Ratio (M‐H, Random, 95% CI) | 0.50 [0.26, 0.96] |
| 8.8 anxiety ‐ long term | 1 | 747 | Risk Ratio (M‐H, Random, 95% CI) | 1.49 [1.01, 2.20] |
| 8.9 headache ‐ long term | 1 | 747 | Risk Ratio (M‐H, Random, 95% CI) | 1.21 [0.78, 1.87] |
| 8.10 constipation ‐ medium term | 1 | 1214 | Risk Ratio (M‐H, Random, 95% CI) | 3.79 [1.42, 10.08] |
| 8.11 injection site pain ‐ medium term | 2 | 1666 | Risk Ratio (M‐H, Random, 95% CI) | 0.16 [0.07, 0.38] |
| 8.12 somnolence ‐ medium term | 1 | 452 | Risk Ratio (M‐H, Random, 95% CI) | 0.56 [0.21, 1.49] |
| 8.13 weight gain (proportion of participants with >7% increase) ‐ medium term | 1 | 452 | Risk Ratio (M‐H, Random, 95% CI) | 1.12 [0.72, 1.75] |
| 8.14 tachycardia ‐ medium term | 1 | 452 | Risk Ratio (M‐H, Random, 95% CI) | 1.03 [0.26, 4.06] |
| 8.15 tachycardia ‐ long term | 1 | 747 | Risk Ratio (M‐H, Random, 95% CI) | 0.34 [0.11, 1.05] |
| 9 Adverse events: 3. Prolactin related Show forest plot | 3 | Risk Ratio (M‐H, Random, 95% CI) | Subtotals only | |
| 9.1 amenorrhoea ‐ medium term | 2 | 784 | Risk Ratio (M‐H, Random, 95% CI) | 1.78 [0.24, 13.02] |
| 9.2 galactorrhoea ‐ medium term | 1 | 271 | Risk Ratio (M‐H, Random, 95% CI) | 0.37 [0.02, 8.92] |
| 9.3 hyperprolactinaemia ‐ medium term | 1 | 452 | Risk Ratio (M‐H, Random, 95% CI) | 5.13 [0.60, 43.60] |
| 9.4 erectile dysfunction ‐ medium term | 1 | 701 | Risk Ratio (M‐H, Random, 95% CI) | 0.80 [0.18, 3.53] |
| 9.5 increase in serum prolactin ‐ medium term | 1 | 452 | Risk Ratio (M‐H, Random, 95% CI) | 0.72 [0.35, 1.48] |
| 9.6 amenorrhoea‐galactorrhoea syndrome ‐ medium term | 1 | 271 | Risk Ratio (M‐H, Random, 95% CI) | 3.3 [0.14, 80.29] |
| 9.7 any prolactin related ‐ medium term | 2 | 1666 | Risk Ratio (M‐H, Random, 95% CI) | 1.02 [0.61, 1.71] |
| 9.8 proportion of male participants with abnormally high prolactin ‐ long term | 1 | 424 | Risk Ratio (M‐H, Random, 95% CI) | 1.68 [1.32, 2.14] |
| 9.9 proportion of female participants with abnormally high prolactin ‐ long term | 1 | 294 | Risk Ratio (M‐H, Random, 95% CI) | 1.21 [0.95, 1.55] |
| 10 Adverse events: 4. Movement disorder Show forest plot | 3 | Risk Ratio (M‐H, Random, 95% CI) | Subtotals only | |
| 10.1 akathisia ‐ medium term | 1 | 452 | Risk Ratio (M‐H, Random, 95% CI) | 1.51 [0.98, 2.31] |
| 10.2 tremor ‐ medium term | 1 | 452 | Risk Ratio (M‐H, Random, 95% CI) | 1.71 [1.07, 2.74] |
| 10.3 tardive dyskinesia ‐ medium term | 1 | 1214 | Risk Ratio (M‐H, Random, 95% CI) | 1.00 [0.06, 15.90] |
| 10.4 requiring use of anti‐EPS medication ‐ medium term | 2 | 1666 | Risk Ratio (M‐H, Random, 95% CI) | 1.46 [1.18, 1.80] |
| 10.5 hyperkinesia ‐ long term | 1 | 747 | Risk Ratio (M‐H, Random, 95% CI) | 1.66 [1.00, 2.73] |
| 10.6 neuroleptic malignant syndrome ‐ long term | 1 | 747 | Risk Ratio (M‐H, Random, 95% CI) | 0.34 [0.01, 8.40] |
| 11 Adverse events: 5. Body weight (mean increase) Show forest plot | 3 | 2350 | Mean Difference (IV, Random, 95% CI) | 0.18 [‐0.36, 0.72] |
| 11.1 medium term | 2 | 1666 | Mean Difference (IV, Random, 95% CI) | ‐0.07 [‐0.38, 0.24] |
| 11.2 long term | 1 | 684 | Mean Difference (IV, Random, 95% CI) | 1.0 [0.13, 1.87] |
| 12 Adverse events: 6. Mean prolactin level increase (ng/mL) Show forest plot | 2 | Mean Difference (IV, Random, 95% CI) | Subtotals only | |
| 12.1 female participants | 2 | 807 | Mean Difference (IV, Random, 95% CI) | ‐3.40 [‐12.65, 5.85] |
| 12.2 male participants | 2 | 1125 | Mean Difference (IV, Random, 95% CI) | ‐0.43 [‐5.88, 5.03] |
| 13 Adverse events: 7. Glucose related Show forest plot | 3 | Risk Ratio (M‐H, Random, 95% CI) | Subtotals only | |
| 13.1 increased blood glucose ‐ long term | 1 | 747 | Risk Ratio (M‐H, Random, 95% CI) | 1.54 [0.44, 5.43] |
| 13.2 hyperglycaemia ‐ long term | 1 | 747 | Risk Ratio (M‐H, Random, 95% CI) | 1.37 [0.31, 6.09] |
| 13.3 diabetes mellitus ‐ long term | 1 | 747 | Risk Ratio (M‐H, Random, 95% CI) | 4.12 [0.46, 36.68] |
| 13.4 glycosuria ‐ long term | 1 | 747 | Risk Ratio (M‐H, Random, 95% CI) | 0.34 [0.01, 8.40] |
| 13.5 ketonuria ‐ long term | 1 | 747 | Risk Ratio (M‐H, Random, 95% CI) | 0.34 [0.01, 8.40] |
| 13.6 urine ketone body present ‐ long term | 1 | 747 | Risk Ratio (M‐H, Random, 95% CI) | 0.34 [0.01, 8.40] |
| 13.7 hypoglycaemia ‐ long term | 1 | 747 | Risk Ratio (M‐H, Random, 95% CI) | 3.09 [0.13, 75.59] |
| 13.8 any glucose related ‐ medium term | 2 | 1666 | Risk Ratio (M‐H, Random, 95% CI) | 1.76 [0.52, 5.98] |
| 13.9 any glucose related ‐ long term | 1 | 747 | Risk Ratio (M‐H, Random, 95% CI) | 1.80 [0.77, 4.25] |
| 14 Adverse events: 8. Injection site pain (mean (sd) Visual Analogue Scale score (0‐100mm)) Show forest plot | 1 | Mean Difference (IV, Random, 95% CI) | Subtotals only | |
| 14.1 at baseline | 1 | 747 | Mean Difference (IV, Random, 95% CI) | 1.80 [‐0.24, 3.84] |
| 14.2 at endpoint | 1 | 747 | Mean Difference (IV, Random, 95% CI) | 0.0 [‐1.07, 1.07] |
| Outcome or subgroup title | No. of studies | No. of participants | Statistical method | Effect size |
| 1 Mental state: 1. Total endpoint scores (PANNS, high score = worse) Show forest plot | 1 | Mean Difference (IV, Random, 95% CI) | Subtotals only | |
| 1.1 short term | 1 | 49 | Mean Difference (IV, Random, 95% CI) | 0.70 [‐8.12, 9.52] |
| 1.2 medium term | 1 | 46 | Mean Difference (IV, Random, 95% CI) | ‐0.10 [‐9.02, 8.82] |
| 1.3 long term | 1 | 43 | Mean Difference (IV, Random, 95% CI) | 1.80 [‐10.04, 13.64] |
| 2 Leaving the study early Show forest plot | 1 | Risk Ratio (M‐H, Random, 95% CI) | Subtotals only | |
| 2.1 before beginning assigned treatment | 1 | 62 | Risk Ratio (M‐H, Random, 95% CI) | 7.50 [1.00, 56.44] |
| 2.2 by 6 months | 1 | 62 | Risk Ratio (M‐H, Random, 95% CI) | 3.05 [1.12, 8.31] |
| 2.3 due to increased psychiatric symptoms | 1 | 62 | Risk Ratio (M‐H, Random, 95% CI) | 2.81 [0.31, 25.58] |
| 2.4 due to EPS effects | 1 | 62 | Risk Ratio (M‐H, Random, 95% CI) | 0.31 [0.01, 7.40] |
| 2.5 due to weight gain and hypertension | 1 | 62 | Risk Ratio (M‐H, Random, 95% CI) | 2.82 [0.12, 66.62] |
| 2.6 due to participant preference | 1 | 62 | Risk Ratio (M‐H, Random, 95% CI) | 0.94 [0.06, 14.33] |
| 3 Hospitalisation by 6 months Show forest plot | 1 | Risk Ratio (M‐H, Random, 95% CI) | Subtotals only | |
| 3.1 medium term | 1 | 62 | Risk Ratio (M‐H, Random, 95% CI) | 0.63 [0.11, 3.48] |
| 4 Adverse events: 1. Continuous outcomes (skew) Show forest plot | Other data | No numeric data | ||
| 4.1 Change in BMI ‐ short term (skew) | Other data | No numeric data | ||
| 4.2 Change in BMI ‐ medium term (skew) | Other data | No numeric data | ||
| 4.3 Change in BMI ‐ long term (skew) | Other data | No numeric data | ||
| 4.4 Prolactin endpoint levels (ng/mL) ‐ short term (skew) | Other data | No numeric data | ||
| 4.5 Prolactin endpoint levels (ng/mL) ‐ medium term (skew) | Other data | No numeric data | ||
| 4.6 Prolactin endpoint levels (ng/mL) ‐ long term (skew) | Other data | No numeric data | ||
| 5 Adverse events: 2. Sexual experiencesm, total endpoint (ASEX, high score = worse) Show forest plot | 1 | Mean Difference (IV, Fixed, 95% CI) | Subtotals only | |
| 5.1 short term | 1 | 44 | Mean Difference (IV, Fixed, 95% CI) | 1.70 [‐1.26, 4.66] |
| 5.2 medium term | 1 | 41 | Mean Difference (IV, Fixed, 95% CI) | 1.30 [‐2.30, 4.90] |
| 5.3 long term | 1 | 40 | Mean Difference (IV, Fixed, 95% CI) | ‐0.10 [‐4.08, 3.88] |