Risperidona (de depósito) para la esquizofrenia
Información
- DOI:
- https://doi.org/10.1002/14651858.CD004161.pub2Copiar DOI

- Base de datos:
-
- Cochrane Database of Systematic Reviews
- Versión publicada:
-
- 14 abril 2016see what's new
- Tipo:
-
- Intervention
- Etapa:
-
- Review
- Grupo Editorial Cochrane:
-
Grupo Cochrane de Esquizofrenia
- Copyright:
-
- Copyright © 2016 The Cochrane Collaboration. Published by John Wiley & Sons, Ltd.
Cifras del artículo
Altmetric:
Citado por:
Autores
Contributions of authors
Prakash Hosalli ‐ initiated the review, selected studies, extracted data, wrote the protocol and the review.
Steph Sampson ‐ checked data extraction, contributed towards review update development, economic evaluation of included studies.
Vivek Furtado ‐ economic evaluation of included studies.
John Davis ‐ helped write the protocol, independently selected and extracted data and helped write the review.
Sources of support
Internal sources
-
Leeds Community Mental Health NHS trust, UK.
-
University of Leeds, UK.
-
University of Illinois at Chicago, USA.
External sources
-
National Institute for Health Research (NIHR), UK.
Cochrane Collaboration Programme Grant 2011; Reference number: 10/4001/15
Declarations of interest
Prakash Hosalli ‐ none known.
Steph Sampson ‐ none known.
Vivek Furtado ‐ none known.
John Davis ‐ none known.
Acknowledgements
The Cochrane Schiozphrenia Group provide a template for the Methods section, we have used this template and adapted for our criteria.
We would like to thank Thomas Neely who contributed to writing, trial selection and data extraction for the 2015 version. We would also like to thank Nancy Covell for her assistance in obtaining further information to an included study, and Nicholas Keks for providing further information relating to statistical analysis in his study.
We would also like to thank Ben Gray for writing our Plain language summary, and copy editors for making the review read better and look consistent.
“This project was supported by the National Institute for Health Research, via Cochrane Infrastructure funding to the Schizophrenia Group. The views and opinions expressed therein are those of the authors and do not necessarily reflect those of the Systematic Reviews Programme, NIHR, NHS or the Department of Health.”
Version history
| Published | Title | Stage | Authors | Version |
| 2016 Apr 14 | Risperidone (depot) for schizophrenia | Review | Stephanie Sampson, Prakash Hosalli, Vivek A Furtado, John M Davis | |
| 2003 Oct 20 | Depot risperidone for schizophrenia | Review | Prakash Hosalli, John M Davis | |
Keywords
MeSH
Medical Subject Headings (MeSH) Keywords
- Administration, Oral;
- Antipsychotic Agents [*therapeutic use];
- Aripiprazole [therapeutic use];
- Benzodiazepines [therapeutic use];
- Delayed‐Action Preparations [therapeutic use];
- Olanzapine;
- Patient Dropouts [statistics & numerical data];
- Quetiapine Fumarate [therapeutic use];
- Randomized Controlled Trials as Topic;
- Risperidone [*therapeutic use];
- Schizophrenia [*drug therapy];
Medical Subject Headings Check Words
Humans;
PICO

Study flow diagram: 2010 and 2012, 2015 updated search


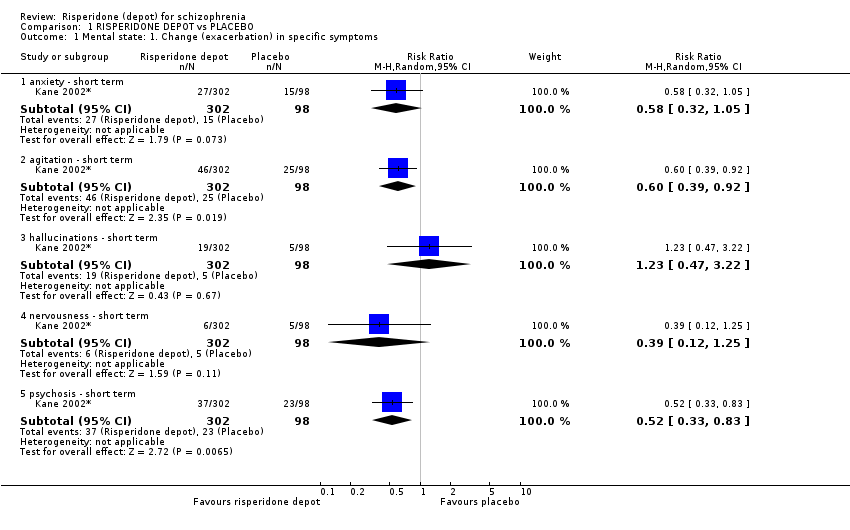
Comparison 1 RISPERIDONE DEPOT vs PLACEBO, Outcome 1 Mental state: 1. Change (exacerbation) in specific symptoms.
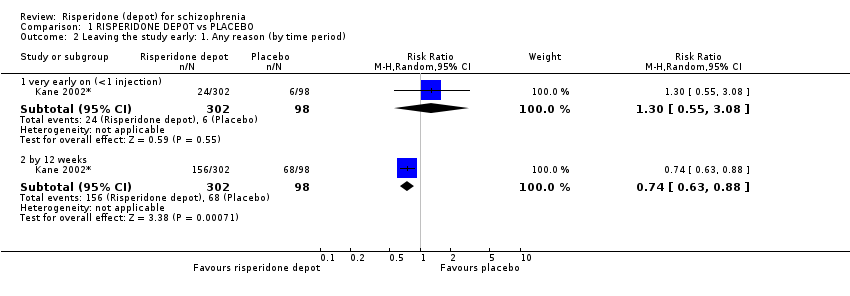
Comparison 1 RISPERIDONE DEPOT vs PLACEBO, Outcome 2 Leaving the study early: 1. Any reason (by time period).
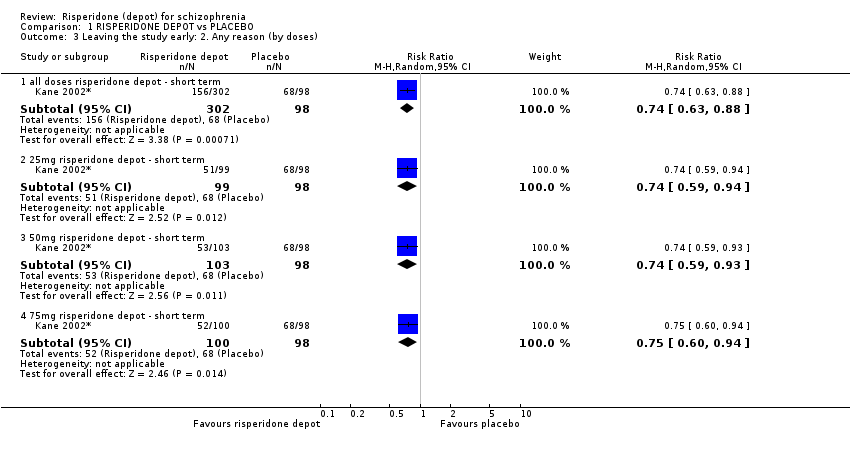
Comparison 1 RISPERIDONE DEPOT vs PLACEBO, Outcome 3 Leaving the study early: 2. Any reason (by doses).

Comparison 1 RISPERIDONE DEPOT vs PLACEBO, Outcome 4 Leaving the study early: 3. Because of insufficient response (by doses).
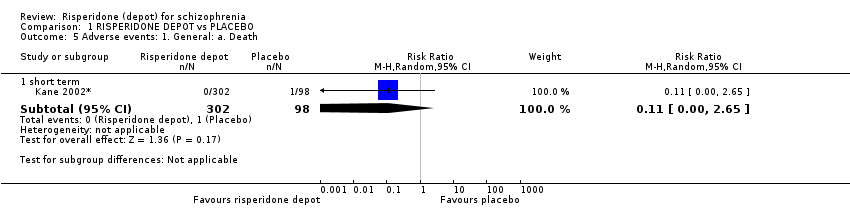
Comparison 1 RISPERIDONE DEPOT vs PLACEBO, Outcome 5 Adverse events: 1. General: a. Death.

Comparison 1 RISPERIDONE DEPOT vs PLACEBO, Outcome 6 Adverse events: 1. General: b. Severe adverse event (by doses).

Comparison 1 RISPERIDONE DEPOT vs PLACEBO, Outcome 7 Adverse events: 1. General: c. Adverse event necessitating withdrawal from study (by doses).

Comparison 1 RISPERIDONE DEPOT vs PLACEBO, Outcome 8 Adverse events: 2. Specific: a. Cardiovascular.

Comparison 1 RISPERIDONE DEPOT vs PLACEBO, Outcome 9 Adverse events: 2. Specific: b. Gastrointestinal.
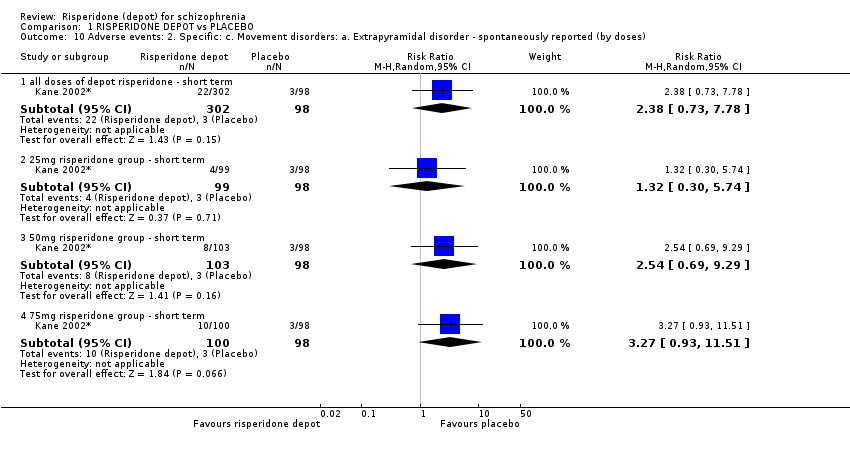
Comparison 1 RISPERIDONE DEPOT vs PLACEBO, Outcome 10 Adverse events: 2. Specific: c. Movement disorders: a. Extrapyramidal disorder ‐ spontaneously reported (by doses).
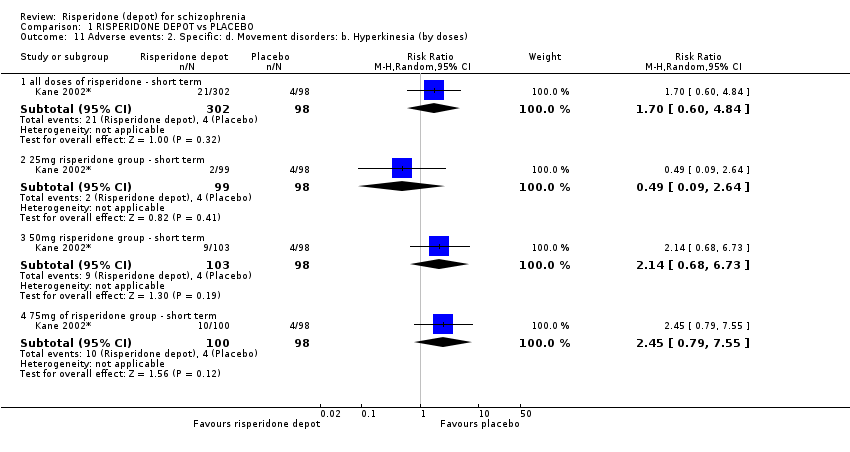
Comparison 1 RISPERIDONE DEPOT vs PLACEBO, Outcome 11 Adverse events: 2. Specific: d. Movement disorders: b. Hyperkinesia (by doses).

Comparison 1 RISPERIDONE DEPOT vs PLACEBO, Outcome 12 Adverse events: 2. Specific: e. Movement disorders: c. Hypertonia (by doses).

Comparison 1 RISPERIDONE DEPOT vs PLACEBO, Outcome 13 Adverse events: 2. Specific: f. Pain.

Comparison 1 RISPERIDONE DEPOT vs PLACEBO, Outcome 14 Adverse events: 2. Specific: g. Salivation.

Comparison 1 RISPERIDONE DEPOT vs PLACEBO, Outcome 15 Adverse events: 2. Specific: h. Sleep disturbances.

Comparison 1 RISPERIDONE DEPOT vs PLACEBO, Outcome 16 Adverse events: 2. Specific: i. Weight gain.
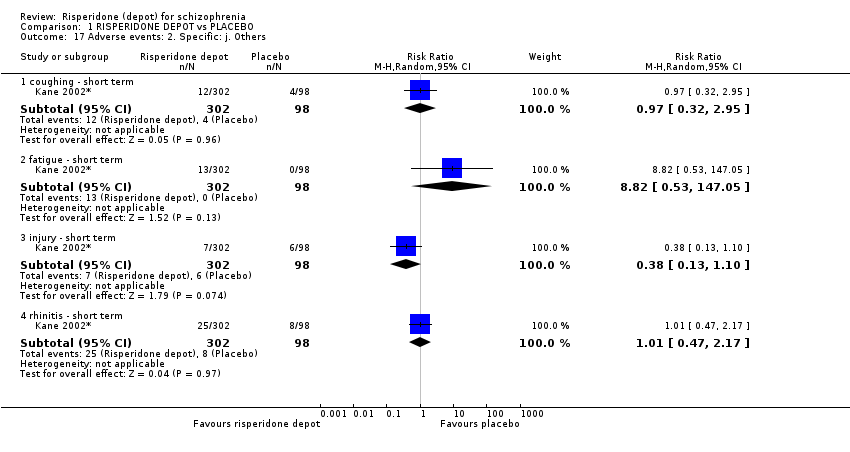
Comparison 1 RISPERIDONE DEPOT vs PLACEBO, Outcome 17 Adverse events: 2. Specific: j. Others.

Comparison 2 RISPERIDONE DEPOT vs GENERAL ORAL ANTIPSYCHOTICS, Outcome 1 Global state: 1. Relapse (any reason).

Comparison 2 RISPERIDONE DEPOT vs GENERAL ORAL ANTIPSYCHOTICS, Outcome 2 Global state: 2. Needing use of benzodiazepine or sedative drugs.
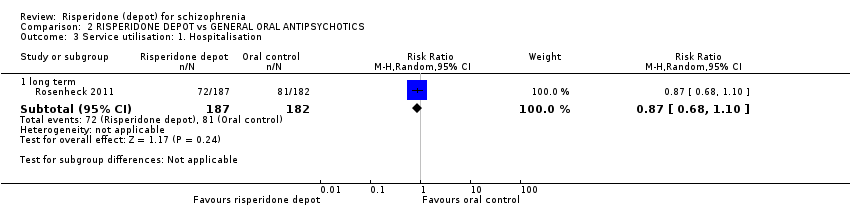
Comparison 2 RISPERIDONE DEPOT vs GENERAL ORAL ANTIPSYCHOTICS, Outcome 3 Service utilisation: 1. Hospitalisation.
| Study | Intervention | Mean | SD | N |
| long term | ||||
| Rosenheck 2011 | Risperidone depot | 122.4 | 130.9 | 187 |
| Rosenheck 2011 | Oral control | 136.5 | 137 | 182 |
Comparison 2 RISPERIDONE DEPOT vs GENERAL ORAL ANTIPSYCHOTICS, Outcome 4 Service utilisation: 2. Outpatient care ‐ number of outpatient visits (skewed data).
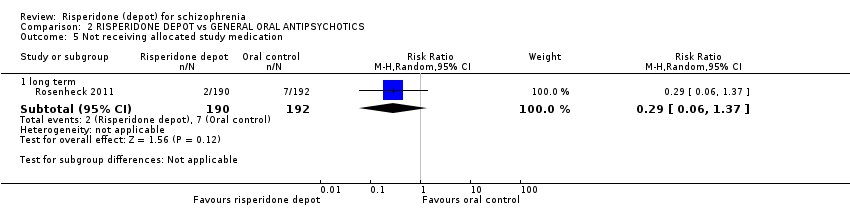
Comparison 2 RISPERIDONE DEPOT vs GENERAL ORAL ANTIPSYCHOTICS, Outcome 5 Not receiving allocated study medication.

Comparison 2 RISPERIDONE DEPOT vs GENERAL ORAL ANTIPSYCHOTICS, Outcome 6 Leaving the study early: 1. Any reason.

Comparison 2 RISPERIDONE DEPOT vs GENERAL ORAL ANTIPSYCHOTICS, Outcome 7 Leaving the study early: 2. Specific.

Comparison 2 RISPERIDONE DEPOT vs GENERAL ORAL ANTIPSYCHOTICS, Outcome 8 Adverse events: 1. General: a. Death.

Comparison 2 RISPERIDONE DEPOT vs GENERAL ORAL ANTIPSYCHOTICS, Outcome 9 Adverse events: 2. Specific.

Comparison 2 RISPERIDONE DEPOT vs GENERAL ORAL ANTIPSYCHOTICS, Outcome 10 Adverse events: Nervous system disorders (inc. EPS).

Comparison 3 RISPERIDONE DEPOT vs ORAL RISPERIDONE, Outcome 1 Global state: 1. Moderate to severely ill at end of study period (CGI rating).

Comparison 3 RISPERIDONE DEPOT vs ORAL RISPERIDONE, Outcome 2 Global state: 2. Mean change from baseline (CGI‐S, high score = worse).

Comparison 3 RISPERIDONE DEPOT vs ORAL RISPERIDONE, Outcome 3 Global state: 3. Mean (SD) GAF score change to endpoint.

Comparison 3 RISPERIDONE DEPOT vs ORAL RISPERIDONE, Outcome 4 Global state: 4. Needing use of benzodiazepine or sedative drugs.

Comparison 3 RISPERIDONE DEPOT vs ORAL RISPERIDONE, Outcome 5 Mental state: 1. Average change/endpoint scores (PANSS, high score = worse).
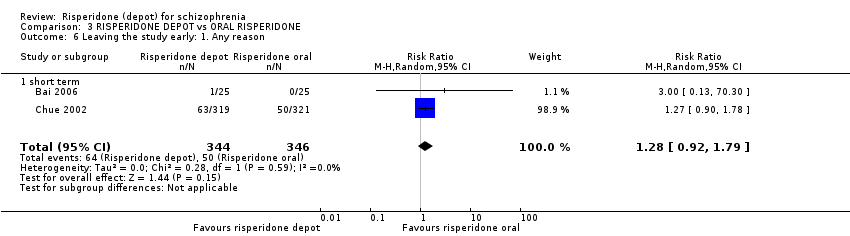
Comparison 3 RISPERIDONE DEPOT vs ORAL RISPERIDONE, Outcome 6 Leaving the study early: 1. Any reason.
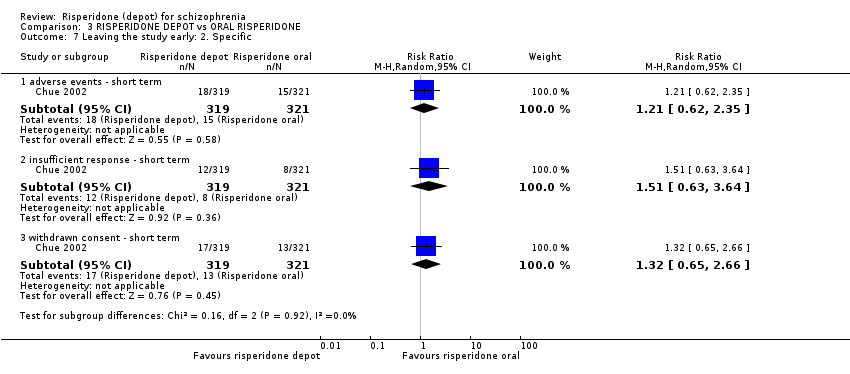
Comparison 3 RISPERIDONE DEPOT vs ORAL RISPERIDONE, Outcome 7 Leaving the study early: 2. Specific.

Comparison 3 RISPERIDONE DEPOT vs ORAL RISPERIDONE, Outcome 8 Quality of life: Mean (SD) SF‐36 score change/endpoint (high score = better).

Comparison 3 RISPERIDONE DEPOT vs ORAL RISPERIDONE, Outcome 9 Adverse events: 1. General.
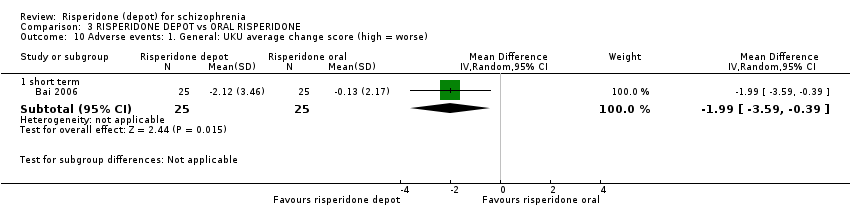
Comparison 3 RISPERIDONE DEPOT vs ORAL RISPERIDONE, Outcome 10 Adverse events: 1. General: UKU average change score (high = worse).
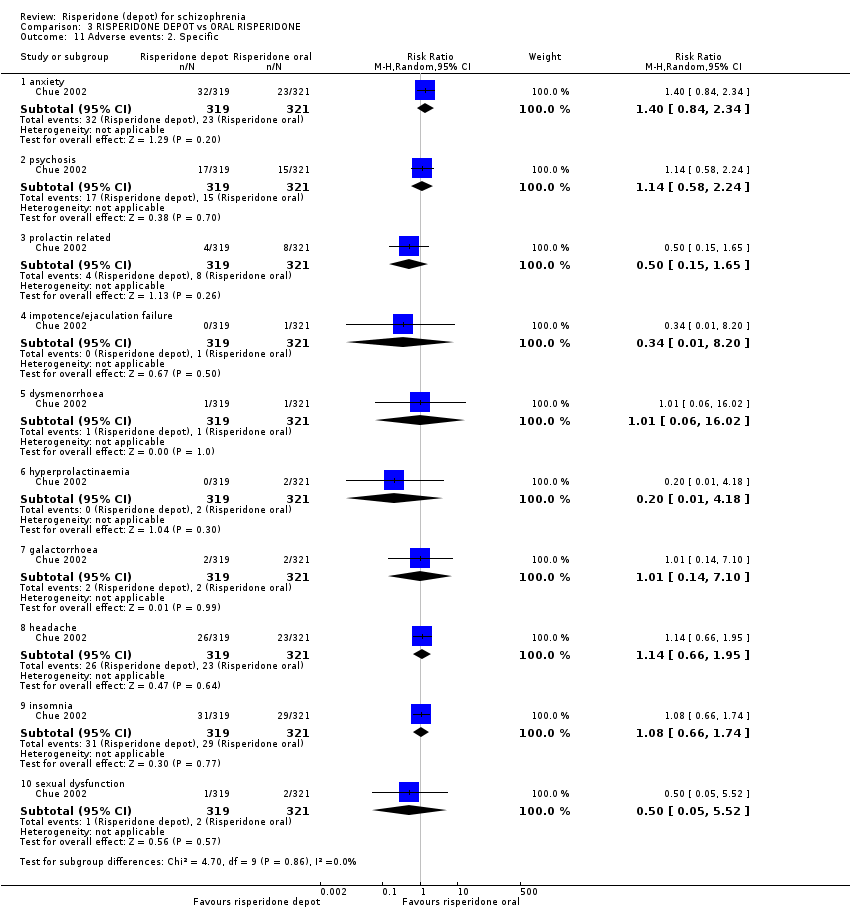
Comparison 3 RISPERIDONE DEPOT vs ORAL RISPERIDONE, Outcome 11 Adverse events: 2. Specific.

Comparison 3 RISPERIDONE DEPOT vs ORAL RISPERIDONE, Outcome 12 Adverse events: 2. Specific: Mean (SD) weight increase in kg.
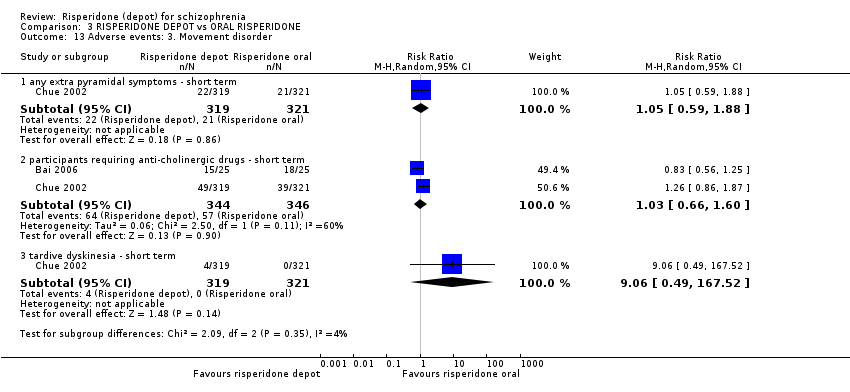
Comparison 3 RISPERIDONE DEPOT vs ORAL RISPERIDONE, Outcome 13 Adverse events: 3. Movement disorder.
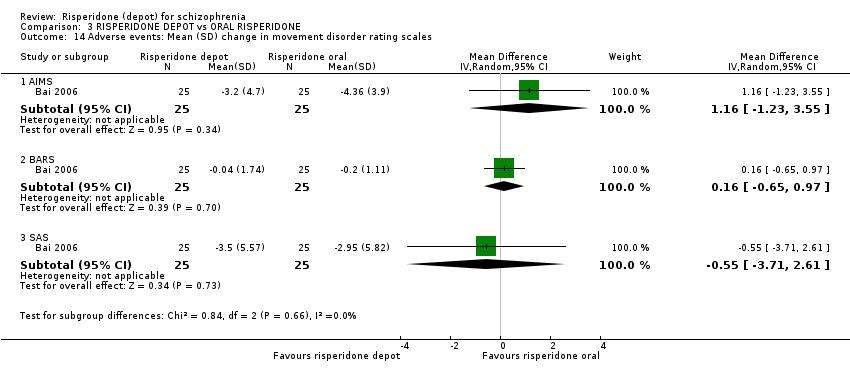
Comparison 3 RISPERIDONE DEPOT vs ORAL RISPERIDONE, Outcome 14 Adverse events: Mean (SD) change in movement disorder rating scales.
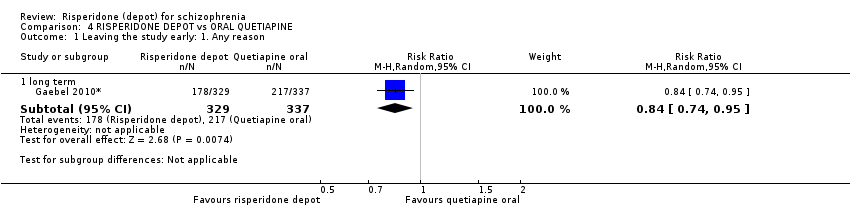
Comparison 4 RISPERIDONE DEPOT vs ORAL QUETIAPINE, Outcome 1 Leaving the study early: 1. Any reason.
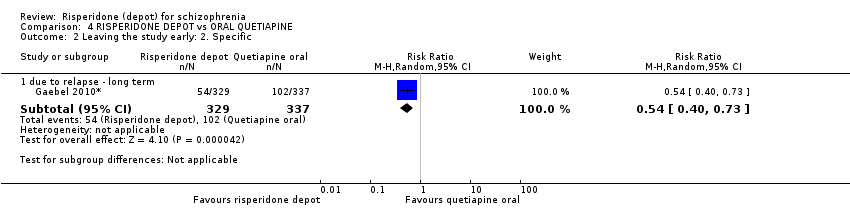
Comparison 4 RISPERIDONE DEPOT vs ORAL QUETIAPINE, Outcome 2 Leaving the study early: 2. Specific.

Comparison 4 RISPERIDONE DEPOT vs ORAL QUETIAPINE, Outcome 3 Adverse events: 1. General.
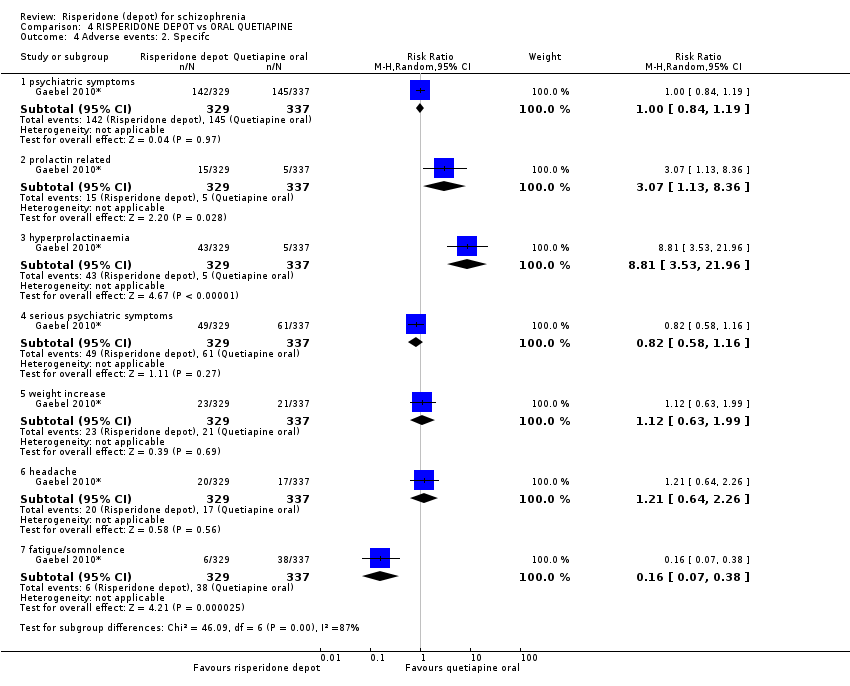
Comparison 4 RISPERIDONE DEPOT vs ORAL QUETIAPINE, Outcome 4 Adverse events: 2. Specifc.

Comparison 4 RISPERIDONE DEPOT vs ORAL QUETIAPINE, Outcome 5 Adverse events: 2. Specific: Mean (SD) weight increase in kg.
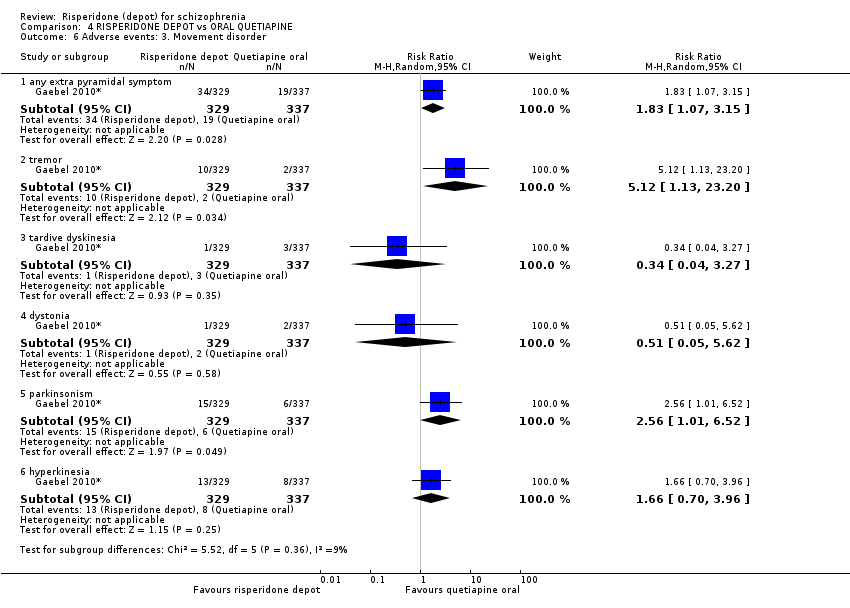
Comparison 4 RISPERIDONE DEPOT vs ORAL QUETIAPINE, Outcome 6 Adverse events: 3. Movement disorder.

Comparison 5 RISPERIDONE DEPOT vs ORAL ARIPIPRAZOLE, Outcome 1 Global state: 1. Relapse (any reason).

Comparison 5 RISPERIDONE DEPOT vs ORAL ARIPIPRAZOLE, Outcome 2 Global state: 3. Mean time in remission (days).

Comparison 5 RISPERIDONE DEPOT vs ORAL ARIPIPRAZOLE, Outcome 3 Mental state: 1. Average change scores (PANSS, high score = worse).

Comparison 5 RISPERIDONE DEPOT vs ORAL ARIPIPRAZOLE, Outcome 4 Leaving the study early: 1. Any reason.

Comparison 5 RISPERIDONE DEPOT vs ORAL ARIPIPRAZOLE, Outcome 5 Leaving the study early: 2. Specific.
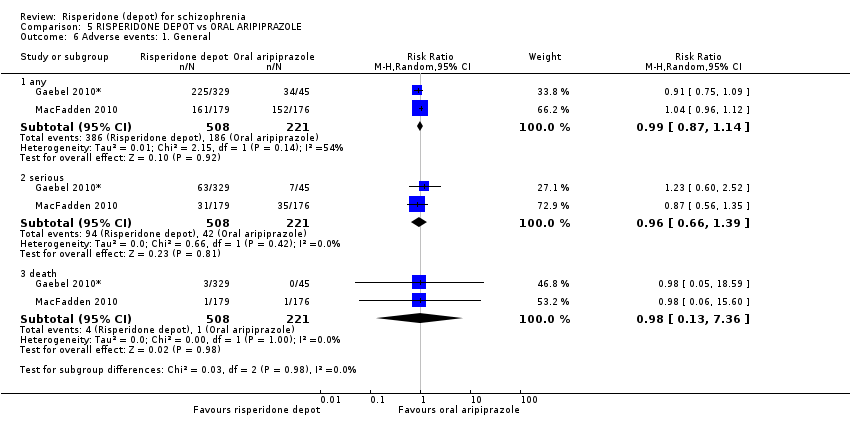
Comparison 5 RISPERIDONE DEPOT vs ORAL ARIPIPRAZOLE, Outcome 6 Adverse events: 1. General.

Comparison 5 RISPERIDONE DEPOT vs ORAL ARIPIPRAZOLE, Outcome 7 Adverse events: 2. Specific.

Comparison 5 RISPERIDONE DEPOT vs ORAL ARIPIPRAZOLE, Outcome 8 Adverse events: 2. Specific 12. Mean (SD) weight increase in kg.
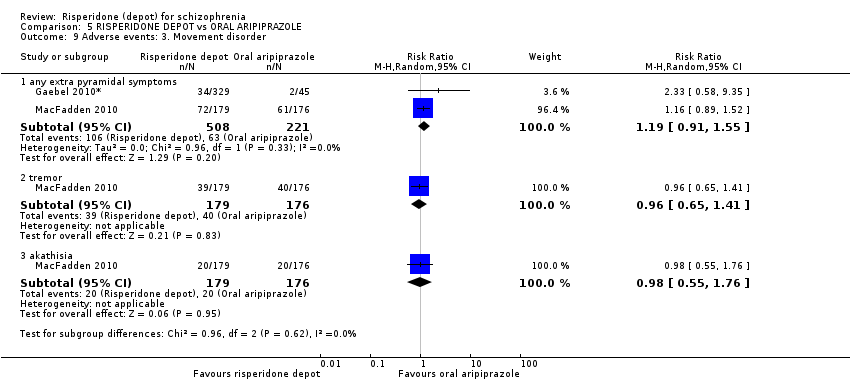
Comparison 5 RISPERIDONE DEPOT vs ORAL ARIPIPRAZOLE, Outcome 9 Adverse events: 3. Movement disorder.

Comparison 6 RISPERIDONE DEPOT vs ORAL OLANZAPINE, Outcome 1 Mental state: 1. Average change scores (PANNS, high score = worse).
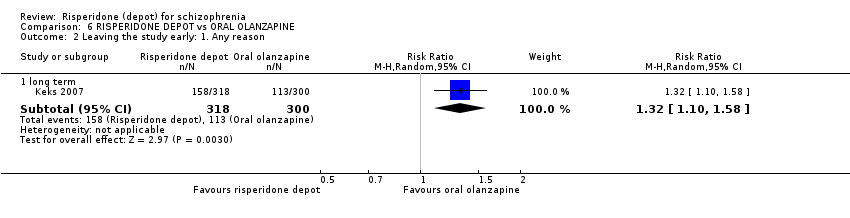
Comparison 6 RISPERIDONE DEPOT vs ORAL OLANZAPINE, Outcome 2 Leaving the study early: 1. Any reason.

Comparison 6 RISPERIDONE DEPOT vs ORAL OLANZAPINE, Outcome 3 Leaving the study early: 2. Specific.
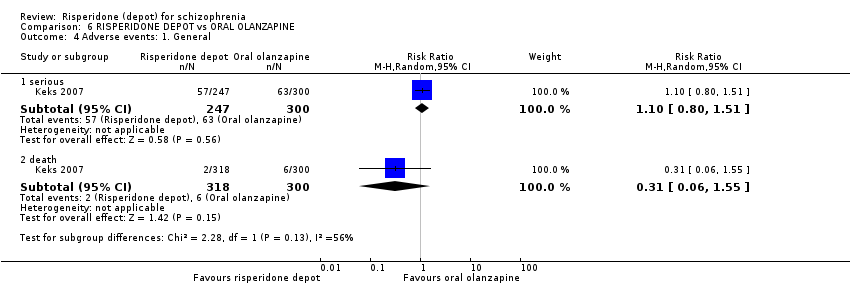
Comparison 6 RISPERIDONE DEPOT vs ORAL OLANZAPINE, Outcome 4 Adverse events: 1. General.

Comparison 6 RISPERIDONE DEPOT vs ORAL OLANZAPINE, Outcome 5 Adverse events: 2. Specific.

Comparison 6 RISPERIDONE DEPOT vs ORAL OLANZAPINE, Outcome 6 Adverse events: 3. Movement disorder.

Comparison 7 RISPERIDONE DEPOT vs ALL ORAL ANTIPSYCHOTICS (PRIMARY OUTCOMES), Outcome 1 Global state: 1. Relapse (any reason).
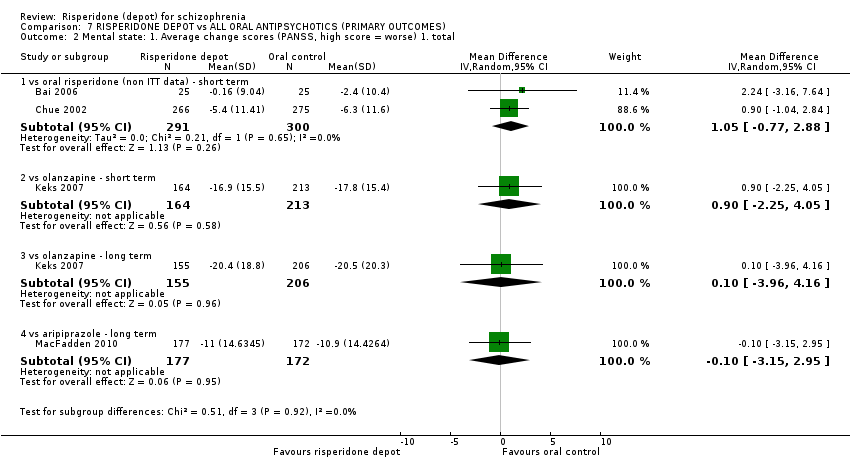
Comparison 7 RISPERIDONE DEPOT vs ALL ORAL ANTIPSYCHOTICS (PRIMARY OUTCOMES), Outcome 2 Mental state: 1. Average change scores (PANSS, high score = worse) 1. total.
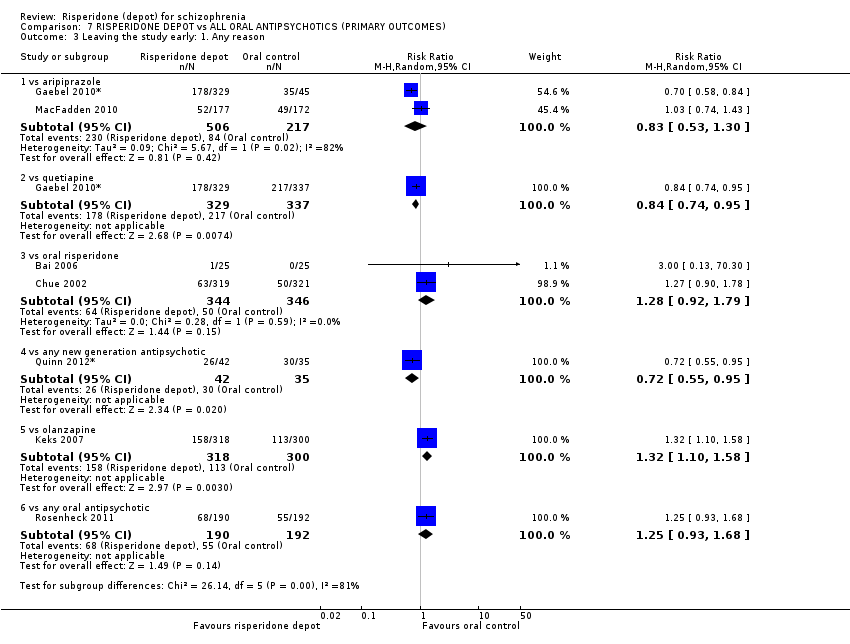
Comparison 7 RISPERIDONE DEPOT vs ALL ORAL ANTIPSYCHOTICS (PRIMARY OUTCOMES), Outcome 3 Leaving the study early: 1. Any reason.
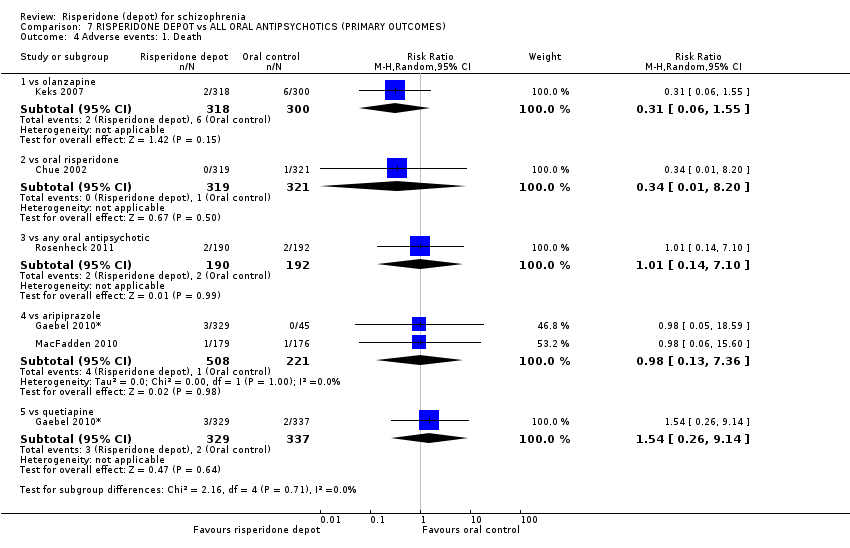
Comparison 7 RISPERIDONE DEPOT vs ALL ORAL ANTIPSYCHOTICS (PRIMARY OUTCOMES), Outcome 4 Adverse events: 1. Death.

Comparison 7 RISPERIDONE DEPOT vs ALL ORAL ANTIPSYCHOTICS (PRIMARY OUTCOMES), Outcome 5 Adverse events: 1. General: a. any.
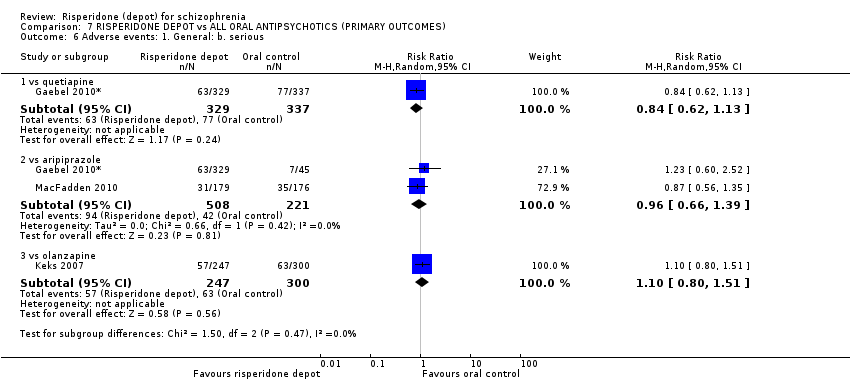
Comparison 7 RISPERIDONE DEPOT vs ALL ORAL ANTIPSYCHOTICS (PRIMARY OUTCOMES), Outcome 6 Adverse events: 1. General: b. serious.

Comparison 7 RISPERIDONE DEPOT vs ALL ORAL ANTIPSYCHOTICS (PRIMARY OUTCOMES), Outcome 7 Adverse events: 2. Movement disorder: a. any extra pyramidal symptoms.

Comparison 8 RISPERIDONE DEPOT vs ATYPICAL DEPOT ANTIPSYCHOTICS (PALIPERIDONE PALMITATE), Outcome 1 Global State: 1. CGI‐S mean change from baseline (high score = worse).
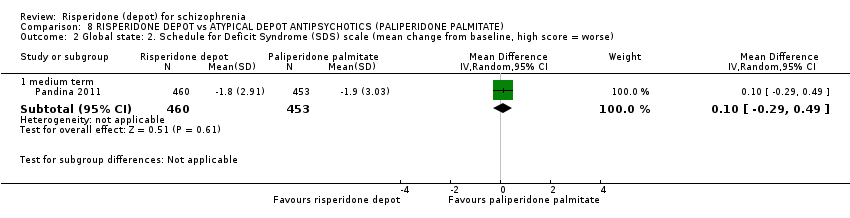
Comparison 8 RISPERIDONE DEPOT vs ATYPICAL DEPOT ANTIPSYCHOTICS (PALIPERIDONE PALMITATE), Outcome 2 Global state: 2. Schedule for Deficit Syndrome (SDS) scale (mean change from baseline, high score = worse).

Comparison 8 RISPERIDONE DEPOT vs ATYPICAL DEPOT ANTIPSYCHOTICS (PALIPERIDONE PALMITATE), Outcome 3 Mental state: 1. PANSS scores (high score = worse) ‐ medium term.

Comparison 8 RISPERIDONE DEPOT vs ATYPICAL DEPOT ANTIPSYCHOTICS (PALIPERIDONE PALMITATE), Outcome 4 Mental state: 2. Improved by 30% in total PANSS score (ITT data).

Comparison 8 RISPERIDONE DEPOT vs ATYPICAL DEPOT ANTIPSYCHOTICS (PALIPERIDONE PALMITATE), Outcome 5 General functioning: Personal and Social Performance (PSP) scale (high score = better).
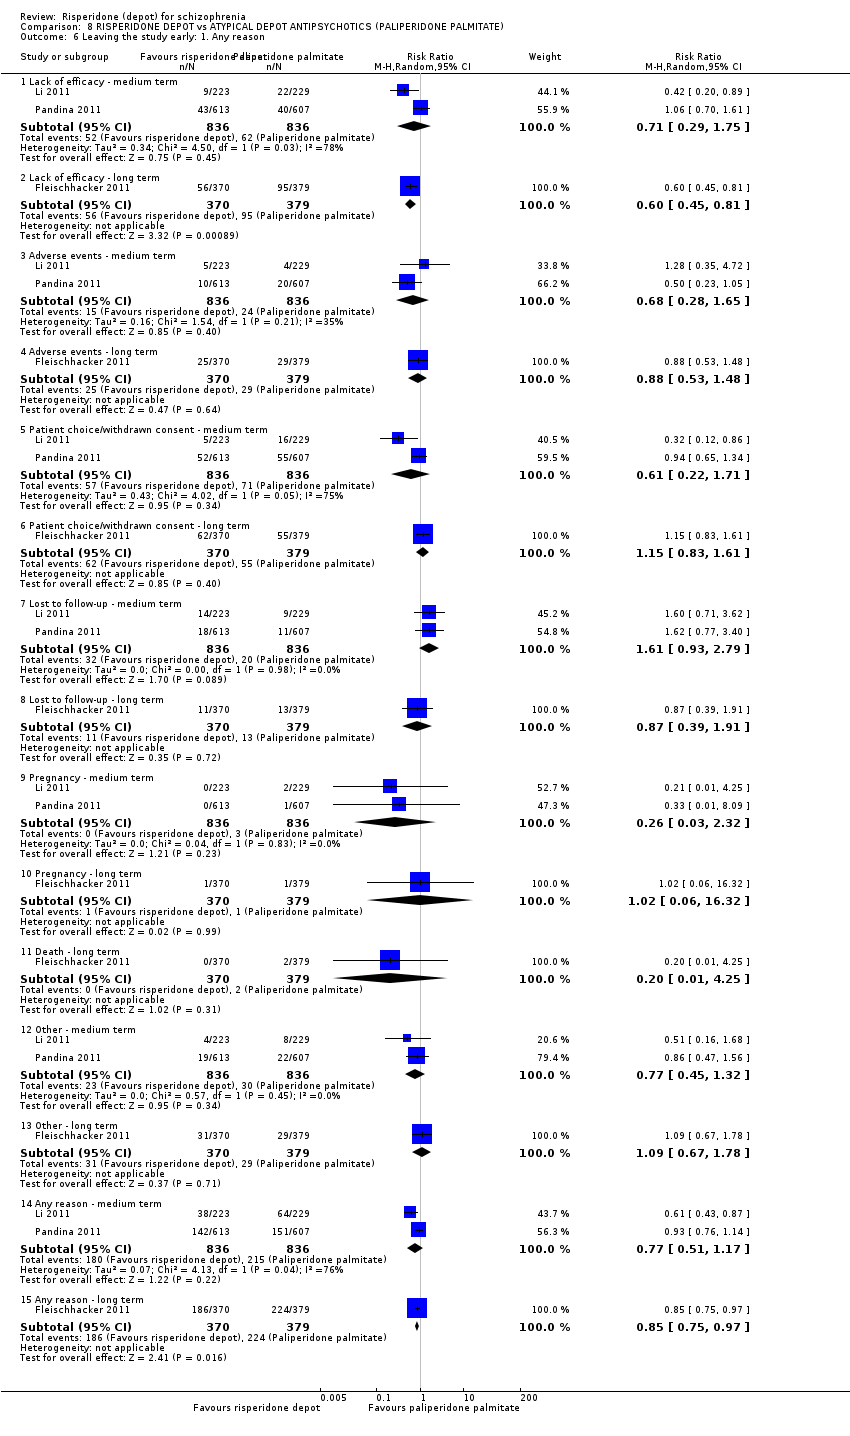
Comparison 8 RISPERIDONE DEPOT vs ATYPICAL DEPOT ANTIPSYCHOTICS (PALIPERIDONE PALMITATE), Outcome 6 Leaving the study early: 1. Any reason.

Comparison 8 RISPERIDONE DEPOT vs ATYPICAL DEPOT ANTIPSYCHOTICS (PALIPERIDONE PALMITATE), Outcome 7 Adverse events: 1. General.

Comparison 8 RISPERIDONE DEPOT vs ATYPICAL DEPOT ANTIPSYCHOTICS (PALIPERIDONE PALMITATE), Outcome 8 Adverse events: 2. Specific.

Comparison 8 RISPERIDONE DEPOT vs ATYPICAL DEPOT ANTIPSYCHOTICS (PALIPERIDONE PALMITATE), Outcome 9 Adverse events: 3. Prolactin related.
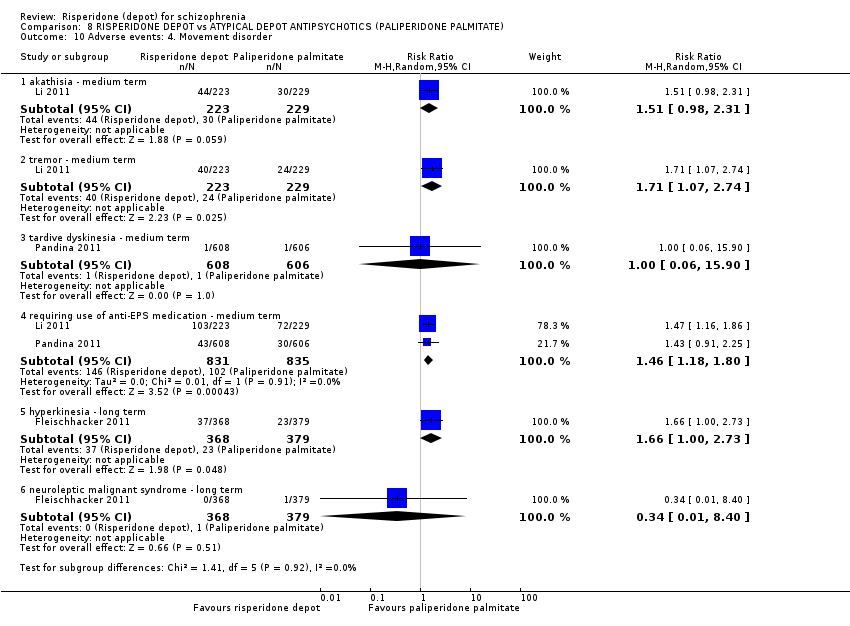
Comparison 8 RISPERIDONE DEPOT vs ATYPICAL DEPOT ANTIPSYCHOTICS (PALIPERIDONE PALMITATE), Outcome 10 Adverse events: 4. Movement disorder.

Comparison 8 RISPERIDONE DEPOT vs ATYPICAL DEPOT ANTIPSYCHOTICS (PALIPERIDONE PALMITATE), Outcome 11 Adverse events: 5. Body weight (mean increase).
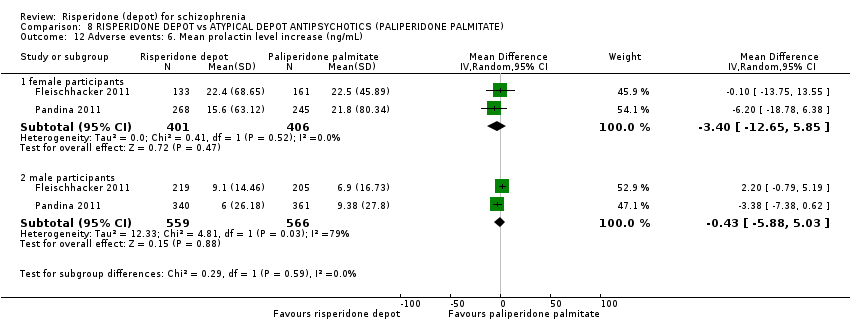
Comparison 8 RISPERIDONE DEPOT vs ATYPICAL DEPOT ANTIPSYCHOTICS (PALIPERIDONE PALMITATE), Outcome 12 Adverse events: 6. Mean prolactin level increase (ng/mL).

Comparison 8 RISPERIDONE DEPOT vs ATYPICAL DEPOT ANTIPSYCHOTICS (PALIPERIDONE PALMITATE), Outcome 13 Adverse events: 7. Glucose related.

Comparison 8 RISPERIDONE DEPOT vs ATYPICAL DEPOT ANTIPSYCHOTICS (PALIPERIDONE PALMITATE), Outcome 14 Adverse events: 8. Injection site pain (mean (sd) Visual Analogue Scale score (0‐100mm)).

Comparison 9 RISPERIDONE DEPOT vs TYPICAL DEPOT ANTIPSYCHOTICS, Outcome 1 Mental state: 1. Total endpoint scores (PANNS, high score = worse).

Comparison 9 RISPERIDONE DEPOT vs TYPICAL DEPOT ANTIPSYCHOTICS, Outcome 2 Leaving the study early.
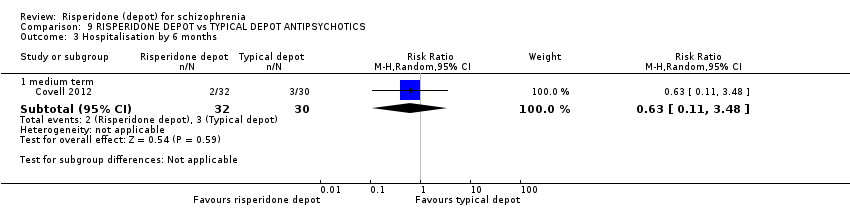
Comparison 9 RISPERIDONE DEPOT vs TYPICAL DEPOT ANTIPSYCHOTICS, Outcome 3 Hospitalisation by 6 months.
| Study | Intervention | Mean | SD | N |
| Change in BMI ‐ short term (skew) | ||||
| Covell 2012 | Risperidone depot | 1.29 | 1.9 | 23 |
| Covell 2012 | Typical depot antipsychotics | 0.48 | 1.4 | 26 |
| Change in BMI ‐ medium term (skew) | ||||
| Covell 2012 | Risperidone depot | 1.53 | 2.2 | 22 |
| Covell 2012 | Typical depot antipsychotics | 0.53 | 1.3 | 24 |
| Change in BMI ‐ long term (skew) | ||||
| Covell 2012 | Risperidone depot | 1.04 | 2.0 | 17 |
| Covell 2012 | Typical depot antipsychotics | ‐0.28 | 1.7 | 24 |
| Prolactin endpoint levels (ng/mL) ‐ short term (skew) | ||||
| Covell 2012 | Risperidone depot | 22.5 | 19.1 | 19 |
| Covell 2012 | Typical depot antipsychotics | 15.1 | 7.6 | 22 |
| Prolactin endpoint levels (ng/mL) ‐ medium term (skew) | ||||
| Covell 2012 | Risperidone depot | 23.4 | 13.8 | 18 |
| Covell 2012 | Typical depot antipsychotics | 16 | 7.5 | 21 |
| Prolactin endpoint levels (ng/mL) ‐ long term (skew) | ||||
| Covell 2012 | Risperidone depot | 19 | 10.6 | 14 |
| Covell 2012 | Typical depot antipsychotics | 15.2 | 5.1 | 18 |
Comparison 9 RISPERIDONE DEPOT vs TYPICAL DEPOT ANTIPSYCHOTICS, Outcome 4 Adverse events: 1. Continuous outcomes (skew).

Comparison 9 RISPERIDONE DEPOT vs TYPICAL DEPOT ANTIPSYCHOTICS, Outcome 5 Adverse events: 2. Sexual experiencesm, total endpoint (ASEX, high score = worse).
| Methods | Allocation: randomised, fully explicit description of methods of randomisation and allocation concealment. |
| Participants | Diagnosis: schizophrenia (ICD/DSM/CCMD). |
| Interventions | 1. Depot risperidone. N = 150. 2. Standard care. N = 150. |
| Outcomes | General: time to all‐cause treatment failure marked by its discontinuation, relapse, general impression of clinician (CGI), career/other, compliance with treatment., healthy days, |
| Notes | * Powered to be able to identify a difference of ˜ 20% between groups for primary outcome with adequate degree of certainty. |
| BPRS: Brief Psychiatric Rating Scale | |
| Excluded study | Comparison | Existing review | Suggested future review titles |
| Oral risperidone vs conventional antipsychotic drugs (haloperidol, fluphenazine, chlorpromazine, trifluoperazine), not depot risperidone. | Risperidone vs typical antipsychotic medication for schizophrenia (Hunter 2003). | Risperidone vs haloperidol, risperidone vs fluphenazine, risperidone vs chlorpromazine, risperidone vs trifluoperazine. | |
| Oral risperidone vs atypical antipsychotics (olanzapine), not depot risperidone. | Risperidone vs olanzapine for schizophrenia (Jayaram 2006). | ||
| Dose comparison (25 mg vs 50 mg of risperidone depot). | Risperidone dose for schizophrenia (Li 2009). | This could also generate further comparisons for this current review. |
| RISPERIDONE DEPOT compared with PLACEBO for schizophrenia | ||||||
| Patient or population: patients with schizophrenia | ||||||
| Outcomes | Illustrative comparative risks* (95% CI) | Relative effect | No of Participants | Quality of the evidence | Comments | |
| Assumed risk | Corresponding risk | |||||
| PLACEBO | RISPERIDONE DEPOT | |||||
| Global state: Relapse ‐ long term ‐ not measured | See comment | See comment | Not estimable | ‐ | See comment | No study reported this outcome. |
| Mental state: clinically significant improvement in mental state ‐ long term1 ‐ not reported | See comment | See comment | Not estimable1 | ‐ | See comment | Study reported PANSS responder rate, but unusable due to high attrition. |
| Leaving the study early: Any reason ‐ all doses risperidone depot ‐ short term | 694 per 1000 | 513 per 1000 | RR 0.74 | 400 | ⊕⊝⊝⊝ | |
| Adverse events: General: Severe adverse event ‐ any dose risperidone depot ‐ short term | 235 per 10004 | 138 per 1000 | RR 0.59 | 400 | ⊕⊝⊝⊝ | |
| Adverse events: Specific: Weight gain ‐ all doses of depot risperidone ‐ short term | 20 per 1000 | 43 per 1000 | RR 2.11 | 400 | ⊕⊝⊝⊝ | |
| *The basis for the assumed risk (e.g. the median control group risk across studies) is provided in footnotes. The corresponding risk (and its 95% confidence interval) is based on the assumed risk in the comparison group and the relative effect of the intervention (and its 95% CI). | ||||||
| GRADE Working Group grades of evidence | ||||||
| 1 Not reported: only included study (Kane 2002*) reported PANSS responder rate, but these data were unusable due to high levels of attrition. | ||||||
| RISPERIDONE DEPOT compared with GENERAL ORAL ANTIPSYCHOTICS for schizophrenia | ||||||
| Patient or population: patients with schizophrenia | ||||||
| Outcomes | Illustrative comparative risks* (95% CI) | Relative effect | No of Participants | Quality of the evidence | Comments | |
| Assumed risk | Corresponding risk | |||||
| GENERAL ORAL ANTIPSYCHOTICS | RISPERIDONE DEPOT | |||||
| Global state: Relapse (any reason) ‐ long term | Moderate | RR 2.13 | 63 | ⊕⊝⊝⊝ | Criteria for relapse were derived from Csernansky 2002.<BR/> | |
| 161 per 10001 | 343 per 1000 | |||||
| Mental state: clinically significant improvement in mental state ‐ long term | See comment | See comment | Not estimable | 0 | See comment | Outcomes relating to mental state were unusable due to high study attrition. |
| Leaving the study early: Any reason ‐ long term | Study population | RR 1.24 | 467 | ⊕⊕⊕⊝ | ||
| 322 per 10004 | 399 per 1000 | |||||
| Moderate | ||||||
| 387 per 10004 | 480 per 1000 | |||||
| Adverse events: General: Severe adverse event ‐ any dose risperidone depot ‐ short term | See comment | See comment | Not estimable | 0 | See comment | "Severe adverse events" were not explicitly reported. |
| Adverse events: Specific ‐ prolactin‐related ‐ long term | Low | RR 10.27 | 85 | ⊕⊝⊝⊝ | ||
| 10 per 10005 | 103 per 1000 | |||||
| Moderate | ||||||
| 100 per 10005 | 1000 per 1000 | |||||
| High | ||||||
| 200 per 10005 | 1000 per 1000 | |||||
| Adverse events: Specific ‐ weight increase ‐ long term | Study population | RR 1.33 | 85 | ⊕⊝⊝⊝ | ||
| 171 per 10004 | 227 per 1000 | |||||
| Moderate | ||||||
| 171 per 10004 | 227 per 1000 | |||||
| Adverse events: Nervous system disorders (inc. EPS) ‐ long term | Study population | RR 1.34 | 369 | ⊕⊝⊝⊝ | ||
| 171 per 10004 | 227 per 1000 | |||||
| Moderate | ||||||
| 171 per 10004 | 227 per 1000 | |||||
| *The basis for the assumed risk (e.g. the median control group risk across studies) is provided in footnotes. The corresponding risk (and its 95% confidence interval) is based on the assumed risk in the comparison group and the relative effect of the intervention (and its 95% CI). | ||||||
| GRADE Working Group grades of evidence | ||||||
| 1 Assumed risk: mean baseline presented for one individual study. | ||||||
| RISPERIDONE DEPOT compared with ORAL RISPERIDONE for schizophrenia | ||||||
| Patient or population: patients with schizophrenia | ||||||
| Outcomes | Illustrative comparative risks* (95% CI) | Relative effect | No of Participants | Quality of the evidence | Comments | |
| Assumed risk | Corresponding risk | |||||
| ORAL RISPERIDONE | RISPERIDONE DEPOT | |||||
| Global state: Relapse ‐ long term | See comment | See comment | Not estimable | 0 | See comment | Outcomes relating to relapse were not available for this comparison. |
| Mental state: average PANSS total score at endpoint (non‐ITT data) | The mean mental state: average PANSS total score at endpoint (non‐ITT data) in the intervention groups was | 591 | ⊕⊕⊕⊝ | |||
| Leaving the study early: Any reason ‐ short term | Study population | RR 1.28 | 690 | ⊕⊕⊕⊝ | ||
| 145 per 10002 | 185 per 1000 | |||||
| Moderate | ||||||
| 78 per 10002 | 100 per 1000 | |||||
| Adverse events: General: Severe adverse event ‐ any dose risperidone depot ‐ short term | See comment | See comment | Not estimable | 0 | See comment | "Severe adverse events" were not explicitly reported by these studies. |
| Adverse events: Movement disorder ‐ any extra pyramidal symptoms ‐ short term | Study population | RR 1.05 | 640 | ⊕⊕⊕⊝ | ||
| 65 per 10003 | 69 per 1000 | |||||
| Moderate | ||||||
| 65 per 10003 | 68 per 1000 | |||||
| Adverse events: Specific: Mean (SD) weight increase in kg ‐ short term | The mean adverse events: specific: mean (SD) weight increase in kg ‐ short term in the control groups was | The mean adverse events: specific: mean (SD) weight increase in kg ‐ short term in the intervention groups was | 640 | ⊕⊕⊕⊝ | ||
| Adverse events: Specific ‐ prolactin‐related | Moderate | RR 0.5 | 640 | ⊕⊕⊕⊝ | ||
| 25 per 10003 | 12 per 1000 | |||||
| *The basis for the assumed risk (e.g. the median control group risk across studies) is provided in footnotes. The corresponding risk (and its 95% confidence interval) is based on the assumed risk in the comparison group and the relative effect of the intervention (and its 95% CI). | ||||||
| GRADE Working Group grades of evidence | ||||||
| 1 Risk of bias: 'serious' ‐ both studies received funding support from the manufacturers of risperidone depot | ||||||
| RISPERIDONE DEPOT compared with ORAL QUETIAPINE for schizophrenia | ||||||
| Patient or population: patients with schizophrenia | ||||||
| Outcomes | Illustrative comparative risks* (95% CI) | Relative effect | No of Participants | Quality of the evidence | Comments | |
| Assumed risk | Corresponding risk | |||||
| ORAL QUETIAPINE | RISPERIDONE DEPOT | |||||
| Global state: Relapse ‐ long term | See comment | See comment | Not estimable | 0 | See comment | Criteria for relapse were derived from Csernansky 2002. <BR/> Outcomes relating to relapse were reported, but were unusable due to study attrition. |
| Mental state: clinically significant improvement in mental state ‐ long term | See comment | See comment | Not estimable | 0 | See comment | Outcomes relating to mental state were unusable due to high study attrition. |
| Leaving the study early: Any reason ‐ long term | Moderate | RR 0.84 | 666 | ⊕⊕⊕⊝ | ||
| 644 per 10001 | 541 per 1000 | |||||
| Adverse events: General ‐ serious | Moderate | RR 0.84 | 666 | ⊕⊕⊝⊝ | ||
| 229 per 10001 | 192 per 1000 | |||||
| Adverse events: Movement disorder ‐ any extra pyramidal symptom | Moderate | RR 1.83 | 666 | ⊕⊕⊝⊝ | ||
| 56 per 10001 | 102 per 1000 | |||||
| Adverse events: Specific: Mean (SD) weight increase in kg ‐ long term | The mean adverse events: specific: mean (SD) weight increase in kg ‐ long term in the intervention groups was | 666 | ⊕⊕⊝⊝ | |||
| Adverse events: Specific ‐ prolactin‐related | Study population | RR 3.07 | 666 | ⊕⊕⊝⊝ | ||
| 15 per 10001 | 46 per 1000 | |||||
| Moderate | ||||||
| 15 per 10001 | 46 per 1000 | |||||
| *The basis for the assumed risk (e.g. the median control group risk across studies) is provided in footnotes. The corresponding risk (and its 95% confidence interval) is based on the assumed risk in the comparison group and the relative effect of the intervention (and its 95% CI). | ||||||
| GRADE Working Group grades of evidence | ||||||
| 1 Assumed risk: mean baseline risk used for one included study. | ||||||
| RISPERIDONE DEPOT compared with ORAL ARIPIPRAZOLE for schizophrenia | ||||||
| Patient or population: patients with schizophrenia | ||||||
| Outcomes | Illustrative comparative risks* (95% CI) | Relative effect | No of Participants | Quality of the evidence | Comments | |
| Assumed risk | Corresponding risk | |||||
| ORAL ARIPIPRAZOLE | RISPERIDONE DEPOT | |||||
| Global state: Relapse (any reason) ‐ long term | Moderate | RR 1.05 | 349 | ⊕⊕⊝⊝ | Criteria for relapse were derived from Csernansky 2002. | |
| 436 per 10001 | 458 per 1000 | |||||
| Mental state: Average change scores‐ long term | The mean mental state: average change scores‐ long term in the intervention groups was | 349 | ⊕⊕⊝⊝ | |||
| Leaving the study early: Any reason ‐ long term | Study population | RR 0.83 | 723 | ⊕⊝⊝⊝ | ||
| 387 per 10004 | 321 per 1000 | |||||
| Moderate | ||||||
| 531 per 10004 | 441 per 1000 | |||||
| Adverse events: General ‐ serious | Study population | RR 0.96 | 729 | ⊕⊝⊝⊝ | ||
| 190 per 10004 | 182 per 1000 | |||||
| Moderate | ||||||
| 177 per 10004 | 170 per 1000 | |||||
| Adverse events: Movement disorder ‐ any extra pyramidal symptoms | Study population | RR 1.19 | 729 | ⊕⊝⊝⊝ | ||
| 285 per 10004 | 339 per 1000 | |||||
| Moderate | ||||||
| 196 per 10004 | 233 per 1000 | |||||
| Adverse events: Specific ‐ weight increase | Moderate | RR 1.57 | 374 | ⊕⊕⊝⊝ | ||
| 44 per 10001 | 69 per 1000 | |||||
| Adverse events: Specific ‐ prolactin‐related | Study population | RR 9.91 | 729 | ⊕⊝⊝⊝ | ||
| 9 per 10004 | 90 per 1000 | |||||
| Moderate | ||||||
| 6 per 10004 | 59 per 1000 | |||||
| *The basis for the assumed risk (e.g. the median control group risk across studies) is provided in footnotes. The corresponding risk (and its 95% confidence interval) is based on the assumed risk in the comparison group and the relative effect of the intervention (and its 95% CI). | ||||||
| GRADE Working Group grades of evidence | ||||||
| 1 Assumed risk: mean baseline risk presented for one individual study. | ||||||
| RISPERIDONE DEPOT compared with ORAL OLANZAPINE for schizophrenia | ||||||
| Patient or population: patients with schizophrenia | ||||||
| Outcomes | Illustrative comparative risks* (95% CI) | Relative effect | No of Participants | Quality of the evidence | Comments | |
| Assumed risk | Corresponding risk | |||||
| ORAL OLANZAPINE | RISPERIDONE DEPOT | |||||
| Global state: Relapse ‐ long term | See comment | See comment | Not estimable | 0 | See comment | Outcomes relating to relapse were not reported for this comparison. |
| Mental state: Average change scores ‐ long term | The mean mental state: average change scores ‐ long term in the intervention groups was | 361 | ⊕⊕⊝⊝ | |||
| Leaving the study early: Any reason ‐ long term | Study population | RR 1.32 | 618 | ⊕⊕⊝⊝ | ||
| 377 per 10004 | 497 per 1000 | |||||
| Moderate | ||||||
| 377 per 10004 | 498 per 1000 | |||||
| Adverse events: General ‐ serious | Moderate | RR 1.1 | 547 | ⊕⊕⊝⊝ | ||
| 210 per 10004 | 231 per 1000 | |||||
| Adverse events: Movement disorder ‐ any extra pyramidal symptoms | Moderate | RR 1.67 | 547 | ⊕⊕⊝⊝ | ||
| 150 per 10004 | 250 per 1000 | |||||
| Adverse events: Specific ‐ weight increase | Moderate | RR 0.56 | 547 | ⊕⊕⊝⊝ | ||
| 360 per 10004 | 202 per 1000 | |||||
| *The basis for the assumed risk (e.g. the median control group risk across studies) is provided in footnotes. The corresponding risk (and its 95% confidence interval) is based on the assumed risk in the comparison group and the relative effect of the intervention (and its 95% CI). | ||||||
| GRADE Working Group grades of evidence | ||||||
| 1 Risk of bias: 'very serious' ‐ serious risk of bias due to study attrition in excess of 50%. | ||||||
| RISPERIDONE DEPOT compared with ATYPICAL DEPOT ANTIPSYCHOTICS (PALIPERIDONE PALMITATE) for schizophrenia | ||||||
| Patient or population: patients with schizophrenia | ||||||
| Outcomes | Illustrative comparative risks* (95% CI) | Relative effect | No of Participants | Quality of the evidence | Comments | |
| Assumed risk | Corresponding risk | |||||
| ATYPICAL DEPOT ANTIPSYCHOTICS (PALIPERIDONE PALMITATE) | RISPERIDONE DEPOT | |||||
| Global state: Relapse ‐ long term | See comment | See comment | Not estimable | 0 | See comment | Outcomes relating to relapse were not reported for this comparison. |
| Mental state: PANSS responders (ITT data) ‐ medium term | Study population | RR 1.01 | 1326 | ⊕⊕⊕⊝ | ||
| 585 per 10001 | 591 per 1000 | |||||
| Moderate | ||||||
| 619 per 10001 | 625 per 1000 | |||||
| Leaving the study early: lack of efficacy ‐ long term | Study population | RR 0.60 | 749 | ⊕⊕⊝⊝ | ||
| 361 per 10001 | 307 per 1000 | |||||
| Moderate | ||||||
| 280 per 10001 | 238 per 1000 | |||||
| Adverse events: Movement disorder requiring the use of anti‐EPS medication ‐ medium term | Study population | RR 1.46 | 1666 | ⊕⊕⊕⊝ | ||
| 122 per 10001 | 178 per 1000 | |||||
| Moderate | ||||||
| 182 per 10001 | 266 per 1000 | |||||
| Adverse events: Body weight (mean increase) ‐ medium/long term | The mean adverse events: body weight (mean increase) ‐ medium/long term in the intervention groups was | 2350 | ⊕⊕⊝⊝ | |||
| Adverse events: Any prolactin‐related ‐ medium term | Study population | RR 1.02 | 1666 | ⊕⊕⊕⊝ | ||
| 32 per 10001 | 33 per 1000 | |||||
| Moderate | ||||||
| 48 per 10001 | 49 per 1000 | |||||
| Adverse events: Any glucose‐related ‐ medium/long term | 10 per 10001 | 18 per 1000 | RR 1.79 | 2413 | ⊕⊕⊝⊝ | |
| *The basis for the assumed risk (e.g. the median control group risk across studies) is provided in footnotes. The corresponding risk (and its 95% confidence interval) is based on the assumed risk in the comparison group and the relative effect of the intervention (and its 95% CI). | ||||||
| GRADE Working Group grades of evidence | ||||||
| 1 Assumed risk: median control group risk from the studies. | ||||||
| RISPERIDONE DEPOT compared with TYPICAL DEPOT ANTIPSYCHOTICS for schizophrenia | ||||||
| Patient or population: patients with schizophrenia | ||||||
| Outcomes | Illustrative comparative risks* (95% CI) | Relative effect | No of Participants | Quality of the evidence | Comments | |
| Assumed risk | Corresponding risk | |||||
| TYPICAL DEPOT ANTIPSYCHOTICS | RISPERIDONE DEPOT | |||||
| Global state: Relapse ‐ long term | See comment | See comment | Not estimable | 0 | See comment | Outcomes relating to relapse were not reported for this comparison. |
| Mental state: Total average scores (PANSS, high score = worse) ‐ long term | The mean mental state: total average scores (PANSS, high score = worse) ‐ long term in the intervention groups was | 43 | ⊕⊕⊝⊝ | |||
| Leaving the study early for any reason ‐ long term | Study population | RR 3.05 | 62 | ⊕⊕⊝⊝ | ||
| 133 per 10003 | 407 per 1000 | |||||
| Moderate | ||||||
| 133 per 10003 | 406 per 1000 | |||||
| Adverse events: General: Severe adverse event | See comment | See comment | Not estimable | 0 | See comment | "Severe adverse events" were not explicitly reported for this comparison. |
| Adverse events: related to movement disorder, weight gain, prolactin levels and glucose metabolism ‐ medium/long term ‐ not reported | See comment | See comment | Not estimable | ‐ | See comment | Outcomes relating to specific adverse events were not reported in such as way as to be useable. |
| *The basis for the assumed risk (e.g. the median control group risk across studies) is provided in footnotes. The corresponding risk (and its 95% confidence interval) is based on the assumed risk in the comparison group and the relative effect of the intervention (and its 95% CI). | ||||||
| GRADE Working Group grades of evidence | ||||||
| 1 Risk of bias: 'serious' ‐ due to the open‐label nature of this study. | ||||||
| Outcome or subgroup title | No. of studies | No. of participants | Statistical method | Effect size |
| 1 Mental state: 1. Change (exacerbation) in specific symptoms Show forest plot | 1 | Risk Ratio (M‐H, Random, 95% CI) | Subtotals only | |
| 1.1 anxiety ‐ short term | 1 | 400 | Risk Ratio (M‐H, Random, 95% CI) | 0.58 [0.32, 1.05] |
| 1.2 agitation ‐ short term | 1 | 400 | Risk Ratio (M‐H, Random, 95% CI) | 0.60 [0.39, 0.92] |
| 1.3 hallucinations ‐ short term | 1 | 400 | Risk Ratio (M‐H, Random, 95% CI) | 1.23 [0.47, 3.22] |
| 1.4 nervousness ‐ short term | 1 | 400 | Risk Ratio (M‐H, Random, 95% CI) | 0.39 [0.12, 1.25] |
| 1.5 psychosis ‐ short term | 1 | 400 | Risk Ratio (M‐H, Random, 95% CI) | 0.52 [0.33, 0.83] |
| 2 Leaving the study early: 1. Any reason (by time period) Show forest plot | 1 | Risk Ratio (M‐H, Random, 95% CI) | Subtotals only | |
| 2.1 very early on (<1 injection) | 1 | 400 | Risk Ratio (M‐H, Random, 95% CI) | 1.30 [0.55, 3.08] |
| 2.2 by 12 weeks | 1 | 400 | Risk Ratio (M‐H, Random, 95% CI) | 0.74 [0.63, 0.88] |
| 3 Leaving the study early: 2. Any reason (by doses) Show forest plot | 1 | Risk Ratio (M‐H, Random, 95% CI) | Subtotals only | |
| 3.1 all doses risperidone depot ‐ short term | 1 | 400 | Risk Ratio (M‐H, Random, 95% CI) | 0.74 [0.63, 0.88] |
| 3.2 25mg risperidone depot ‐ short term | 1 | 197 | Risk Ratio (M‐H, Random, 95% CI) | 0.74 [0.59, 0.94] |
| 3.3 50mg risperidone depot ‐ short term | 1 | 201 | Risk Ratio (M‐H, Random, 95% CI) | 0.74 [0.59, 0.93] |
| 3.4 75mg risperidone depot ‐ short term | 1 | 198 | Risk Ratio (M‐H, Random, 95% CI) | 0.75 [0.60, 0.94] |
| 4 Leaving the study early: 3. Because of insufficient response (by doses) Show forest plot | 1 | Risk Ratio (M‐H, Random, 95% CI) | Subtotals only | |
| 4.1 all three doses ‐ short term | 1 | 400 | Risk Ratio (M‐H, Random, 95% CI) | 0.53 [0.36, 0.79] |
| 4.2 25mg depot risperidone group ‐ short term | 1 | 197 | Risk Ratio (M‐H, Random, 95% CI) | 0.73 [0.45, 1.17] |
| 4.3 50mg depot risperidone group ‐ short term | 1 | 201 | Risk Ratio (M‐H, Random, 95% CI) | 0.48 [0.27, 0.83] |
| 4.4 75mg depot risperidone group ‐ short term | 1 | 198 | Risk Ratio (M‐H, Random, 95% CI) | 0.39 [0.21, 0.72] |
| 5 Adverse events: 1. General: a. Death Show forest plot | 1 | Risk Ratio (M‐H, Random, 95% CI) | Subtotals only | |
| 5.1 short term | 1 | 400 | Risk Ratio (M‐H, Random, 95% CI) | 0.11 [0.00, 2.65] |
| 6 Adverse events: 1. General: b. Severe adverse event (by doses) Show forest plot | 1 | Risk Ratio (M‐H, Random, 95% CI) | Subtotals only | |
| 6.1 any dose risperidone depot ‐ short term | 1 | 400 | Risk Ratio (M‐H, Random, 95% CI) | 0.59 [0.38, 0.93] |
| 6.2 25mg risperidone depot ‐ short term | 1 | 197 | Risk Ratio (M‐H, Random, 95% CI) | 0.56 [0.30, 1.04] |
| 6.3 50mg risperidone depot ‐ short term | 1 | 201 | Risk Ratio (M‐H, Random, 95% CI) | 0.58 [0.32, 1.06] |
| 6.4 75mg risperidone depot ‐ short term | 1 | 198 | Risk Ratio (M‐H, Random, 95% CI) | 0.64 [0.36, 1.15] |
| 7 Adverse events: 1. General: c. Adverse event necessitating withdrawal from study (by doses) Show forest plot | 1 | Risk Ratio (M‐H, Random, 95% CI) | Subtotals only | |
| 7.1 any dose risperidone depot ‐ short term | 1 | 400 | Risk Ratio (M‐H, Random, 95% CI) | 1.00 [0.54, 1.84] |
| 7.2 25mg risperidone depot ‐ short term | 1 | 197 | Risk Ratio (M‐H, Random, 95% CI) | 0.91 [0.42, 1.96] |
| 7.3 50mg risperidone depot ‐ short term | 1 | 201 | Risk Ratio (M‐H, Random, 95% CI) | 0.95 [0.45, 2.02] |
| 7.4 75mg risperidone depot ‐ short term | 1 | 198 | Risk Ratio (M‐H, Random, 95% CI) | 1.14 [0.56, 2.35] |
| 8 Adverse events: 2. Specific: a. Cardiovascular Show forest plot | 1 | Risk Ratio (M‐H, Random, 95% CI) | Subtotals only | |
| 8.1 dizziness ‐ short term | 1 | 400 | Risk Ratio (M‐H, Random, 95% CI) | 1.46 [0.62, 3.43] |
| 8.2 tachycardia ‐ short term | 1 | 400 | Risk Ratio (M‐H, Random, 95% CI) | 0.32 [0.11, 0.98] |
| 9 Adverse events: 2. Specific: b. Gastrointestinal Show forest plot | 1 | Risk Ratio (M‐H, Random, 95% CI) | Subtotals only | |
| 9.1 constipation ‐ short term | 1 | 400 | Risk Ratio (M‐H, Random, 95% CI) | 6.17 [0.84, 45.46] |
| 9.2 diarrhoea ‐ short term | 1 | 400 | Risk Ratio (M‐H, Random, 95% CI) | 0.87 [0.23, 3.20] |
| 9.3 nausea ‐ short term | 1 | 400 | Risk Ratio (M‐H, Random, 95% CI) | 1.04 [0.39, 2.76] |
| 9.4 vomiting ‐ short term | 1 | 400 | Risk Ratio (M‐H, Random, 95% CI) | 0.59 [0.23, 1.57] |
| 10 Adverse events: 2. Specific: c. Movement disorders: a. Extrapyramidal disorder ‐ spontaneously reported (by doses) Show forest plot | 1 | Risk Ratio (M‐H, Random, 95% CI) | Subtotals only | |
| 10.1 all doses of depot risperidone ‐ short term | 1 | 400 | Risk Ratio (M‐H, Random, 95% CI) | 2.38 [0.73, 7.78] |
| 10.2 25mg risperidone group ‐ short term | 1 | 197 | Risk Ratio (M‐H, Random, 95% CI) | 1.32 [0.30, 5.74] |
| 10.3 50mg risperidone group ‐ short term | 1 | 201 | Risk Ratio (M‐H, Random, 95% CI) | 2.54 [0.69, 9.29] |
| 10.4 75mg risperidone group ‐ short term | 1 | 198 | Risk Ratio (M‐H, Random, 95% CI) | 3.27 [0.93, 11.51] |
| 11 Adverse events: 2. Specific: d. Movement disorders: b. Hyperkinesia (by doses) Show forest plot | 1 | Risk Ratio (M‐H, Random, 95% CI) | Subtotals only | |
| 11.1 all doses of risperidone ‐ short term | 1 | 400 | Risk Ratio (M‐H, Random, 95% CI) | 1.70 [0.60, 4.84] |
| 11.2 25mg risperidone group ‐ short term | 1 | 197 | Risk Ratio (M‐H, Random, 95% CI) | 0.49 [0.09, 2.64] |
| 11.3 50mg risperidone group ‐ short term | 1 | 201 | Risk Ratio (M‐H, Random, 95% CI) | 2.14 [0.68, 6.73] |
| 11.4 75mg of risperidone group ‐ short term | 1 | 198 | Risk Ratio (M‐H, Random, 95% CI) | 2.45 [0.79, 7.55] |
| 12 Adverse events: 2. Specific: e. Movement disorders: c. Hypertonia (by doses) Show forest plot | 1 | Risk Ratio (M‐H, Random, 95% CI) | Subtotals only | |
| 12.1 all doses of depot risperidone ‐ short term | 1 | 400 | Risk Ratio (M‐H, Random, 95% CI) | 1.23 [0.47, 3.22] |
| 12.2 25mg risperidone ‐ short term | 1 | 197 | Risk Ratio (M‐H, Random, 95% CI) | 0.79 [0.22, 2.86] |
| 12.3 50mg risperidone ‐ short term | 1 | 201 | Risk Ratio (M‐H, Random, 95% CI) | 0.95 [0.28, 3.19] |
| 12.4 75mg risperidone ‐ short term | 1 | 198 | Risk Ratio (M‐H, Random, 95% CI) | 1.96 [0.70, 5.53] |
| 13 Adverse events: 2. Specific: f. Pain Show forest plot | 1 | Risk Ratio (M‐H, Random, 95% CI) | Subtotals only | |
| 13.1 headache ‐ short term | 1 | 400 | Risk Ratio (M‐H, Random, 95% CI) | 1.57 [0.88, 2.80] |
| 13.2 pain ‐ unspecified ‐ short term | 1 | 400 | Risk Ratio (M‐H, Random, 95% CI) | 1.38 [0.48, 4.00] |
| 14 Adverse events: 2. Specific: g. Salivation Show forest plot | 1 | Risk Ratio (M‐H, Random, 95% CI) | Subtotals only | |
| 14.1 decreased ‐ short term | 1 | 400 | Risk Ratio (M‐H, Random, 95% CI) | 2.92 [0.37, 22.76] |
| 14.2 increased ‐ short term | 1 | 400 | Risk Ratio (M‐H, Random, 95% CI) | 2.92 [0.37, 22.76] |
| 15 Adverse events: 2. Specific: h. Sleep disturbances Show forest plot | 1 | Risk Ratio (M‐H, Random, 95% CI) | Subtotals only | |
| 15.1 insomnia ‐ short term | 1 | 400 | Risk Ratio (M‐H, Random, 95% CI) | 1.04 [0.60, 1.82] |
| 15.2 somnolence ‐ short term | 1 | 400 | Risk Ratio (M‐H, Random, 95% CI) | 2.27 [0.69, 7.45] |
| 16 Adverse events: 2. Specific: i. Weight gain Show forest plot | 1 | Risk Ratio (M‐H, Random, 95% CI) | Subtotals only | |
| 16.1 all doses of depot risperidone ‐ short term | 1 | 400 | Risk Ratio (M‐H, Random, 95% CI) | 2.11 [0.48, 9.18] |
| 16.2 25mg risperidone ‐ short term | 1 | 197 | Risk Ratio (M‐H, Random, 95% CI) | 2.47 [0.49, 12.45] |
| 16.3 50mg risperidone ‐ short term | 1 | 201 | Risk Ratio (M‐H, Random, 95% CI) | 1.90 [0.36, 10.16] |
| 16.4 75mg risperidone ‐ short term | 1 | 198 | Risk Ratio (M‐H, Random, 95% CI) | 1.96 [0.37, 10.46] |
| 17 Adverse events: 2. Specific: j. Others Show forest plot | 1 | Risk Ratio (M‐H, Random, 95% CI) | Subtotals only | |
| 17.1 coughing ‐ short term | 1 | 400 | Risk Ratio (M‐H, Random, 95% CI) | 0.97 [0.32, 2.95] |
| 17.2 fatigue ‐ short term | 1 | 400 | Risk Ratio (M‐H, Random, 95% CI) | 8.82 [0.53, 147.05] |
| 17.3 injury ‐ short term | 1 | 400 | Risk Ratio (M‐H, Random, 95% CI) | 0.38 [0.13, 1.10] |
| 17.4 rhinitis ‐ short term | 1 | 400 | Risk Ratio (M‐H, Random, 95% CI) | 1.01 [0.47, 2.17] |
| Outcome or subgroup title | No. of studies | No. of participants | Statistical method | Effect size |
| 1 Global state: 1. Relapse (any reason) Show forest plot | 1 | Risk Ratio (M‐H, Random, 95% CI) | Subtotals only | |
| 1.1 long term | 1 | 63 | Risk Ratio (M‐H, Random, 95% CI) | 2.13 [0.84, 5.43] |
| 2 Global state: 2. Needing use of benzodiazepine or sedative drugs Show forest plot | 1 | Risk Ratio (M‐H, Random, 95% CI) | Subtotals only | |
| 2.1 long term | 1 | 369 | Risk Ratio (M‐H, Random, 95% CI) | 1.00 [0.68, 1.47] |
| 3 Service utilisation: 1. Hospitalisation Show forest plot | 1 | Risk Ratio (M‐H, Random, 95% CI) | Subtotals only | |
| 3.1 long term | 1 | 369 | Risk Ratio (M‐H, Random, 95% CI) | 0.87 [0.68, 1.10] |
| 4 Service utilisation: 2. Outpatient care ‐ number of outpatient visits (skewed data) Show forest plot | Other data | No numeric data | ||
| 4.1 long term | Other data | No numeric data | ||
| 5 Not receiving allocated study medication Show forest plot | 1 | Risk Ratio (M‐H, Random, 95% CI) | Subtotals only | |
| 5.1 long term | 1 | 382 | Risk Ratio (M‐H, Random, 95% CI) | 0.29 [0.06, 1.37] |
| 6 Leaving the study early: 1. Any reason Show forest plot | 2 | 467 | Risk Ratio (M‐H, Random, 95% CI) | 1.24 [0.98, 1.57] |
| 6.1 long term | 2 | 467 | Risk Ratio (M‐H, Random, 95% CI) | 1.24 [0.98, 1.57] |
| 7 Leaving the study early: 2. Specific Show forest plot | 1 | Risk Ratio (M‐H, Random, 95% CI) | Subtotals only | |
| 7.1 insufficient response ‐ long term | 1 | 382 | Risk Ratio (M‐H, Random, 95% CI) | 0.61 [0.15, 2.50] |
| 7.2 withdrawn consent ‐ long term | 1 | 382 | Risk Ratio (M‐H, Random, 95% CI) | 1.41 [0.86, 2.31] |
| 8 Adverse events: 1. General: a. Death Show forest plot | 1 | Risk Ratio (M‐H, Random, 95% CI) | Subtotals only | |
| 8.1 long term | 1 | 382 | Risk Ratio (M‐H, Random, 95% CI) | 1.01 [0.14, 7.10] |
| 9 Adverse events: 2. Specific Show forest plot | 2 | Risk Ratio (M‐H, Random, 95% CI) | Subtotals only | |
| 9.1 anxiety ‐ long term | 1 | 85 | Risk Ratio (M‐H, Random, 95% CI) | 1.40 [0.42, 4.60] |
| 9.2 diabetes mellitus ‐ long term | 1 | 369 | Risk Ratio (M‐H, Random, 95% CI) | 1.70 [0.73, 3.96] |
| 9.3 dizziness ‐ long term | 1 | 85 | Risk Ratio (M‐H, Random, 95% CI) | 1.49 [0.53, 4.19] |
| 9.4 fatigue/somnolence ‐ long term | 1 | 85 | Risk Ratio (M‐H, Random, 95% CI) | 2.05 [0.78, 5.40] |
| 9.5 gastrointestinal ‐ long term | 1 | 369 | Risk Ratio (M‐H, Random, 95% CI) | 1.10 [0.95, 1.28] |
| 9.6 general disorders and administration site conditions ‐ long term | 1 | 369 | Risk Ratio (M‐H, Random, 95% CI) | 1.31 [1.02, 1.69] |
| 9.7 headache ‐ long term | 1 | 85 | Risk Ratio (M‐H, Random, 95% CI) | 2.80 [1.12, 7.00] |
| 9.8 insomnia ‐ long term | 1 | 85 | Risk Ratio (M‐H, Random, 95% CI) | 1.73 [0.77, 3.91] |
| 9.9 nausea/ vomiting ‐ long term | 1 | 85 | Risk Ratio (M‐H, Random, 95% CI) | 1.86 [0.50, 6.97] |
| 9.10 prolactin related ‐ long term | 1 | 85 | Risk Ratio (M‐H, Random, 95% CI) | 10.27 [0.59, 180.05] |
| 9.11 weight increase ‐ long term | 1 | 85 | Risk Ratio (M‐H, Random, 95% CI) | 1.33 [0.56, 3.17] |
| 10 Adverse events: Nervous system disorders (inc. EPS) Show forest plot | 1 | Risk Ratio (M‐H, Random, 95% CI) | Subtotals only | |
| 10.1 long term | 1 | 369 | Risk Ratio (M‐H, Random, 95% CI) | 1.34 [1.13, 1.58] |
| Outcome or subgroup title | No. of studies | No. of participants | Statistical method | Effect size |
| 1 Global state: 1. Moderate to severely ill at end of study period (CGI rating) Show forest plot | 1 | Risk Ratio (M‐H, Random, 95% CI) | Subtotals only | |
| 1.1 short term | 1 | 640 | Risk Ratio (M‐H, Random, 95% CI) | 1.06 [0.92, 1.22] |
| 2 Global state: 2. Mean change from baseline (CGI‐S, high score = worse) Show forest plot | 1 | Mean Difference (IV, Random, 95% CI) | Subtotals only | |
| 2.1 short term | 1 | 50 | Mean Difference (IV, Random, 95% CI) | ‐0.04 [‐0.25, 0.17] |
| 3 Global state: 3. Mean (SD) GAF score change to endpoint Show forest plot | 1 | Mean Difference (IV, Random, 95% CI) | Subtotals only | |
| 3.1 short term | 1 | 50 | Mean Difference (IV, Random, 95% CI) | ‐0.8 [‐5.66, 4.06] |
| 4 Global state: 4. Needing use of benzodiazepine or sedative drugs Show forest plot | 2 | 690 | Risk Ratio (M‐H, Random, 95% CI) | 0.87 [0.74, 1.02] |
| 4.1 short term | 2 | 690 | Risk Ratio (M‐H, Random, 95% CI) | 0.87 [0.74, 1.02] |
| 5 Mental state: 1. Average change/endpoint scores (PANSS, high score = worse) Show forest plot | 2 | Mean Difference (IV, Random, 95% CI) | Subtotals only | |
| 5.1 mean total (non ITT data) | 1 | 541 | Mean Difference (IV, Random, 95% CI) | 0.0 [‐2.91, 2.91] |
| 5.2 average change: 1. total (non ITT data) | 2 | 591 | Mean Difference (IV, Random, 95% CI) | 1.05 [‐0.77, 2.88] |
| 5.3 average change: 2. positive (non‐ITT data) | 2 | 591 | Mean Difference (IV, Random, 95% CI) | 0.83 [‐0.69, 2.35] |
| 5.4 average change: 3. negative (non ITT data) | 2 | 591 | Mean Difference (IV, Random, 95% CI) | 0.03 [‐0.76, 0.82] |
| 5.5 average change: 4. disorganised thoughts | 1 | 541 | Mean Difference (IV, Random, 95% CI) | 0.10 [‐0.45, 0.65] |
| 5.6 average change: 5. hostility/excitement | 1 | 541 | Mean Difference (IV, Random, 95% CI) | 0.10 [‐0.18, 0.38] |
| 5.7 average change: 6. anxiety/depression | 1 | 541 | Mean Difference (IV, Random, 95% CI) | 0.10 [‐0.45, 0.65] |
| 6 Leaving the study early: 1. Any reason Show forest plot | 2 | 690 | Risk Ratio (M‐H, Random, 95% CI) | 1.28 [0.92, 1.79] |
| 6.1 short term | 2 | 690 | Risk Ratio (M‐H, Random, 95% CI) | 1.28 [0.92, 1.79] |
| 7 Leaving the study early: 2. Specific Show forest plot | 1 | Risk Ratio (M‐H, Random, 95% CI) | Subtotals only | |
| 7.1 adverse events ‐ short term | 1 | 640 | Risk Ratio (M‐H, Random, 95% CI) | 1.21 [0.62, 2.35] |
| 7.2 insufficient response ‐ short term | 1 | 640 | Risk Ratio (M‐H, Random, 95% CI) | 1.51 [0.63, 3.64] |
| 7.3 withdrawn consent ‐ short term | 1 | 640 | Risk Ratio (M‐H, Random, 95% CI) | 1.32 [0.65, 2.66] |
| 8 Quality of life: Mean (SD) SF‐36 score change/endpoint (high score = better) Show forest plot | 1 | Mean Difference (IV, Random, 95% CI) | Subtotals only | |
| 8.1 Physical component summary | 1 | 50 | Mean Difference (IV, Random, 95% CI) | 1.4 [‐2.64, 5.44] |
| 8.2 Mental component summary | 1 | 50 | Mean Difference (IV, Random, 95% CI) | ‐0.20 [‐5.06, 4.66] |
| 8.3 Role physical | 1 | 50 | Mean Difference (IV, Random, 95% CI) | 1.0 [‐20.71, 22.71] |
| 8.4 Role emotional | 1 | 50 | Mean Difference (IV, Random, 95% CI) | ‐10.60 [‐34.13, 12.93] |
| 8.5 Vitality | 1 | 50 | Mean Difference (IV, Random, 95% CI) | ‐1.6 [‐10.24, 7.04] |
| 8.6 General health | 1 | 50 | Mean Difference (IV, Random, 95% CI) | ‐2.60 [‐13.14, 7.94] |
| 8.7 Mental health | 1 | 50 | Mean Difference (IV, Random, 95% CI) | 5.8 [‐5.20, 16.80] |
| 8.8 Bodily pain | 1 | 50 | Mean Difference (IV, Random, 95% CI) | 3.70 [‐9.89, 17.29] |
| 8.9 Physical function | 1 | 50 | Mean Difference (IV, Random, 95% CI) | ‐4.6 [‐14.25, 5.05] |
| 8.10 Social function | 1 | 50 | Mean Difference (IV, Random, 95% CI) | 18.5 [3.98, 33.02] |
| 9 Adverse events: 1. General Show forest plot | 1 | Risk Ratio (M‐H, Random, 95% CI) | Subtotals only | |
| 9.1 any ‐ short term | 1 | 640 | Risk Ratio (M‐H, Random, 95% CI) | 1.04 [0.91, 1.18] |
| 9.2 death ‐ short term | 1 | 640 | Risk Ratio (M‐H, Random, 95% CI) | 0.34 [0.01, 8.20] |
| 10 Adverse events: 1. General: UKU average change score (high = worse) Show forest plot | 1 | Mean Difference (IV, Random, 95% CI) | Subtotals only | |
| 10.1 short term | 1 | 50 | Mean Difference (IV, Random, 95% CI) | ‐1.99 [‐3.59, ‐0.39] |
| 11 Adverse events: 2. Specific Show forest plot | 1 | Risk Ratio (M‐H, Random, 95% CI) | Subtotals only | |
| 11.1 anxiety | 1 | 640 | Risk Ratio (M‐H, Random, 95% CI) | 1.40 [0.84, 2.34] |
| 11.2 psychosis | 1 | 640 | Risk Ratio (M‐H, Random, 95% CI) | 1.14 [0.58, 2.24] |
| 11.3 prolactin related | 1 | 640 | Risk Ratio (M‐H, Random, 95% CI) | 0.50 [0.15, 1.65] |
| 11.4 impotence/ejaculation failure | 1 | 640 | Risk Ratio (M‐H, Random, 95% CI) | 0.34 [0.01, 8.20] |
| 11.5 dysmenorrhoea | 1 | 640 | Risk Ratio (M‐H, Random, 95% CI) | 1.01 [0.06, 16.02] |
| 11.6 hyperprolactinaemia | 1 | 640 | Risk Ratio (M‐H, Random, 95% CI) | 0.20 [0.01, 4.18] |
| 11.7 galactorrhoea | 1 | 640 | Risk Ratio (M‐H, Random, 95% CI) | 1.01 [0.14, 7.10] |
| 11.8 headache | 1 | 640 | Risk Ratio (M‐H, Random, 95% CI) | 1.14 [0.66, 1.95] |
| 11.9 insomnia | 1 | 640 | Risk Ratio (M‐H, Random, 95% CI) | 1.08 [0.66, 1.74] |
| 11.10 sexual dysfunction | 1 | 640 | Risk Ratio (M‐H, Random, 95% CI) | 0.50 [0.05, 5.52] |
| 12 Adverse events: 2. Specific: Mean (SD) weight increase in kg Show forest plot | 1 | Mean Difference (IV, Random, 95% CI) | Subtotals only | |
| 12.1 short term | 1 | 640 | Mean Difference (IV, Random, 95% CI) | 0.2 [‐0.35, 0.75] |
| 13 Adverse events: 3. Movement disorder Show forest plot | 2 | Risk Ratio (M‐H, Random, 95% CI) | Subtotals only | |
| 13.1 any extra pyramidal symptoms ‐ short term | 1 | 640 | Risk Ratio (M‐H, Random, 95% CI) | 1.05 [0.59, 1.88] |
| 13.2 participants requiring anti‐cholinergic drugs ‐ short term | 2 | 690 | Risk Ratio (M‐H, Random, 95% CI) | 1.03 [0.66, 1.60] |
| 13.3 tardive dyskinesia ‐ short term | 1 | 640 | Risk Ratio (M‐H, Random, 95% CI) | 9.06 [0.49, 167.52] |
| 14 Adverse events: Mean (SD) change in movement disorder rating scales Show forest plot | 1 | Mean Difference (IV, Random, 95% CI) | Subtotals only | |
| 14.1 AIMS | 1 | 50 | Mean Difference (IV, Random, 95% CI) | 1.16 [‐1.23, 3.55] |
| 14.2 BARS | 1 | 50 | Mean Difference (IV, Random, 95% CI) | 0.16 [‐0.65, 0.97] |
| 14.3 SAS | 1 | 50 | Mean Difference (IV, Random, 95% CI) | ‐0.55 [‐3.71, 2.61] |
| Outcome or subgroup title | No. of studies | No. of participants | Statistical method | Effect size |
| 1 Leaving the study early: 1. Any reason Show forest plot | 1 | Risk Ratio (M‐H, Random, 95% CI) | Subtotals only | |
| 1.1 long term | 1 | 666 | Risk Ratio (M‐H, Random, 95% CI) | 0.84 [0.74, 0.95] |
| 2 Leaving the study early: 2. Specific Show forest plot | 1 | Risk Ratio (M‐H, Random, 95% CI) | Subtotals only | |
| 2.1 due to relapse ‐ long term | 1 | 666 | Risk Ratio (M‐H, Random, 95% CI) | 0.54 [0.40, 0.73] |
| 3 Adverse events: 1. General Show forest plot | 1 | Risk Ratio (M‐H, Random, 95% CI) | Subtotals only | |
| 3.1 any | 1 | 666 | Risk Ratio (M‐H, Random, 95% CI) | 0.98 [0.89, 1.09] |
| 3.2 serious | 1 | 666 | Risk Ratio (M‐H, Random, 95% CI) | 0.84 [0.62, 1.13] |
| 3.3 death | 1 | 666 | Risk Ratio (M‐H, Random, 95% CI) | 1.54 [0.26, 9.14] |
| 4 Adverse events: 2. Specifc Show forest plot | 1 | Risk Ratio (M‐H, Random, 95% CI) | Subtotals only | |
| 4.1 psychiatric symptoms | 1 | 666 | Risk Ratio (M‐H, Random, 95% CI) | 1.00 [0.84, 1.19] |
| 4.2 prolactin related | 1 | 666 | Risk Ratio (M‐H, Random, 95% CI) | 3.07 [1.13, 8.36] |
| 4.3 hyperprolactinaemia | 1 | 666 | Risk Ratio (M‐H, Random, 95% CI) | 8.81 [3.53, 21.96] |
| 4.4 serious psychiatric symptoms | 1 | 666 | Risk Ratio (M‐H, Random, 95% CI) | 0.82 [0.58, 1.16] |
| 4.5 weight increase | 1 | 666 | Risk Ratio (M‐H, Random, 95% CI) | 1.12 [0.63, 1.99] |
| 4.6 headache | 1 | 666 | Risk Ratio (M‐H, Random, 95% CI) | 1.21 [0.64, 2.26] |
| 4.7 fatigue/somnolence | 1 | 666 | Risk Ratio (M‐H, Random, 95% CI) | 0.16 [0.07, 0.38] |
| 5 Adverse events: 2. Specific: Mean (SD) weight increase in kg Show forest plot | 1 | Mean Difference (IV, Random, 95% CI) | Subtotals only | |
| 5.1 long term | 1 | 666 | Mean Difference (IV, Random, 95% CI) | 1.25 [0.25, 2.25] |
| 6 Adverse events: 3. Movement disorder Show forest plot | 1 | Risk Ratio (M‐H, Random, 95% CI) | Subtotals only | |
| 6.1 any extra pyramidal symptom | 1 | 666 | Risk Ratio (M‐H, Random, 95% CI) | 1.83 [1.07, 3.15] |
| 6.2 tremor | 1 | 666 | Risk Ratio (M‐H, Random, 95% CI) | 5.12 [1.13, 23.20] |
| 6.3 tardive dyskinesia | 1 | 666 | Risk Ratio (M‐H, Random, 95% CI) | 0.34 [0.04, 3.27] |
| 6.4 dystonia | 1 | 666 | Risk Ratio (M‐H, Random, 95% CI) | 0.51 [0.05, 5.62] |
| 6.5 parkinsonism | 1 | 666 | Risk Ratio (M‐H, Random, 95% CI) | 2.56 [1.01, 6.52] |
| 6.6 hyperkinesia | 1 | 666 | Risk Ratio (M‐H, Random, 95% CI) | 1.66 [0.70, 3.96] |
| Outcome or subgroup title | No. of studies | No. of participants | Statistical method | Effect size |
| 1 Global state: 1. Relapse (any reason) Show forest plot | 1 | Risk Ratio (M‐H, Random, 95% CI) | Subtotals only | |
| 1.1 long term | 1 | 349 | Risk Ratio (M‐H, Random, 95% CI) | 1.05 [0.83, 1.33] |
| 2 Global state: 3. Mean time in remission (days) Show forest plot | 1 | Mean Difference (IV, Random, 95% CI) | Subtotals only | |
| 2.1 long term | 1 | 348 | Mean Difference (IV, Random, 95% CI) | 16.80 [‐43.59, 77.19] |
| 3 Mental state: 1. Average change scores (PANSS, high score = worse) Show forest plot | 1 | Mean Difference (IV, Random, 95% CI) | Subtotals only | |
| 3.1 long term | 1 | 349 | Mean Difference (IV, Random, 95% CI) | ‐0.10 [‐3.15, 2.95] |
| 4 Leaving the study early: 1. Any reason Show forest plot | 2 | 723 | Risk Ratio (M‐H, Random, 95% CI) | 0.83 [0.53, 1.30] |
| 4.1 long term | 2 | 723 | Risk Ratio (M‐H, Random, 95% CI) | 0.83 [0.53, 1.30] |
| 5 Leaving the study early: 2. Specific Show forest plot | 2 | Risk Ratio (M‐H, Random, 95% CI) | Subtotals only | |
| 5.1 adverse events | 2 | 723 | Risk Ratio (M‐H, Random, 95% CI) | 0.41 [0.05, 3.55] |
| 5.2 insufficient response | 1 | 349 | Risk Ratio (M‐H, Random, 95% CI) | 1.30 [0.29, 5.70] |
| 5.3 withdrawn consent | 2 | 723 | Risk Ratio (M‐H, Random, 95% CI) | 1.01 [0.67, 1.52] |
| 5.4 due to relapse | 1 | 374 | Risk Ratio (M‐H, Random, 95% CI) | 0.62 [0.36, 1.06] |
| 5.5 loss to follow‐up | 1 | 349 | Risk Ratio (M‐H, Random, 95% CI) | 1.75 [0.83, 3.68] |
| 6 Adverse events: 1. General Show forest plot | 2 | Risk Ratio (M‐H, Random, 95% CI) | Subtotals only | |
| 6.1 any | 2 | 729 | Risk Ratio (M‐H, Random, 95% CI) | 0.99 [0.87, 1.14] |
| 6.2 serious | 2 | 729 | Risk Ratio (M‐H, Random, 95% CI) | 0.96 [0.66, 1.39] |
| 6.3 death | 2 | 729 | Risk Ratio (M‐H, Random, 95% CI) | 0.98 [0.13, 7.36] |
| 7 Adverse events: 2. Specific Show forest plot | 2 | Risk Ratio (M‐H, Random, 95% CI) | Subtotals only | |
| 7.1 anxiety | 1 | 355 | Risk Ratio (M‐H, Random, 95% CI) | 1.21 [0.75, 1.94] |
| 7.2 depression | 1 | 355 | Risk Ratio (M‐H, Random, 95% CI) | 1.57 [0.85, 2.90] |
| 7.3 psychosis | 1 | 355 | Risk Ratio (M‐H, Random, 95% CI) | 1.04 [0.69, 1.56] |
| 7.4 psychiatric symptoms | 1 | 374 | Risk Ratio (M‐H, Random, 95% CI) | 0.81 [0.60, 1.09] |
| 7.5 serious psychiatric symptoms | 1 | 374 | Risk Ratio (M‐H, Random, 95% CI) | 0.75 [0.27, 2.08] |
| 7.6 schizophrenia | 1 | 355 | Risk Ratio (M‐H, Random, 95% CI) | 1.02 [0.63, 1.64] |
| 7.7 prolactin related | 2 | 729 | Risk Ratio (M‐H, Random, 95% CI) | 9.91 [2.78, 35.29] |
| 7.8 hyperprolactinaemia | 1 | 374 | Risk Ratio (M‐H, Random, 95% CI) | 12.13 [0.76, 193.65] |
| 7.9 weight increase | 1 | 374 | Risk Ratio (M‐H, Random, 95% CI) | 1.57 [0.38, 6.45] |
| 7.10 nausea/vomiting | 1 | 349 | Risk Ratio (M‐H, Random, 95% CI) | 1.25 [0.64, 2.43] |
| 7.11 gastrointestinal | 1 | 374 | Risk Ratio (M‐H, Random, 95% CI) | 0.27 [0.14, 0.55] |
| 7.12 decreased appetite | 1 | 355 | Risk Ratio (M‐H, Random, 95% CI) | 1.78 [1.00, 3.16] |
| 7.13 diarrhoea | 1 | 355 | Risk Ratio (M‐H, Random, 95% CI) | 0.62 [0.31, 1.24] |
| 7.14 headache | 2 | 729 | Risk Ratio (M‐H, Random, 95% CI) | 0.87 [0.46, 1.65] |
| 7.15 insomnia | 1 | 355 | Risk Ratio (M‐H, Random, 95% CI) | 0.91 [0.65, 1.27] |
| 7.16 upper resp. tract infection | 1 | 355 | Risk Ratio (M‐H, Random, 95% CI) | 0.38 [0.16, 0.89] |
| 7.17 pyrexia | 1 | 355 | Risk Ratio (M‐H, Random, 95% CI) | 1.16 [0.69, 1.97] |
| 7.18 nasopharyngitis | 1 | 355 | Risk Ratio (M‐H, Random, 95% CI) | 1.11 [0.58, 2.10] |
| 7.19 dizziness | 1 | 355 | Risk Ratio (M‐H, Random, 95% CI) | 1.89 [1.00, 3.58] |
| 7.20 glucose related | 1 | 355 | Risk Ratio (M‐H, Random, 95% CI) | 1.11 [0.58, 2.10] |
| 8 Adverse events: 2. Specific 12. Mean (SD) weight increase in kg Show forest plot | 1 | Mean Difference (IV, Random, 95% CI) | Subtotals only | |
| 8.1 long term | 1 | 355 | Mean Difference (IV, Random, 95% CI) | 1.0 [‐0.42, 2.42] |
| 9 Adverse events: 3. Movement disorder Show forest plot | 2 | Risk Ratio (M‐H, Random, 95% CI) | Subtotals only | |
| 9.1 any extra pyramidal symptoms | 2 | 729 | Risk Ratio (M‐H, Random, 95% CI) | 1.19 [0.91, 1.55] |
| 9.2 tremor | 1 | 355 | Risk Ratio (M‐H, Random, 95% CI) | 0.96 [0.65, 1.41] |
| 9.3 akathisia | 1 | 355 | Risk Ratio (M‐H, Random, 95% CI) | 0.98 [0.55, 1.76] |
| Outcome or subgroup title | No. of studies | No. of participants | Statistical method | Effect size |
| 1 Mental state: 1. Average change scores (PANNS, high score = worse) Show forest plot | 1 | Mean Difference (IV, Random, 95% CI) | Subtotals only | |
| 1.1 total ‐ short term | 1 | 377 | Mean Difference (IV, Random, 95% CI) | 0.90 [‐2.25, 4.05] |
| 1.2 total ‐ long term | 1 | 361 | Mean Difference (IV, Random, 95% CI) | 0.10 [‐3.96, 4.16] |
| 1.3 positive symptoms ‐ long term | 1 | 361 | Mean Difference (IV, Random, 95% CI) | ‐0.30 [‐1.61, 1.01] |
| 1.4 negative symptoms ‐ long term | 1 | 361 | Mean Difference (IV, Random, 95% CI) | 0.10 [‐1.28, 1.48] |
| 1.5 disorganised thoughts ‐ long term | 1 | 361 | Mean Difference (IV, Random, 95% CI) | ‐0.30 [‐1.34, 0.74] |
| 1.6 hostility/excitement ‐ long term | 1 | 361 | Mean Difference (IV, Random, 95% CI) | 0.20 [‐0.60, 1.00] |
| 1.7 anxiety/depression ‐ long term | 1 | 361 | Mean Difference (IV, Random, 95% CI) | 0.30 [‐0.46, 1.06] |
| 2 Leaving the study early: 1. Any reason Show forest plot | 1 | Risk Ratio (M‐H, Random, 95% CI) | Subtotals only | |
| 2.1 long term | 1 | 618 | Risk Ratio (M‐H, Random, 95% CI) | 1.32 [1.10, 1.58] |
| 3 Leaving the study early: 2. Specific Show forest plot | 1 | Risk Ratio (M‐H, Random, 95% CI) | Subtotals only | |
| 3.1 adverse events | 1 | 547 | Risk Ratio (M‐H, Random, 95% CI) | 0.71 [0.28, 1.77] |
| 3.2 insufficient response | 1 | 547 | Risk Ratio (M‐H, Random, 95% CI) | 0.81 [0.49, 1.35] |
| 3.3 withdrawn consent | 1 | 547 | Risk Ratio (M‐H, Random, 95% CI) | 2.54 [1.56, 4.16] |
| 3.4 due to weight gain | 1 | 547 | Risk Ratio (M‐H, Random, 95% CI) | 0.24 [0.03, 2.07] |
| 4 Adverse events: 1. General Show forest plot | 1 | Risk Ratio (M‐H, Random, 95% CI) | Subtotals only | |
| 4.1 serious | 1 | 547 | Risk Ratio (M‐H, Random, 95% CI) | 1.10 [0.80, 1.51] |
| 4.2 death | 1 | 618 | Risk Ratio (M‐H, Random, 95% CI) | 0.31 [0.06, 1.55] |
| 5 Adverse events: 2. Specific Show forest plot | 1 | Risk Ratio (M‐H, Random, 95% CI) | Subtotals only | |
| 5.1 agitation | 1 | 532 | Risk Ratio (M‐H, Random, 95% CI) | 1.98 [1.06, 3.68] |
| 5.2 anxiety | 1 | 532 | Risk Ratio (M‐H, Random, 95% CI) | 0.87 [0.58, 1.31] |
| 5.3 depression | 1 | 532 | Risk Ratio (M‐H, Random, 95% CI) | 1.45 [0.99, 2.12] |
| 5.4 psychosis | 1 | 532 | Risk Ratio (M‐H, Random, 95% CI) | 1.15 [0.87, 1.52] |
| 5.5 impotence/ejaculation failure | 1 | 547 | Risk Ratio (M‐H, Random, 95% CI) | 1.21 [0.17, 8.56] |
| 5.6 galactorrhoea | 1 | 547 | Risk Ratio (M‐H, Random, 95% CI) | 3.04 [0.59, 15.52] |
| 5.7 serious psychiatric symptoms | 1 | 547 | Risk Ratio (M‐H, Random, 95% CI) | 1.01 [0.64, 1.59] |
| 5.8 serious anxiety | 1 | 547 | Risk Ratio (M‐H, Random, 95% CI) | 1.42 [0.48, 4.16] |
| 5.9 suicide attempt | 1 | 547 | Risk Ratio (M‐H, Random, 95% CI) | 1.35 [0.56, 3.27] |
| 5.10 serious injury | 1 | 547 | Risk Ratio (M‐H, Random, 95% CI) | 2.02 [0.49, 8.39] |
| 5.11 weight increase | 1 | 547 | Risk Ratio (M‐H, Random, 95% CI) | 0.56 [0.42, 0.75] |
| 5.12 headache | 1 | 532 | Risk Ratio (M‐H, Random, 95% CI) | 1.56 [0.81, 3.01] |
| 5.13 insomnia | 1 | 532 | Risk Ratio (M‐H, Random, 95% CI) | 4.59 [2.61, 8.07] |
| 5.14 fatigue/somnolence | 1 | 532 | Risk Ratio (M‐H, Random, 95% CI) | 0.71 [0.35, 1.41] |
| 5.15 nasopharyngitis | 1 | 532 | Risk Ratio (M‐H, Random, 95% CI) | 1.17 [0.61, 2.21] |
| 5.16 diabetes mellitus | 1 | 547 | Risk Ratio (M‐H, Random, 95% CI) | 1.21 [0.08, 19.32] |
| 5.17 hyperglycaemia | 1 | 494 | Risk Ratio (M‐H, Random, 95% CI) | 1.0 [0.25, 3.95] |
| 5.18 hypoglycaemia | 1 | 547 | Risk Ratio (M‐H, Random, 95% CI) | 0.40 [0.02, 9.89] |
| 6 Adverse events: 3. Movement disorder Show forest plot | 1 | Risk Ratio (M‐H, Random, 95% CI) | Subtotals only | |
| 6.1 any extra pyramidal symptoms | 1 | 547 | Risk Ratio (M‐H, Random, 95% CI) | 1.67 [1.19, 2.36] |
| 6.2 tremor | 1 | 547 | Risk Ratio (M‐H, Random, 95% CI) | 2.29 [1.04, 5.06] |
| 6.3 tardive dyskinesia | 1 | 547 | Risk Ratio (M‐H, Random, 95% CI) | 1.21 [0.17, 8.56] |
| 6.4 hypertonia | 1 | 547 | Risk Ratio (M‐H, Random, 95% CI) | 1.35 [0.56, 3.27] |
| 6.5 dystonia | 1 | 547 | Risk Ratio (M‐H, Random, 95% CI) | 6.07 [0.29, 125.82] |
| 6.6 hyperkinesia | 1 | 547 | Risk Ratio (M‐H, Random, 95% CI) | 2.02 [1.01, 4.06] |
| 6.7 requiring antiparkinson drugs | 1 | 547 | Risk Ratio (M‐H, Random, 95% CI) | 1.26 [1.02, 1.56] |
| Outcome or subgroup title | No. of studies | No. of participants | Statistical method | Effect size |
| 1 Global state: 1. Relapse (any reason) Show forest plot | 2 | Risk Ratio (M‐H, Random, 95% CI) | Subtotals only | |
| 1.1 vs aripiprazole ‐ long term | 1 | 349 | Risk Ratio (M‐H, Random, 95% CI) | 1.05 [0.83, 1.33] |
| 1.2 vs general oral antipsychotics ‐ long term | 1 | 63 | Risk Ratio (M‐H, Random, 95% CI) | 2.13 [0.84, 5.43] |
| 2 Mental state: 1. Average change scores (PANSS, high score = worse) 1. total Show forest plot | 4 | Mean Difference (IV, Random, 95% CI) | Subtotals only | |
| 2.1 vs oral risperidone (non ITT data) ‐ short term | 2 | 591 | Mean Difference (IV, Random, 95% CI) | 1.05 [‐0.77, 2.88] |
| 2.2 vs olanzapine ‐ short term | 1 | 377 | Mean Difference (IV, Random, 95% CI) | 0.90 [‐2.25, 4.05] |
| 2.3 vs olanzapine ‐ long term | 1 | 361 | Mean Difference (IV, Random, 95% CI) | 0.10 [‐3.96, 4.16] |
| 2.4 vs aripiprazole ‐ long term | 1 | 349 | Mean Difference (IV, Random, 95% CI) | ‐0.10 [‐3.15, 2.95] |
| 3 Leaving the study early: 1. Any reason Show forest plot | 7 | Risk Ratio (M‐H, Random, 95% CI) | Subtotals only | |
| 3.1 vs aripiprazole | 2 | 723 | Risk Ratio (M‐H, Random, 95% CI) | 0.83 [0.53, 1.30] |
| 3.2 vs quetiapine | 1 | 666 | Risk Ratio (M‐H, Random, 95% CI) | 0.84 [0.74, 0.95] |
| 3.3 vs oral risperidone | 2 | 690 | Risk Ratio (M‐H, Random, 95% CI) | 1.28 [0.92, 1.79] |
| 3.4 vs any new generation antipsychotic | 1 | 77 | Risk Ratio (M‐H, Random, 95% CI) | 0.72 [0.55, 0.95] |
| 3.5 vs olanzapine | 1 | 618 | Risk Ratio (M‐H, Random, 95% CI) | 1.32 [1.10, 1.58] |
| 3.6 vs any oral antipsychotic | 1 | 382 | Risk Ratio (M‐H, Random, 95% CI) | 1.25 [0.93, 1.68] |
| 4 Adverse events: 1. Death Show forest plot | 5 | Risk Ratio (M‐H, Random, 95% CI) | Subtotals only | |
| 4.1 vs olanzapine | 1 | 618 | Risk Ratio (M‐H, Random, 95% CI) | 0.31 [0.06, 1.55] |
| 4.2 vs oral risperidone | 1 | 640 | Risk Ratio (M‐H, Random, 95% CI) | 0.34 [0.01, 8.20] |
| 4.3 vs any oral antipsychotic | 1 | 382 | Risk Ratio (M‐H, Random, 95% CI) | 1.01 [0.14, 7.10] |
| 4.4 vs aripiprazole | 2 | 729 | Risk Ratio (M‐H, Random, 95% CI) | 0.98 [0.13, 7.36] |
| 4.5 vs quetiapine | 1 | 666 | Risk Ratio (M‐H, Random, 95% CI) | 1.54 [0.26, 9.14] |
| 5 Adverse events: 1. General: a. any Show forest plot | 3 | Risk Ratio (M‐H, Random, 95% CI) | Subtotals only | |
| 5.1 vs aripiprazole | 2 | 729 | Risk Ratio (M‐H, Random, 95% CI) | 0.99 [0.87, 1.14] |
| 5.2 vs oral risperidone | 1 | 640 | Risk Ratio (M‐H, Random, 95% CI) | 1.04 [0.91, 1.18] |
| 5.3 vs quetiapine | 1 | 666 | Risk Ratio (M‐H, Random, 95% CI) | 0.98 [0.89, 1.09] |
| 6 Adverse events: 1. General: b. serious Show forest plot | 3 | Risk Ratio (M‐H, Random, 95% CI) | Subtotals only | |
| 6.1 vs quetiapine | 1 | 666 | Risk Ratio (M‐H, Random, 95% CI) | 0.84 [0.62, 1.13] |
| 6.2 vs aripiprazole | 2 | 729 | Risk Ratio (M‐H, Random, 95% CI) | 0.96 [0.66, 1.39] |
| 6.3 vs olanzapine | 1 | 547 | Risk Ratio (M‐H, Random, 95% CI) | 1.10 [0.80, 1.51] |
| 7 Adverse events: 2. Movement disorder: a. any extra pyramidal symptoms Show forest plot | 4 | Risk Ratio (M‐H, Random, 95% CI) | Subtotals only | |
| 7.1 vs aripiprazole | 2 | 729 | Risk Ratio (M‐H, Random, 95% CI) | 1.19 [0.91, 1.55] |
| 7.2 vs quetiapine | 1 | 666 | Risk Ratio (M‐H, Random, 95% CI) | 1.83 [1.07, 3.15] |
| 7.3 vs olanzapine | 1 | 547 | Risk Ratio (M‐H, Random, 95% CI) | 1.67 [1.19, 2.36] |
| 7.4 vs oral risperidone | 1 | 640 | Risk Ratio (M‐H, Random, 95% CI) | 1.05 [0.59, 1.88] |
| Outcome or subgroup title | No. of studies | No. of participants | Statistical method | Effect size |
| 1 Global State: 1. CGI‐S mean change from baseline (high score = worse) Show forest plot | 2 | 1326 | Mean Difference (IV, Random, 95% CI) | ‐0.07 [‐0.26, 0.11] |
| 1.1 medium term | 2 | 1326 | Mean Difference (IV, Random, 95% CI) | ‐0.07 [‐0.26, 0.11] |
| 2 Global state: 2. Schedule for Deficit Syndrome (SDS) scale (mean change from baseline, high score = worse) Show forest plot | 1 | Mean Difference (IV, Random, 95% CI) | Subtotals only | |
| 2.1 medium term | 1 | 913 | Mean Difference (IV, Random, 95% CI) | 0.10 [‐0.29, 0.49] |
| 3 Mental state: 1. PANSS scores (high score = worse) ‐ medium term Show forest plot | 2 | Mean Difference (IV, Random, 95% CI) | Subtotals only | |
| 3.1 total mean change to endpoint (ITT and per protocol data)* | 2 | 1326 | Mean Difference (IV, Random, 95% CI) | 1.12 [‐2.79, 5.02] |
| 3.2 positive symptoms score change to endpoint | 2 | 1326 | Mean Difference (IV, Random, 95% CI) | 0.66 [‐1.39, 2.71] |
| 3.3 negative symptoms score change to endpoint (ITT data) | 2 | 1326 | Mean Difference (IV, Random, 95% CI) | 0.06 [‐0.47, 0.59] |
| 3.4 disorganised thoughts score change to endpoint (ITT data) | 2 | 1326 | Mean Difference (IV, Random, 95% CI) | 0.02 [‐0.55, 0.59] |
| 3.5 uncontrolled hostility/excitement score change to endpoint (ITT data) | 2 | 1326 | Mean Difference (IV, Random, 95% CI) | ‐0.04 [‐0.50, 0.41] |
| 3.6 anxiety/depression score change to endpoint (ITT data) | 2 | 1326 | Mean Difference (IV, Random, 95% CI) | 0.01 [‐0.67, 0.69] |
| 4 Mental state: 2. Improved by 30% in total PANSS score (ITT data) Show forest plot | 2 | Risk Ratio (M‐H, Random, 95% CI) | Subtotals only | |
| 4.1 medium term | 2 | 1326 | Risk Ratio (M‐H, Random, 95% CI) | 1.01 [0.83, 1.23] |
| 5 General functioning: Personal and Social Performance (PSP) scale (high score = better) Show forest plot | 2 | 1326 | Mean Difference (IV, Random, 95% CI) | 0.65 [‐0.69, 1.98] |
| 5.1 mean endpoint ‐ medium term | 2 | 1326 | Mean Difference (IV, Random, 95% CI) | 0.65 [‐0.69, 1.98] |
| 6 Leaving the study early: 1. Any reason Show forest plot | 3 | Risk Ratio (M‐H, Random, 95% CI) | Subtotals only | |
| 6.1 Lack of efficacy ‐ medium term | 2 | 1672 | Risk Ratio (M‐H, Random, 95% CI) | 0.71 [0.29, 1.75] |
| 6.2 Lack of efficacy ‐ long term | 1 | 749 | Risk Ratio (M‐H, Random, 95% CI) | 0.60 [0.45, 0.81] |
| 6.3 Adverse events ‐ medium term | 2 | 1672 | Risk Ratio (M‐H, Random, 95% CI) | 0.68 [0.28, 1.65] |
| 6.4 Adverse events ‐ long term | 1 | 749 | Risk Ratio (M‐H, Random, 95% CI) | 0.88 [0.53, 1.48] |
| 6.5 Patient choice/withdrawn consent ‐ medium term | 2 | 1672 | Risk Ratio (M‐H, Random, 95% CI) | 0.61 [0.22, 1.71] |
| 6.6 Patient choice/withdrawn consent ‐ long term | 1 | 749 | Risk Ratio (M‐H, Random, 95% CI) | 1.15 [0.83, 1.61] |
| 6.7 Lost to follow‐up ‐ medium term | 2 | 1672 | Risk Ratio (M‐H, Random, 95% CI) | 1.61 [0.93, 2.79] |
| 6.8 Lost to follow‐up ‐ long term | 1 | 749 | Risk Ratio (M‐H, Random, 95% CI) | 0.87 [0.39, 1.91] |
| 6.9 Pregnancy ‐ medium term | 2 | 1672 | Risk Ratio (M‐H, Random, 95% CI) | 0.26 [0.03, 2.32] |
| 6.10 Pregnancy ‐ long term | 1 | 749 | Risk Ratio (M‐H, Random, 95% CI) | 1.02 [0.06, 16.32] |
| 6.11 Death ‐ long term | 1 | 749 | Risk Ratio (M‐H, Random, 95% CI) | 0.20 [0.01, 4.25] |
| 6.12 Other ‐ medium term | 2 | 1672 | Risk Ratio (M‐H, Random, 95% CI) | 0.77 [0.45, 1.32] |
| 6.13 Other ‐ long term | 1 | 749 | Risk Ratio (M‐H, Random, 95% CI) | 1.09 [0.67, 1.78] |
| 6.14 Any reason ‐ medium term | 2 | 1672 | Risk Ratio (M‐H, Random, 95% CI) | 0.77 [0.51, 1.17] |
| 6.15 Any reason ‐ long term | 1 | 749 | Risk Ratio (M‐H, Random, 95% CI) | 0.85 [0.75, 0.97] |
| 7 Adverse events: 1. General Show forest plot | 3 | Risk Ratio (M‐H, Random, 95% CI) | Subtotals only | |
| 7.1 overall rate ‐ medium term | 2 | 1666 | Risk Ratio (M‐H, Random, 95% CI) | 1.20 [0.33, 4.42] |
| 7.2 overall rate ‐ long term | 1 | 747 | Risk Ratio (M‐H, Random, 95% CI) | 0.74 [0.58, 0.95] |
| 7.3 worsening of schizophrenia ‐ medium term | 2 | 1666 | Risk Ratio (M‐H, Random, 95% CI) | 0.82 [0.40, 1.69] |
| 7.4 worsening of psychiatric disorders ‐ medium term | 1 | 1214 | Risk Ratio (M‐H, Random, 95% CI) | 0.54 [0.22, 1.34] |
| 7.5 death ‐ medium term | 2 | 1666 | Risk Ratio (M‐H, Random, 95% CI) | 0.96 [0.14, 6.54] |
| 7.6 death ‐ long term | 1 | 749 | Risk Ratio (M‐H, Random, 95% CI) | 0.20 [0.01, 4.25] |
| 8 Adverse events: 2. Specific Show forest plot | 3 | Risk Ratio (M‐H, Random, 95% CI) | Subtotals only | |
| 8.1 overall rate ‐ medium term | 2 | 1666 | Risk Ratio (M‐H, Random, 95% CI) | 0.96 [0.86, 1.08] |
| 8.2 overall rate ‐ long term | 1 | 747 | Risk Ratio (M‐H, Random, 95% CI) | 1.03 [0.95, 1.11] |
| 8.3 insomnia ‐ medium term | 1 | 1214 | Risk Ratio (M‐H, Random, 95% CI) | 0.72 [0.49, 1.05] |
| 8.4 insomnia ‐ long term | 1 | 747 | Risk Ratio (M‐H, Random, 95% CI) | 0.99 [0.71, 1.40] |
| 8.5 psychotic disorder ‐ long term | 1 | 747 | Risk Ratio (M‐H, Random, 95% CI) | 0.86 [0.59, 1.24] |
| 8.6 worsening of schizophrenia ‐ long term | 1 | 747 | Risk Ratio (M‐H, Random, 95% CI) | 0.76 [0.49, 1.16] |
| 8.7 anxiety ‐ medium term | 1 | 1214 | Risk Ratio (M‐H, Random, 95% CI) | 0.50 [0.26, 0.96] |
| 8.8 anxiety ‐ long term | 1 | 747 | Risk Ratio (M‐H, Random, 95% CI) | 1.49 [1.01, 2.20] |
| 8.9 headache ‐ long term | 1 | 747 | Risk Ratio (M‐H, Random, 95% CI) | 1.21 [0.78, 1.87] |
| 8.10 constipation ‐ medium term | 1 | 1214 | Risk Ratio (M‐H, Random, 95% CI) | 3.79 [1.42, 10.08] |
| 8.11 injection site pain ‐ medium term | 2 | 1666 | Risk Ratio (M‐H, Random, 95% CI) | 0.16 [0.07, 0.38] |
| 8.12 somnolence ‐ medium term | 1 | 452 | Risk Ratio (M‐H, Random, 95% CI) | 0.56 [0.21, 1.49] |
| 8.13 weight gain (proportion of participants with >7% increase) ‐ medium term | 1 | 452 | Risk Ratio (M‐H, Random, 95% CI) | 1.12 [0.72, 1.75] |
| 8.14 tachycardia ‐ medium term | 1 | 452 | Risk Ratio (M‐H, Random, 95% CI) | 1.03 [0.26, 4.06] |
| 8.15 tachycardia ‐ long term | 1 | 747 | Risk Ratio (M‐H, Random, 95% CI) | 0.34 [0.11, 1.05] |
| 9 Adverse events: 3. Prolactin related Show forest plot | 3 | Risk Ratio (M‐H, Random, 95% CI) | Subtotals only | |
| 9.1 amenorrhoea ‐ medium term | 2 | 784 | Risk Ratio (M‐H, Random, 95% CI) | 1.78 [0.24, 13.02] |
| 9.2 galactorrhoea ‐ medium term | 1 | 271 | Risk Ratio (M‐H, Random, 95% CI) | 0.37 [0.02, 8.92] |
| 9.3 hyperprolactinaemia ‐ medium term | 1 | 452 | Risk Ratio (M‐H, Random, 95% CI) | 5.13 [0.60, 43.60] |
| 9.4 erectile dysfunction ‐ medium term | 1 | 701 | Risk Ratio (M‐H, Random, 95% CI) | 0.80 [0.18, 3.53] |
| 9.5 increase in serum prolactin ‐ medium term | 1 | 452 | Risk Ratio (M‐H, Random, 95% CI) | 0.72 [0.35, 1.48] |
| 9.6 amenorrhoea‐galactorrhoea syndrome ‐ medium term | 1 | 271 | Risk Ratio (M‐H, Random, 95% CI) | 3.3 [0.14, 80.29] |
| 9.7 any prolactin related ‐ medium term | 2 | 1666 | Risk Ratio (M‐H, Random, 95% CI) | 1.02 [0.61, 1.71] |
| 9.8 proportion of male participants with abnormally high prolactin ‐ long term | 1 | 424 | Risk Ratio (M‐H, Random, 95% CI) | 1.68 [1.32, 2.14] |
| 9.9 proportion of female participants with abnormally high prolactin ‐ long term | 1 | 294 | Risk Ratio (M‐H, Random, 95% CI) | 1.21 [0.95, 1.55] |
| 10 Adverse events: 4. Movement disorder Show forest plot | 3 | Risk Ratio (M‐H, Random, 95% CI) | Subtotals only | |
| 10.1 akathisia ‐ medium term | 1 | 452 | Risk Ratio (M‐H, Random, 95% CI) | 1.51 [0.98, 2.31] |
| 10.2 tremor ‐ medium term | 1 | 452 | Risk Ratio (M‐H, Random, 95% CI) | 1.71 [1.07, 2.74] |
| 10.3 tardive dyskinesia ‐ medium term | 1 | 1214 | Risk Ratio (M‐H, Random, 95% CI) | 1.00 [0.06, 15.90] |
| 10.4 requiring use of anti‐EPS medication ‐ medium term | 2 | 1666 | Risk Ratio (M‐H, Random, 95% CI) | 1.46 [1.18, 1.80] |
| 10.5 hyperkinesia ‐ long term | 1 | 747 | Risk Ratio (M‐H, Random, 95% CI) | 1.66 [1.00, 2.73] |
| 10.6 neuroleptic malignant syndrome ‐ long term | 1 | 747 | Risk Ratio (M‐H, Random, 95% CI) | 0.34 [0.01, 8.40] |
| 11 Adverse events: 5. Body weight (mean increase) Show forest plot | 3 | 2350 | Mean Difference (IV, Random, 95% CI) | 0.18 [‐0.36, 0.72] |
| 11.1 medium term | 2 | 1666 | Mean Difference (IV, Random, 95% CI) | ‐0.07 [‐0.38, 0.24] |
| 11.2 long term | 1 | 684 | Mean Difference (IV, Random, 95% CI) | 1.0 [0.13, 1.87] |
| 12 Adverse events: 6. Mean prolactin level increase (ng/mL) Show forest plot | 2 | Mean Difference (IV, Random, 95% CI) | Subtotals only | |
| 12.1 female participants | 2 | 807 | Mean Difference (IV, Random, 95% CI) | ‐3.40 [‐12.65, 5.85] |
| 12.2 male participants | 2 | 1125 | Mean Difference (IV, Random, 95% CI) | ‐0.43 [‐5.88, 5.03] |
| 13 Adverse events: 7. Glucose related Show forest plot | 3 | Risk Ratio (M‐H, Random, 95% CI) | Subtotals only | |
| 13.1 increased blood glucose ‐ long term | 1 | 747 | Risk Ratio (M‐H, Random, 95% CI) | 1.54 [0.44, 5.43] |
| 13.2 hyperglycaemia ‐ long term | 1 | 747 | Risk Ratio (M‐H, Random, 95% CI) | 1.37 [0.31, 6.09] |
| 13.3 diabetes mellitus ‐ long term | 1 | 747 | Risk Ratio (M‐H, Random, 95% CI) | 4.12 [0.46, 36.68] |
| 13.4 glycosuria ‐ long term | 1 | 747 | Risk Ratio (M‐H, Random, 95% CI) | 0.34 [0.01, 8.40] |
| 13.5 ketonuria ‐ long term | 1 | 747 | Risk Ratio (M‐H, Random, 95% CI) | 0.34 [0.01, 8.40] |
| 13.6 urine ketone body present ‐ long term | 1 | 747 | Risk Ratio (M‐H, Random, 95% CI) | 0.34 [0.01, 8.40] |
| 13.7 hypoglycaemia ‐ long term | 1 | 747 | Risk Ratio (M‐H, Random, 95% CI) | 3.09 [0.13, 75.59] |
| 13.8 any glucose related ‐ medium term | 2 | 1666 | Risk Ratio (M‐H, Random, 95% CI) | 1.76 [0.52, 5.98] |
| 13.9 any glucose related ‐ long term | 1 | 747 | Risk Ratio (M‐H, Random, 95% CI) | 1.80 [0.77, 4.25] |
| 14 Adverse events: 8. Injection site pain (mean (sd) Visual Analogue Scale score (0‐100mm)) Show forest plot | 1 | Mean Difference (IV, Random, 95% CI) | Subtotals only | |
| 14.1 at baseline | 1 | 747 | Mean Difference (IV, Random, 95% CI) | 1.80 [‐0.24, 3.84] |
| 14.2 at endpoint | 1 | 747 | Mean Difference (IV, Random, 95% CI) | 0.0 [‐1.07, 1.07] |
| Outcome or subgroup title | No. of studies | No. of participants | Statistical method | Effect size |
| 1 Mental state: 1. Total endpoint scores (PANNS, high score = worse) Show forest plot | 1 | Mean Difference (IV, Random, 95% CI) | Subtotals only | |
| 1.1 short term | 1 | 49 | Mean Difference (IV, Random, 95% CI) | 0.70 [‐8.12, 9.52] |
| 1.2 medium term | 1 | 46 | Mean Difference (IV, Random, 95% CI) | ‐0.10 [‐9.02, 8.82] |
| 1.3 long term | 1 | 43 | Mean Difference (IV, Random, 95% CI) | 1.80 [‐10.04, 13.64] |
| 2 Leaving the study early Show forest plot | 1 | Risk Ratio (M‐H, Random, 95% CI) | Subtotals only | |
| 2.1 before beginning assigned treatment | 1 | 62 | Risk Ratio (M‐H, Random, 95% CI) | 7.50 [1.00, 56.44] |
| 2.2 by 6 months | 1 | 62 | Risk Ratio (M‐H, Random, 95% CI) | 3.05 [1.12, 8.31] |
| 2.3 due to increased psychiatric symptoms | 1 | 62 | Risk Ratio (M‐H, Random, 95% CI) | 2.81 [0.31, 25.58] |
| 2.4 due to EPS effects | 1 | 62 | Risk Ratio (M‐H, Random, 95% CI) | 0.31 [0.01, 7.40] |
| 2.5 due to weight gain and hypertension | 1 | 62 | Risk Ratio (M‐H, Random, 95% CI) | 2.82 [0.12, 66.62] |
| 2.6 due to participant preference | 1 | 62 | Risk Ratio (M‐H, Random, 95% CI) | 0.94 [0.06, 14.33] |
| 3 Hospitalisation by 6 months Show forest plot | 1 | Risk Ratio (M‐H, Random, 95% CI) | Subtotals only | |
| 3.1 medium term | 1 | 62 | Risk Ratio (M‐H, Random, 95% CI) | 0.63 [0.11, 3.48] |
| 4 Adverse events: 1. Continuous outcomes (skew) Show forest plot | Other data | No numeric data | ||
| 4.1 Change in BMI ‐ short term (skew) | Other data | No numeric data | ||
| 4.2 Change in BMI ‐ medium term (skew) | Other data | No numeric data | ||
| 4.3 Change in BMI ‐ long term (skew) | Other data | No numeric data | ||
| 4.4 Prolactin endpoint levels (ng/mL) ‐ short term (skew) | Other data | No numeric data | ||
| 4.5 Prolactin endpoint levels (ng/mL) ‐ medium term (skew) | Other data | No numeric data | ||
| 4.6 Prolactin endpoint levels (ng/mL) ‐ long term (skew) | Other data | No numeric data | ||
| 5 Adverse events: 2. Sexual experiencesm, total endpoint (ASEX, high score = worse) Show forest plot | 1 | Mean Difference (IV, Fixed, 95% CI) | Subtotals only | |
| 5.1 short term | 1 | 44 | Mean Difference (IV, Fixed, 95% CI) | 1.70 [‐1.26, 4.66] |
| 5.2 medium term | 1 | 41 | Mean Difference (IV, Fixed, 95% CI) | 1.30 [‐2.30, 4.90] |
| 5.3 long term | 1 | 40 | Mean Difference (IV, Fixed, 95% CI) | ‐0.10 [‐4.08, 3.88] |