نقش ریسپریدون (دپو) در درمان اسکیزوفرنی
Appendices
Appendix 1. Previous searches
1.1 Search in 2002
1.1.1 Cochrane Schizophrenia Group's Register
We searched the Cochrane Schizophrenia Group's Register (December 2002) using the phrase:
[(risp* or * risp * or 9‐OH‐risperidone*) and (* depot* or * microsph* or * micro‐sp* or * long‐acting* or * long act*) in title, abstract, index terms of REFERENCE] or [(depot and risp*) in interventions of STUDY]
The Schizophrenia Group's Trials Register is based on regular searches of BIOSIS Inside, CENTRAL CINAHL, EMBASE, MEDLINE, PsycINFO, hand searching of relevant journals and conference proceedings, and searches of several key grey literature sources. A full description is given in the group's module.
1.2 Search in 2010
1.2.1 Cochrane Schizophrenia Group's Register
We searched the register using the phrase:
[((risp* or * risp * or 9‐OH‐risperidone*) and (* depot* or * microsph* or * micro‐sp* or * long‐acting* or * long act*) in title, abstract, index terms of REFERENCE) or ((depot and risp*) in interventions of STUDY)]
This register is compiled by systematic searches of major databases, hand searches and conference proceedings (see Group's Module).
1.3 Search in 2012
1.3.1 Electronic searches
1.3.1.1 Cochrane Schizophrenia Group Trials Register (October 2012)
Using the phrase:
[(risp* or * risp * or *9‐OH‐risperidone*) and (* depot* or * microsph* or * micro‐sp* or * long‐acting* or * long act*) in title, abstract, index terms of REFERENCE] or [((*depot* or *long* or *LAI*) and *risp*) in interventions of STUDY]
1.3.1.2 Economic study search of Cochrane Schizophrenia Group Health Economic Database (2013)
For the economic search, we replicated the above strategy in the Cochrane Schizophrenia Group Health Economic Database (CSzGHED) on 31 January 2014. The database of studies relates to cost‐effectiveness of schizophrenia treatments. This database was constructed from systematic searches of four databases: Health Economic Evaluation Database (HEED), National Health Services Health Economic Database (NHS EED), Cost‐Effectiveness Analysis Registry (CEA) and EconLit as well as Cochrane Registry.
1.3.2 Searching other resources
1.3.2.1 Reference searching
The reviewers inspected references of all identified studies for more studies.
1.3.2.2 Personal contact
The reviewers attempted to contacted the first author of each study considered for inclusion in the review for more information regarding unpublished trials or any data available.
1.3.2.3 Drug companies
The reviewers contacted the Janssen‐Cilag Limited for further data.
Appendix 2. Previous data collection and analysis
1. Selection of trials
Two reviewers (PH, JD) independently inspected the citations identified from the search. Potentially relevant abstracts were identified and full papers ordered and reassessed for inclusion and methodological quality. Any disagreement was discussed and reported.
2. Quality assessment
Trials were allocated to three quality categories, as described in the Cochrane Collaboration Handbook (Clarke 2002) by each reviewer, again, working independently. When disputes arose as to which category a trial was allocated, resolution was attempted by discussion. When this was not possible, and further information was necessary, data were not entered into the analyses and the study was allocated to the list of those awaiting assessment. Only trials in Category A or B were included in the review.
3. Data management
3.1 Data extraction
Two reviewers (PH, JD) independently extracted data and, where further clarification was needed, contacted authors of trials to provide missing data.
3.2 Intention to treat analysis
Data were excluded from studies where more than 50% of participants in any group were lost to follow‐up (this did not include the outcome of 'leaving the study early'). In studies with less than 50% drop‐out rate, people leaving early were considered to have had the negative outcome, except for the event of death. The impact of including studies with high attrition rates (25‐50%) was analysed in a sensitivity analysis for primary outcomes. If inclusion of data from this latter group did result in a substantive change in the estimate of effect, the data were not added to trials with less attrition, but presented separately.
4. Data analysis
4.1 Binary data
For binary outcomes a standard estimation of the risk ratio (RR) and its 95% confidence interval (CI) was calculated. The number needed to treat statistic (NNT) was also calculated. If heterogeneity was found (see section 5) a random effects model was used.
4.2 Continuous data
4.2.1 Intention‐to‐treat analyses versus analyses that only take into account those who completed the study: in the case of continuous data, it was supposed that in many cases an intention‐to‐treat analysis would not be available, so an analysis was presented on those who completed the study.
4.2.2 Rating scales: a wide range of instruments is available to measure mental health outcomes. These instruments vary in quality and many are not valid, or even ad hoc. For outcome instruments some minimum standards have to be set. Continuous data from rating scales were included only if the measuring instrument had been described in a peer‐reviewed journal (Marshall 2000), the instrument was either a self report or completed by an independent rater or relative (not the therapist), and the instrument could be considered a global assessment of an area of functioning. However, as it was expected that therapists would frequently also be the rater, such data was tagged as 'prone to bias'.
4.2.3 Normal distribution of data: mental health continuous data are often not normally distributed. Most statistics assume a normal distribution. To avoid including non‐normally distributed data in the statistical analysis, the following criteria are applied to all data before inclusion:
a. Standard deviations and means were reported or derivable from data in the paper, or were obtainable from the authors.
b. When a scale started from zero, the standard deviation, when multiplied by two, was less than the mean (as otherwise the mean was unlikely to be an appropriate measure of the centre of the distribution (Altman 1996). Endpoint scores on scales often have a finite start and end point and this rule can be applied to them.
c. When continuous data are presented on a scale which includes a possibility of negative values (such as change on a scale) it is impossible to tell whether data are non‐normally distributed (skewed) or not. It is thus preferable to use scale endpoint data, which typically cannot have negative values. If endpoint data were not available, reviewers chose to use change data, because the statistics used in Metaview are rather robust towards skew.
d. If a scale starts from a positive value (such as PANSS, which can have values from 30‐210) the calculation described above in (b) should be modified to take the scale starting point into account. In these cases skew is present if 2SD>(S‐Smin), where S is the mean score and Smin is the minimum score.
4.2.4 Endpoint versus change data: endpoint scale‐derived data are finite, ranging from one score to another. Change data are more problematic and for it the rule described above does not hold. Although most change scores are likely to be skewed, this cannot be proven so they were presented in MetaView. Where both endpoint and change were available for the same outcome, we presented the former in preference.
4.2.5 Summary statistic: for continuous outcomes, a weighted mean difference (WMD) between groups was estimated. Again, a random effects model was used.
4.3 Cluster trials
Studies increasingly employ 'cluster randomisation' (such as randomisation by clinician or practice) but analysis and pooling of clustered data poses problems. Firstly, authors often fail to account for intra class correlation in clustered studies, leading to a 'unit of analysis' error (Divine 1992) ‐ whereby p values are spuriously low, confidence intervals unduly narrow and statistical significance overestimated ‐ causing type I errors (Bland 1997, Gulliford 1999). Secondly, RevMan does not currently support meta‐analytic pooling of clustered dichotomous data, even when these are correctly analysed by the authors of primary studies, since the 'design effect' (a statistical correction for clustering) cannot be incorporated.
Where clustering was not accounted for in primary studies, we presented data in a table, with an asterisk (*) symbol to indicate the presence of a probable unit of analysis error. In subsequent versions of this review we will seek to contact first authors of studies, to seek intra‐class correlation co‐efficients of their clustered data and to adjust for this using accepted methods (Gulliford 1999). Where clustering had been incorporated into the analysis of primary studies, then we presented these data in a table. No further secondary analysis (including meta‐analytic pooling) will be attempted until there is consensus on the best methods of doing so, and until RevMan, or any other software, allows this. A Cochrane Statistical Methods Workgroup is currently addressing this issue. In the interim, individual studies were very crudely classified as positive or negative, according to whether a statistically significant result (p<0. 05) was obtained for the outcome in question, using an analytic method that allows for clustering.
5. Test for heterogeneity
A Chi‐square test was used, as well as visual inspection of graphs, to investigate the possibility of heterogeneity. A significance level less than 0.10 was interpreted as evidence of heterogeneity. If heterogeneity was found, the data were re‐analysed using a random effects model to see if this made a substantial difference. If it did, the studies responsible for heterogeneity were not added to the main body of homogeneous trials, but summated and presented separately and reasons for heterogeneity investigated.
6. Addressing publication bias
Data from all included studies were entered into a funnel graph (trial effect against trial size) in an attempt to investigate the likelihood of overt publication bias (Egger 1997).
7. Sensitivity analyses
The effect of including studies with high attrition rates was analysed in a sensitivity analysis.
8. General
Where possible, reviewers entered data in such a way that the area to the left of the line of no effect indicated a favourable outcome for depot risperidone.
Appendix 3. Previous description of studies
4. Included studies
Two studies, reported as nine conference presentations and one full paper met the selection criteria and are included.
4.1 Study design
All included studies were randomised and X featured some form of blinding, though the extent of this varied widely.
Chue 2002 involved an eight‐week run in period preceding randomisation. In the first two weeks, antipsychotic drugs other than risperidone were discontinued and oral risperidone introduced. In the next two weeks the risperidone dose was optimised and then people continued on this dose of oral risperidone for another four weeks before randomisation. Kane 2002* had a two‐week run in period preceding randomisation. The first week was a screening week followed by seven days during which people were started on oral risperidone and the dose was titrated to 4mg/day.
4.2 Participants
People entering both studies met the criteria for DSM IV schizophrenia, so for at least six continuous months a participant must have shown some evidence of schizophrenia, and for at least one month must have shown at least two symptoms of frank psychosis. These symptoms would include delusions, hallucinations, incoherent speech, disorganised or catatonic behaviour, or flat affect. To meet DSM IV criteria, the symptoms must be disabling in such a way that social and occupational functioning is impaired; these symptoms should not be the direct result of a physical disorder or of substance misuse.
For Kane 2002* people who had substance dependence, tardive dyskinesia or a history of neuroleptic malignant syndrome, ECG abnormalities, suicidal ideas or risk of violent behaviour were excluded. Patients who had a history of unresponsiveness to risperidone were also excluded.
Chue 2002 also stipulated that participants should have a total PANSS score of at least 50. This, in addition to the fulfilment the DSM IV criteria, means that people with at least some active symptoms of illness were included. In effect, despite the rigorous entry criteria, nearly 47% of people entering this study were rated by the authors as ''not ill'' or only ''mildly ill'' at baseline assessment on the CGI scale before randomisation. Chue 2002 randomised 640 people. Kane 2002*, however, randomised 400 people who appeared to be more severely ill. They had a baseline PANSS score in the range of 60‐120, with an average of about 80.
In both studies, participants were mainly men (about 70%) with an average age of about 40 years.
4.3 Interventions
Chue 2002 randomised people to an active injection every two weeks and placebo tablets daily, or a placebo injection every two weeks and active tablets daily. Depending on the optimal stabilisation dose the person was randomised to continue that oral regimen or start the 'equivalent' dose of depot. For example, 2mg of oral risperidone per day was taken as being equivalent to 25mg of depot risperidone every two weeks. It is not clear, however, how the conversion dose was arrived at.
Kane 2002* randomised people to either a placebo injection or 25mg or 50mg or 75mg of depot risperidone every two weeks. People also received either placebo tablets or 2mg or 4mg or 6mg of oral risperidone respectively for the first three weeks after randomisation.
4.4 Outcomes
4.4.1 Global improvement
Chue 2002 reported global improvement in the form of the percentage of people who were not ill or mildly ill on the Clinical Global Impression (CGI) scale at the end of the study period. Throughout this study results are reported for oral and depot groups as a whole, and not for specific dosage groups of depot. Chue 2002 did not report mean or change scores in the abstracts available for this review. Kane 2002* also used the CGI but reported average change from baseline to endpoint and data were unusable due to the substantial attrition.
4.4.2 Mental state
Kane 2002* interpreted an improvement of more than 20% in PANSS total score as clinically important. This study also reported average change at endpoint from baseline in PANSS total, PANSS positive and PANSS negative but again so much data were lost because people left the study early that the results of the PANSS were unusable. Chue 2002 reported average change scores on PANSS total at endpoint in both the composite oral and depot groups. Chue 2002 did not seem to stipulate cut off points as 'clinically important improvement'.
4.4.3 Leaving the study early
Both studies reported numbers discontinuing the study and specific reasons for this, such as adverse events, compliance problems and insufficient responses.
4.4.4 Adverse effects
Chue 2002 reported overall rates of adverse events in both groups, and the numbers withdrawing from the study as a result of side effects. No details were given regarding the nature of these adverse events or how they were recorded. The abstracts available for this review state that body weight was measured and laboratory tests were undertaken. The reports state that there were no differences between oral and depot groups, but present no numbers. Chue 2002 also used the Extrapyramidal Symptom Rating Scale (ESRS) but, again, no numerical data were reported. Kane 2002* reported rates of individual adverse events spontaneously reported by participants, and reported these for all people in the study, not just those who completed the trial. Median ESRS scores were also reported for each group at baseline and change at endpoint. Pain and swelling at injection sites rated by investigators and patients were also reported.
4.4.5 Outcome measures used in this review
Global functioning. Clinical Global Impression ‐ CGI (Guy 1976)
A rating instrument commonly used in studies on schizophrenia that enables clinicians to quantify severity of illness and overall clinical improvement during therapy. A seven‐point scoring system is usually used with low scores indicating decreased severity and/or greater recovery.
Positive and Negative Symptom Scale ‐ PANSS (Kay 1987)
This scale was developed to evaluate the positive, negative and general symptoms in schizophrenia. The PANSS has 30 items, and each item can be defined on a seven‐point scoring system varying from one (absent) to seven (extreme). This scale is divided into three subscales for measuring the severity of general psychopathology, positive symptoms (PANSS‐P) and negative symptoms (PANSS‐N). A low score indicates lesser severity.
Extrapyramidal Symptom Rating Scale ‐ ESRS (Chouinard 1980)
This consists of a questionnaire relating to parkinsonian symptoms (nine items), a physician's examination for parkinsonism and dyskinetic movements (eight items) and a clinical global impression of tardive dyskinesia. High scores indicate severe levels of movement disorder.
4.4.6 Missing outcomes
There are no data for outcomes beyond three months. Neither are data available on general functioning and change in behaviour. Nor were there any details on service outcomes, engagement with services, satisfaction with services, quality of life or economic outcomes.
Appendix 4. Previous Chue write up
3. COMPARISON: 2. DEPOT RISPERIDONE vs ORAL RISPERIDONE
Chue 2002 compared depot risperidone against oral risperidone
3.1 Global improvement
The study did not report mean scores on the CGI scale. The trialists did report percentage of people mildly ill or not ill in both the depot risperidone and oral risperidone groups at the end of the study period, as rated using the CGI (about 57% as read from the graph, compared to 47% at baseline). Hence 43% must have been moderately ill or severely ill at the end of the study period. There was no difference between the depot group and the oral group (n=640, RR 1.06 CI 0.92 to 1.22).
3.1.1 Mental state
Chue 2002 reported both average end score and change across time. For endpoint score there was no difference between groups (MD 0.00 CI ‐2.91 to 2.91), nor was there any difference between depot and oral risperidone for average change in the total PANSS score (n=541, WMD ‐0.90 CI ‐2.84 to 1.04), PANSS positive (WMD ‐0.30 CI ‐0.86 to 0.26) and PANSS negative scores (WMD ‐0.10 CI ‐0.93 to 0.73).
3.2 Poor compliance
Compliance was measured in several ways. Most people received at least four injections (83.4% in the depot group and 85.6% in the oral risperidone group, n=640, RR <4 injections or "major protocol violation" 1.16 CI 0.81 to 1.67). There was no difference between groups in the rate of discontinuation before the end of the 12‐week study (n=640, RR 1.27 CI 0.90 to 1.78). Please note that 'compliance' in this context could apply to protocol violation for many reasons only one of which would be non‐compliance with the study drugs."
3.3 Adverse effects
Adverse events are reported in order of severity. One death was reported in the oral risperidone group (n=640, RR death 1.04 CI 0.91 to 1.18). Low proportions of people had to withdraw from the study due to adverse events and there were no differences between the oral and depot preparation (n=640, RR 1.21 CI 0.62 to 2.35). Over half of both groups reported some adverse effects (n=640, RR 1.04 CI 0.91 to 1.18)
Appendix 5. Previous discussion
4. COMPARISON: 1. DEPOT RISPERIDONE vs PLACEBO
4.1 Global improvement
No meaningful conclusions can be drawn as more than 50% of patients did not complete the trial. Hence the authors' conclusion that depot risperidone is superior to placebo is based on very limited data. Currently clinicians, recipients of care and researchers do not know if risperidone depot is any better than placebo in terms of global improvement in the short term.
4.2 Mental state
The main mental state outcome (20% improvement in the PANSS total score) conveys no useful information as half the data are based on an assumption. From data presented on adverse effects, it is possible to get some data on mental state. Risperidone depot does not seem to affect symptoms of anxiety or nervousness but it may decrease agitation. There is no evidence that depot risperidone effects hallucination but the frequency of 'psychosis' was reduced. We are unsure what this means when both are reported as adverse effects. Overall the information regarding the effects on mental state of long acting risperidone compared with placebo is poor.
4.3 Leaving the study early.
The majority of participants did not complete the 12‐week study period which makes it difficult to believe that depot risperidone might improve compliance. The drop out rate was higher in the placebo group but the NNT was six. Six people have to be treated with risperidone depot to avoid one person being leaving care when compared to the attrition from placebo injection treatment.
4.4 Adverse effects
Only spontaneously reported adverse events in more than 5% of the participants were reported. Adverse effects which were not reported by the patient, or that were infrequent might have gone unnoticed. Serious adverse effects (those that resulted in death or were life threatening, required hospitalisation or prolongation of hospitalisation, resulted in persistent or significant disability or incapacity, or resulted in congenital anomaly or birth defect) were reported in such a way that the reviewers were left in some doubt about safety. Firstly, overall, these were common (13‐23%). Although there was no collective difference between the experimental and control groups it is feasible that those allocated to placebo needed 'prolongation of hospitalisation' and those given the depot drug encountered 'life threatening' effects. The lack of statistical difference in the 'lumped' data could mask real and disturbing effects. This review does not reassure users of long acting risperidone as regards safety.
The adverse effects that were reported clearly tended to suggest that the depot compound did cause some unwanted effects and that there may be a dose effect. The movement disorder effects were convincing of this. This 'atypical' drug seems to cause extrapyramidal effects, hyperkinesis and hypertonia, especially at the higher doses.
This depot may also cause more sleepiness and weight gain than placebo, but, as for all these adverse effects, more data are needed to confirm this.
5. COMPARISON: 2. DEPOT RISPERIDONE vs ORAL RISPERIDONE
Chue 2002 compared depot risperidone with oral risperidone. The main problem with this study is that it involved well people who are unlikely to be those for whom depot is very relevant.
5.1 Global improvement
Data were difficult to extract from the conference proceedings and may have to be revised once the full paper is published, but there seems to be very little difference between the depot and oral forms of risperidone in terms of global improvement. This is encouraging, suggesting that the depot form is as effective as the oral. People already doing well on oral risperidone will continue to do so with depot risperidone.
5.2 Mental state
Depot risperidone is similar to oral risperidone in terms of the changes in PANSS scores, thus confirming the impression that there is little difference between the oral and depot preparations for people who are compliant.
5.3 Poor compliance
One major reason for giving a depot is to aid poor compliance. For this client group, there was no difference between the oral and depot groups in terms of several ways of measuring compliance. This probably reflects the design of the study where only compliant people were asked to participate. This greatly reduces the value of the study for generalising to real world circumstances.
5.4 Adverse effects.
Again there is no clear difference between the oral and depot forms of risperidone, although more data may be available in the fully published paper. However, it should be noted that over half of both groups reported some adverse effects.
COMPARISON: 3. DEPOT RISPERIDONE VS PALIPERIDONE PALMITATE
Summary of main results
Overall completeness and applicability of evidence
3. Limited data
3.1 Loss of data
Schizophrenia is often a chronic illness, which may require medication on a long‐term basis. In Kane 2002*, 56% of patients left the study in the first 12 weeks. We will discuss the differential loss to follow‐up below, but it would be difficult to encourage long‐term use of depot risperidone based on the findings of this study. It is likely that this huge loss of patients, greater than would be expected in clinical practice, may result from the limitations of study design where a rigid protocol is imposed on people who are unwell. When a similar protocol is implemented on reasonably well people attrition is less (17%, Chue 2002). Clinicians prefer depot for people who are already having difficulty in complying with treatment. In such a situation clinical common sense indicates that depot preparation may be more helpful, but pragmatic trials are required to confirm this.
3.2 Missing outcomes
Risperidone depot is one of the options for the long‐term treatment of people with schizophrenia. However, there are no outcomes rated beyond 12 weeks in the current studies, and much of the three‐month data are 'carried forward' from the true time the person decided to leave the study. There are hardly any data on general functioning and change in behaviour, and none on service outcomes, engagement with services, satisfaction with services, quality of life or costs. It would seem important to address these deficiencies.
3.3 Problematic outcomes
More clarity is needed in the reporting of adverse effects. In Kane 2002*, only spontaneously reported adverse events occurring in more than 5% of patients are recorded. This raises the possibility that some rare but clinically important adverse events may have been under‐reported. In the conference proceedings we have for Chue 2002, no specific adverse effects, except death, are reported. We recognise that it is a huge task to report every adverse event but unless careful attention is paid to rare adverse events they might go unnoticed.
The Kane 2002* full paper also groups severe adverse effects in an unusual way. It is possible that the lumping together of several 'severe' effects, some of which may be not as severe as others, could mask real effects of the interventions.
2. Applicability
2.1 Diagnosis
Both the included studies used DSM IV operational criteria to help select participants. The use of these criteria means that participants are homogenous and that the study subsequently has greater internal validity, but external validity, i.e. applicability to the every day world of psychiatric care, is likely to be limited.
2.2 Severity of illness
Chue 2002 included only people who were already stabilised on oral risperidone. Even though the inclusion criteria stipulated a PANSS score of >50, nearly half the participants were described as mildly ill or not ill at all on the CGI scale at baseline. From this study one can only infer the effects of depot risperidone on stable, reasonably well people. This study does not answer questions as to whether depot risperidone is helpful for people who are very ill. Kane 2002*, however, includes patients who were experiencing more symptoms, as observed by the high baseline PANSS total score.
Quality of the evidence
1. Quality of studies
It is disappointing that the reporting of studies was not better. Perhaps to hope that CONSORT requirements (Moher 2001) should be met in conference proceedings is ambitious, but at least they should be considered when they are published in full. Both studies appear to be vulnerable to inclusion bias in favour of risperidone depot.

Study flow diagram: 2010 and 2012, 2015 updated search


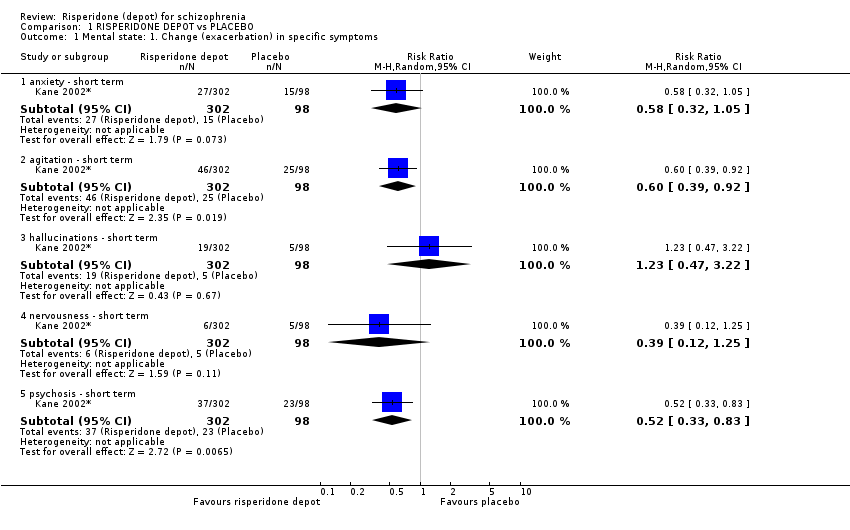
Comparison 1 RISPERIDONE DEPOT vs PLACEBO, Outcome 1 Mental state: 1. Change (exacerbation) in specific symptoms.
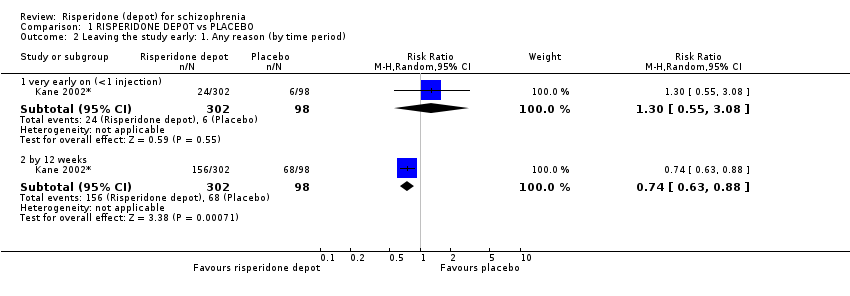
Comparison 1 RISPERIDONE DEPOT vs PLACEBO, Outcome 2 Leaving the study early: 1. Any reason (by time period).
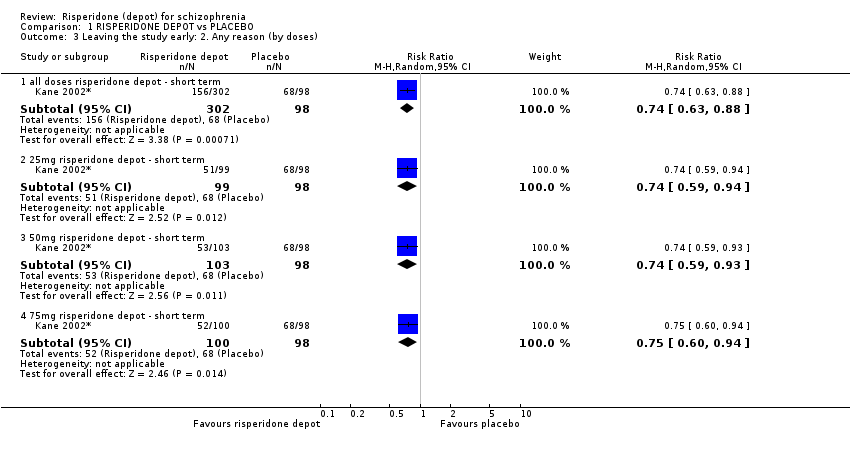
Comparison 1 RISPERIDONE DEPOT vs PLACEBO, Outcome 3 Leaving the study early: 2. Any reason (by doses).

Comparison 1 RISPERIDONE DEPOT vs PLACEBO, Outcome 4 Leaving the study early: 3. Because of insufficient response (by doses).
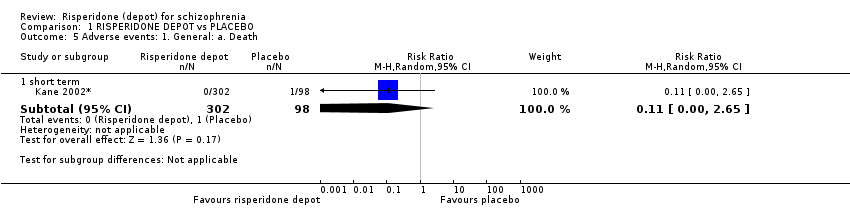
Comparison 1 RISPERIDONE DEPOT vs PLACEBO, Outcome 5 Adverse events: 1. General: a. Death.

Comparison 1 RISPERIDONE DEPOT vs PLACEBO, Outcome 6 Adverse events: 1. General: b. Severe adverse event (by doses).

Comparison 1 RISPERIDONE DEPOT vs PLACEBO, Outcome 7 Adverse events: 1. General: c. Adverse event necessitating withdrawal from study (by doses).

Comparison 1 RISPERIDONE DEPOT vs PLACEBO, Outcome 8 Adverse events: 2. Specific: a. Cardiovascular.

Comparison 1 RISPERIDONE DEPOT vs PLACEBO, Outcome 9 Adverse events: 2. Specific: b. Gastrointestinal.
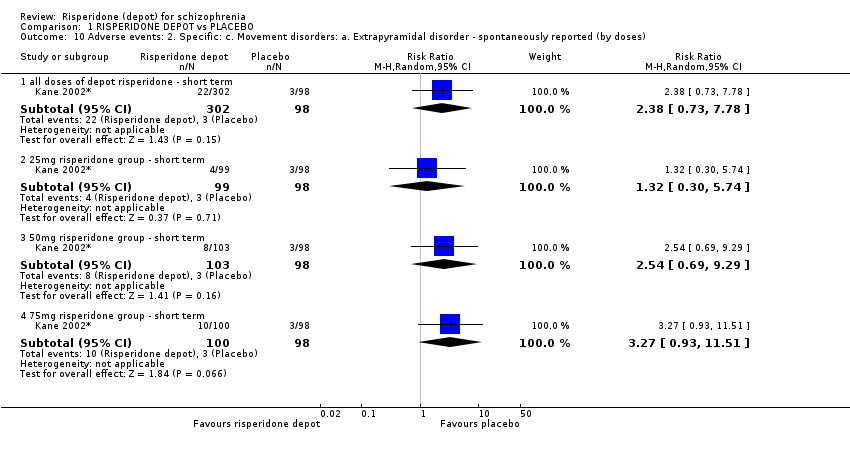
Comparison 1 RISPERIDONE DEPOT vs PLACEBO, Outcome 10 Adverse events: 2. Specific: c. Movement disorders: a. Extrapyramidal disorder ‐ spontaneously reported (by doses).
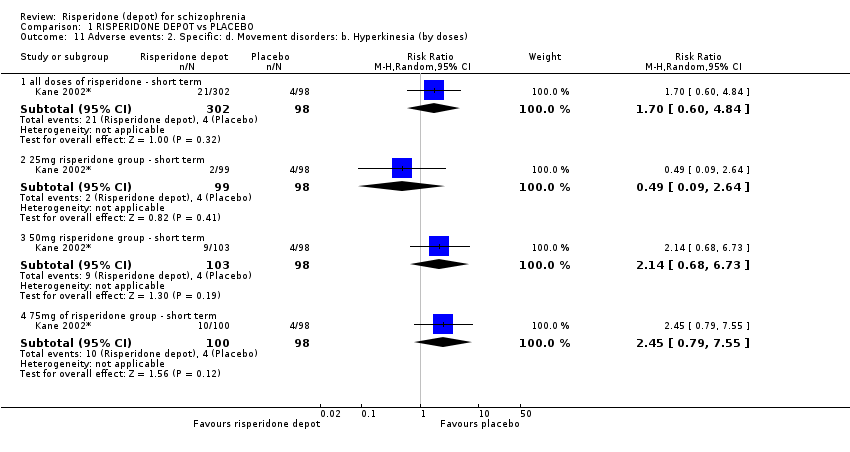
Comparison 1 RISPERIDONE DEPOT vs PLACEBO, Outcome 11 Adverse events: 2. Specific: d. Movement disorders: b. Hyperkinesia (by doses).

Comparison 1 RISPERIDONE DEPOT vs PLACEBO, Outcome 12 Adverse events: 2. Specific: e. Movement disorders: c. Hypertonia (by doses).

Comparison 1 RISPERIDONE DEPOT vs PLACEBO, Outcome 13 Adverse events: 2. Specific: f. Pain.

Comparison 1 RISPERIDONE DEPOT vs PLACEBO, Outcome 14 Adverse events: 2. Specific: g. Salivation.

Comparison 1 RISPERIDONE DEPOT vs PLACEBO, Outcome 15 Adverse events: 2. Specific: h. Sleep disturbances.

Comparison 1 RISPERIDONE DEPOT vs PLACEBO, Outcome 16 Adverse events: 2. Specific: i. Weight gain.
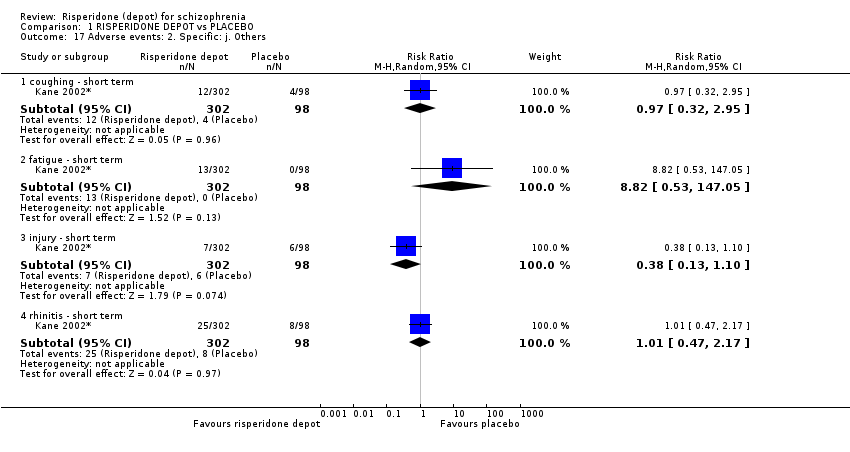
Comparison 1 RISPERIDONE DEPOT vs PLACEBO, Outcome 17 Adverse events: 2. Specific: j. Others.

Comparison 2 RISPERIDONE DEPOT vs GENERAL ORAL ANTIPSYCHOTICS, Outcome 1 Global state: 1. Relapse (any reason).

Comparison 2 RISPERIDONE DEPOT vs GENERAL ORAL ANTIPSYCHOTICS, Outcome 2 Global state: 2. Needing use of benzodiazepine or sedative drugs.
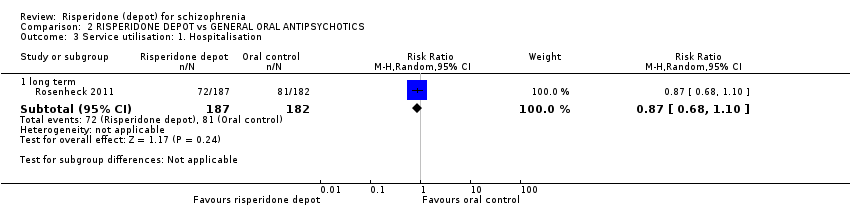
Comparison 2 RISPERIDONE DEPOT vs GENERAL ORAL ANTIPSYCHOTICS, Outcome 3 Service utilisation: 1. Hospitalisation.
| Study | Intervention | Mean | SD | N |
| long term | ||||
| Rosenheck 2011 | Risperidone depot | 122.4 | 130.9 | 187 |
| Rosenheck 2011 | Oral control | 136.5 | 137 | 182 |
Comparison 2 RISPERIDONE DEPOT vs GENERAL ORAL ANTIPSYCHOTICS, Outcome 4 Service utilisation: 2. Outpatient care ‐ number of outpatient visits (skewed data).
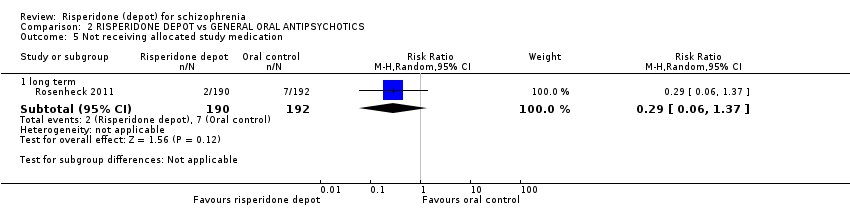
Comparison 2 RISPERIDONE DEPOT vs GENERAL ORAL ANTIPSYCHOTICS, Outcome 5 Not receiving allocated study medication.

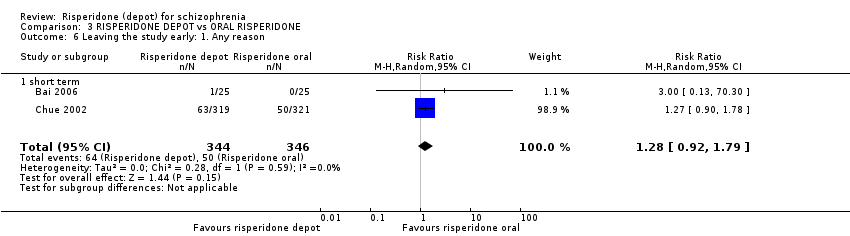
Comparison 2 RISPERIDONE DEPOT vs GENERAL ORAL ANTIPSYCHOTICS, Outcome 6 Leaving the study early: 1. Any reason.

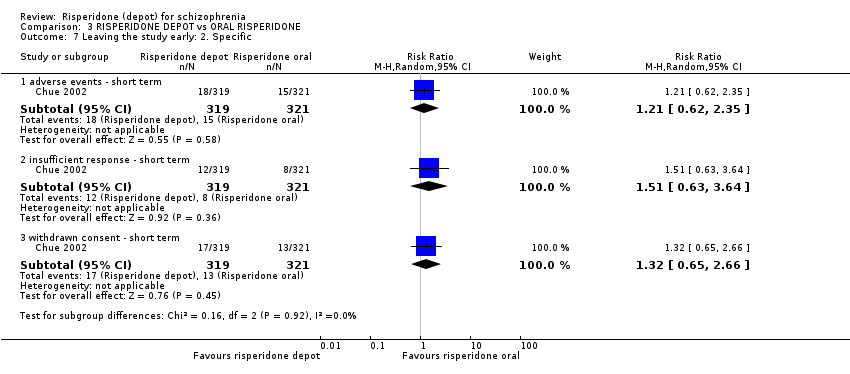
Comparison 2 RISPERIDONE DEPOT vs GENERAL ORAL ANTIPSYCHOTICS, Outcome 7 Leaving the study early: 2. Specific.

Comparison 2 RISPERIDONE DEPOT vs GENERAL ORAL ANTIPSYCHOTICS, Outcome 8 Adverse events: 1. General: a. Death.

Comparison 2 RISPERIDONE DEPOT vs GENERAL ORAL ANTIPSYCHOTICS, Outcome 9 Adverse events: 2. Specific.

Comparison 2 RISPERIDONE DEPOT vs GENERAL ORAL ANTIPSYCHOTICS, Outcome 10 Adverse events: Nervous system disorders (inc. EPS).

Comparison 3 RISPERIDONE DEPOT vs ORAL RISPERIDONE, Outcome 1 Global state: 1. Moderate to severely ill at end of study period (CGI rating).

Comparison 3 RISPERIDONE DEPOT vs ORAL RISPERIDONE, Outcome 2 Global state: 2. Mean change from baseline (CGI‐S, high score = worse).

Comparison 3 RISPERIDONE DEPOT vs ORAL RISPERIDONE, Outcome 3 Global state: 3. Mean (SD) GAF score change to endpoint.

Comparison 3 RISPERIDONE DEPOT vs ORAL RISPERIDONE, Outcome 4 Global state: 4. Needing use of benzodiazepine or sedative drugs.

Comparison 3 RISPERIDONE DEPOT vs ORAL RISPERIDONE, Outcome 5 Mental state: 1. Average change/endpoint scores (PANSS, high score = worse).
Comparison 3 RISPERIDONE DEPOT vs ORAL RISPERIDONE, Outcome 6 Leaving the study early: 1. Any reason.
Comparison 3 RISPERIDONE DEPOT vs ORAL RISPERIDONE, Outcome 7 Leaving the study early: 2. Specific.

Comparison 3 RISPERIDONE DEPOT vs ORAL RISPERIDONE, Outcome 8 Quality of life: Mean (SD) SF‐36 score change/endpoint (high score = better).

Comparison 3 RISPERIDONE DEPOT vs ORAL RISPERIDONE, Outcome 9 Adverse events: 1. General.
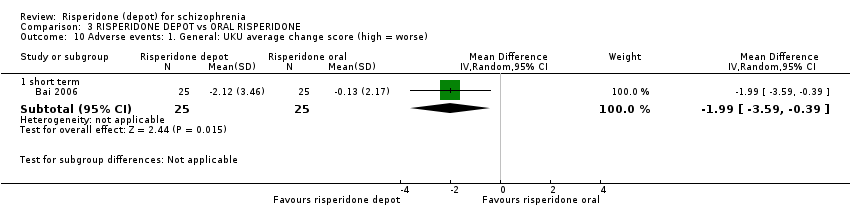
Comparison 3 RISPERIDONE DEPOT vs ORAL RISPERIDONE, Outcome 10 Adverse events: 1. General: UKU average change score (high = worse).
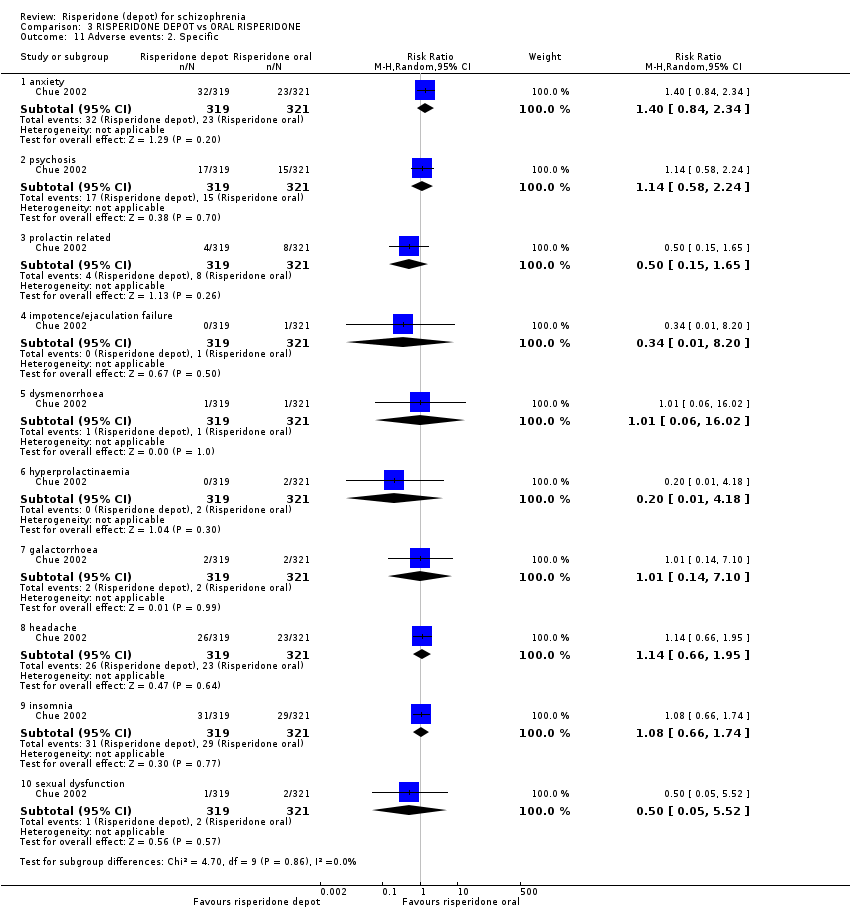
Comparison 3 RISPERIDONE DEPOT vs ORAL RISPERIDONE, Outcome 11 Adverse events: 2. Specific.

Comparison 3 RISPERIDONE DEPOT vs ORAL RISPERIDONE, Outcome 12 Adverse events: 2. Specific: Mean (SD) weight increase in kg.
Comparison 3 RISPERIDONE DEPOT vs ORAL RISPERIDONE, Outcome 13 Adverse events: 3. Movement disorder.
Comparison 3 RISPERIDONE DEPOT vs ORAL RISPERIDONE, Outcome 14 Adverse events: Mean (SD) change in movement disorder rating scales.
Comparison 4 RISPERIDONE DEPOT vs ORAL QUETIAPINE, Outcome 1 Leaving the study early: 1. Any reason.
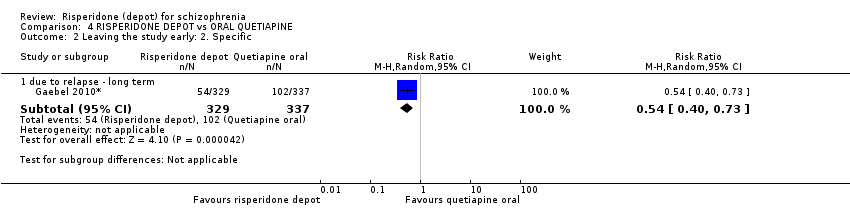
Comparison 4 RISPERIDONE DEPOT vs ORAL QUETIAPINE, Outcome 2 Leaving the study early: 2. Specific.

Comparison 4 RISPERIDONE DEPOT vs ORAL QUETIAPINE, Outcome 3 Adverse events: 1. General.
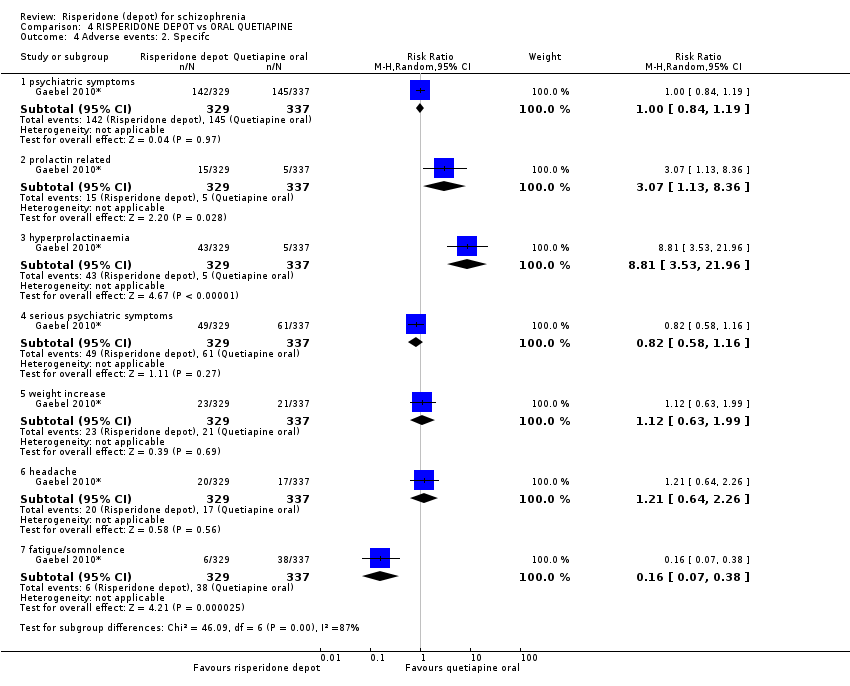
Comparison 4 RISPERIDONE DEPOT vs ORAL QUETIAPINE, Outcome 4 Adverse events: 2. Specifc.

Comparison 4 RISPERIDONE DEPOT vs ORAL QUETIAPINE, Outcome 5 Adverse events: 2. Specific: Mean (SD) weight increase in kg.
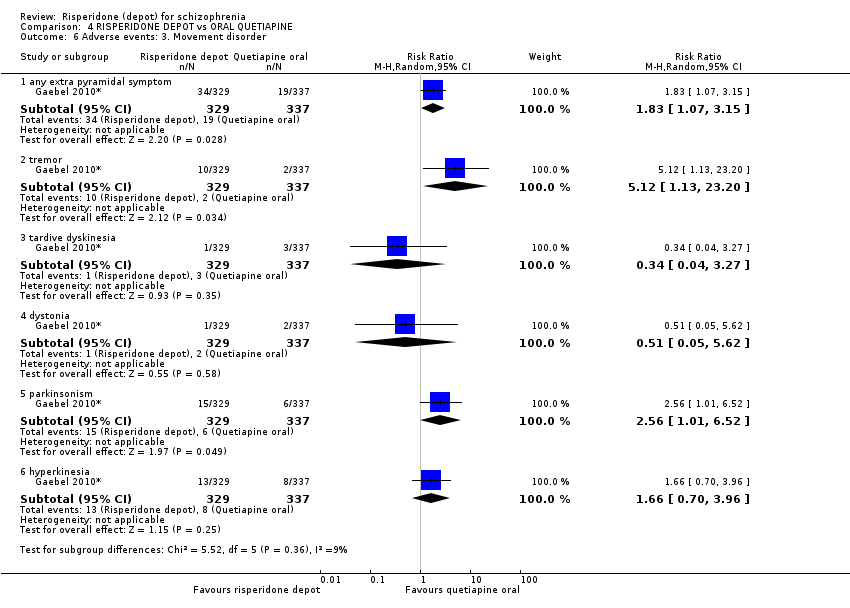
Comparison 4 RISPERIDONE DEPOT vs ORAL QUETIAPINE, Outcome 6 Adverse events: 3. Movement disorder.

Comparison 5 RISPERIDONE DEPOT vs ORAL ARIPIPRAZOLE, Outcome 1 Global state: 1. Relapse (any reason).

Comparison 5 RISPERIDONE DEPOT vs ORAL ARIPIPRAZOLE, Outcome 2 Global state: 3. Mean time in remission (days).

Comparison 5 RISPERIDONE DEPOT vs ORAL ARIPIPRAZOLE, Outcome 3 Mental state: 1. Average change scores (PANSS, high score = worse).

Comparison 5 RISPERIDONE DEPOT vs ORAL ARIPIPRAZOLE, Outcome 4 Leaving the study early: 1. Any reason.

Comparison 5 RISPERIDONE DEPOT vs ORAL ARIPIPRAZOLE, Outcome 5 Leaving the study early: 2. Specific.
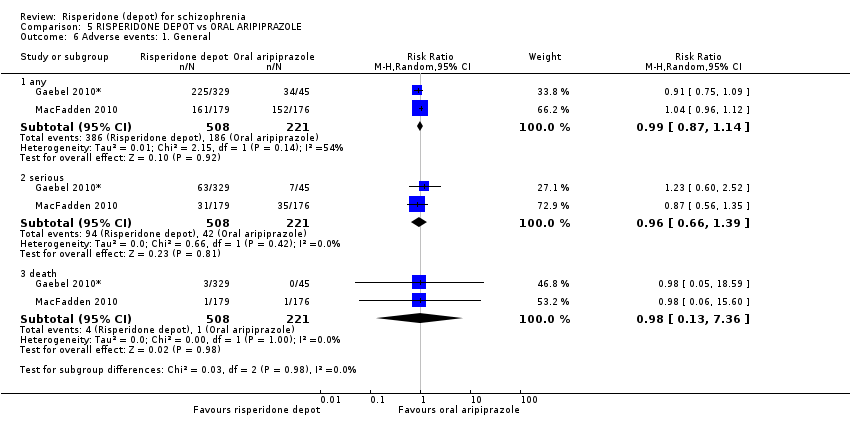
Comparison 5 RISPERIDONE DEPOT vs ORAL ARIPIPRAZOLE, Outcome 6 Adverse events: 1. General.

Comparison 5 RISPERIDONE DEPOT vs ORAL ARIPIPRAZOLE, Outcome 7 Adverse events: 2. Specific.

Comparison 5 RISPERIDONE DEPOT vs ORAL ARIPIPRAZOLE, Outcome 8 Adverse events: 2. Specific 12. Mean (SD) weight increase in kg.
Comparison 5 RISPERIDONE DEPOT vs ORAL ARIPIPRAZOLE, Outcome 9 Adverse events: 3. Movement disorder.

Comparison 6 RISPERIDONE DEPOT vs ORAL OLANZAPINE, Outcome 1 Mental state: 1. Average change scores (PANNS, high score = worse).
Comparison 6 RISPERIDONE DEPOT vs ORAL OLANZAPINE, Outcome 2 Leaving the study early: 1. Any reason.

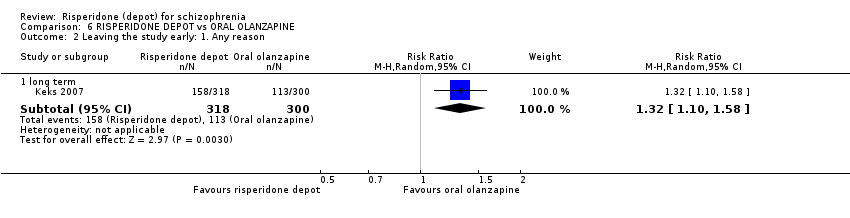
Comparison 6 RISPERIDONE DEPOT vs ORAL OLANZAPINE, Outcome 3 Leaving the study early: 2. Specific.
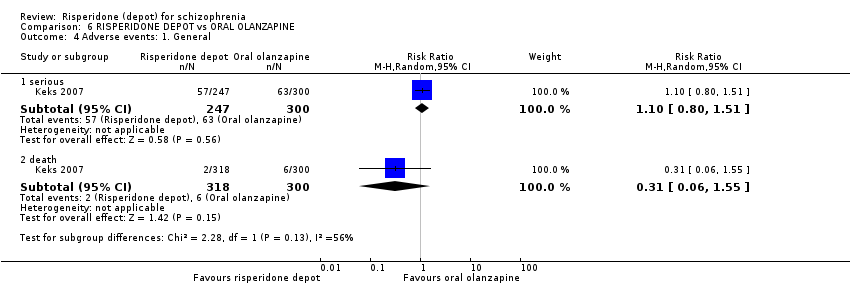
Comparison 6 RISPERIDONE DEPOT vs ORAL OLANZAPINE, Outcome 4 Adverse events: 1. General.

Comparison 6 RISPERIDONE DEPOT vs ORAL OLANZAPINE, Outcome 5 Adverse events: 2. Specific.

Comparison 6 RISPERIDONE DEPOT vs ORAL OLANZAPINE, Outcome 6 Adverse events: 3. Movement disorder.

Comparison 7 RISPERIDONE DEPOT vs ALL ORAL ANTIPSYCHOTICS (PRIMARY OUTCOMES), Outcome 1 Global state: 1. Relapse (any reason).
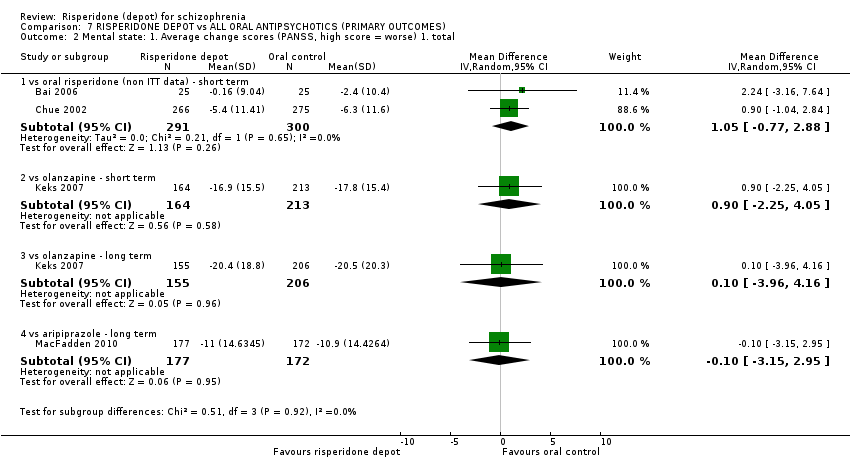
Comparison 7 RISPERIDONE DEPOT vs ALL ORAL ANTIPSYCHOTICS (PRIMARY OUTCOMES), Outcome 2 Mental state: 1. Average change scores (PANSS, high score = worse) 1. total.
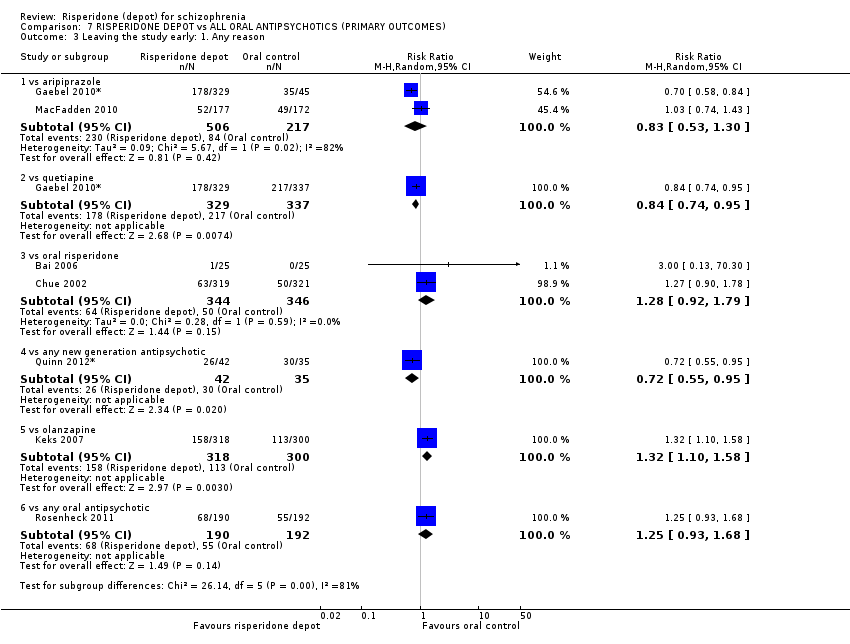
Comparison 7 RISPERIDONE DEPOT vs ALL ORAL ANTIPSYCHOTICS (PRIMARY OUTCOMES), Outcome 3 Leaving the study early: 1. Any reason.
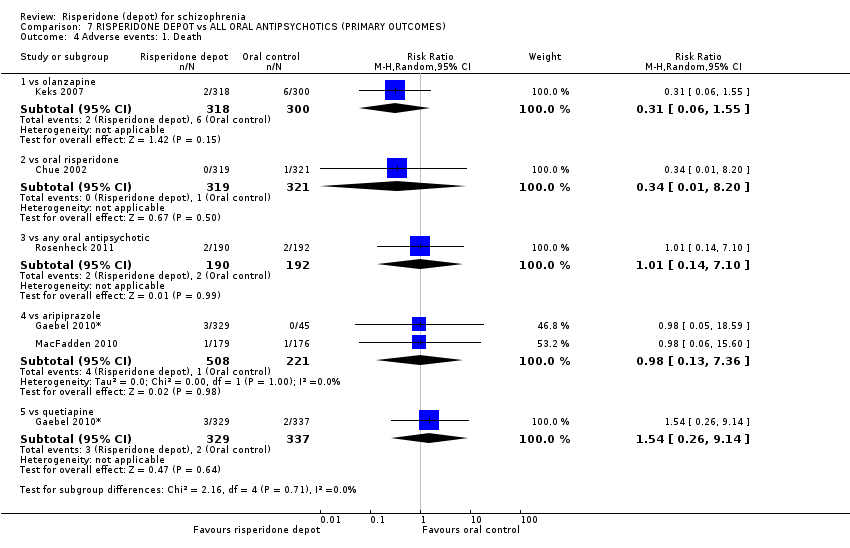
Comparison 7 RISPERIDONE DEPOT vs ALL ORAL ANTIPSYCHOTICS (PRIMARY OUTCOMES), Outcome 4 Adverse events: 1. Death.

Comparison 7 RISPERIDONE DEPOT vs ALL ORAL ANTIPSYCHOTICS (PRIMARY OUTCOMES), Outcome 5 Adverse events: 1. General: a. any.
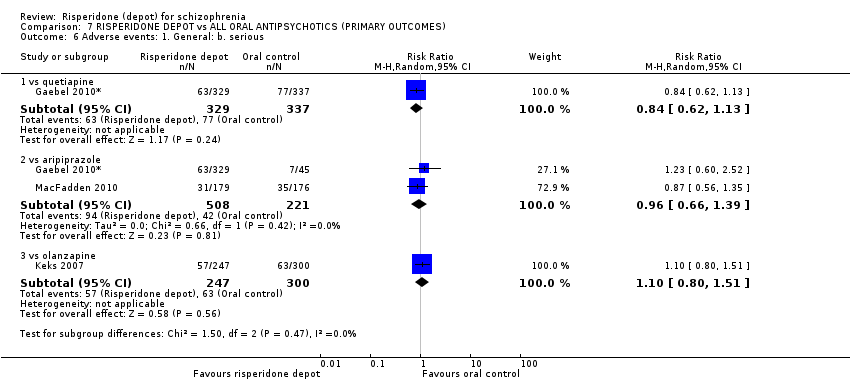
Comparison 7 RISPERIDONE DEPOT vs ALL ORAL ANTIPSYCHOTICS (PRIMARY OUTCOMES), Outcome 6 Adverse events: 1. General: b. serious.

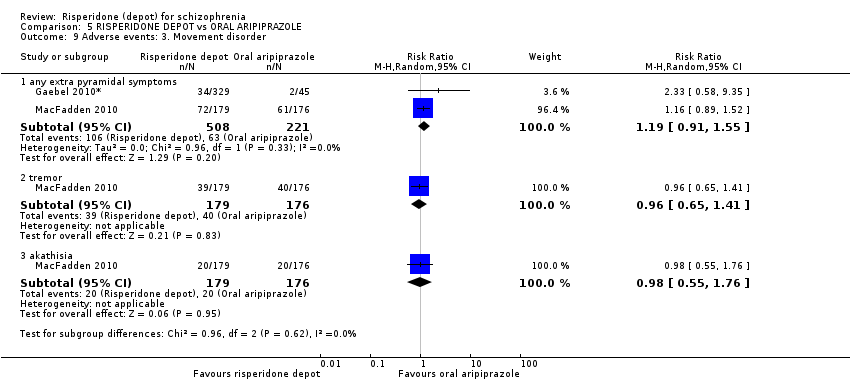
Comparison 7 RISPERIDONE DEPOT vs ALL ORAL ANTIPSYCHOTICS (PRIMARY OUTCOMES), Outcome 7 Adverse events: 2. Movement disorder: a. any extra pyramidal symptoms.

Comparison 8 RISPERIDONE DEPOT vs ATYPICAL DEPOT ANTIPSYCHOTICS (PALIPERIDONE PALMITATE), Outcome 1 Global State: 1. CGI‐S mean change from baseline (high score = worse).
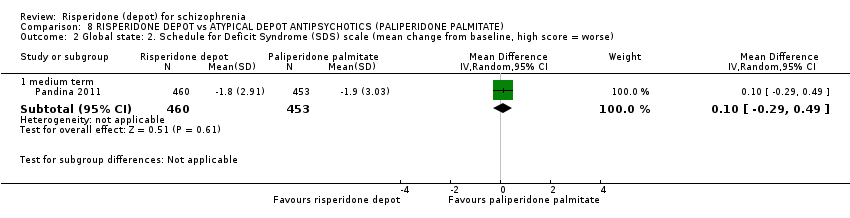
Comparison 8 RISPERIDONE DEPOT vs ATYPICAL DEPOT ANTIPSYCHOTICS (PALIPERIDONE PALMITATE), Outcome 2 Global state: 2. Schedule for Deficit Syndrome (SDS) scale (mean change from baseline, high score = worse).

Comparison 8 RISPERIDONE DEPOT vs ATYPICAL DEPOT ANTIPSYCHOTICS (PALIPERIDONE PALMITATE), Outcome 3 Mental state: 1. PANSS scores (high score = worse) ‐ medium term.

Comparison 8 RISPERIDONE DEPOT vs ATYPICAL DEPOT ANTIPSYCHOTICS (PALIPERIDONE PALMITATE), Outcome 4 Mental state: 2. Improved by 30% in total PANSS score (ITT data).

Comparison 8 RISPERIDONE DEPOT vs ATYPICAL DEPOT ANTIPSYCHOTICS (PALIPERIDONE PALMITATE), Outcome 5 General functioning: Personal and Social Performance (PSP) scale (high score = better).
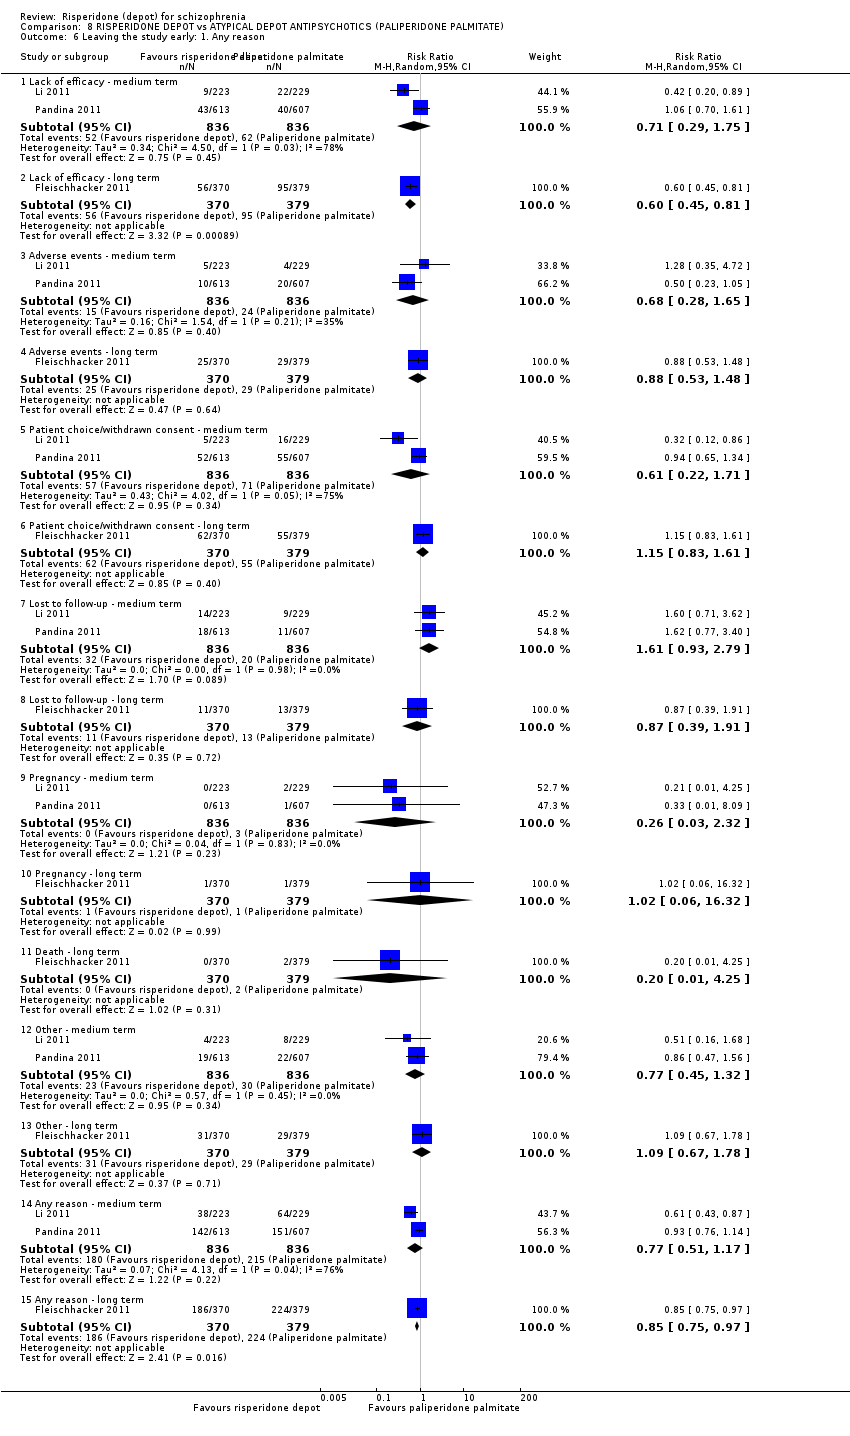
Comparison 8 RISPERIDONE DEPOT vs ATYPICAL DEPOT ANTIPSYCHOTICS (PALIPERIDONE PALMITATE), Outcome 6 Leaving the study early: 1. Any reason.

Comparison 8 RISPERIDONE DEPOT vs ATYPICAL DEPOT ANTIPSYCHOTICS (PALIPERIDONE PALMITATE), Outcome 7 Adverse events: 1. General.

Comparison 8 RISPERIDONE DEPOT vs ATYPICAL DEPOT ANTIPSYCHOTICS (PALIPERIDONE PALMITATE), Outcome 8 Adverse events: 2. Specific.

Comparison 8 RISPERIDONE DEPOT vs ATYPICAL DEPOT ANTIPSYCHOTICS (PALIPERIDONE PALMITATE), Outcome 9 Adverse events: 3. Prolactin related.
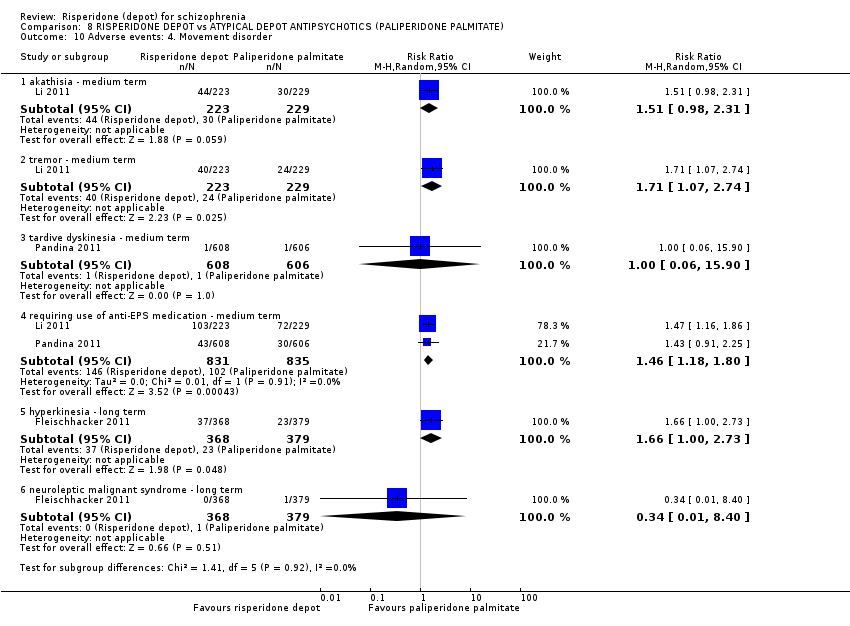
Comparison 8 RISPERIDONE DEPOT vs ATYPICAL DEPOT ANTIPSYCHOTICS (PALIPERIDONE PALMITATE), Outcome 10 Adverse events: 4. Movement disorder.

Comparison 8 RISPERIDONE DEPOT vs ATYPICAL DEPOT ANTIPSYCHOTICS (PALIPERIDONE PALMITATE), Outcome 11 Adverse events: 5. Body weight (mean increase).
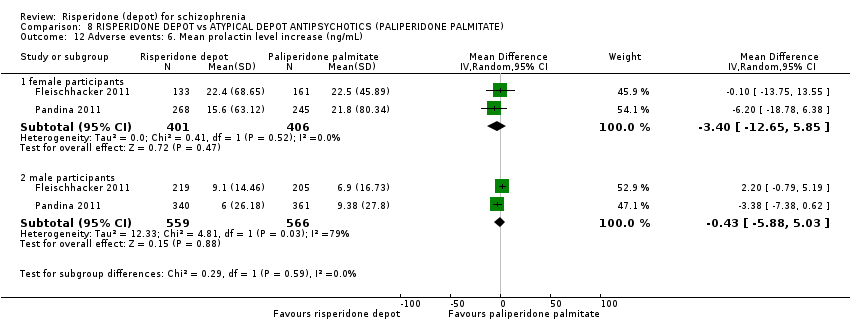
Comparison 8 RISPERIDONE DEPOT vs ATYPICAL DEPOT ANTIPSYCHOTICS (PALIPERIDONE PALMITATE), Outcome 12 Adverse events: 6. Mean prolactin level increase (ng/mL).

Comparison 8 RISPERIDONE DEPOT vs ATYPICAL DEPOT ANTIPSYCHOTICS (PALIPERIDONE PALMITATE), Outcome 13 Adverse events: 7. Glucose related.

Comparison 8 RISPERIDONE DEPOT vs ATYPICAL DEPOT ANTIPSYCHOTICS (PALIPERIDONE PALMITATE), Outcome 14 Adverse events: 8. Injection site pain (mean (sd) Visual Analogue Scale score (0‐100mm)).

Comparison 9 RISPERIDONE DEPOT vs TYPICAL DEPOT ANTIPSYCHOTICS, Outcome 1 Mental state: 1. Total endpoint scores (PANNS, high score = worse).

Comparison 9 RISPERIDONE DEPOT vs TYPICAL DEPOT ANTIPSYCHOTICS, Outcome 2 Leaving the study early.
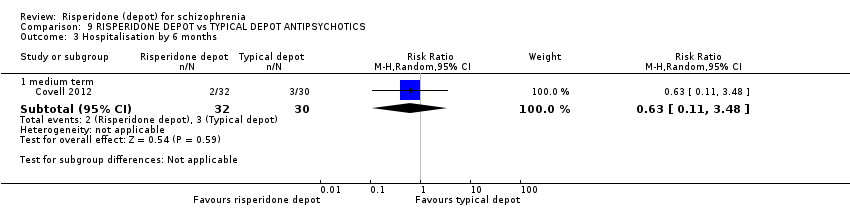
Comparison 9 RISPERIDONE DEPOT vs TYPICAL DEPOT ANTIPSYCHOTICS, Outcome 3 Hospitalisation by 6 months.
| Study | Intervention | Mean | SD | N |
| Change in BMI ‐ short term (skew) | ||||
| Covell 2012 | Risperidone depot | 1.29 | 1.9 | 23 |
| Covell 2012 | Typical depot antipsychotics | 0.48 | 1.4 | 26 |
| Change in BMI ‐ medium term (skew) | ||||
| Covell 2012 | Risperidone depot | 1.53 | 2.2 | 22 |
| Covell 2012 | Typical depot antipsychotics | 0.53 | 1.3 | 24 |
| Change in BMI ‐ long term (skew) | ||||
| Covell 2012 | Risperidone depot | 1.04 | 2.0 | 17 |
| Covell 2012 | Typical depot antipsychotics | ‐0.28 | 1.7 | 24 |
| Prolactin endpoint levels (ng/mL) ‐ short term (skew) | ||||
| Covell 2012 | Risperidone depot | 22.5 | 19.1 | 19 |
| Covell 2012 | Typical depot antipsychotics | 15.1 | 7.6 | 22 |
| Prolactin endpoint levels (ng/mL) ‐ medium term (skew) | ||||
| Covell 2012 | Risperidone depot | 23.4 | 13.8 | 18 |
| Covell 2012 | Typical depot antipsychotics | 16 | 7.5 | 21 |
| Prolactin endpoint levels (ng/mL) ‐ long term (skew) | ||||
| Covell 2012 | Risperidone depot | 19 | 10.6 | 14 |
| Covell 2012 | Typical depot antipsychotics | 15.2 | 5.1 | 18 |
Comparison 9 RISPERIDONE DEPOT vs TYPICAL DEPOT ANTIPSYCHOTICS, Outcome 4 Adverse events: 1. Continuous outcomes (skew).

Comparison 9 RISPERIDONE DEPOT vs TYPICAL DEPOT ANTIPSYCHOTICS, Outcome 5 Adverse events: 2. Sexual experiencesm, total endpoint (ASEX, high score = worse).
| Methods | Allocation: randomised, fully explicit description of methods of randomisation and allocation concealment. |
| Participants | Diagnosis: schizophrenia (ICD/DSM/CCMD). |
| Interventions | 1. Depot risperidone. N = 150. 2. Standard care. N = 150. |
| Outcomes | General: time to all‐cause treatment failure marked by its discontinuation, relapse, general impression of clinician (CGI), career/other, compliance with treatment., healthy days, |
| Notes | * Powered to be able to identify a difference of ˜ 20% between groups for primary outcome with adequate degree of certainty. |
| BPRS: Brief Psychiatric Rating Scale | |
| Excluded study | Comparison | Existing review | Suggested future review titles |
| Oral risperidone vs conventional antipsychotic drugs (haloperidol, fluphenazine, chlorpromazine, trifluoperazine), not depot risperidone. | Risperidone vs typical antipsychotic medication for schizophrenia (Hunter 2003). | Risperidone vs haloperidol, risperidone vs fluphenazine, risperidone vs chlorpromazine, risperidone vs trifluoperazine. | |
| Oral risperidone vs atypical antipsychotics (olanzapine), not depot risperidone. | Risperidone vs olanzapine for schizophrenia (Jayaram 2006). | ||
| Dose comparison (25 mg vs 50 mg of risperidone depot). | Risperidone dose for schizophrenia (Li 2009). | This could also generate further comparisons for this current review. |
| RISPERIDONE DEPOT compared with PLACEBO for schizophrenia | ||||||
| Patient or population: patients with schizophrenia | ||||||
| Outcomes | Illustrative comparative risks* (95% CI) | Relative effect | No of Participants | Quality of the evidence | Comments | |
| Assumed risk | Corresponding risk | |||||
| PLACEBO | RISPERIDONE DEPOT | |||||
| Global state: Relapse ‐ long term ‐ not measured | See comment | See comment | Not estimable | ‐ | See comment | No study reported this outcome. |
| Mental state: clinically significant improvement in mental state ‐ long term1 ‐ not reported | See comment | See comment | Not estimable1 | ‐ | See comment | Study reported PANSS responder rate, but unusable due to high attrition. |
| Leaving the study early: Any reason ‐ all doses risperidone depot ‐ short term | 694 per 1000 | 513 per 1000 | RR 0.74 | 400 | ⊕⊝⊝⊝ | |
| Adverse events: General: Severe adverse event ‐ any dose risperidone depot ‐ short term | 235 per 10004 | 138 per 1000 | RR 0.59 | 400 | ⊕⊝⊝⊝ | |
| Adverse events: Specific: Weight gain ‐ all doses of depot risperidone ‐ short term | 20 per 1000 | 43 per 1000 | RR 2.11 | 400 | ⊕⊝⊝⊝ | |
| *The basis for the assumed risk (e.g. the median control group risk across studies) is provided in footnotes. The corresponding risk (and its 95% confidence interval) is based on the assumed risk in the comparison group and the relative effect of the intervention (and its 95% CI). | ||||||
| GRADE Working Group grades of evidence | ||||||
| 1 Not reported: only included study (Kane 2002*) reported PANSS responder rate, but these data were unusable due to high levels of attrition. | ||||||
| RISPERIDONE DEPOT compared with GENERAL ORAL ANTIPSYCHOTICS for schizophrenia | ||||||
| Patient or population: patients with schizophrenia | ||||||
| Outcomes | Illustrative comparative risks* (95% CI) | Relative effect | No of Participants | Quality of the evidence | Comments | |
| Assumed risk | Corresponding risk | |||||
| GENERAL ORAL ANTIPSYCHOTICS | RISPERIDONE DEPOT | |||||
| Global state: Relapse (any reason) ‐ long term | Moderate | RR 2.13 | 63 | ⊕⊝⊝⊝ | Criteria for relapse were derived from Csernansky 2002.<BR/> | |
| 161 per 10001 | 343 per 1000 | |||||
| Mental state: clinically significant improvement in mental state ‐ long term | See comment | See comment | Not estimable | 0 | See comment | Outcomes relating to mental state were unusable due to high study attrition. |
| Leaving the study early: Any reason ‐ long term | Study population | RR 1.24 | 467 | ⊕⊕⊕⊝ | ||
| 322 per 10004 | 399 per 1000 | |||||
| Moderate | ||||||
| 387 per 10004 | 480 per 1000 | |||||
| Adverse events: General: Severe adverse event ‐ any dose risperidone depot ‐ short term | See comment | See comment | Not estimable | 0 | See comment | "Severe adverse events" were not explicitly reported. |
| Adverse events: Specific ‐ prolactin‐related ‐ long term | Low | RR 10.27 | 85 | ⊕⊝⊝⊝ | ||
| 10 per 10005 | 103 per 1000 | |||||
| Moderate | ||||||
| 100 per 10005 | 1000 per 1000 | |||||
| High | ||||||
| 200 per 10005 | 1000 per 1000 | |||||
| Adverse events: Specific ‐ weight increase ‐ long term | Study population | RR 1.33 | 85 | ⊕⊝⊝⊝ | ||
| 171 per 10004 | 227 per 1000 | |||||
| Moderate | ||||||
| 171 per 10004 | 227 per 1000 | |||||
| Adverse events: Nervous system disorders (inc. EPS) ‐ long term | Study population | RR 1.34 | 369 | ⊕⊝⊝⊝ | ||
| 171 per 10004 | 227 per 1000 | |||||
| Moderate | ||||||
| 171 per 10004 | 227 per 1000 | |||||
| *The basis for the assumed risk (e.g. the median control group risk across studies) is provided in footnotes. The corresponding risk (and its 95% confidence interval) is based on the assumed risk in the comparison group and the relative effect of the intervention (and its 95% CI). | ||||||
| GRADE Working Group grades of evidence | ||||||
| 1 Assumed risk: mean baseline presented for one individual study. | ||||||
| RISPERIDONE DEPOT compared with ORAL RISPERIDONE for schizophrenia | ||||||
| Patient or population: patients with schizophrenia | ||||||
| Outcomes | Illustrative comparative risks* (95% CI) | Relative effect | No of Participants | Quality of the evidence | Comments | |
| Assumed risk | Corresponding risk | |||||
| ORAL RISPERIDONE | RISPERIDONE DEPOT | |||||
| Global state: Relapse ‐ long term | See comment | See comment | Not estimable | 0 | See comment | Outcomes relating to relapse were not available for this comparison. |
| Mental state: average PANSS total score at endpoint (non‐ITT data) | The mean mental state: average PANSS total score at endpoint (non‐ITT data) in the intervention groups was | 591 | ⊕⊕⊕⊝ | |||
| Leaving the study early: Any reason ‐ short term | Study population | RR 1.28 | 690 | ⊕⊕⊕⊝ | ||
| 145 per 10002 | 185 per 1000 | |||||
| Moderate | ||||||
| 78 per 10002 | 100 per 1000 | |||||
| Adverse events: General: Severe adverse event ‐ any dose risperidone depot ‐ short term | See comment | See comment | Not estimable | 0 | See comment | "Severe adverse events" were not explicitly reported by these studies. |
| Adverse events: Movement disorder ‐ any extra pyramidal symptoms ‐ short term | Study population | RR 1.05 | 640 | ⊕⊕⊕⊝ | ||
| 65 per 10003 | 69 per 1000 | |||||
| Moderate | ||||||
| 65 per 10003 | 68 per 1000 | |||||
| Adverse events: Specific: Mean (SD) weight increase in kg ‐ short term | The mean adverse events: specific: mean (SD) weight increase in kg ‐ short term in the control groups was | The mean adverse events: specific: mean (SD) weight increase in kg ‐ short term in the intervention groups was | 640 | ⊕⊕⊕⊝ | ||
| Adverse events: Specific ‐ prolactin‐related | Moderate | RR 0.5 | 640 | ⊕⊕⊕⊝ | ||
| 25 per 10003 | 12 per 1000 | |||||
| *The basis for the assumed risk (e.g. the median control group risk across studies) is provided in footnotes. The corresponding risk (and its 95% confidence interval) is based on the assumed risk in the comparison group and the relative effect of the intervention (and its 95% CI). | ||||||
| GRADE Working Group grades of evidence | ||||||
| 1 Risk of bias: 'serious' ‐ both studies received funding support from the manufacturers of risperidone depot | ||||||
| RISPERIDONE DEPOT compared with ORAL QUETIAPINE for schizophrenia | ||||||
| Patient or population: patients with schizophrenia | ||||||
| Outcomes | Illustrative comparative risks* (95% CI) | Relative effect | No of Participants | Quality of the evidence | Comments | |
| Assumed risk | Corresponding risk | |||||
| ORAL QUETIAPINE | RISPERIDONE DEPOT | |||||
| Global state: Relapse ‐ long term | See comment | See comment | Not estimable | 0 | See comment | Criteria for relapse were derived from Csernansky 2002. <BR/> Outcomes relating to relapse were reported, but were unusable due to study attrition. |
| Mental state: clinically significant improvement in mental state ‐ long term | See comment | See comment | Not estimable | 0 | See comment | Outcomes relating to mental state were unusable due to high study attrition. |
| Leaving the study early: Any reason ‐ long term | Moderate | RR 0.84 | 666 | ⊕⊕⊕⊝ | ||
| 644 per 10001 | 541 per 1000 | |||||
| Adverse events: General ‐ serious | Moderate | RR 0.84 | 666 | ⊕⊕⊝⊝ | ||
| 229 per 10001 | 192 per 1000 | |||||
| Adverse events: Movement disorder ‐ any extra pyramidal symptom | Moderate | RR 1.83 | 666 | ⊕⊕⊝⊝ | ||
| 56 per 10001 | 102 per 1000 | |||||
| Adverse events: Specific: Mean (SD) weight increase in kg ‐ long term | The mean adverse events: specific: mean (SD) weight increase in kg ‐ long term in the intervention groups was | 666 | ⊕⊕⊝⊝ | |||
| Adverse events: Specific ‐ prolactin‐related | Study population | RR 3.07 | 666 | ⊕⊕⊝⊝ | ||
| 15 per 10001 | 46 per 1000 | |||||
| Moderate | ||||||
| 15 per 10001 | 46 per 1000 | |||||
| *The basis for the assumed risk (e.g. the median control group risk across studies) is provided in footnotes. The corresponding risk (and its 95% confidence interval) is based on the assumed risk in the comparison group and the relative effect of the intervention (and its 95% CI). | ||||||
| GRADE Working Group grades of evidence | ||||||
| 1 Assumed risk: mean baseline risk used for one included study. | ||||||
| RISPERIDONE DEPOT compared with ORAL ARIPIPRAZOLE for schizophrenia | ||||||
| Patient or population: patients with schizophrenia | ||||||
| Outcomes | Illustrative comparative risks* (95% CI) | Relative effect | No of Participants | Quality of the evidence | Comments | |
| Assumed risk | Corresponding risk | |||||
| ORAL ARIPIPRAZOLE | RISPERIDONE DEPOT | |||||
| Global state: Relapse (any reason) ‐ long term | Moderate | RR 1.05 | 349 | ⊕⊕⊝⊝ | Criteria for relapse were derived from Csernansky 2002. | |
| 436 per 10001 | 458 per 1000 | |||||
| Mental state: Average change scores‐ long term | The mean mental state: average change scores‐ long term in the intervention groups was | 349 | ⊕⊕⊝⊝ | |||
| Leaving the study early: Any reason ‐ long term | Study population | RR 0.83 | 723 | ⊕⊝⊝⊝ | ||
| 387 per 10004 | 321 per 1000 | |||||
| Moderate | ||||||
| 531 per 10004 | 441 per 1000 | |||||
| Adverse events: General ‐ serious | Study population | RR 0.96 | 729 | ⊕⊝⊝⊝ | ||
| 190 per 10004 | 182 per 1000 | |||||
| Moderate | ||||||
| 177 per 10004 | 170 per 1000 | |||||
| Adverse events: Movement disorder ‐ any extra pyramidal symptoms | Study population | RR 1.19 | 729 | ⊕⊝⊝⊝ | ||
| 285 per 10004 | 339 per 1000 | |||||
| Moderate | ||||||
| 196 per 10004 | 233 per 1000 | |||||
| Adverse events: Specific ‐ weight increase | Moderate | RR 1.57 | 374 | ⊕⊕⊝⊝ | ||
| 44 per 10001 | 69 per 1000 | |||||
| Adverse events: Specific ‐ prolactin‐related | Study population | RR 9.91 | 729 | ⊕⊝⊝⊝ | ||
| 9 per 10004 | 90 per 1000 | |||||
| Moderate | ||||||
| 6 per 10004 | 59 per 1000 | |||||
| *The basis for the assumed risk (e.g. the median control group risk across studies) is provided in footnotes. The corresponding risk (and its 95% confidence interval) is based on the assumed risk in the comparison group and the relative effect of the intervention (and its 95% CI). | ||||||
| GRADE Working Group grades of evidence | ||||||
| 1 Assumed risk: mean baseline risk presented for one individual study. | ||||||
| RISPERIDONE DEPOT compared with ORAL OLANZAPINE for schizophrenia | ||||||
| Patient or population: patients with schizophrenia | ||||||
| Outcomes | Illustrative comparative risks* (95% CI) | Relative effect | No of Participants | Quality of the evidence | Comments | |
| Assumed risk | Corresponding risk | |||||
| ORAL OLANZAPINE | RISPERIDONE DEPOT | |||||
| Global state: Relapse ‐ long term | See comment | See comment | Not estimable | 0 | See comment | Outcomes relating to relapse were not reported for this comparison. |
| Mental state: Average change scores ‐ long term | The mean mental state: average change scores ‐ long term in the intervention groups was | 361 | ⊕⊕⊝⊝ | |||
| Leaving the study early: Any reason ‐ long term | Study population | RR 1.32 | 618 | ⊕⊕⊝⊝ | ||
| 377 per 10004 | 497 per 1000 | |||||
| Moderate | ||||||
| 377 per 10004 | 498 per 1000 | |||||
| Adverse events: General ‐ serious | Moderate | RR 1.1 | 547 | ⊕⊕⊝⊝ | ||
| 210 per 10004 | 231 per 1000 | |||||
| Adverse events: Movement disorder ‐ any extra pyramidal symptoms | Moderate | RR 1.67 | 547 | ⊕⊕⊝⊝ | ||
| 150 per 10004 | 250 per 1000 | |||||
| Adverse events: Specific ‐ weight increase | Moderate | RR 0.56 | 547 | ⊕⊕⊝⊝ | ||
| 360 per 10004 | 202 per 1000 | |||||
| *The basis for the assumed risk (e.g. the median control group risk across studies) is provided in footnotes. The corresponding risk (and its 95% confidence interval) is based on the assumed risk in the comparison group and the relative effect of the intervention (and its 95% CI). | ||||||
| GRADE Working Group grades of evidence | ||||||
| 1 Risk of bias: 'very serious' ‐ serious risk of bias due to study attrition in excess of 50%. | ||||||
| RISPERIDONE DEPOT compared with ATYPICAL DEPOT ANTIPSYCHOTICS (PALIPERIDONE PALMITATE) for schizophrenia | ||||||
| Patient or population: patients with schizophrenia | ||||||
| Outcomes | Illustrative comparative risks* (95% CI) | Relative effect | No of Participants | Quality of the evidence | Comments | |
| Assumed risk | Corresponding risk | |||||
| ATYPICAL DEPOT ANTIPSYCHOTICS (PALIPERIDONE PALMITATE) | RISPERIDONE DEPOT | |||||
| Global state: Relapse ‐ long term | See comment | See comment | Not estimable | 0 | See comment | Outcomes relating to relapse were not reported for this comparison. |
| Mental state: PANSS responders (ITT data) ‐ medium term | Study population | RR 1.01 | 1326 | ⊕⊕⊕⊝ | ||
| 585 per 10001 | 591 per 1000 | |||||
| Moderate | ||||||
| 619 per 10001 | 625 per 1000 | |||||
| Leaving the study early: lack of efficacy ‐ long term | Study population | RR 0.60 | 749 | ⊕⊕⊝⊝ | ||
| 361 per 10001 | 307 per 1000 | |||||
| Moderate | ||||||
| 280 per 10001 | 238 per 1000 | |||||
| Adverse events: Movement disorder requiring the use of anti‐EPS medication ‐ medium term | Study population | RR 1.46 | 1666 | ⊕⊕⊕⊝ | ||
| 122 per 10001 | 178 per 1000 | |||||
| Moderate | ||||||
| 182 per 10001 | 266 per 1000 | |||||
| Adverse events: Body weight (mean increase) ‐ medium/long term | The mean adverse events: body weight (mean increase) ‐ medium/long term in the intervention groups was | 2350 | ⊕⊕⊝⊝ | |||
| Adverse events: Any prolactin‐related ‐ medium term | Study population | RR 1.02 | 1666 | ⊕⊕⊕⊝ | ||
| 32 per 10001 | 33 per 1000 | |||||
| Moderate | ||||||
| 48 per 10001 | 49 per 1000 | |||||
| Adverse events: Any glucose‐related ‐ medium/long term | 10 per 10001 | 18 per 1000 | RR 1.79 | 2413 | ⊕⊕⊝⊝ | |
| *The basis for the assumed risk (e.g. the median control group risk across studies) is provided in footnotes. The corresponding risk (and its 95% confidence interval) is based on the assumed risk in the comparison group and the relative effect of the intervention (and its 95% CI). | ||||||
| GRADE Working Group grades of evidence | ||||||
| 1 Assumed risk: median control group risk from the studies. | ||||||
| RISPERIDONE DEPOT compared with TYPICAL DEPOT ANTIPSYCHOTICS for schizophrenia | ||||||
| Patient or population: patients with schizophrenia | ||||||
| Outcomes | Illustrative comparative risks* (95% CI) | Relative effect | No of Participants | Quality of the evidence | Comments | |
| Assumed risk | Corresponding risk | |||||
| TYPICAL DEPOT ANTIPSYCHOTICS | RISPERIDONE DEPOT | |||||
| Global state: Relapse ‐ long term | See comment | See comment | Not estimable | 0 | See comment | Outcomes relating to relapse were not reported for this comparison. |
| Mental state: Total average scores (PANSS, high score = worse) ‐ long term | The mean mental state: total average scores (PANSS, high score = worse) ‐ long term in the intervention groups was | 43 | ⊕⊕⊝⊝ | |||
| Leaving the study early for any reason ‐ long term | Study population | RR 3.05 | 62 | ⊕⊕⊝⊝ | ||
| 133 per 10003 | 407 per 1000 | |||||
| Moderate | ||||||
| 133 per 10003 | 406 per 1000 | |||||
| Adverse events: General: Severe adverse event | See comment | See comment | Not estimable | 0 | See comment | "Severe adverse events" were not explicitly reported for this comparison. |
| Adverse events: related to movement disorder, weight gain, prolactin levels and glucose metabolism ‐ medium/long term ‐ not reported | See comment | See comment | Not estimable | ‐ | See comment | Outcomes relating to specific adverse events were not reported in such as way as to be useable. |
| *The basis for the assumed risk (e.g. the median control group risk across studies) is provided in footnotes. The corresponding risk (and its 95% confidence interval) is based on the assumed risk in the comparison group and the relative effect of the intervention (and its 95% CI). | ||||||
| GRADE Working Group grades of evidence | ||||||
| 1 Risk of bias: 'serious' ‐ due to the open‐label nature of this study. | ||||||
| Outcome or subgroup title | No. of studies | No. of participants | Statistical method | Effect size |
| 1 Mental state: 1. Change (exacerbation) in specific symptoms Show forest plot | 1 | Risk Ratio (M‐H, Random, 95% CI) | Subtotals only | |
| 1.1 anxiety ‐ short term | 1 | 400 | Risk Ratio (M‐H, Random, 95% CI) | 0.58 [0.32, 1.05] |
| 1.2 agitation ‐ short term | 1 | 400 | Risk Ratio (M‐H, Random, 95% CI) | 0.60 [0.39, 0.92] |
| 1.3 hallucinations ‐ short term | 1 | 400 | Risk Ratio (M‐H, Random, 95% CI) | 1.23 [0.47, 3.22] |
| 1.4 nervousness ‐ short term | 1 | 400 | Risk Ratio (M‐H, Random, 95% CI) | 0.39 [0.12, 1.25] |
| 1.5 psychosis ‐ short term | 1 | 400 | Risk Ratio (M‐H, Random, 95% CI) | 0.52 [0.33, 0.83] |
| 2 Leaving the study early: 1. Any reason (by time period) Show forest plot | 1 | Risk Ratio (M‐H, Random, 95% CI) | Subtotals only | |
| 2.1 very early on (<1 injection) | 1 | 400 | Risk Ratio (M‐H, Random, 95% CI) | 1.30 [0.55, 3.08] |
| 2.2 by 12 weeks | 1 | 400 | Risk Ratio (M‐H, Random, 95% CI) | 0.74 [0.63, 0.88] |
| 3 Leaving the study early: 2. Any reason (by doses) Show forest plot | 1 | Risk Ratio (M‐H, Random, 95% CI) | Subtotals only | |
| 3.1 all doses risperidone depot ‐ short term | 1 | 400 | Risk Ratio (M‐H, Random, 95% CI) | 0.74 [0.63, 0.88] |
| 3.2 25mg risperidone depot ‐ short term | 1 | 197 | Risk Ratio (M‐H, Random, 95% CI) | 0.74 [0.59, 0.94] |
| 3.3 50mg risperidone depot ‐ short term | 1 | 201 | Risk Ratio (M‐H, Random, 95% CI) | 0.74 [0.59, 0.93] |
| 3.4 75mg risperidone depot ‐ short term | 1 | 198 | Risk Ratio (M‐H, Random, 95% CI) | 0.75 [0.60, 0.94] |
| 4 Leaving the study early: 3. Because of insufficient response (by doses) Show forest plot | 1 | Risk Ratio (M‐H, Random, 95% CI) | Subtotals only | |
| 4.1 all three doses ‐ short term | 1 | 400 | Risk Ratio (M‐H, Random, 95% CI) | 0.53 [0.36, 0.79] |
| 4.2 25mg depot risperidone group ‐ short term | 1 | 197 | Risk Ratio (M‐H, Random, 95% CI) | 0.73 [0.45, 1.17] |
| 4.3 50mg depot risperidone group ‐ short term | 1 | 201 | Risk Ratio (M‐H, Random, 95% CI) | 0.48 [0.27, 0.83] |
| 4.4 75mg depot risperidone group ‐ short term | 1 | 198 | Risk Ratio (M‐H, Random, 95% CI) | 0.39 [0.21, 0.72] |
| 5 Adverse events: 1. General: a. Death Show forest plot | 1 | Risk Ratio (M‐H, Random, 95% CI) | Subtotals only | |
| 5.1 short term | 1 | 400 | Risk Ratio (M‐H, Random, 95% CI) | 0.11 [0.00, 2.65] |
| 6 Adverse events: 1. General: b. Severe adverse event (by doses) Show forest plot | 1 | Risk Ratio (M‐H, Random, 95% CI) | Subtotals only | |
| 6.1 any dose risperidone depot ‐ short term | 1 | 400 | Risk Ratio (M‐H, Random, 95% CI) | 0.59 [0.38, 0.93] |
| 6.2 25mg risperidone depot ‐ short term | 1 | 197 | Risk Ratio (M‐H, Random, 95% CI) | 0.56 [0.30, 1.04] |
| 6.3 50mg risperidone depot ‐ short term | 1 | 201 | Risk Ratio (M‐H, Random, 95% CI) | 0.58 [0.32, 1.06] |
| 6.4 75mg risperidone depot ‐ short term | 1 | 198 | Risk Ratio (M‐H, Random, 95% CI) | 0.64 [0.36, 1.15] |
| 7 Adverse events: 1. General: c. Adverse event necessitating withdrawal from study (by doses) Show forest plot | 1 | Risk Ratio (M‐H, Random, 95% CI) | Subtotals only | |
| 7.1 any dose risperidone depot ‐ short term | 1 | 400 | Risk Ratio (M‐H, Random, 95% CI) | 1.00 [0.54, 1.84] |
| 7.2 25mg risperidone depot ‐ short term | 1 | 197 | Risk Ratio (M‐H, Random, 95% CI) | 0.91 [0.42, 1.96] |
| 7.3 50mg risperidone depot ‐ short term | 1 | 201 | Risk Ratio (M‐H, Random, 95% CI) | 0.95 [0.45, 2.02] |
| 7.4 75mg risperidone depot ‐ short term | 1 | 198 | Risk Ratio (M‐H, Random, 95% CI) | 1.14 [0.56, 2.35] |
| 8 Adverse events: 2. Specific: a. Cardiovascular Show forest plot | 1 | Risk Ratio (M‐H, Random, 95% CI) | Subtotals only | |
| 8.1 dizziness ‐ short term | 1 | 400 | Risk Ratio (M‐H, Random, 95% CI) | 1.46 [0.62, 3.43] |
| 8.2 tachycardia ‐ short term | 1 | 400 | Risk Ratio (M‐H, Random, 95% CI) | 0.32 [0.11, 0.98] |
| 9 Adverse events: 2. Specific: b. Gastrointestinal Show forest plot | 1 | Risk Ratio (M‐H, Random, 95% CI) | Subtotals only | |
| 9.1 constipation ‐ short term | 1 | 400 | Risk Ratio (M‐H, Random, 95% CI) | 6.17 [0.84, 45.46] |
| 9.2 diarrhoea ‐ short term | 1 | 400 | Risk Ratio (M‐H, Random, 95% CI) | 0.87 [0.23, 3.20] |
| 9.3 nausea ‐ short term | 1 | 400 | Risk Ratio (M‐H, Random, 95% CI) | 1.04 [0.39, 2.76] |
| 9.4 vomiting ‐ short term | 1 | 400 | Risk Ratio (M‐H, Random, 95% CI) | 0.59 [0.23, 1.57] |
| 10 Adverse events: 2. Specific: c. Movement disorders: a. Extrapyramidal disorder ‐ spontaneously reported (by doses) Show forest plot | 1 | Risk Ratio (M‐H, Random, 95% CI) | Subtotals only | |
| 10.1 all doses of depot risperidone ‐ short term | 1 | 400 | Risk Ratio (M‐H, Random, 95% CI) | 2.38 [0.73, 7.78] |
| 10.2 25mg risperidone group ‐ short term | 1 | 197 | Risk Ratio (M‐H, Random, 95% CI) | 1.32 [0.30, 5.74] |
| 10.3 50mg risperidone group ‐ short term | 1 | 201 | Risk Ratio (M‐H, Random, 95% CI) | 2.54 [0.69, 9.29] |
| 10.4 75mg risperidone group ‐ short term | 1 | 198 | Risk Ratio (M‐H, Random, 95% CI) | 3.27 [0.93, 11.51] |
| 11 Adverse events: 2. Specific: d. Movement disorders: b. Hyperkinesia (by doses) Show forest plot | 1 | Risk Ratio (M‐H, Random, 95% CI) | Subtotals only | |
| 11.1 all doses of risperidone ‐ short term | 1 | 400 | Risk Ratio (M‐H, Random, 95% CI) | 1.70 [0.60, 4.84] |
| 11.2 25mg risperidone group ‐ short term | 1 | 197 | Risk Ratio (M‐H, Random, 95% CI) | 0.49 [0.09, 2.64] |
| 11.3 50mg risperidone group ‐ short term | 1 | 201 | Risk Ratio (M‐H, Random, 95% CI) | 2.14 [0.68, 6.73] |
| 11.4 75mg of risperidone group ‐ short term | 1 | 198 | Risk Ratio (M‐H, Random, 95% CI) | 2.45 [0.79, 7.55] |
| 12 Adverse events: 2. Specific: e. Movement disorders: c. Hypertonia (by doses) Show forest plot | 1 | Risk Ratio (M‐H, Random, 95% CI) | Subtotals only | |
| 12.1 all doses of depot risperidone ‐ short term | 1 | 400 | Risk Ratio (M‐H, Random, 95% CI) | 1.23 [0.47, 3.22] |
| 12.2 25mg risperidone ‐ short term | 1 | 197 | Risk Ratio (M‐H, Random, 95% CI) | 0.79 [0.22, 2.86] |
| 12.3 50mg risperidone ‐ short term | 1 | 201 | Risk Ratio (M‐H, Random, 95% CI) | 0.95 [0.28, 3.19] |
| 12.4 75mg risperidone ‐ short term | 1 | 198 | Risk Ratio (M‐H, Random, 95% CI) | 1.96 [0.70, 5.53] |
| 13 Adverse events: 2. Specific: f. Pain Show forest plot | 1 | Risk Ratio (M‐H, Random, 95% CI) | Subtotals only | |
| 13.1 headache ‐ short term | 1 | 400 | Risk Ratio (M‐H, Random, 95% CI) | 1.57 [0.88, 2.80] |
| 13.2 pain ‐ unspecified ‐ short term | 1 | 400 | Risk Ratio (M‐H, Random, 95% CI) | 1.38 [0.48, 4.00] |
| 14 Adverse events: 2. Specific: g. Salivation Show forest plot | 1 | Risk Ratio (M‐H, Random, 95% CI) | Subtotals only | |
| 14.1 decreased ‐ short term | 1 | 400 | Risk Ratio (M‐H, Random, 95% CI) | 2.92 [0.37, 22.76] |
| 14.2 increased ‐ short term | 1 | 400 | Risk Ratio (M‐H, Random, 95% CI) | 2.92 [0.37, 22.76] |
| 15 Adverse events: 2. Specific: h. Sleep disturbances Show forest plot | 1 | Risk Ratio (M‐H, Random, 95% CI) | Subtotals only | |
| 15.1 insomnia ‐ short term | 1 | 400 | Risk Ratio (M‐H, Random, 95% CI) | 1.04 [0.60, 1.82] |
| 15.2 somnolence ‐ short term | 1 | 400 | Risk Ratio (M‐H, Random, 95% CI) | 2.27 [0.69, 7.45] |
| 16 Adverse events: 2. Specific: i. Weight gain Show forest plot | 1 | Risk Ratio (M‐H, Random, 95% CI) | Subtotals only | |
| 16.1 all doses of depot risperidone ‐ short term | 1 | 400 | Risk Ratio (M‐H, Random, 95% CI) | 2.11 [0.48, 9.18] |
| 16.2 25mg risperidone ‐ short term | 1 | 197 | Risk Ratio (M‐H, Random, 95% CI) | 2.47 [0.49, 12.45] |
| 16.3 50mg risperidone ‐ short term | 1 | 201 | Risk Ratio (M‐H, Random, 95% CI) | 1.90 [0.36, 10.16] |
| 16.4 75mg risperidone ‐ short term | 1 | 198 | Risk Ratio (M‐H, Random, 95% CI) | 1.96 [0.37, 10.46] |
| 17 Adverse events: 2. Specific: j. Others Show forest plot | 1 | Risk Ratio (M‐H, Random, 95% CI) | Subtotals only | |
| 17.1 coughing ‐ short term | 1 | 400 | Risk Ratio (M‐H, Random, 95% CI) | 0.97 [0.32, 2.95] |
| 17.2 fatigue ‐ short term | 1 | 400 | Risk Ratio (M‐H, Random, 95% CI) | 8.82 [0.53, 147.05] |
| 17.3 injury ‐ short term | 1 | 400 | Risk Ratio (M‐H, Random, 95% CI) | 0.38 [0.13, 1.10] |
| 17.4 rhinitis ‐ short term | 1 | 400 | Risk Ratio (M‐H, Random, 95% CI) | 1.01 [0.47, 2.17] |
| Outcome or subgroup title | No. of studies | No. of participants | Statistical method | Effect size |
| 1 Global state: 1. Relapse (any reason) Show forest plot | 1 | Risk Ratio (M‐H, Random, 95% CI) | Subtotals only | |
| 1.1 long term | 1 | 63 | Risk Ratio (M‐H, Random, 95% CI) | 2.13 [0.84, 5.43] |
| 2 Global state: 2. Needing use of benzodiazepine or sedative drugs Show forest plot | 1 | Risk Ratio (M‐H, Random, 95% CI) | Subtotals only | |
| 2.1 long term | 1 | 369 | Risk Ratio (M‐H, Random, 95% CI) | 1.00 [0.68, 1.47] |
| 3 Service utilisation: 1. Hospitalisation Show forest plot | 1 | Risk Ratio (M‐H, Random, 95% CI) | Subtotals only | |
| 3.1 long term | 1 | 369 | Risk Ratio (M‐H, Random, 95% CI) | 0.87 [0.68, 1.10] |
| 4 Service utilisation: 2. Outpatient care ‐ number of outpatient visits (skewed data) Show forest plot | Other data | No numeric data | ||
| 4.1 long term | Other data | No numeric data | ||
| 5 Not receiving allocated study medication Show forest plot | 1 | Risk Ratio (M‐H, Random, 95% CI) | Subtotals only | |
| 5.1 long term | 1 | 382 | Risk Ratio (M‐H, Random, 95% CI) | 0.29 [0.06, 1.37] |
| 6 Leaving the study early: 1. Any reason Show forest plot | 2 | 467 | Risk Ratio (M‐H, Random, 95% CI) | 1.24 [0.98, 1.57] |
| 6.1 long term | 2 | 467 | Risk Ratio (M‐H, Random, 95% CI) | 1.24 [0.98, 1.57] |
| 7 Leaving the study early: 2. Specific Show forest plot | 1 | Risk Ratio (M‐H, Random, 95% CI) | Subtotals only | |
| 7.1 insufficient response ‐ long term | 1 | 382 | Risk Ratio (M‐H, Random, 95% CI) | 0.61 [0.15, 2.50] |
| 7.2 withdrawn consent ‐ long term | 1 | 382 | Risk Ratio (M‐H, Random, 95% CI) | 1.41 [0.86, 2.31] |
| 8 Adverse events: 1. General: a. Death Show forest plot | 1 | Risk Ratio (M‐H, Random, 95% CI) | Subtotals only | |
| 8.1 long term | 1 | 382 | Risk Ratio (M‐H, Random, 95% CI) | 1.01 [0.14, 7.10] |
| 9 Adverse events: 2. Specific Show forest plot | 2 | Risk Ratio (M‐H, Random, 95% CI) | Subtotals only | |
| 9.1 anxiety ‐ long term | 1 | 85 | Risk Ratio (M‐H, Random, 95% CI) | 1.40 [0.42, 4.60] |
| 9.2 diabetes mellitus ‐ long term | 1 | 369 | Risk Ratio (M‐H, Random, 95% CI) | 1.70 [0.73, 3.96] |
| 9.3 dizziness ‐ long term | 1 | 85 | Risk Ratio (M‐H, Random, 95% CI) | 1.49 [0.53, 4.19] |
| 9.4 fatigue/somnolence ‐ long term | 1 | 85 | Risk Ratio (M‐H, Random, 95% CI) | 2.05 [0.78, 5.40] |
| 9.5 gastrointestinal ‐ long term | 1 | 369 | Risk Ratio (M‐H, Random, 95% CI) | 1.10 [0.95, 1.28] |
| 9.6 general disorders and administration site conditions ‐ long term | 1 | 369 | Risk Ratio (M‐H, Random, 95% CI) | 1.31 [1.02, 1.69] |
| 9.7 headache ‐ long term | 1 | 85 | Risk Ratio (M‐H, Random, 95% CI) | 2.80 [1.12, 7.00] |
| 9.8 insomnia ‐ long term | 1 | 85 | Risk Ratio (M‐H, Random, 95% CI) | 1.73 [0.77, 3.91] |
| 9.9 nausea/ vomiting ‐ long term | 1 | 85 | Risk Ratio (M‐H, Random, 95% CI) | 1.86 [0.50, 6.97] |
| 9.10 prolactin related ‐ long term | 1 | 85 | Risk Ratio (M‐H, Random, 95% CI) | 10.27 [0.59, 180.05] |
| 9.11 weight increase ‐ long term | 1 | 85 | Risk Ratio (M‐H, Random, 95% CI) | 1.33 [0.56, 3.17] |
| 10 Adverse events: Nervous system disorders (inc. EPS) Show forest plot | 1 | Risk Ratio (M‐H, Random, 95% CI) | Subtotals only | |
| 10.1 long term | 1 | 369 | Risk Ratio (M‐H, Random, 95% CI) | 1.34 [1.13, 1.58] |
| Outcome or subgroup title | No. of studies | No. of participants | Statistical method | Effect size |
| 1 Global state: 1. Moderate to severely ill at end of study period (CGI rating) Show forest plot | 1 | Risk Ratio (M‐H, Random, 95% CI) | Subtotals only | |
| 1.1 short term | 1 | 640 | Risk Ratio (M‐H, Random, 95% CI) | 1.06 [0.92, 1.22] |
| 2 Global state: 2. Mean change from baseline (CGI‐S, high score = worse) Show forest plot | 1 | Mean Difference (IV, Random, 95% CI) | Subtotals only | |
| 2.1 short term | 1 | 50 | Mean Difference (IV, Random, 95% CI) | ‐0.04 [‐0.25, 0.17] |
| 3 Global state: 3. Mean (SD) GAF score change to endpoint Show forest plot | 1 | Mean Difference (IV, Random, 95% CI) | Subtotals only | |
| 3.1 short term | 1 | 50 | Mean Difference (IV, Random, 95% CI) | ‐0.8 [‐5.66, 4.06] |
| 4 Global state: 4. Needing use of benzodiazepine or sedative drugs Show forest plot | 2 | 690 | Risk Ratio (M‐H, Random, 95% CI) | 0.87 [0.74, 1.02] |
| 4.1 short term | 2 | 690 | Risk Ratio (M‐H, Random, 95% CI) | 0.87 [0.74, 1.02] |
| 5 Mental state: 1. Average change/endpoint scores (PANSS, high score = worse) Show forest plot | 2 | Mean Difference (IV, Random, 95% CI) | Subtotals only | |
| 5.1 mean total (non ITT data) | 1 | 541 | Mean Difference (IV, Random, 95% CI) | 0.0 [‐2.91, 2.91] |
| 5.2 average change: 1. total (non ITT data) | 2 | 591 | Mean Difference (IV, Random, 95% CI) | 1.05 [‐0.77, 2.88] |
| 5.3 average change: 2. positive (non‐ITT data) | 2 | 591 | Mean Difference (IV, Random, 95% CI) | 0.83 [‐0.69, 2.35] |
| 5.4 average change: 3. negative (non ITT data) | 2 | 591 | Mean Difference (IV, Random, 95% CI) | 0.03 [‐0.76, 0.82] |
| 5.5 average change: 4. disorganised thoughts | 1 | 541 | Mean Difference (IV, Random, 95% CI) | 0.10 [‐0.45, 0.65] |
| 5.6 average change: 5. hostility/excitement | 1 | 541 | Mean Difference (IV, Random, 95% CI) | 0.10 [‐0.18, 0.38] |
| 5.7 average change: 6. anxiety/depression | 1 | 541 | Mean Difference (IV, Random, 95% CI) | 0.10 [‐0.45, 0.65] |
| 6 Leaving the study early: 1. Any reason Show forest plot | 2 | 690 | Risk Ratio (M‐H, Random, 95% CI) | 1.28 [0.92, 1.79] |
| 6.1 short term | 2 | 690 | Risk Ratio (M‐H, Random, 95% CI) | 1.28 [0.92, 1.79] |
| 7 Leaving the study early: 2. Specific Show forest plot | 1 | Risk Ratio (M‐H, Random, 95% CI) | Subtotals only | |
| 7.1 adverse events ‐ short term | 1 | 640 | Risk Ratio (M‐H, Random, 95% CI) | 1.21 [0.62, 2.35] |
| 7.2 insufficient response ‐ short term | 1 | 640 | Risk Ratio (M‐H, Random, 95% CI) | 1.51 [0.63, 3.64] |
| 7.3 withdrawn consent ‐ short term | 1 | 640 | Risk Ratio (M‐H, Random, 95% CI) | 1.32 [0.65, 2.66] |
| 8 Quality of life: Mean (SD) SF‐36 score change/endpoint (high score = better) Show forest plot | 1 | Mean Difference (IV, Random, 95% CI) | Subtotals only | |
| 8.1 Physical component summary | 1 | 50 | Mean Difference (IV, Random, 95% CI) | 1.4 [‐2.64, 5.44] |
| 8.2 Mental component summary | 1 | 50 | Mean Difference (IV, Random, 95% CI) | ‐0.20 [‐5.06, 4.66] |
| 8.3 Role physical | 1 | 50 | Mean Difference (IV, Random, 95% CI) | 1.0 [‐20.71, 22.71] |
| 8.4 Role emotional | 1 | 50 | Mean Difference (IV, Random, 95% CI) | ‐10.60 [‐34.13, 12.93] |
| 8.5 Vitality | 1 | 50 | Mean Difference (IV, Random, 95% CI) | ‐1.6 [‐10.24, 7.04] |
| 8.6 General health | 1 | 50 | Mean Difference (IV, Random, 95% CI) | ‐2.60 [‐13.14, 7.94] |
| 8.7 Mental health | 1 | 50 | Mean Difference (IV, Random, 95% CI) | 5.8 [‐5.20, 16.80] |
| 8.8 Bodily pain | 1 | 50 | Mean Difference (IV, Random, 95% CI) | 3.70 [‐9.89, 17.29] |
| 8.9 Physical function | 1 | 50 | Mean Difference (IV, Random, 95% CI) | ‐4.6 [‐14.25, 5.05] |
| 8.10 Social function | 1 | 50 | Mean Difference (IV, Random, 95% CI) | 18.5 [3.98, 33.02] |
| 9 Adverse events: 1. General Show forest plot | 1 | Risk Ratio (M‐H, Random, 95% CI) | Subtotals only | |
| 9.1 any ‐ short term | 1 | 640 | Risk Ratio (M‐H, Random, 95% CI) | 1.04 [0.91, 1.18] |
| 9.2 death ‐ short term | 1 | 640 | Risk Ratio (M‐H, Random, 95% CI) | 0.34 [0.01, 8.20] |
| 10 Adverse events: 1. General: UKU average change score (high = worse) Show forest plot | 1 | Mean Difference (IV, Random, 95% CI) | Subtotals only | |
| 10.1 short term | 1 | 50 | Mean Difference (IV, Random, 95% CI) | ‐1.99 [‐3.59, ‐0.39] |
| 11 Adverse events: 2. Specific Show forest plot | 1 | Risk Ratio (M‐H, Random, 95% CI) | Subtotals only | |
| 11.1 anxiety | 1 | 640 | Risk Ratio (M‐H, Random, 95% CI) | 1.40 [0.84, 2.34] |
| 11.2 psychosis | 1 | 640 | Risk Ratio (M‐H, Random, 95% CI) | 1.14 [0.58, 2.24] |
| 11.3 prolactin related | 1 | 640 | Risk Ratio (M‐H, Random, 95% CI) | 0.50 [0.15, 1.65] |
| 11.4 impotence/ejaculation failure | 1 | 640 | Risk Ratio (M‐H, Random, 95% CI) | 0.34 [0.01, 8.20] |
| 11.5 dysmenorrhoea | 1 | 640 | Risk Ratio (M‐H, Random, 95% CI) | 1.01 [0.06, 16.02] |
| 11.6 hyperprolactinaemia | 1 | 640 | Risk Ratio (M‐H, Random, 95% CI) | 0.20 [0.01, 4.18] |
| 11.7 galactorrhoea | 1 | 640 | Risk Ratio (M‐H, Random, 95% CI) | 1.01 [0.14, 7.10] |
| 11.8 headache | 1 | 640 | Risk Ratio (M‐H, Random, 95% CI) | 1.14 [0.66, 1.95] |
| 11.9 insomnia | 1 | 640 | Risk Ratio (M‐H, Random, 95% CI) | 1.08 [0.66, 1.74] |
| 11.10 sexual dysfunction | 1 | 640 | Risk Ratio (M‐H, Random, 95% CI) | 0.50 [0.05, 5.52] |
| 12 Adverse events: 2. Specific: Mean (SD) weight increase in kg Show forest plot | 1 | Mean Difference (IV, Random, 95% CI) | Subtotals only | |
| 12.1 short term | 1 | 640 | Mean Difference (IV, Random, 95% CI) | 0.2 [‐0.35, 0.75] |
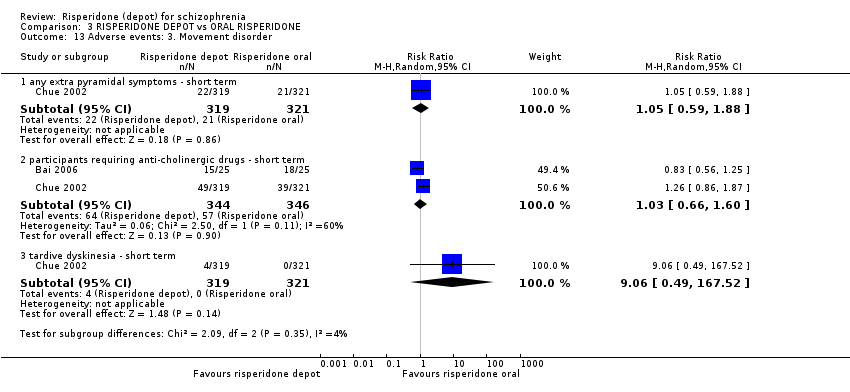
| 13 Adverse events: 3. Movement disorder Show forest plot | 2 | Risk Ratio (M‐H, Random, 95% CI) | Subtotals only | |
| 13.1 any extra pyramidal symptoms ‐ short term | 1 | 640 | Risk Ratio (M‐H, Random, 95% CI) | 1.05 [0.59, 1.88] |
| 13.2 participants requiring anti‐cholinergic drugs ‐ short term | 2 | 690 | Risk Ratio (M‐H, Random, 95% CI) | 1.03 [0.66, 1.60] |
| 13.3 tardive dyskinesia ‐ short term | 1 | 640 | Risk Ratio (M‐H, Random, 95% CI) | 9.06 [0.49, 167.52] |
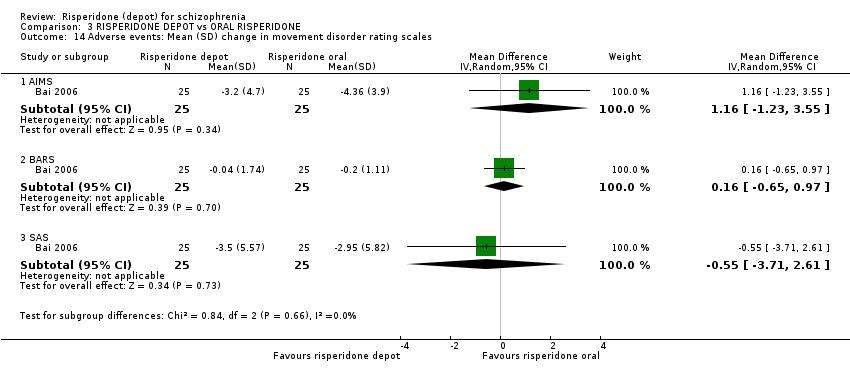
| 14 Adverse events: Mean (SD) change in movement disorder rating scales Show forest plot | 1 | Mean Difference (IV, Random, 95% CI) | Subtotals only | |
| 14.1 AIMS | 1 | 50 | Mean Difference (IV, Random, 95% CI) | 1.16 [‐1.23, 3.55] |
| 14.2 BARS | 1 | 50 | Mean Difference (IV, Random, 95% CI) | 0.16 [‐0.65, 0.97] |
| 14.3 SAS | 1 | 50 | Mean Difference (IV, Random, 95% CI) | ‐0.55 [‐3.71, 2.61] |
| Outcome or subgroup title | No. of studies | No. of participants | Statistical method | Effect size |
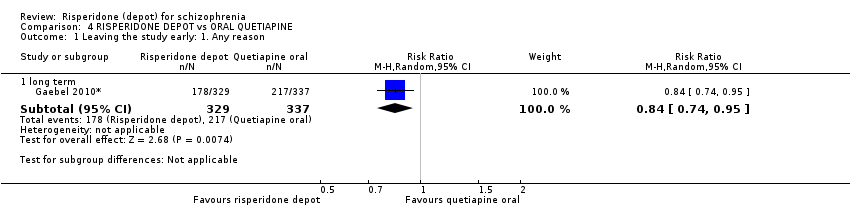
| 1 Leaving the study early: 1. Any reason Show forest plot | 1 | Risk Ratio (M‐H, Random, 95% CI) | Subtotals only | |
| 1.1 long term | 1 | 666 | Risk Ratio (M‐H, Random, 95% CI) | 0.84 [0.74, 0.95] |
| 2 Leaving the study early: 2. Specific Show forest plot | 1 | Risk Ratio (M‐H, Random, 95% CI) | Subtotals only | |
| 2.1 due to relapse ‐ long term | 1 | 666 | Risk Ratio (M‐H, Random, 95% CI) | 0.54 [0.40, 0.73] |
| 3 Adverse events: 1. General Show forest plot | 1 | Risk Ratio (M‐H, Random, 95% CI) | Subtotals only | |
| 3.1 any | 1 | 666 | Risk Ratio (M‐H, Random, 95% CI) | 0.98 [0.89, 1.09] |
| 3.2 serious | 1 | 666 | Risk Ratio (M‐H, Random, 95% CI) | 0.84 [0.62, 1.13] |
| 3.3 death | 1 | 666 | Risk Ratio (M‐H, Random, 95% CI) | 1.54 [0.26, 9.14] |
| 4 Adverse events: 2. Specifc Show forest plot | 1 | Risk Ratio (M‐H, Random, 95% CI) | Subtotals only | |
| 4.1 psychiatric symptoms | 1 | 666 | Risk Ratio (M‐H, Random, 95% CI) | 1.00 [0.84, 1.19] |
| 4.2 prolactin related | 1 | 666 | Risk Ratio (M‐H, Random, 95% CI) | 3.07 [1.13, 8.36] |
| 4.3 hyperprolactinaemia | 1 | 666 | Risk Ratio (M‐H, Random, 95% CI) | 8.81 [3.53, 21.96] |
| 4.4 serious psychiatric symptoms | 1 | 666 | Risk Ratio (M‐H, Random, 95% CI) | 0.82 [0.58, 1.16] |
| 4.5 weight increase | 1 | 666 | Risk Ratio (M‐H, Random, 95% CI) | 1.12 [0.63, 1.99] |
| 4.6 headache | 1 | 666 | Risk Ratio (M‐H, Random, 95% CI) | 1.21 [0.64, 2.26] |
| 4.7 fatigue/somnolence | 1 | 666 | Risk Ratio (M‐H, Random, 95% CI) | 0.16 [0.07, 0.38] |
| 5 Adverse events: 2. Specific: Mean (SD) weight increase in kg Show forest plot | 1 | Mean Difference (IV, Random, 95% CI) | Subtotals only | |
| 5.1 long term | 1 | 666 | Mean Difference (IV, Random, 95% CI) | 1.25 [0.25, 2.25] |
| 6 Adverse events: 3. Movement disorder Show forest plot | 1 | Risk Ratio (M‐H, Random, 95% CI) | Subtotals only | |
| 6.1 any extra pyramidal symptom | 1 | 666 | Risk Ratio (M‐H, Random, 95% CI) | 1.83 [1.07, 3.15] |
| 6.2 tremor | 1 | 666 | Risk Ratio (M‐H, Random, 95% CI) | 5.12 [1.13, 23.20] |
| 6.3 tardive dyskinesia | 1 | 666 | Risk Ratio (M‐H, Random, 95% CI) | 0.34 [0.04, 3.27] |
| 6.4 dystonia | 1 | 666 | Risk Ratio (M‐H, Random, 95% CI) | 0.51 [0.05, 5.62] |
| 6.5 parkinsonism | 1 | 666 | Risk Ratio (M‐H, Random, 95% CI) | 2.56 [1.01, 6.52] |
| 6.6 hyperkinesia | 1 | 666 | Risk Ratio (M‐H, Random, 95% CI) | 1.66 [0.70, 3.96] |
| Outcome or subgroup title | No. of studies | No. of participants | Statistical method | Effect size |
| 1 Global state: 1. Relapse (any reason) Show forest plot | 1 | Risk Ratio (M‐H, Random, 95% CI) | Subtotals only | |
| 1.1 long term | 1 | 349 | Risk Ratio (M‐H, Random, 95% CI) | 1.05 [0.83, 1.33] |
| 2 Global state: 3. Mean time in remission (days) Show forest plot | 1 | Mean Difference (IV, Random, 95% CI) | Subtotals only | |
| 2.1 long term | 1 | 348 | Mean Difference (IV, Random, 95% CI) | 16.80 [‐43.59, 77.19] |
| 3 Mental state: 1. Average change scores (PANSS, high score = worse) Show forest plot | 1 | Mean Difference (IV, Random, 95% CI) | Subtotals only | |
| 3.1 long term | 1 | 349 | Mean Difference (IV, Random, 95% CI) | ‐0.10 [‐3.15, 2.95] |
| 4 Leaving the study early: 1. Any reason Show forest plot | 2 | 723 | Risk Ratio (M‐H, Random, 95% CI) | 0.83 [0.53, 1.30] |
| 4.1 long term | 2 | 723 | Risk Ratio (M‐H, Random, 95% CI) | 0.83 [0.53, 1.30] |
| 5 Leaving the study early: 2. Specific Show forest plot | 2 | Risk Ratio (M‐H, Random, 95% CI) | Subtotals only | |
| 5.1 adverse events | 2 | 723 | Risk Ratio (M‐H, Random, 95% CI) | 0.41 [0.05, 3.55] |
| 5.2 insufficient response | 1 | 349 | Risk Ratio (M‐H, Random, 95% CI) | 1.30 [0.29, 5.70] |
| 5.3 withdrawn consent | 2 | 723 | Risk Ratio (M‐H, Random, 95% CI) | 1.01 [0.67, 1.52] |
| 5.4 due to relapse | 1 | 374 | Risk Ratio (M‐H, Random, 95% CI) | 0.62 [0.36, 1.06] |
| 5.5 loss to follow‐up | 1 | 349 | Risk Ratio (M‐H, Random, 95% CI) | 1.75 [0.83, 3.68] |
| 6 Adverse events: 1. General Show forest plot | 2 | Risk Ratio (M‐H, Random, 95% CI) | Subtotals only | |
| 6.1 any | 2 | 729 | Risk Ratio (M‐H, Random, 95% CI) | 0.99 [0.87, 1.14] |
| 6.2 serious | 2 | 729 | Risk Ratio (M‐H, Random, 95% CI) | 0.96 [0.66, 1.39] |
| 6.3 death | 2 | 729 | Risk Ratio (M‐H, Random, 95% CI) | 0.98 [0.13, 7.36] |
| 7 Adverse events: 2. Specific Show forest plot | 2 | Risk Ratio (M‐H, Random, 95% CI) | Subtotals only | |
| 7.1 anxiety | 1 | 355 | Risk Ratio (M‐H, Random, 95% CI) | 1.21 [0.75, 1.94] |
| 7.2 depression | 1 | 355 | Risk Ratio (M‐H, Random, 95% CI) | 1.57 [0.85, 2.90] |
| 7.3 psychosis | 1 | 355 | Risk Ratio (M‐H, Random, 95% CI) | 1.04 [0.69, 1.56] |
| 7.4 psychiatric symptoms | 1 | 374 | Risk Ratio (M‐H, Random, 95% CI) | 0.81 [0.60, 1.09] |
| 7.5 serious psychiatric symptoms | 1 | 374 | Risk Ratio (M‐H, Random, 95% CI) | 0.75 [0.27, 2.08] |
| 7.6 schizophrenia | 1 | 355 | Risk Ratio (M‐H, Random, 95% CI) | 1.02 [0.63, 1.64] |
| 7.7 prolactin related | 2 | 729 | Risk Ratio (M‐H, Random, 95% CI) | 9.91 [2.78, 35.29] |
| 7.8 hyperprolactinaemia | 1 | 374 | Risk Ratio (M‐H, Random, 95% CI) | 12.13 [0.76, 193.65] |
| 7.9 weight increase | 1 | 374 | Risk Ratio (M‐H, Random, 95% CI) | 1.57 [0.38, 6.45] |
| 7.10 nausea/vomiting | 1 | 349 | Risk Ratio (M‐H, Random, 95% CI) | 1.25 [0.64, 2.43] |
| 7.11 gastrointestinal | 1 | 374 | Risk Ratio (M‐H, Random, 95% CI) | 0.27 [0.14, 0.55] |
| 7.12 decreased appetite | 1 | 355 | Risk Ratio (M‐H, Random, 95% CI) | 1.78 [1.00, 3.16] |
| 7.13 diarrhoea | 1 | 355 | Risk Ratio (M‐H, Random, 95% CI) | 0.62 [0.31, 1.24] |
| 7.14 headache | 2 | 729 | Risk Ratio (M‐H, Random, 95% CI) | 0.87 [0.46, 1.65] |
| 7.15 insomnia | 1 | 355 | Risk Ratio (M‐H, Random, 95% CI) | 0.91 [0.65, 1.27] |
| 7.16 upper resp. tract infection | 1 | 355 | Risk Ratio (M‐H, Random, 95% CI) | 0.38 [0.16, 0.89] |
| 7.17 pyrexia | 1 | 355 | Risk Ratio (M‐H, Random, 95% CI) | 1.16 [0.69, 1.97] |
| 7.18 nasopharyngitis | 1 | 355 | Risk Ratio (M‐H, Random, 95% CI) | 1.11 [0.58, 2.10] |
| 7.19 dizziness | 1 | 355 | Risk Ratio (M‐H, Random, 95% CI) | 1.89 [1.00, 3.58] |
| 7.20 glucose related | 1 | 355 | Risk Ratio (M‐H, Random, 95% CI) | 1.11 [0.58, 2.10] |
| 8 Adverse events: 2. Specific 12. Mean (SD) weight increase in kg Show forest plot | 1 | Mean Difference (IV, Random, 95% CI) | Subtotals only | |
| 8.1 long term | 1 | 355 | Mean Difference (IV, Random, 95% CI) | 1.0 [‐0.42, 2.42] |
| 9 Adverse events: 3. Movement disorder Show forest plot | 2 | Risk Ratio (M‐H, Random, 95% CI) | Subtotals only | |
| 9.1 any extra pyramidal symptoms | 2 | 729 | Risk Ratio (M‐H, Random, 95% CI) | 1.19 [0.91, 1.55] |
| 9.2 tremor | 1 | 355 | Risk Ratio (M‐H, Random, 95% CI) | 0.96 [0.65, 1.41] |
| 9.3 akathisia | 1 | 355 | Risk Ratio (M‐H, Random, 95% CI) | 0.98 [0.55, 1.76] |
| Outcome or subgroup title | No. of studies | No. of participants | Statistical method | Effect size |
| 1 Mental state: 1. Average change scores (PANNS, high score = worse) Show forest plot | 1 | Mean Difference (IV, Random, 95% CI) | Subtotals only | |
| 1.1 total ‐ short term | 1 | 377 | Mean Difference (IV, Random, 95% CI) | 0.90 [‐2.25, 4.05] |
| 1.2 total ‐ long term | 1 | 361 | Mean Difference (IV, Random, 95% CI) | 0.10 [‐3.96, 4.16] |
| 1.3 positive symptoms ‐ long term | 1 | 361 | Mean Difference (IV, Random, 95% CI) | ‐0.30 [‐1.61, 1.01] |
| 1.4 negative symptoms ‐ long term | 1 | 361 | Mean Difference (IV, Random, 95% CI) | 0.10 [‐1.28, 1.48] |
| 1.5 disorganised thoughts ‐ long term | 1 | 361 | Mean Difference (IV, Random, 95% CI) | ‐0.30 [‐1.34, 0.74] |
| 1.6 hostility/excitement ‐ long term | 1 | 361 | Mean Difference (IV, Random, 95% CI) | 0.20 [‐0.60, 1.00] |
| 1.7 anxiety/depression ‐ long term | 1 | 361 | Mean Difference (IV, Random, 95% CI) | 0.30 [‐0.46, 1.06] |
| 2 Leaving the study early: 1. Any reason Show forest plot | 1 | Risk Ratio (M‐H, Random, 95% CI) | Subtotals only | |
| 2.1 long term | 1 | 618 | Risk Ratio (M‐H, Random, 95% CI) | 1.32 [1.10, 1.58] |
| 3 Leaving the study early: 2. Specific Show forest plot | 1 | Risk Ratio (M‐H, Random, 95% CI) | Subtotals only | |
| 3.1 adverse events | 1 | 547 | Risk Ratio (M‐H, Random, 95% CI) | 0.71 [0.28, 1.77] |
| 3.2 insufficient response | 1 | 547 | Risk Ratio (M‐H, Random, 95% CI) | 0.81 [0.49, 1.35] |
| 3.3 withdrawn consent | 1 | 547 | Risk Ratio (M‐H, Random, 95% CI) | 2.54 [1.56, 4.16] |
| 3.4 due to weight gain | 1 | 547 | Risk Ratio (M‐H, Random, 95% CI) | 0.24 [0.03, 2.07] |
| 4 Adverse events: 1. General Show forest plot | 1 | Risk Ratio (M‐H, Random, 95% CI) | Subtotals only | |
| 4.1 serious | 1 | 547 | Risk Ratio (M‐H, Random, 95% CI) | 1.10 [0.80, 1.51] |
| 4.2 death | 1 | 618 | Risk Ratio (M‐H, Random, 95% CI) | 0.31 [0.06, 1.55] |
| 5 Adverse events: 2. Specific Show forest plot | 1 | Risk Ratio (M‐H, Random, 95% CI) | Subtotals only | |
| 5.1 agitation | 1 | 532 | Risk Ratio (M‐H, Random, 95% CI) | 1.98 [1.06, 3.68] |
| 5.2 anxiety | 1 | 532 | Risk Ratio (M‐H, Random, 95% CI) | 0.87 [0.58, 1.31] |
| 5.3 depression | 1 | 532 | Risk Ratio (M‐H, Random, 95% CI) | 1.45 [0.99, 2.12] |
| 5.4 psychosis | 1 | 532 | Risk Ratio (M‐H, Random, 95% CI) | 1.15 [0.87, 1.52] |
| 5.5 impotence/ejaculation failure | 1 | 547 | Risk Ratio (M‐H, Random, 95% CI) | 1.21 [0.17, 8.56] |
| 5.6 galactorrhoea | 1 | 547 | Risk Ratio (M‐H, Random, 95% CI) | 3.04 [0.59, 15.52] |
| 5.7 serious psychiatric symptoms | 1 | 547 | Risk Ratio (M‐H, Random, 95% CI) | 1.01 [0.64, 1.59] |
| 5.8 serious anxiety | 1 | 547 | Risk Ratio (M‐H, Random, 95% CI) | 1.42 [0.48, 4.16] |
| 5.9 suicide attempt | 1 | 547 | Risk Ratio (M‐H, Random, 95% CI) | 1.35 [0.56, 3.27] |
| 5.10 serious injury | 1 | 547 | Risk Ratio (M‐H, Random, 95% CI) | 2.02 [0.49, 8.39] |
| 5.11 weight increase | 1 | 547 | Risk Ratio (M‐H, Random, 95% CI) | 0.56 [0.42, 0.75] |
| 5.12 headache | 1 | 532 | Risk Ratio (M‐H, Random, 95% CI) | 1.56 [0.81, 3.01] |
| 5.13 insomnia | 1 | 532 | Risk Ratio (M‐H, Random, 95% CI) | 4.59 [2.61, 8.07] |
| 5.14 fatigue/somnolence | 1 | 532 | Risk Ratio (M‐H, Random, 95% CI) | 0.71 [0.35, 1.41] |
| 5.15 nasopharyngitis | 1 | 532 | Risk Ratio (M‐H, Random, 95% CI) | 1.17 [0.61, 2.21] |
| 5.16 diabetes mellitus | 1 | 547 | Risk Ratio (M‐H, Random, 95% CI) | 1.21 [0.08, 19.32] |
| 5.17 hyperglycaemia | 1 | 494 | Risk Ratio (M‐H, Random, 95% CI) | 1.0 [0.25, 3.95] |
| 5.18 hypoglycaemia | 1 | 547 | Risk Ratio (M‐H, Random, 95% CI) | 0.40 [0.02, 9.89] |
| 6 Adverse events: 3. Movement disorder Show forest plot | 1 | Risk Ratio (M‐H, Random, 95% CI) | Subtotals only | |
| 6.1 any extra pyramidal symptoms | 1 | 547 | Risk Ratio (M‐H, Random, 95% CI) | 1.67 [1.19, 2.36] |
| 6.2 tremor | 1 | 547 | Risk Ratio (M‐H, Random, 95% CI) | 2.29 [1.04, 5.06] |
| 6.3 tardive dyskinesia | 1 | 547 | Risk Ratio (M‐H, Random, 95% CI) | 1.21 [0.17, 8.56] |
| 6.4 hypertonia | 1 | 547 | Risk Ratio (M‐H, Random, 95% CI) | 1.35 [0.56, 3.27] |
| 6.5 dystonia | 1 | 547 | Risk Ratio (M‐H, Random, 95% CI) | 6.07 [0.29, 125.82] |
| 6.6 hyperkinesia | 1 | 547 | Risk Ratio (M‐H, Random, 95% CI) | 2.02 [1.01, 4.06] |
| 6.7 requiring antiparkinson drugs | 1 | 547 | Risk Ratio (M‐H, Random, 95% CI) | 1.26 [1.02, 1.56] |
| Outcome or subgroup title | No. of studies | No. of participants | Statistical method | Effect size |
| 1 Global state: 1. Relapse (any reason) Show forest plot | 2 | Risk Ratio (M‐H, Random, 95% CI) | Subtotals only | |
| 1.1 vs aripiprazole ‐ long term | 1 | 349 | Risk Ratio (M‐H, Random, 95% CI) | 1.05 [0.83, 1.33] |
| 1.2 vs general oral antipsychotics ‐ long term | 1 | 63 | Risk Ratio (M‐H, Random, 95% CI) | 2.13 [0.84, 5.43] |
| 2 Mental state: 1. Average change scores (PANSS, high score = worse) 1. total Show forest plot | 4 | Mean Difference (IV, Random, 95% CI) | Subtotals only | |
| 2.1 vs oral risperidone (non ITT data) ‐ short term | 2 | 591 | Mean Difference (IV, Random, 95% CI) | 1.05 [‐0.77, 2.88] |
| 2.2 vs olanzapine ‐ short term | 1 | 377 | Mean Difference (IV, Random, 95% CI) | 0.90 [‐2.25, 4.05] |
| 2.3 vs olanzapine ‐ long term | 1 | 361 | Mean Difference (IV, Random, 95% CI) | 0.10 [‐3.96, 4.16] |
| 2.4 vs aripiprazole ‐ long term | 1 | 349 | Mean Difference (IV, Random, 95% CI) | ‐0.10 [‐3.15, 2.95] |
| 3 Leaving the study early: 1. Any reason Show forest plot | 7 | Risk Ratio (M‐H, Random, 95% CI) | Subtotals only | |
| 3.1 vs aripiprazole | 2 | 723 | Risk Ratio (M‐H, Random, 95% CI) | 0.83 [0.53, 1.30] |
| 3.2 vs quetiapine | 1 | 666 | Risk Ratio (M‐H, Random, 95% CI) | 0.84 [0.74, 0.95] |
| 3.3 vs oral risperidone | 2 | 690 | Risk Ratio (M‐H, Random, 95% CI) | 1.28 [0.92, 1.79] |
| 3.4 vs any new generation antipsychotic | 1 | 77 | Risk Ratio (M‐H, Random, 95% CI) | 0.72 [0.55, 0.95] |
| 3.5 vs olanzapine | 1 | 618 | Risk Ratio (M‐H, Random, 95% CI) | 1.32 [1.10, 1.58] |
| 3.6 vs any oral antipsychotic | 1 | 382 | Risk Ratio (M‐H, Random, 95% CI) | 1.25 [0.93, 1.68] |
| 4 Adverse events: 1. Death Show forest plot | 5 | Risk Ratio (M‐H, Random, 95% CI) | Subtotals only | |
| 4.1 vs olanzapine | 1 | 618 | Risk Ratio (M‐H, Random, 95% CI) | 0.31 [0.06, 1.55] |
| 4.2 vs oral risperidone | 1 | 640 | Risk Ratio (M‐H, Random, 95% CI) | 0.34 [0.01, 8.20] |
| 4.3 vs any oral antipsychotic | 1 | 382 | Risk Ratio (M‐H, Random, 95% CI) | 1.01 [0.14, 7.10] |
| 4.4 vs aripiprazole | 2 | 729 | Risk Ratio (M‐H, Random, 95% CI) | 0.98 [0.13, 7.36] |
| 4.5 vs quetiapine | 1 | 666 | Risk Ratio (M‐H, Random, 95% CI) | 1.54 [0.26, 9.14] |
| 5 Adverse events: 1. General: a. any Show forest plot | 3 | Risk Ratio (M‐H, Random, 95% CI) | Subtotals only | |
| 5.1 vs aripiprazole | 2 | 729 | Risk Ratio (M‐H, Random, 95% CI) | 0.99 [0.87, 1.14] |
| 5.2 vs oral risperidone | 1 | 640 | Risk Ratio (M‐H, Random, 95% CI) | 1.04 [0.91, 1.18] |
| 5.3 vs quetiapine | 1 | 666 | Risk Ratio (M‐H, Random, 95% CI) | 0.98 [0.89, 1.09] |
| 6 Adverse events: 1. General: b. serious Show forest plot | 3 | Risk Ratio (M‐H, Random, 95% CI) | Subtotals only | |
| 6.1 vs quetiapine | 1 | 666 | Risk Ratio (M‐H, Random, 95% CI) | 0.84 [0.62, 1.13] |
| 6.2 vs aripiprazole | 2 | 729 | Risk Ratio (M‐H, Random, 95% CI) | 0.96 [0.66, 1.39] |
| 6.3 vs olanzapine | 1 | 547 | Risk Ratio (M‐H, Random, 95% CI) | 1.10 [0.80, 1.51] |
| 7 Adverse events: 2. Movement disorder: a. any extra pyramidal symptoms Show forest plot | 4 | Risk Ratio (M‐H, Random, 95% CI) | Subtotals only | |
| 7.1 vs aripiprazole | 2 | 729 | Risk Ratio (M‐H, Random, 95% CI) | 1.19 [0.91, 1.55] |
| 7.2 vs quetiapine | 1 | 666 | Risk Ratio (M‐H, Random, 95% CI) | 1.83 [1.07, 3.15] |
| 7.3 vs olanzapine | 1 | 547 | Risk Ratio (M‐H, Random, 95% CI) | 1.67 [1.19, 2.36] |
| 7.4 vs oral risperidone | 1 | 640 | Risk Ratio (M‐H, Random, 95% CI) | 1.05 [0.59, 1.88] |
| Outcome or subgroup title | No. of studies | No. of participants | Statistical method | Effect size |
| 1 Global State: 1. CGI‐S mean change from baseline (high score = worse) Show forest plot | 2 | 1326 | Mean Difference (IV, Random, 95% CI) | ‐0.07 [‐0.26, 0.11] |
| 1.1 medium term | 2 | 1326 | Mean Difference (IV, Random, 95% CI) | ‐0.07 [‐0.26, 0.11] |
| 2 Global state: 2. Schedule for Deficit Syndrome (SDS) scale (mean change from baseline, high score = worse) Show forest plot | 1 | Mean Difference (IV, Random, 95% CI) | Subtotals only | |
| 2.1 medium term | 1 | 913 | Mean Difference (IV, Random, 95% CI) | 0.10 [‐0.29, 0.49] |
| 3 Mental state: 1. PANSS scores (high score = worse) ‐ medium term Show forest plot | 2 | Mean Difference (IV, Random, 95% CI) | Subtotals only | |
| 3.1 total mean change to endpoint (ITT and per protocol data)* | 2 | 1326 | Mean Difference (IV, Random, 95% CI) | 1.12 [‐2.79, 5.02] |
| 3.2 positive symptoms score change to endpoint | 2 | 1326 | Mean Difference (IV, Random, 95% CI) | 0.66 [‐1.39, 2.71] |
| 3.3 negative symptoms score change to endpoint (ITT data) | 2 | 1326 | Mean Difference (IV, Random, 95% CI) | 0.06 [‐0.47, 0.59] |
| 3.4 disorganised thoughts score change to endpoint (ITT data) | 2 | 1326 | Mean Difference (IV, Random, 95% CI) | 0.02 [‐0.55, 0.59] |
| 3.5 uncontrolled hostility/excitement score change to endpoint (ITT data) | 2 | 1326 | Mean Difference (IV, Random, 95% CI) | ‐0.04 [‐0.50, 0.41] |
| 3.6 anxiety/depression score change to endpoint (ITT data) | 2 | 1326 | Mean Difference (IV, Random, 95% CI) | 0.01 [‐0.67, 0.69] |
| 4 Mental state: 2. Improved by 30% in total PANSS score (ITT data) Show forest plot | 2 | Risk Ratio (M‐H, Random, 95% CI) | Subtotals only | |
| 4.1 medium term | 2 | 1326 | Risk Ratio (M‐H, Random, 95% CI) | 1.01 [0.83, 1.23] |
| 5 General functioning: Personal and Social Performance (PSP) scale (high score = better) Show forest plot | 2 | 1326 | Mean Difference (IV, Random, 95% CI) | 0.65 [‐0.69, 1.98] |
| 5.1 mean endpoint ‐ medium term | 2 | 1326 | Mean Difference (IV, Random, 95% CI) | 0.65 [‐0.69, 1.98] |
| 6 Leaving the study early: 1. Any reason Show forest plot | 3 | Risk Ratio (M‐H, Random, 95% CI) | Subtotals only | |
| 6.1 Lack of efficacy ‐ medium term | 2 | 1672 | Risk Ratio (M‐H, Random, 95% CI) | 0.71 [0.29, 1.75] |
| 6.2 Lack of efficacy ‐ long term | 1 | 749 | Risk Ratio (M‐H, Random, 95% CI) | 0.60 [0.45, 0.81] |
| 6.3 Adverse events ‐ medium term | 2 | 1672 | Risk Ratio (M‐H, Random, 95% CI) | 0.68 [0.28, 1.65] |
| 6.4 Adverse events ‐ long term | 1 | 749 | Risk Ratio (M‐H, Random, 95% CI) | 0.88 [0.53, 1.48] |
| 6.5 Patient choice/withdrawn consent ‐ medium term | 2 | 1672 | Risk Ratio (M‐H, Random, 95% CI) | 0.61 [0.22, 1.71] |
| 6.6 Patient choice/withdrawn consent ‐ long term | 1 | 749 | Risk Ratio (M‐H, Random, 95% CI) | 1.15 [0.83, 1.61] |
| 6.7 Lost to follow‐up ‐ medium term | 2 | 1672 | Risk Ratio (M‐H, Random, 95% CI) | 1.61 [0.93, 2.79] |
| 6.8 Lost to follow‐up ‐ long term | 1 | 749 | Risk Ratio (M‐H, Random, 95% CI) | 0.87 [0.39, 1.91] |
| 6.9 Pregnancy ‐ medium term | 2 | 1672 | Risk Ratio (M‐H, Random, 95% CI) | 0.26 [0.03, 2.32] |
| 6.10 Pregnancy ‐ long term | 1 | 749 | Risk Ratio (M‐H, Random, 95% CI) | 1.02 [0.06, 16.32] |
| 6.11 Death ‐ long term | 1 | 749 | Risk Ratio (M‐H, Random, 95% CI) | 0.20 [0.01, 4.25] |
| 6.12 Other ‐ medium term | 2 | 1672 | Risk Ratio (M‐H, Random, 95% CI) | 0.77 [0.45, 1.32] |
| 6.13 Other ‐ long term | 1 | 749 | Risk Ratio (M‐H, Random, 95% CI) | 1.09 [0.67, 1.78] |
| 6.14 Any reason ‐ medium term | 2 | 1672 | Risk Ratio (M‐H, Random, 95% CI) | 0.77 [0.51, 1.17] |
| 6.15 Any reason ‐ long term | 1 | 749 | Risk Ratio (M‐H, Random, 95% CI) | 0.85 [0.75, 0.97] |
| 7 Adverse events: 1. General Show forest plot | 3 | Risk Ratio (M‐H, Random, 95% CI) | Subtotals only | |
| 7.1 overall rate ‐ medium term | 2 | 1666 | Risk Ratio (M‐H, Random, 95% CI) | 1.20 [0.33, 4.42] |
| 7.2 overall rate ‐ long term | 1 | 747 | Risk Ratio (M‐H, Random, 95% CI) | 0.74 [0.58, 0.95] |
| 7.3 worsening of schizophrenia ‐ medium term | 2 | 1666 | Risk Ratio (M‐H, Random, 95% CI) | 0.82 [0.40, 1.69] |
| 7.4 worsening of psychiatric disorders ‐ medium term | 1 | 1214 | Risk Ratio (M‐H, Random, 95% CI) | 0.54 [0.22, 1.34] |
| 7.5 death ‐ medium term | 2 | 1666 | Risk Ratio (M‐H, Random, 95% CI) | 0.96 [0.14, 6.54] |
| 7.6 death ‐ long term | 1 | 749 | Risk Ratio (M‐H, Random, 95% CI) | 0.20 [0.01, 4.25] |
| 8 Adverse events: 2. Specific Show forest plot | 3 | Risk Ratio (M‐H, Random, 95% CI) | Subtotals only | |
| 8.1 overall rate ‐ medium term | 2 | 1666 | Risk Ratio (M‐H, Random, 95% CI) | 0.96 [0.86, 1.08] |
| 8.2 overall rate ‐ long term | 1 | 747 | Risk Ratio (M‐H, Random, 95% CI) | 1.03 [0.95, 1.11] |
| 8.3 insomnia ‐ medium term | 1 | 1214 | Risk Ratio (M‐H, Random, 95% CI) | 0.72 [0.49, 1.05] |
| 8.4 insomnia ‐ long term | 1 | 747 | Risk Ratio (M‐H, Random, 95% CI) | 0.99 [0.71, 1.40] |
| 8.5 psychotic disorder ‐ long term | 1 | 747 | Risk Ratio (M‐H, Random, 95% CI) | 0.86 [0.59, 1.24] |
| 8.6 worsening of schizophrenia ‐ long term | 1 | 747 | Risk Ratio (M‐H, Random, 95% CI) | 0.76 [0.49, 1.16] |
| 8.7 anxiety ‐ medium term | 1 | 1214 | Risk Ratio (M‐H, Random, 95% CI) | 0.50 [0.26, 0.96] |
| 8.8 anxiety ‐ long term | 1 | 747 | Risk Ratio (M‐H, Random, 95% CI) | 1.49 [1.01, 2.20] |
| 8.9 headache ‐ long term | 1 | 747 | Risk Ratio (M‐H, Random, 95% CI) | 1.21 [0.78, 1.87] |
| 8.10 constipation ‐ medium term | 1 | 1214 | Risk Ratio (M‐H, Random, 95% CI) | 3.79 [1.42, 10.08] |
| 8.11 injection site pain ‐ medium term | 2 | 1666 | Risk Ratio (M‐H, Random, 95% CI) | 0.16 [0.07, 0.38] |
| 8.12 somnolence ‐ medium term | 1 | 452 | Risk Ratio (M‐H, Random, 95% CI) | 0.56 [0.21, 1.49] |
| 8.13 weight gain (proportion of participants with >7% increase) ‐ medium term | 1 | 452 | Risk Ratio (M‐H, Random, 95% CI) | 1.12 [0.72, 1.75] |
| 8.14 tachycardia ‐ medium term | 1 | 452 | Risk Ratio (M‐H, Random, 95% CI) | 1.03 [0.26, 4.06] |
| 8.15 tachycardia ‐ long term | 1 | 747 | Risk Ratio (M‐H, Random, 95% CI) | 0.34 [0.11, 1.05] |
| 9 Adverse events: 3. Prolactin related Show forest plot | 3 | Risk Ratio (M‐H, Random, 95% CI) | Subtotals only | |
| 9.1 amenorrhoea ‐ medium term | 2 | 784 | Risk Ratio (M‐H, Random, 95% CI) | 1.78 [0.24, 13.02] |
| 9.2 galactorrhoea ‐ medium term | 1 | 271 | Risk Ratio (M‐H, Random, 95% CI) | 0.37 [0.02, 8.92] |
| 9.3 hyperprolactinaemia ‐ medium term | 1 | 452 | Risk Ratio (M‐H, Random, 95% CI) | 5.13 [0.60, 43.60] |
| 9.4 erectile dysfunction ‐ medium term | 1 | 701 | Risk Ratio (M‐H, Random, 95% CI) | 0.80 [0.18, 3.53] |
| 9.5 increase in serum prolactin ‐ medium term | 1 | 452 | Risk Ratio (M‐H, Random, 95% CI) | 0.72 [0.35, 1.48] |
| 9.6 amenorrhoea‐galactorrhoea syndrome ‐ medium term | 1 | 271 | Risk Ratio (M‐H, Random, 95% CI) | 3.3 [0.14, 80.29] |
| 9.7 any prolactin related ‐ medium term | 2 | 1666 | Risk Ratio (M‐H, Random, 95% CI) | 1.02 [0.61, 1.71] |
| 9.8 proportion of male participants with abnormally high prolactin ‐ long term | 1 | 424 | Risk Ratio (M‐H, Random, 95% CI) | 1.68 [1.32, 2.14] |
| 9.9 proportion of female participants with abnormally high prolactin ‐ long term | 1 | 294 | Risk Ratio (M‐H, Random, 95% CI) | 1.21 [0.95, 1.55] |
| 10 Adverse events: 4. Movement disorder Show forest plot | 3 | Risk Ratio (M‐H, Random, 95% CI) | Subtotals only | |
| 10.1 akathisia ‐ medium term | 1 | 452 | Risk Ratio (M‐H, Random, 95% CI) | 1.51 [0.98, 2.31] |
| 10.2 tremor ‐ medium term | 1 | 452 | Risk Ratio (M‐H, Random, 95% CI) | 1.71 [1.07, 2.74] |
| 10.3 tardive dyskinesia ‐ medium term | 1 | 1214 | Risk Ratio (M‐H, Random, 95% CI) | 1.00 [0.06, 15.90] |
| 10.4 requiring use of anti‐EPS medication ‐ medium term | 2 | 1666 | Risk Ratio (M‐H, Random, 95% CI) | 1.46 [1.18, 1.80] |
| 10.5 hyperkinesia ‐ long term | 1 | 747 | Risk Ratio (M‐H, Random, 95% CI) | 1.66 [1.00, 2.73] |
| 10.6 neuroleptic malignant syndrome ‐ long term | 1 | 747 | Risk Ratio (M‐H, Random, 95% CI) | 0.34 [0.01, 8.40] |
| 11 Adverse events: 5. Body weight (mean increase) Show forest plot | 3 | 2350 | Mean Difference (IV, Random, 95% CI) | 0.18 [‐0.36, 0.72] |
| 11.1 medium term | 2 | 1666 | Mean Difference (IV, Random, 95% CI) | ‐0.07 [‐0.38, 0.24] |
| 11.2 long term | 1 | 684 | Mean Difference (IV, Random, 95% CI) | 1.0 [0.13, 1.87] |
| 12 Adverse events: 6. Mean prolactin level increase (ng/mL) Show forest plot | 2 | Mean Difference (IV, Random, 95% CI) | Subtotals only | |
| 12.1 female participants | 2 | 807 | Mean Difference (IV, Random, 95% CI) | ‐3.40 [‐12.65, 5.85] |
| 12.2 male participants | 2 | 1125 | Mean Difference (IV, Random, 95% CI) | ‐0.43 [‐5.88, 5.03] |
| 13 Adverse events: 7. Glucose related Show forest plot | 3 | Risk Ratio (M‐H, Random, 95% CI) | Subtotals only | |
| 13.1 increased blood glucose ‐ long term | 1 | 747 | Risk Ratio (M‐H, Random, 95% CI) | 1.54 [0.44, 5.43] |
| 13.2 hyperglycaemia ‐ long term | 1 | 747 | Risk Ratio (M‐H, Random, 95% CI) | 1.37 [0.31, 6.09] |
| 13.3 diabetes mellitus ‐ long term | 1 | 747 | Risk Ratio (M‐H, Random, 95% CI) | 4.12 [0.46, 36.68] |
| 13.4 glycosuria ‐ long term | 1 | 747 | Risk Ratio (M‐H, Random, 95% CI) | 0.34 [0.01, 8.40] |
| 13.5 ketonuria ‐ long term | 1 | 747 | Risk Ratio (M‐H, Random, 95% CI) | 0.34 [0.01, 8.40] |
| 13.6 urine ketone body present ‐ long term | 1 | 747 | Risk Ratio (M‐H, Random, 95% CI) | 0.34 [0.01, 8.40] |
| 13.7 hypoglycaemia ‐ long term | 1 | 747 | Risk Ratio (M‐H, Random, 95% CI) | 3.09 [0.13, 75.59] |
| 13.8 any glucose related ‐ medium term | 2 | 1666 | Risk Ratio (M‐H, Random, 95% CI) | 1.76 [0.52, 5.98] |
| 13.9 any glucose related ‐ long term | 1 | 747 | Risk Ratio (M‐H, Random, 95% CI) | 1.80 [0.77, 4.25] |
| 14 Adverse events: 8. Injection site pain (mean (sd) Visual Analogue Scale score (0‐100mm)) Show forest plot | 1 | Mean Difference (IV, Random, 95% CI) | Subtotals only | |
| 14.1 at baseline | 1 | 747 | Mean Difference (IV, Random, 95% CI) | 1.80 [‐0.24, 3.84] |
| 14.2 at endpoint | 1 | 747 | Mean Difference (IV, Random, 95% CI) | 0.0 [‐1.07, 1.07] |
| Outcome or subgroup title | No. of studies | No. of participants | Statistical method | Effect size |
| 1 Mental state: 1. Total endpoint scores (PANNS, high score = worse) Show forest plot | 1 | Mean Difference (IV, Random, 95% CI) | Subtotals only | |
| 1.1 short term | 1 | 49 | Mean Difference (IV, Random, 95% CI) | 0.70 [‐8.12, 9.52] |
| 1.2 medium term | 1 | 46 | Mean Difference (IV, Random, 95% CI) | ‐0.10 [‐9.02, 8.82] |
| 1.3 long term | 1 | 43 | Mean Difference (IV, Random, 95% CI) | 1.80 [‐10.04, 13.64] |
| 2 Leaving the study early Show forest plot | 1 | Risk Ratio (M‐H, Random, 95% CI) | Subtotals only | |
| 2.1 before beginning assigned treatment | 1 | 62 | Risk Ratio (M‐H, Random, 95% CI) | 7.50 [1.00, 56.44] |
| 2.2 by 6 months | 1 | 62 | Risk Ratio (M‐H, Random, 95% CI) | 3.05 [1.12, 8.31] |
| 2.3 due to increased psychiatric symptoms | 1 | 62 | Risk Ratio (M‐H, Random, 95% CI) | 2.81 [0.31, 25.58] |
| 2.4 due to EPS effects | 1 | 62 | Risk Ratio (M‐H, Random, 95% CI) | 0.31 [0.01, 7.40] |
| 2.5 due to weight gain and hypertension | 1 | 62 | Risk Ratio (M‐H, Random, 95% CI) | 2.82 [0.12, 66.62] |
| 2.6 due to participant preference | 1 | 62 | Risk Ratio (M‐H, Random, 95% CI) | 0.94 [0.06, 14.33] |
| 3 Hospitalisation by 6 months Show forest plot | 1 | Risk Ratio (M‐H, Random, 95% CI) | Subtotals only | |
| 3.1 medium term | 1 | 62 | Risk Ratio (M‐H, Random, 95% CI) | 0.63 [0.11, 3.48] |
| 4 Adverse events: 1. Continuous outcomes (skew) Show forest plot | Other data | No numeric data | ||
| 4.1 Change in BMI ‐ short term (skew) | Other data | No numeric data | ||
| 4.2 Change in BMI ‐ medium term (skew) | Other data | No numeric data | ||
| 4.3 Change in BMI ‐ long term (skew) | Other data | No numeric data | ||
| 4.4 Prolactin endpoint levels (ng/mL) ‐ short term (skew) | Other data | No numeric data | ||
| 4.5 Prolactin endpoint levels (ng/mL) ‐ medium term (skew) | Other data | No numeric data | ||
| 4.6 Prolactin endpoint levels (ng/mL) ‐ long term (skew) | Other data | No numeric data | ||
| 5 Adverse events: 2. Sexual experiencesm, total endpoint (ASEX, high score = worse) Show forest plot | 1 | Mean Difference (IV, Fixed, 95% CI) | Subtotals only | |
| 5.1 short term | 1 | 44 | Mean Difference (IV, Fixed, 95% CI) | 1.70 [‐1.26, 4.66] |
| 5.2 medium term | 1 | 41 | Mean Difference (IV, Fixed, 95% CI) | 1.30 [‐2.30, 4.90] |
| 5.3 long term | 1 | 40 | Mean Difference (IV, Fixed, 95% CI) | ‐0.10 [‐4.08, 3.88] |