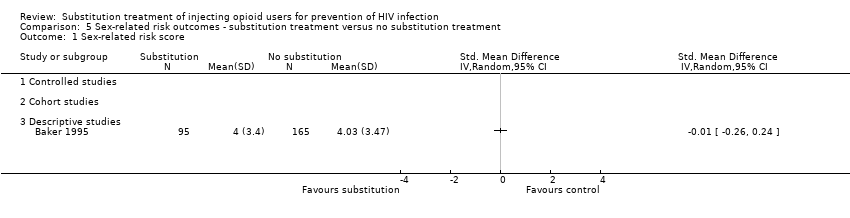
| 1 Sex‐related risk score Show forest plot | 1 | | Std. Mean Difference (IV, Random, 95% CI) | Totals not selected |
|
| 1.1 Controlled studies | 0 | | Std. Mean Difference (IV, Random, 95% CI) | 0.0 [0.0, 0.0] |
| 1.2 Cohort studies | 0 | | Std. Mean Difference (IV, Random, 95% CI) | 0.0 [0.0, 0.0] |
| 1.3 Descriptive studies | 1 | | Std. Mean Difference (IV, Random, 95% CI) | 0.0 [0.0, 0.0] |
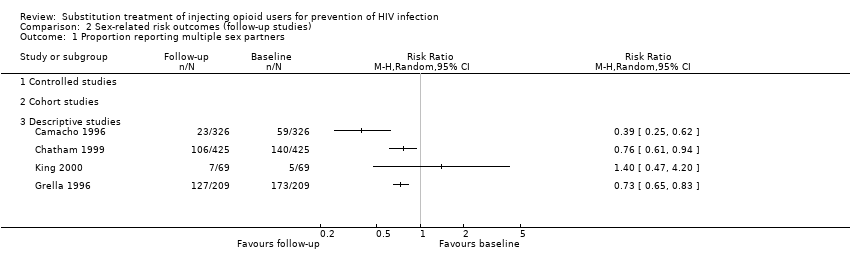
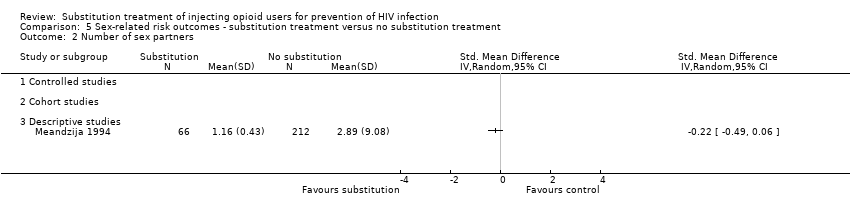
| 2 Number of sex partners Show forest plot | 1 | | Std. Mean Difference (IV, Random, 95% CI) | Totals not selected |
|
| 2.1 Controlled studies | 0 | | Std. Mean Difference (IV, Random, 95% CI) | 0.0 [0.0, 0.0] |
| 2.2 Cohort studies | 0 | | Std. Mean Difference (IV, Random, 95% CI) | 0.0 [0.0, 0.0] |
| 2.3 Descriptive studies | 1 | | Std. Mean Difference (IV, Random, 95% CI) | 0.0 [0.0, 0.0] |
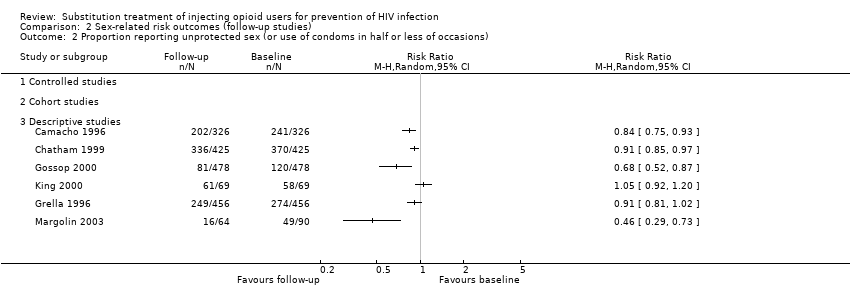
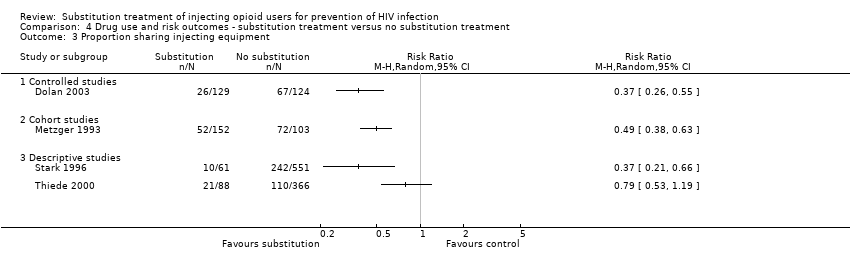
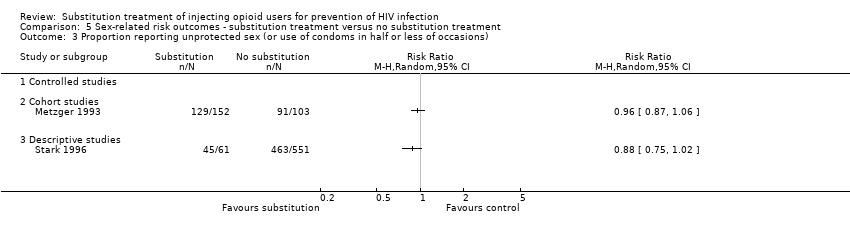
| 3 Proportion reporting unprotected sex (or use of condoms in half or less of occasions) Show forest plot | 2 | | Risk Ratio (M‐H, Random, 95% CI) | Totals not selected |
|
| 3.1 Controlled studies | 0 | | Risk Ratio (M‐H, Random, 95% CI) | 0.0 [0.0, 0.0] |
| 3.2 Cohort studies | 1 | | Risk Ratio (M‐H, Random, 95% CI) | 0.0 [0.0, 0.0] |
| 3.3 Descriptive studies | 1 | | Risk Ratio (M‐H, Random, 95% CI) | 0.0 [0.0, 0.0] |
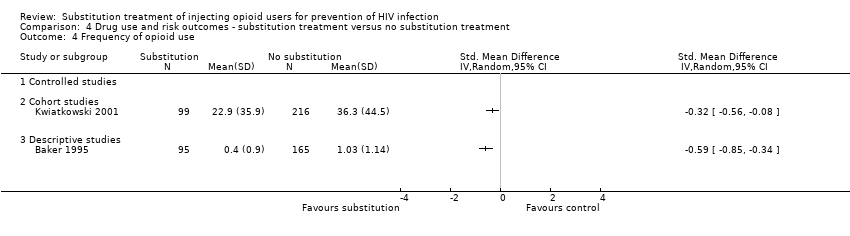
| 4 Frequency of condom use Show forest plot | 1 | | Std. Mean Difference (IV, Random, 95% CI) | Totals not selected |
|
| 4.1 Controlled studies | 0 | | Std. Mean Difference (IV, Random, 95% CI) | 0.0 [0.0, 0.0] |
| 4.2 Cohort studies | 0 | | Std. Mean Difference (IV, Random, 95% CI) | 0.0 [0.0, 0.0] |
| 4.3 Descriptive studies | 1 | | Std. Mean Difference (IV, Random, 95% CI) | 0.0 [0.0, 0.0] |
| 5 Proportion reporting exchanges of sex for drugs or money Show forest plot | 1 | | Risk Ratio (M‐H, Random, 95% CI) | Totals not selected |
|
| 5.1 Controlled studies | 0 | | Risk Ratio (M‐H, Random, 95% CI) | 0.0 [0.0, 0.0] |
| 5.2 Cohort studies | 1 | | Risk Ratio (M‐H, Random, 95% CI) | 0.0 [0.0, 0.0] |
| 5.3 Descriptive studies | 0 | | Risk Ratio (M‐H, Random, 95% CI) | 0.0 [0.0, 0.0] |
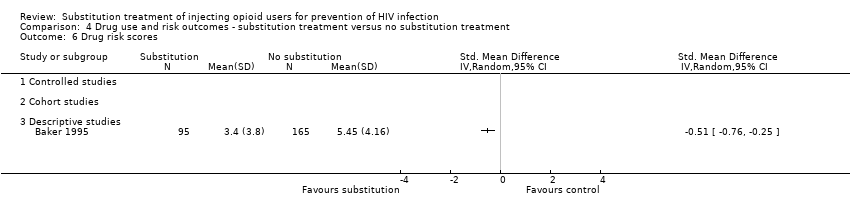
| 6 Frequency of exchanges of sex for drugs or money Show forest plot | 1 | | Std. Mean Difference (IV, Random, 95% CI) | Totals not selected |
|
| 6.1 Controlled studies | 0 | | Std. Mean Difference (IV, Random, 95% CI) | 0.0 [0.0, 0.0] |
| 6.2 Cohort studies | 0 | | Std. Mean Difference (IV, Random, 95% CI) | 0.0 [0.0, 0.0] |
| 6.3 Descriptive studies | 1 | | Std. Mean Difference (IV, Random, 95% CI) | 0.0 [0.0, 0.0] |