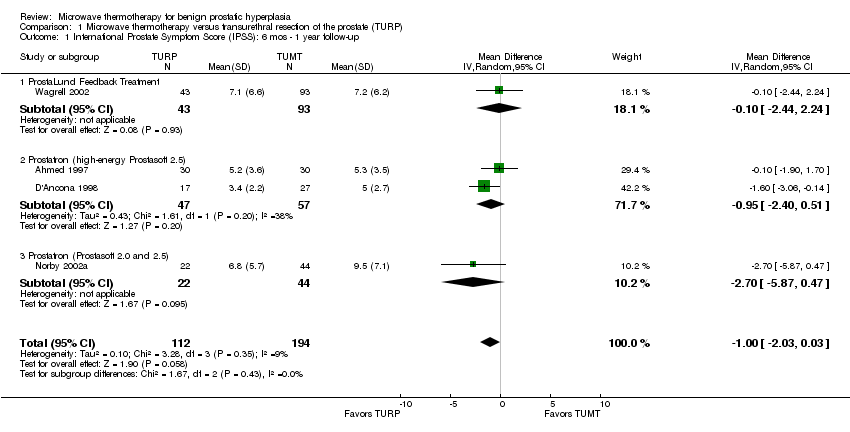
| 1 International Prostate Symptom Score (IPSS): 6 mos ‐ 1 year follow‐up Show forest plot | 4 | 306 | Mean Difference (IV, Random, 95% CI) | 1.00 [‐2.03, 0.03] |
|
| 1.1 ProstaLund Feedback Treatment | 1 | 136 | Mean Difference (IV, Random, 95% CI) | ‐0.10 [‐2.44, 2.24] |
| 1.2 Prostatron (high‐energy Prostasoft 2.5) | 2 | 104 | Mean Difference (IV, Random, 95% CI) | ‐0.95 [‐2.40, 0.51] |
| 1.3 Prostatron (Prostasoft 2.0 and 2.5) | 1 | 66 | Mean Difference (IV, Random, 95% CI) | ‐2.7 [‐5.87, 0.47] |
| 2 Madsen‐Iversen Symptom Score (range 0 to 27): 6 mos ‐ 1 year follow‐up Show forest plot | 2 | 108 | Mean Difference (IV, Fixed, 95% CI) | 1.59 [0.69, 2.48] |
|
| 2.1 Prostatron (high‐energy Prostasoft 2.5) | 1 | 44 | Mean Difference (IV, Fixed, 95% CI) | 1.5 [‐1.07, 4.07] |
| 2.2 Prostatron (low‐energy Prostasoft 2.0) | 1 | 64 | Mean Difference (IV, Fixed, 95% CI) | 1.6 [0.64, 2.56] |
| 3 50% Improvement in AUA Symptom Score: # subjects Show forest plot | 2 | 121 | Risk Ratio (M‐H, Random, 95% CI) | 0.74 [0.50, 1.09] |
|
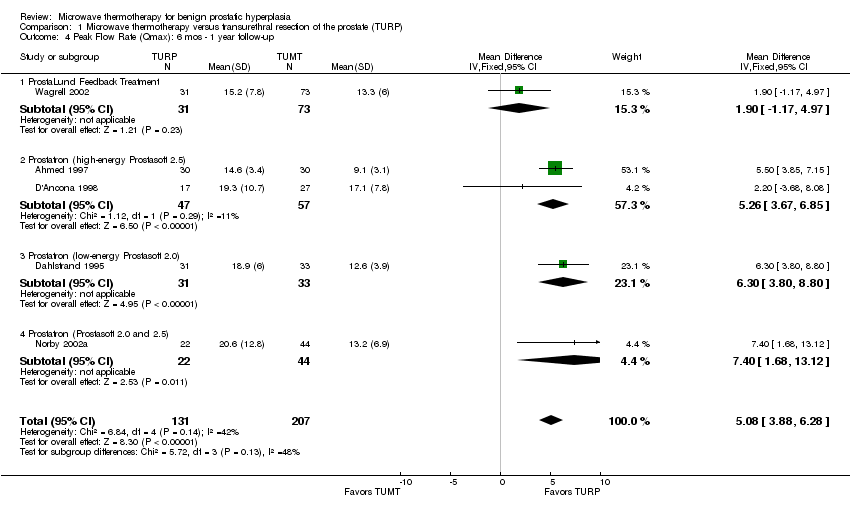
| 4 Peak Flow Rate (Qmax): 6 mos ‐ 1 year follow‐up Show forest plot | 5 | 338 | Mean Difference (IV, Fixed, 95% CI) | 5.08 [3.88, 6.28] |
|
| 4.1 ProstaLund Feedback Treatment | 1 | 104 | Mean Difference (IV, Fixed, 95% CI) | 1.90 [‐1.17, 4.97] |
| 4.2 Prostatron (high‐energy Prostasoft 2.5) | 2 | 104 | Mean Difference (IV, Fixed, 95% CI) | 5.26 [3.67, 6.85] |
| 4.3 Prostatron (low‐energy Prostasoft 2.0) | 1 | 64 | Mean Difference (IV, Fixed, 95% CI) | 6.30 [3.80, 8.80] |
| 4.4 Prostatron (Prostasoft 2.0 and 2.5) | 1 | 66 | Mean Difference (IV, Fixed, 95% CI) | 7.40 [1.68, 13.12] |
| 5 Hematuria (requiring additional treatment/judged to be serious) Show forest plot | 3 | 258 | Risk Difference (M‐H, Random, 95% CI) | ‐0.05 [‐0.15, 0.05] |
|
| 6 Urinary retention Show forest plot | 4 | 343 | Risk Ratio (M‐H, Fixed, 95% CI) | 2.94 [1.52, 5.70] |
|
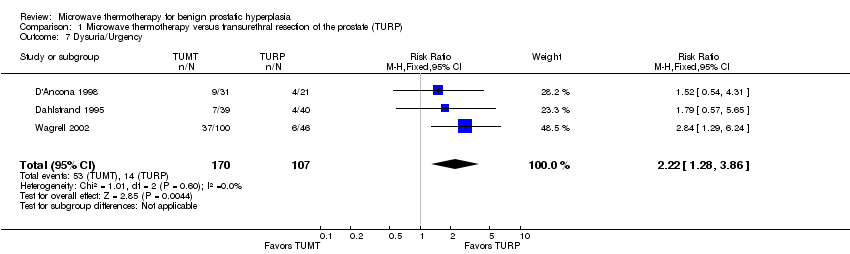
| 7 Dysuria/Urgency Show forest plot | 3 | 277 | Risk Ratio (M‐H, Fixed, 95% CI) | 2.22 [1.28, 3.86] |
|
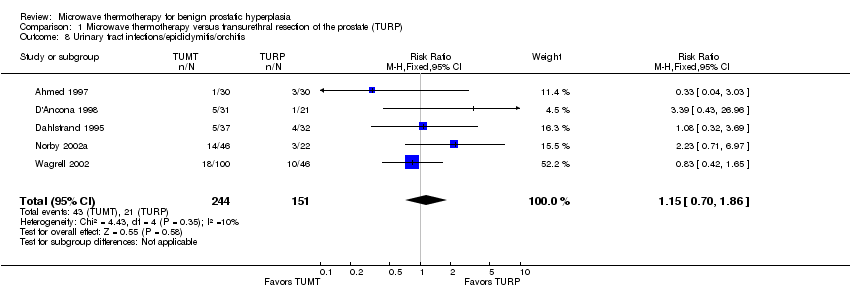
| 8 Urinary tract infections/epididymitis/orchitis Show forest plot | 5 | 395 | Risk Ratio (M‐H, Fixed, 95% CI) | 1.15 [0.70, 1.86] |
|
| 9 Retrograde ejaculation (sexually active men only) Show forest plot | 2 | 78 | Risk Difference (M‐H, Fixed, 95% CI) | ‐0.34 [‐0.55, ‐0.13] |
|
| 10 Erectile dysfunction Show forest plot | 3 | 212 | Risk Ratio (M‐H, Fixed, 95% CI) | 0.41 [0.16, 1.05] |
|
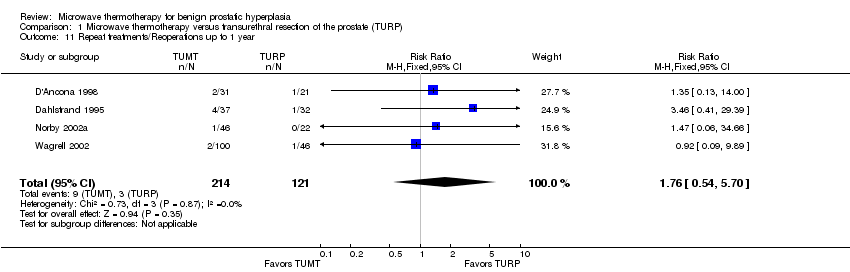
| 11 Repeat treatments/Reoperations up to 1 year Show forest plot | 4 | 335 | Risk Ratio (M‐H, Fixed, 95% CI) | 1.76 [0.54, 5.70] |
|
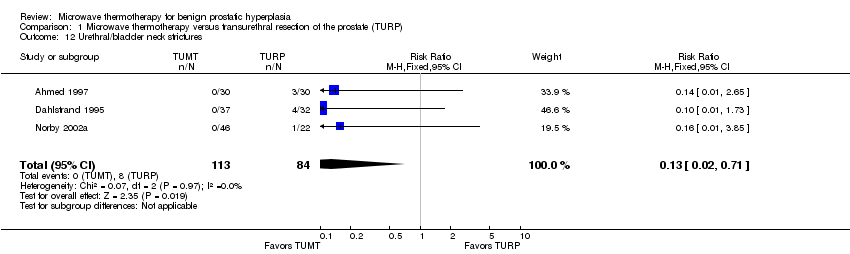
| 12 Urethral/bladder neck strictures Show forest plot | 3 | 197 | Risk Ratio (M‐H, Fixed, 95% CI) | 0.13 [0.02, 0.71] |
|
| 13 Transfusions Show forest plot | 2 | 128 | Risk Difference (M‐H, Fixed, 95% CI) | ‐0.11 [‐0.21, ‐0.02] |
|
| 14 Clot retention Show forest plot | 3 | 283 | Risk Ratio (M‐H, Fixed, 95% CI) | 0.27 [0.06, 1.31] |
|
| 15 TURP Syndrome Show forest plot | 3 | 274 | Risk Difference (M‐H, Fixed, 95% CI) | ‐0.05 [‐0.11, ‐0.00] |
|