Hipotermia para la neuroprotección en adultos después de la reanimación cardiopulmonar
Resumen
Antecedentes
Un buen resultado neurológico después de un paro cardíaco es difícil de lograr. Las intervenciones durante la fase de reanimación y el tratamiento en las primeras horas después del evento son críticas. La evidencia experimental sugiere que la hipotermia terapéutica es beneficiosa, y se han publicado varios estudios clínicos sobre este tema. Esta revisión se publicó originalmente en 2009; las versiones actualizadas se publicaron en 2012 y 2016.
Objetivos
El objetivo era realizar una revisión sistemática y un metaanálisis para evaluar la influencia de la hipotermia terapéutica después de un paro cardíaco en el resultado neurológico, la supervivencia y los eventos adversos.
Métodos de búsqueda
Se hicieron búsquedas en las siguientes bases de datos: Registro Cochrane Central de Ensayos Controlados (Cochrane Central Register of Controlled Trials) (CENTRAL; 2014, número 10); MEDLINE (1971 hasta mayo 2015); EMBASE (1987 hasta mayo 2015); el Cumulative Index to Nursing and Allied Health Literature (CINAHL) (1988 hasta mayo 2015); y BIOSIS (1989 hasta mayo 2015). Se estableció contacto con expertos en el tema para solicitar información sobre ensayos en curso, no publicados o publicados sobre este tema. La búsqueda original se realizó en enero de 2007.
Criterios de selección
Se incluyeron todos los ensayos controlados aleatorizados (ECA) realizados para evaluar la efectividad de la hipotermia terapéutica en los participantes después de un paro cardíaco, sin restricciones de idioma. Se restringieron los estudios a poblaciones adultas enfriadas por cualquier método de enfriamiento, aplicado dentro de las seis horas del paro cardíaco.
Obtención y análisis de los datos
Se introdujeron en una base de datos medidas de validez, intervenciones, resultados y variables de referencia adicionales. El metaanálisis se realizó sólo para un subconjunto de estudios comparables con una heterogeneidad insignificante. Se evaluó la calidad de la evidencia utilizando procedimientos metodológicos estándar, tal como esperaba Cochrane, y se incorporó el enfoque GRADE (Grados de Recomendación, Valoración, Desarrollo y Evaluación).
Resultados principales
Se encontraron seis ECA (1412 participantes en total) realizados para evaluar los efectos de la hipotermia terapéutica ‐ cinco sobre el resultado neurológico y la supervivencia, uno sólo sobre el resultado neurológico. La calidad de los estudios incluidos fue en general moderada, y el riesgo de sesgo fue bajo en tres de los seis estudios. Cuando se compararon los métodos de enfriamiento convencional versus ningún enfriamiento (cuatro ensayos; 437 participantes), se encontró que los participantes del grupo de enfriamiento convencional tenían más probabilidades de alcanzar un resultado neurológico favorable (riesgo relativo (RR) 1,94; intervalo de confianza (IC) del 95%: 1,18 a 3,21). La calidad de la evidencia fue moderada.
En todos los estudios que utilizaron métodos de enfriamiento convencionales en lugar de ningún enfriamiento (tres estudios; 383 participantes), se encontró un beneficio de supervivencia del 30% (RR 1,32; IC del 95%: 1,10 a 1,65). La calidad de la evidencia fue moderada.
En todos los estudios, la incidencia de neumonía (RR 1,15; IC del 95%: 1,02 a 1,30; dos ensayos; 1.205 participantes) y de hipopotasemia (RR 1,38; IC del 95%: 1,03 a 1,84; dos ensayos; 975 participantes) aumentó ligeramente entre los participantes que recibían hipotermia terapéutica, y no se observaron diferencias significativas en los eventos adversos informados entre la hipotermia y los grupos de control. En general, la calidad de la evidencia fue de moderada (neumonía) a baja (hipopotasemia).
Conclusiones de los autores
La evidencia de calidad moderada sugiere que los métodos de enfriamiento convencionales proporcionados para inducir una hipotermia terapéutica leve mejoran el resultado neurológico después de un paro cardíaco, concretamente con mejores resultados que los que se producen sin control de la temperatura. Se obtuvo evidencia disponible de estudios en los que la temperatura objetivo era de 34°C o menos. Esto es coherente con las mejores prácticas médicas actuales, tal como lo recomiendan las guías internacionales de reanimación para el manejo de la hipotermia/temperatura dirigida entre los sobrevivientes de un paro cardíaco. No se encontró evidencia suficiente para demostrar los efectos de la hipotermia terapéutica en participantes con paro cardíaco intrahospitalario, asistolia o causas no cardíacas de paro.
PICO
Resumen en términos sencillos
Enfriar el cuerpo después de la reanimación tras un paro cardíaco
Pregunta de la revisión
En esta revisión, los autores se preguntaron si las personas resucitadas de un paro cardíaco se benefician cuando sus cuerpos se enfrían a una temperatura de 34°C o inferior.
Antecedentes
Población y resultados
Alrededor del 30% al 50% de todos los pacientes con enfermedades coronarias sufren muerte cardiaca repentina en alguna etapa de su enfermedad. La muerte cardíaca súbita significa que se detiene el corazón y posteriormente la circulación. Si estas personas no son resucitadas, las células cerebrales empiezan a sufrir daños irreversibles, y posteriormente la persona muere. Después de la reanimación, el tratamiento en las primeras horas es fundamental para evitar o limitar el daño cerebral. Una forma de tratamiento que puede ayudar a prevenir el daño celular consiste en enfriar el cuerpo durante varias horas después de una reanimación exitosa a 34°C o menos.
Intervención
Se comparó las personas a las que se les enfrió el cuerpo hasta 32°C a 34°C o menos después de la reanimación con las personas a las que no se les enfrió después de una resucitación exitosa.
Fecha de la búsqueda
La evidencia está actualizada hasta mayo 2015.
Características de los estudios
Se incluyeron en el análisis seis estudios (1412 personas en total), cuatro de los cuales (437 personas) examinaron los efectos del enfriamiento del cuerpo por métodos convencionales después de una reanimación exitosa por un paro cardíaco. Un estudio que utilizó la hemofiltración (enfriamiento externo de la sangre, similar a la diálisis) como método de enfriamiento y un estudio en el que se comparó el enfriamiento a 33ºC con el manejo de la temperatura a 36ºC se trataron por separado en la revisión.
Fuentes de financiación de los estudios
El estudio que utilizó la refrigeración externa fue apoyado por una empresa relacionada con la diálisis. De los cinco estudios incluidos en el análisis principal, dos recibieron financiación del gobierno o de organizaciones sin fines de lucro; tres estudios no proporcionaron información sobre la financiación.
Resultados clave
Cuando se compararon a las personas cuyos cuerpos fueron enfriados a 32°C a 34°C después de la reanimación con aquellos cuyos cuerpos no fueron enfriados en absoluto, se encontró que el 63% de los que recibieron el enfriamiento no sufrirían ningún daño cerebral, o sólo un daño menor, mientras que sólo el 33% de los que no fueron enfriados no sufrirían ningún daño cerebral, o sólo un daño menor. El enfriamiento tuvo un efecto importante en la simple supervivencia, con o sin daño cerebral: El 57% sobreviviría si sus cuerpos se enfriaran, comparado con el 42% si sus cuerpos no se enfriaran en absoluto. No se produjeron efectos secundarios graves, pero el enfriamiento del cuerpo se asoció con un mayor riesgo de neumonía (49% contra 42% de los estudiados) y un mayor riesgo de bajas concentraciones de potasio en la sangre (18% contra 13%).
Calidad de la evidencia
Algunos estudios presentaban deficiencias de calidad, entre ellas un escaso número de participantes y el uso de métodos inadecuados para equilibrar a los participantes entre los grupos de intervención y de control. Sin embargo, cuando se reconocen las diferencias entre los estudios (heterogeneidad), es evidente que esas deficiencias no tuvieron repercusiones importantes en los resultados principales.
Authors' conclusions
Summary of findings
| Neurological outcome, survival and adverse events: conventional cooling compared with no cooling and 36°C for neuroprotection and survival in adults after cardiopulmonary resuscitation | ||||||
| Patient or population: adults after cardiopulmonary resuscitation | ||||||
| Outcomes | Illustrative comparative risks* (95% CI) | Relative effect | Number of participants | Quality of the evidence | Comments | |
| Assumed risk | Corresponding risk | |||||
| No cooling | Cooling 32°C to 34°C | |||||
| Good neurological outcome | Study population | RR 1.94 (1.18 to 3.21) | 437 | ⊕⊕⊕⊝ | ||
| 325 per 1000 | 631 per 1000 | |||||
| Survival | Study population | RR 1.35 | 383 | ⊕⊕⊕⊝ | ||
| 420 per 1000 | 567 per 1000 | |||||
| Adverse events ‐ pneumonia | Study population | RR 1.15 | 1205 | ⊕⊕⊕⊝ | ||
| 423 per 1000 | 486 per 1000 | |||||
| Adverse events ‐ hypokalaemia | Study population | RR 1.38 | 975 | ⊕⊕⊝⊝ | ||
| 134 per 1000 | 185 per 1000 | |||||
| *The basis for the assumed risk (e.g. median control group risk across studies) is provided in footnotes. The corresponding risk (with its 95% confidence interval) is based on assumed risk in the comparison group and relative effect of the intervention (and its 95% CI) GRADE Working Group grades of evidence | ||||||
| aOne quasi‐randomized trial (Bernard 2002) and one abstract (Mori 2000) but both not contributing to most data (see also Effects of interventions ‐ 'Sensitivity analysis') bTotal number of events < 300; imprecision therefore was rated as serious, and this resulted in downgrading of the overall quality of the evidence one level from high to moderate cOne quasi‐randomized trial not contributing to the majority of data (see also Effects of interventions ‐ 'Sensitivity analysis') dIndirectness was caused mostly by control group treatment (Nielsen 2013), which resulted in downgrading of the overall quality of the evidence one level from high to moderate eIndirectness was rated as very serious because of differences in intervention (haemofiltration, conventional cooling) and control group treatments (no cooling, 36°C), which resulted in downgrading of the overall quality of the evidence two levels from high to low fLaurent 2005 had some risk of bias but is not contributing to the majority of data | ||||||
Background
Description of the condition
The incidence of out‐of‐hospital sudden cardiac arrest in industrial countries varies greatly over different study groups and is reported to range between 0.05% and 0.19% per year (Chugh 2004; McNally 2011; Rea 2004). Among all participants for whom resuscitation was attempted, 14% to 40% achieved return of spontaneous circulation and were admitted to hospital (Finn 2001; Fischer 1997; Giraud 1996; Herlitz 2003b; Kuisma 1996; Leung 2001; Rewers 2000). Of patients admitted to hospital, only between 7% and 30% were discharged from hospital with good neurological outcome (Absalom 1999; Böttiger 1999; Fischer 1997; Herlitz 1999; Jennings 2001; McNally 2011; Weston 1997). To improve neurological outcome and survival of patients after cardiac arrest, providers have applied many methods related to post‐resuscitation care. These comprise optimizing haemodynamics and providing ventilation, coronary reperfusion, electrolytes, seizure control, temperature management and glucose control and are summarized in the main resuscitation guidelines (Callaway 2015; Soar 2015).
Description of the intervention
Therapeutic hypothermia (or targeted temperature management/induced hypothermia) is still a relatively new concept for preservation of cerebral function among patients resuscitated from cardiac arrest. After the patient's condition has been stabilized, body temperature is lowered to 32°C to 34°C for a duration of 24 hours. Conventional cooling comprises surface cooling methods requiring cooling pads, ice packs, water immersion or intravascular cooling with cooling catheters or simply cold fluids. Cooling can be combined with haemofiltration or extracorporeal cardiopulmonary support.
How the intervention might work
Therapeutic hypothermia is believed to work in many ways. Cerebral reperfusion after successful resuscitation, although essential and effective in restoring energy stores, can trigger harmful chemical cascades. Generation of free radicals and other mediators, which leads to multi‐focal damage to the brain, was first described by Negovsky as "post‐resuscitation syndrome" (Negovsky 1988). In contrast to accidental hypothermia, therapeutic mild hypothermia (32°C to 34°C) is administered in a controlled way. Intra‐ischaemic hypothermia for brain protection has been provided for several years with certain surgical procedures and circulatory arrest states. Clinical and experimental results show protective effects of hypothermia during and after ischaemic situations (Rosomoff 1954). Therapeutic hypothermia can inhibit the biosynthesis, release and uptake of several catecholamines and neurotransmitters (Okuda 1986; Sun 2010; Szelenyi 2012), especially glutamate and dopamine, thus preventing potential tissue damage (D'Cruz 2002; Hachimi‐Idrissi 2004). Other beneficial effects of hypothermia include preservation of the blood‐brain barrier (Baumann 2009; Karibe 1994); protection of adenosine triphosphate (ATP) stores (McCullough 1999; Mizuhara 1996) necessary for energy provision; restitution of post‐ischaemic cerebral microcirculation (Takasu 1996); and possibly decreased intracranial pressure (Lee 2010; Schreckinger 2009). Subsequently, hypothermia seems to act in a multi‐factorial way by influencing several damaging pathways simultaneously (Holzer 2010) to reduce cell death within the brain.
Why it is important to do this review
The first Cochrane review (Arrich 2009) was conducted to examine the emergence of mild therapeutic hypothermia as part of routine care for survivors of cardiac arrest. Two randomized controlled trials (RCTs) had shown that induced hypothermia has a neuroprotective effect in patients primarily resuscitated from cardiac arrest (Bernard 2002; HACA 2002), and therapeutic hypothermia was recommended in the guidelines of the International Liaison Committee on Resuscitation (ILCOR) (Nolan 2003) and in other resuscitation guidelines of that time (Deakin 2010; Peberdy 2010). It is recommended as "targeted temperature management (induced hypothermia)" in the current resuscitation guidelines (Callaway 2015; Soar 2015). Therapeutic hypothermia remains a relatively new concept. Studies examining different treatment modalities are emerging; therefore systematic and regular updates of the literature are important for monitoring new and effective developments. A recent publication following a large RCT on two different cooling levels described no differences between the two treatment regimens (Nielsen 2013). We present the second update of the original Cochrane review (Arrich 2009; Arrich 2012), which incorporates up‐to‐date evidence.
Objectives
We aimed to perform a systematic review and meta‐analysis to assess the influence of therapeutic hypothermia after cardiac arrest on neurological outcome, survival and adverse events.
Methods
Criteria for considering studies for this review
Types of studies
We included randomized and 'quasi‐randomized' controlled trials. 'Quasi‐randomized' refers to allocation procedures such as alternating days, odd and even days and the like.
Types of participants
We included studies in adult participants who suffered from cardiac arrest (regardless of whether in‐hospital or out‐of‐hospital cardiac arrest) and were successfully resuscitated.
We excluded studies of children and adolescents (younger than 18 years), as presumed causes of cardiac arrest are different from causes in adults.
Although participants with a prior neurological history may not greatly benefit from the intervention, we did not exclude them for the following reasons.
-
The number of such participants is most likely negligible.
-
In a real‐life situation, information on neurological performance before cardiac arrest often is not available when post‐resuscitation therapy is initiated
Types of interventions
The intervention of interest was therapeutic hypothermia ‐ regardless of how body temperature was reduced ‐ applied within six hours of arrival at hospital. We defined 'therapeutic' as any target body temperature of 34°C or lower. We defined the 'control' intervention as standard treatment (at the time of the trial) provided after cardiac arrest.
Types of outcome measures
Primary outcomes
The primary outcome measure was neurological recovery. We expected the ideal outcome to be reported as best neurological outcome during hospital stay and in cerebral performance categories (CPCs) (Stiell 2009). CPC categories are defined as follows.
-
Good cerebral performance: conscious, alert, capable of normal life. Normal cerebral function. May have minor psychological or neurological deficits that do not significantly compromise cerebral or physical function.
-
Moderate cerebral disability: conscious, alert, sufficient cerebral function for activities of daily life (e.g. dress, travel by public transportation, food preparation). May have hemiplegia, seizures, ataxia, dysarthria, dysphasia or permanent memory or mental changes.
-
Severe cerebral disability: conscious, with at least limited cognition. Dependent on others for daily life support (i.e. institutionalised or at home with exceptional family effort) because of impaired brain function. Includes individuals with wide range of cerebral abnormalities, from ambulatory participants with severe memory disturbance or dementia precluding independent existence to paralysed participants who can communicate only with their eyes (e.g. the locked‐in syndrome).
-
Coma or vegetative state: not conscious, unaware of surroundings, no cognition. No verbal or psychological interaction with environment. May appear awake because of spontaneous eye opening or sleep‐wake cycle. Includes individuals showing all degrees of unresponsiveness that are neither CPC three (conscious) nor CPC five (coma, which satisfies brain death criteria).
-
Certified brain death.
If study authors grouped the primary outcome into one or two (good recovery) and three to five (unfavourable recovery), we adapted it for our meta‐analysis. If the primary outcome was not reported in CPC categories, we accepted reports of 'good' neurological outcome, and we assumed that this was comparable with a CPC score of one or two.
Secondary outcomes
-
Survival to hospital discharge at six months and long term.
-
Quality of life at six months and long term.
-
Dependency.
-
Cost‐effectiveness.
We defined 'long term' as a minimum of one year.
Adverse events
We aimed to report adverse events as described by study authors.
Search methods for identification of studies
Electronic searches
We searched the following databases: the Cochrane Central Register of Controlled Trials (CENTRAL; 2014, Issue 9); MEDLINE (1971 to May 2015); EMBASE (1987 to May 2015); the Cumulative Index to Nuring and Allied Health Literature (CINAHL) (1988 to May 2015); and BIOSIS (1989 to May 2015). Original searches were performed in January 2007 (Arrich 2009) and were updated in July 2011 (Arrich 2012) .
We performed searches by entering search terms as multiple postings (.mp, term appears in the title, abstract or medical subject heading (MeSH)) and some as medical subject headings (MeSH) for MEDLINE and exploded terms for EMBASE and CINAHL (search terms for CENTRAL, Appendix 1; MEDLINE, Appendix 2; EMBASE, Appendix 3; CINAHL, Appendix 4; BIOSIS, Appendix 5). We used a search strategy for identifying RCTs with MEDLINE, CINAHL and EMBASE (Higgins 2011), and we applied no language restrictions. We searched three trials registers as well: EudraCT; ClinicalTrials.gov; International Clinical Trials Registry Platform.
Searching other resources
In an attempt to identify additional studies, we asked experts in the field whether they were aware of any ongoing, unpublished or published trials on this topic.
Data collection and analysis
Selection of studies
We imported all retrieved results into EndNote (version X5; Thomson Corporation, Stamford, CT, USA) and eliminated duplicates. Two review authors (JA, MH or CH; HH as arbiter in case of discrepancies) independently scanned each reference for inclusion in the review.
Data extraction and management
We independently extracted data using a data extraction form (see Appendix 6). As we intended to use the original individual patient data (IPD) provided by identified trials, we contacted the respective corresponding authors and asked for collaboration. Two review authors independently entered all relevant data into the Cochrane software program Review Manager (RevMan 5.3). We compared the two versions and resolved disagreements by discussion.
We entered the following variables into RevMan 5.3.
-
Study characteristics.
-
Data on outcomes.
-
Items on risk of bias.
-
Within‐study subgroup effect estimates as calculated from IPD outside RevMan.
Assessment of risk of bias in included studies
To assess the internal validity of identified trials, we assessed allocation sequence generation, allocation concealment, blinding of outcome assessment, exclusion of randomized participants from the analysis, comparability of groups, loss to follow‐up and other potential sources of bias. However, blinding of treating personnel regarding application of therapeutic hypothermia was considered almost impossible.
Measures of treatment effect
We calculated risk ratios (RRs) and their 95% confidence intervals (CIs).
Unit of analysis issues
We did not include cluster‐randomized trials in the analysis; in the case of multiple treatment groups, we planned to combine groups to create a single comparison; by nature of the condition and outcomes, we identified no cross‐over trials.
Dealing with missing data
All analyses were performed according to the intention‐to‐treat (ITT) principle. If data were missing, we attempted to obtain the information by contacting study authors. We included assessment of loss to follow‐up in our quality assessment and reported this in the table Characteristics of included studies. If a considerable quantity of data was missing, we would investigate the possible mechanism of the missing data (whether random or not). We planned to perform a sensitivity analysis to assess the influence of this possible selection bias on our estimates.
Assessment of heterogeneity
We assessed data for clinical and statistical heterogeneity. We performed quantitative synthesis of data only if clinical heterogeneity was negligible. Clinical heterogeneity may be caused by differences in study populations, interventions and controls, or by variable definitions of the endpoint (Thompson 2001). Pooling of data may not be suitable in cases of severe heterogeneity.
Assessment of reporting biases
We assessed the presence of possible publication bias and heterogeneity by using funnel plots (plotting effect vs precision) (Egger 1997) and planned to present this information if we identified more than10 studies.
Data synthesis
Quantitative analysis of IPD was intended when studies showed negligible heterogeneity and IPD were available at least for a clinically uniform subset. In the case that IPD were not available for at least one study, we planned to perform an analysis at the study level, particularly when we encountered updates. We planned to perform a quantitative synthesis of IPD by using standard statistical procedures provided in RevMan 5.3. The principal summary effect estimate was the risk ratio with a 95% confidence interval.
In the case of negligible heterogeneity, we used a fixed‐effect model to calculate summary effects; otherwise we used random‐effects models. We assessed statistical heterogeneity by using the I2 statistic (Higgins 2003) and considered statistical heterogeneity relevant with I2 statistic > 50%.
Subgroup analysis and investigation of heterogeneity
For the primary endpoint and for survival, we performed subgroup analyses at the study level.
-
Treatment of the control group: no cooling versus temperature management. These ancillary analyses were introduced at the current update following consideration of differences in control group treatment described in a newly included study (Nielsen 2013). We used the standard test for subgroup differences to assess differences in effects between study level subgroups.
When data became available, we performed subgroup analyses for the primary outcome using IPD. We used the following variables.
-
Cause of cardiac arrest (presumed cardiac vs non‐cardiac).
-
Location of arrest (in‐hospital vs out‐of‐hospital).
-
Witnessed versus non‐witnessed arrest.
-
Primary electrocardiography (ECG) rhythm (ventricular fibrillation vs other).
We received IPD (Bernard 2002; HACA 2002; Hachimi‐Idrissi 2001) via spreadsheets including participant‐specific information on interventions, outcomes and subgroup properties. We calculated subgroup‐specific effect estimates across included studies at the individual patient level but performed no tests to examine subgroup differences.
Sensitivity analysis
We performed sensitivity analyses to examine the impact of study quality issues, as measured by allocation concealment, on overall effect estimates and on effect sizes of all identified trials without consideration of heterogeneity and publication status. To investigate whether model choice might influence our results, we compared estimates derived from random‐effects models versus those obtained from fixed‐effect models.
Summary of findings
We used the GRADE (Grades of Recommendation, Assessment, Development and Evaluation) approach to interpret findings (Langendam 2013). The GRADE profiler (GRADEPRO) allowed us to import data from Review Manager (RevMan 5.3) to create a 'Summary of findings' table. This table provides outcome‐specific information concerning overall quality of evidence gathered from studies included in the comparison, magnitude of effects of the interventions examined and the sum of available data on outcomes considered.
We included the following outcomes in a 'Summary of findings' table.
-
Neurological outcome, survival (conventional cooling vs no cooling) and adverse events (vs no cooling and 36°C).
Results
Description of studies
Results of the search
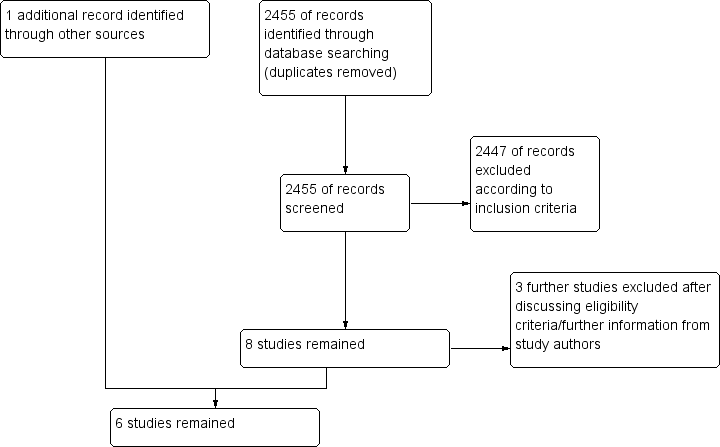
Our original and updated searches (from 2007 to May 2015) resulted in 2425 hits (duplicates excluded). From these, we excluded 2417 according to our eligibility criteria (randomized studies on adult participants with cardiac arrest treated with therapeutic hypothermia) by judging the abstract or the title. Eight papers remained for closer inspection. Of those, we excluded three after further evaluation (see Characteristics of excluded studies; and Figure 1). Upon looking through the references of a systematic review on therapeutic hypothermia (Cheung 2006), we found one additional reference, published only as an abstract (Mori 2000). Hence overall, six randomized and quasi‐randomized controlled trials with a total of 1412 participants remained for analysis (Bernard 2002; HACA 2002; Hachimi‐Idrissi 2001; Laurent 2005; Mori 2000; Nielsen 2013) (see Characteristics of included studies).

Study flow diagram.
The decision on inclusion of one study was not unequivocal (Nielsen 2013) because control group participants in the study by Nielsen et al received active temperature management at 36°C, which is clearly different from 'no temperature management'. It is a matter of concern whether temperature control at 36°C can be seen as 'standard therapy', as we outlined in our inclusion criteria for the control group. We decided to include the study in our review while treating it as a separate subgroup for the main analysis. However, in an additional ancillary analysis, we calculated a pooled overall estimate to inform the current controversial discussion.
We found that one previously unclassified study (Tiainen 2007) and two additional studies (Tiainen 2003; Tiainen 2005) were reports of the HACA 2002 study.
Included studies
We included six studies (Bernard 2002; HACA 2002; Hachimi‐Idrissi 2001; Laurent 2005; Mori 2000; Nielsen 2013) (see Characteristics of included studies) in this updated review.
The first study (Hachimi‐Idrissi 2001) was a feasibility RCT carried out at one 700‐bed teaching hospital in Brussels during a six month period. It included 33 consecutive participants with out‐of‐hospital cardiac arrest and asystole or pulseless electrical activity (PEA) of presumed cardiac origin who achieved return of spontaneous circulation (ROSC). The mean age of participants was 72, and 39% were female. After admission and stabilization, participants were randomly assigned to (1) a helmet device placed around the head and neck containing a solution of aqueous glycerol, or (2) standard therapy without hypothermia. The target temperature of the intervention group was 34°C, which should be maintained over a period of four hours; this was followed by a passive rewarming phase over eight hours. Outcome parameters were laboratory values and haemodynamics, survival to hospital discharge and overall performance categories (OPCs) and adverse events. No information on funding was provided.
Two studies were published at the same time (Bernard 2002; HACA 2002). The study by Bernard 2002 was a quasi‐RCT carried out by the ambulance service of Melbourne and four adjacent emergency departments and intensive care units over a three‐year period. It included 77 participants with out‐of‐hospital cardiac arrest and ventricular fibrillation as first cardiac rhythm who were comatose after they achieved ROSC. The mean age of participants was 66, and 33% were female. Participants were randomly assigned by the ambulance staff to receive (1) therapeutic hypothermia by ice packs placed around the head, neck, torso and limbs, or (2) standard therapy without hypothermia. The target temperature of the intervention group was 33°C, which should be maintained over a period of 24 hours; this was followed by a passive rewarming phase over eight hours. Outcome parameters were survival with good neurological function; in‐hospital mortality; haemodynamic, biochemical and haematological effects of hypothermia; and adverse events. No information on funding was provided.
HACA 2002 was an RCT carried out by nine centres in five European countries and four adjacent emergency departments and intensive care units over a five‐year period. It included 275 participants with out‐of‐hospital bystander‐witnessed cardiac arrest of presumed cardiac cause, ventricular fibrillation or non‐perfusing ventricular tachycardia as first cardiac rhythm, who were comatose after resuscitation. The mean age of participants was 59, and 24% were female. After admission, participants were randomly assigned to receive (1) therapeutic hypothermia by an external cooling device, or (2) standard therapy without hypothermia. The target temperature of the intervention group was 32°C to 34°C, which should be maintained over a period of 12 hours; this was followed by a passive rewarming phase over 12 hours and, if necessary, active rewarming after 18 hours. Outcome parameters were survival, neurological outcome and adverse events. Funding was provided by grants of the Fourth Research and Technological Development (RTD) Framework Programme 1994 to 1998 of the European Union (Fourth Framework Programme), the Austrian Ministry of Science and Transport and the Austrian Science Foundation (FWF).
Laurent 2005 was an RCT carried out at two intensive care units in Paris over a two‐year period. It included 42 participants with out‐of‐hospital cardiac arrest of presumed cardiac cause, ventricular fibrillation or asystole as first cardiac rhythm, who were comatose after resuscitation. The mean age of participants was 52 to 56 years, and 19% were female. After admission, participants were randomly assigned to receive (1) high‐flow haemofiltration, (2) high‐flow haemofiltration plus therapeutic hypothermia or (3) standard therapy without hypothermia. The target temperature of the intervention group was 32°C to 34°C, which should be maintained over a period of 24 hours; this was followed by a passive rewarming phase over 12 hours. Outcome parameters were survival, neurological outcome and adverse events. For this study, haemofiltration circuits, catheters and replacement fluid concentrates were provided by GAMBRO (GAMBRO).
Mori 2000 was published as an abstract with additional information provided by study authors. It was carried out at a University hospital in Sapporo, Japan, and included 54 participants with out‐of‐hospital cardiac arrest with a Glasgow Coma Scale (GCS) score less than eight after resuscitation. After admission, participants were randomly assigned to receive (1) therapeutic hypothermia by water‐circulating blankets above and below the participant with another ice mounted blanket over the participant, or (2) standard therapy without hypothermia. The target temperature of the intervention group was 32°C to 34°C, which should be maintained over a period of three days. The reported outcome parameter was neurological outcome. Study authors provided no information on funding.
Nielsen 2013, which was published recently, was carried out at 36 intensive care units (ICUs) in Europe and Australia over a three‐year period. It included 950 adults with out‐of‐hospital cardiac arrest of presumed cardiac cause and sustained return of spontaneous circulation who were comatose after resuscitation (GCS < 8). The mean age of participants was 64 years, and 19% were female. After admission, participants were randomly assigned to receive (1) temperature management at 33°C (method of choice was up to the discretion of treating physicians), or (2) temperature management at 36°C (method of choice was up to the discretion of treating physicians). The target temperature of the intervention group was 32°C to 34°C, which should be maintained over a period of 24 hours; this was followed by a rewarming phase over eight hours. Outcome parameters were survival and neurological and functional outcomes. Funding was provided by the Swedish Heart–Lung Foundation and others.
Clinical heterogeneity
We identified clinical heterogeneity due to cooling methods. In contrast to the other studies, Laurent 2005 used haemofiltration as the mode of cooling, which is substantially different from the standard cooling methods used in the other RCTs; therefore, we did not pool data with those from remaining studies. We now successfully contacted Kazuhisa Mori and Eric Dickson, who provided relevant details of their study (Mori 2000). On the basis of cooling methods and clinical characteristics, the remaining four studies appeared appropriate for pooling in the main analysis (Bernard 2002; HACA 2002; Hachimi‐Idrissi 2001; Mori 2000).
Excluded studies
We excluded three studies; one was a substudy to the Nielsen 2013 trial that provided no extra information relevant to our review (CAEP/ACMU 2013), and for two, inclusion criteria for the intervention or control group did not apply (Lopez‐de‐Sa 2012; Takeda 2009) (see Characteristics of excluded studies).
Ongoing studies
We identified no ongoing studies.
Awaiting classification
No studies are awaiting classification.
Risk of bias in included studies
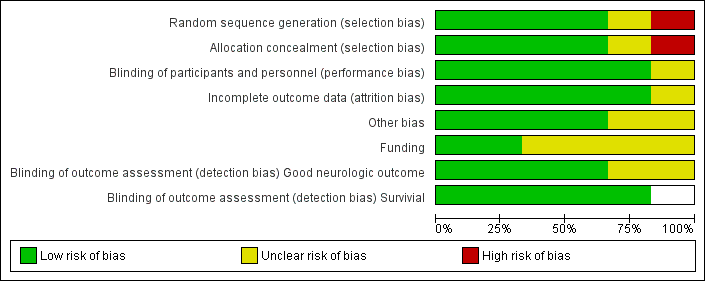
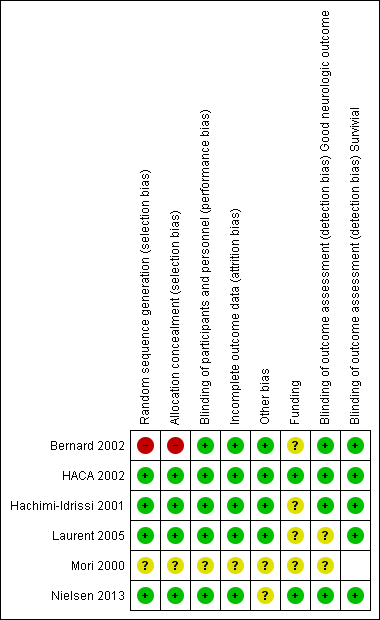
We assessed each included trial by using the following criteria: mode of randomization, allocation concealment, level of blinding, loss to follow‐up, comparability of groups and use of measures to account for differences between groups (see Characteristics of included studies; Figure 2; and Figure 3). Risk of bias in the included studies was generally low, with relevant deficits noted in three out of six studies.

Risk of bias graph: review authors' judgements about each risk of bias item presented as percentages across all included studies.

Risk of bias summary: review authors' judgements about each risk of bias item for each included study.
Except for the abstract (Mori 2000), all studies reported on almost all essential quality criteria, and loss to follow‐up was within an acceptable range. One study showed deficits in the randomization process and adjustments made for inequalities in baseline characteristics between treatment and control groups (Bernard 2002). Follow‐up was generally good in the included studies. In HACA 2002, hypothermia was discontinued in 14 participants because of death, arrhythmia, haemodynamic instability and technical problems with the cooling device;in one case because of liver rupture; in another because a randomly assigned participant had already been included in the study before cooling, and in another case because of an error in the duration of cooling. These participants were included in the intention‐to‐treat analysis of primary and secondary outcomes.
Allocation
Three trials (HACA 2002; Hachimi‐Idrissi 2001; Laurent 2005) reported adequate randomization methods and use of opaque envelopes to conceal treatment allocation.
Blinding
Three trials reported blinded outcome assessment (Bernard 2002; HACA 2002; Hachimi‐Idrissi 2001).
Incomplete outcome data
One study lost information on two participants for the primary endpoint (HACA 2002). All other studies reported complete follow‐up.
Selective reporting
We found no indication of selective outcome reporting.
Other potential sources of bias
In two studies, treatment and control groups did not differ significantly in terms of reported baseline characteristics (Hachimi‐Idrissi 2001; Laurent 2005), although Hachimi‐Idrissi 2001 included rather small groups.
HACA 2002 described baseline differences between groups. Participants in the normothermia group were more likely to have a history of diabetes mellitus or coronary heart disease, and to have received basic life support from a bystander, than were those in the hypothermia group. Study authors adjusted for all baseline variables, and the risk ratio increased slightly, from 1.40 (95% CI 1.08 to 1.81) to 1.47 (95% CI 1.09 to 1.82).
Bernard 2002 reported differences in sex and rate of bystander cardiopulmonary resuscitation between groups but did not adjust for this possible bias.
Mori 2000 provided no information on baseline characteristics of participant groups.
Effects of interventions
Primary outcome
Good neurological outcome
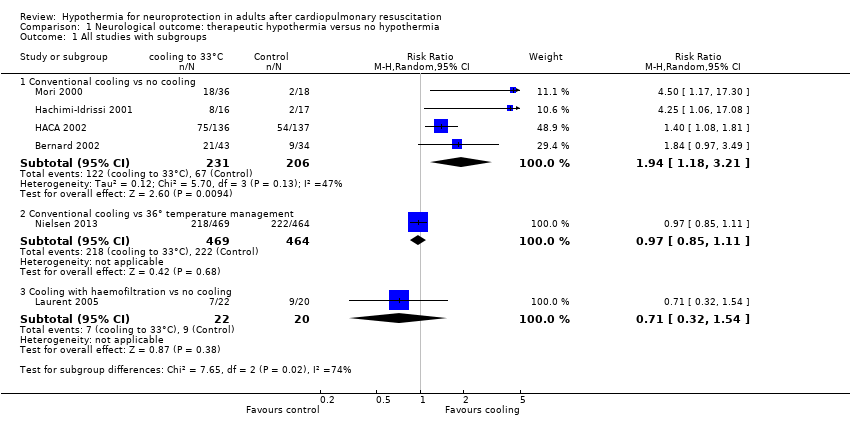
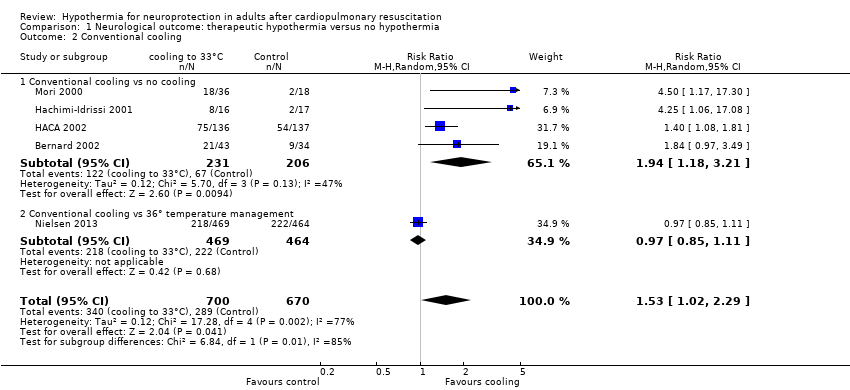
With four studies (Bernard 2002; HACA 2002; Hachimi‐Idrissi 2001; Mori 2000) (437 participants) reporting on conventional cooling methods compared with no cooling, the pooled result showed a better neurological outcome for the conventional cooling group (RR 1.94, 95% CI 1.18 to 3.21; I2 statistic = 47%; see Figure 4; and Data and analyses). The quality of the evidence was moderate. We downgraded the quality of the evidence as the result of imprecision. One study included 42 participants undergoing haemofiltration after cardiac arrest (Laurent 2005); this introduced considerable clinical heterogeneity and prevented pooling with the studies described above. Cooling using haemofiltration did not result in a difference in good neurological outcome (RR 0.71, 95% CI 0.32 to 1.54; see Figure 4). The quality of the evidence was very low. We downgraded the quality of the evidence as the result of risk of bias, imprecision and indirectness. Another study evaluated the effects of conventional cooling versus targeted temperature management at 36°C (Nielsen 2013). Investigators (Nielsen 2013) noted no effects on neurological outcome if therapeutic hypothermia at 33°C was compared with temperature management at 36°C (RR 0.97, 95% CI 0.85 to 1.11; 933 participants; see Figure 4). The quality of the evidence was moderate. We downgraded the quality of the evidence for this single but large RCT as the result of indirectness.
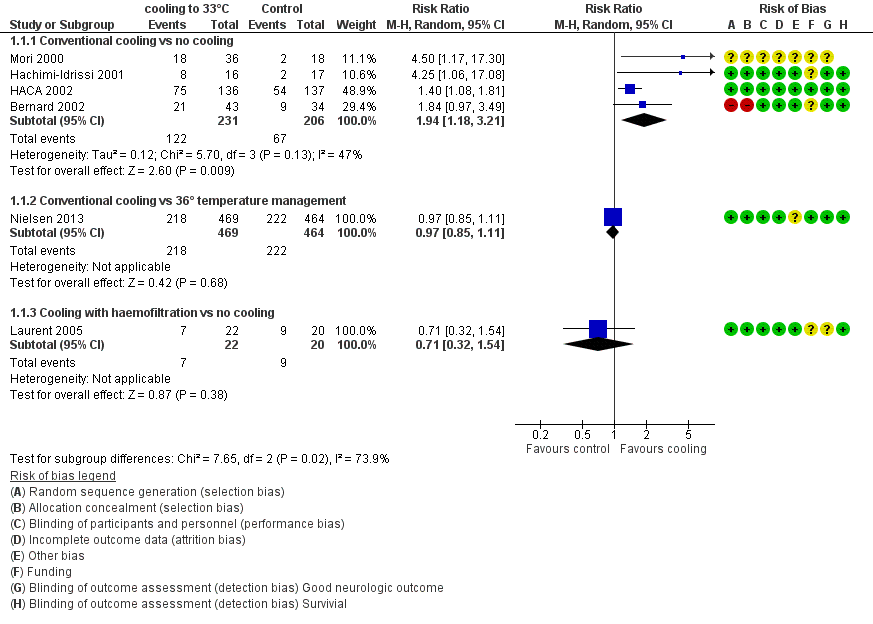
Forest plot of comparison: 1 Neurological outcome: therapeutic hypothermia versus no hypothermia, outcome: 1.1 All studies with subgroups.
When data from all studies that used conventional cooling methods regardless of the control treatment (Bernard 2002; HACA 2002; Hachimi‐Idrissi 2001; Mori 2000; Nielsen 2013) were pooled, cooling to 33°C was still superior to no cooling or temperature management at 36°C (RR 1.53, 95% CI 1.02 to 2.29; P value = 0.04; see Figure 5). However, we found considerable heterogeneity when pooling all of these studies (heterogeneity: tau² = 0.12; Chi² = 17.28; df = 4 (P value = 0.002); I² statistic = 77%), possibly because a different control group treatment was given in one study (Nielsen 2013). The test for subgroup differences according to control group treatment (no cooling vs target temperature at 36°C) was highly positive (Chi² = 6.84; df = 1 (P value = 0.009)). Cautious interpretation of this effect is therefore warranted, but to inform the current discussion, we present the pooled estimate for the primary outcome despite obvious limitations here and restrict the summary of findings to findings with the least ambiguity (summary of findings Table for the main comparison).
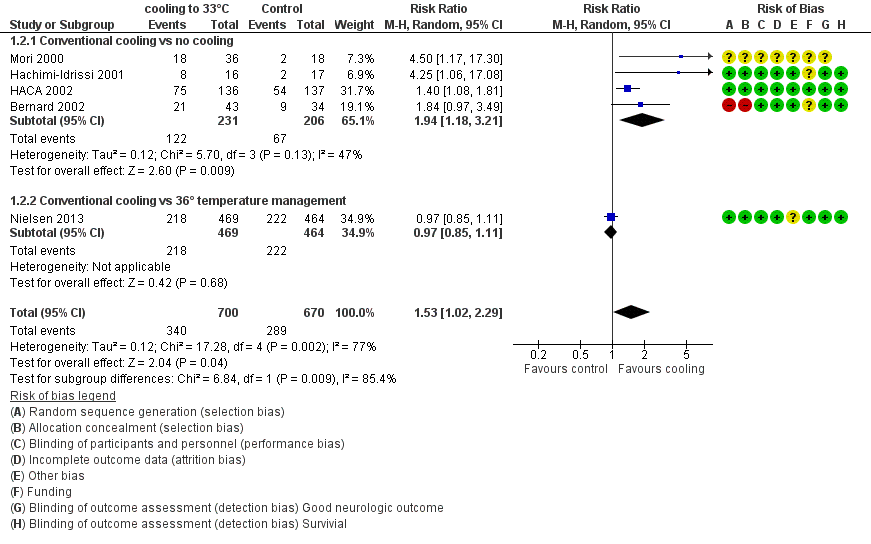
Forest plot of comparison: 1 Neurological outcome: therapeutic hypothermia versus no hypothermia, outcome: 1.2 Conventional cooling.
Subgroup analyses ‐ IPD level
Influence of cardiac arrest conditions
According to the number of participants and information provided by study authors, we formed subgroups of the meta‐analysis by using the following variables: cause of cardiac arrest (presumed cardiac vs non‐cardiac); location of arrest (in‐hospital vs out‐of‐hospital); witnessed versus non‐witnessed arrest; and primary ECG rhythm (ventricular fibrillation (VF) or ventricular tachycardia (VT) vs other). The endpoint was 'best ever reached CPC during hospital stay' (see Table 1).
| Outcome or subgroup | Studies | Participants | Risk ratio (M‐H, fixed, 95% CI) |
| Good neurological outcome by cardiac cause vs non‐cardiac cause | 3 | 383 | 1.54 (1.22 to 1.95) |
| Cardiac cause | 3 | 372 | 1.51 (1.19 to 1.91) |
| Non‐cardiac cause | 2 | 11 | 3.80 (0.55 to 26.29) |
| Good neurological outcome by location of cardiac arrest | 3 | 382 | 1.56 (1.23 to 1.98) |
| In‐hospital | 1 | 17 | 1.64 (0.47 to 5.73) |
| Out‐of‐hospital | 3 | 365 | 1.56 (1.23 to 1.99) |
| Good neurological outcome by witnessed cardiac arrest | 3 | 382 | 1.49 (1.18 to 1.88) |
| Witnessed cardiac arrest | 3 | 360 | 1.43 (1.13 to 1.81) |
| Non‐witnessed cardiac arrest | 3 | 22 | 5.31 (1.40 to 20.21) |
| Good neurological outcome by primary ECG rhythm | 3 | 382 | 1.51 (1.19 to 1.91) |
| VF/VT rhythm | 2 | 330 | 1.47 (1.15 to 1.88) |
| Non‐ VF/VT rhythm | 2 | 52 | 2.17 (0.68 to 6.93) |
ECG = electrocardiogram
VF/VT = ventricular fibrillation/ventricular tachycardia
-
The risk for participants with a cardiac cause (n = 372; three studies; Bernard 2002; HACA 2002; Hachimi‐Idrissi 2001) and VF or VT was 1.51 (95% CI 1.19 to 1.91; n = 330; two studies; Bernard 2002; HACA 2002).
-
Groups of participants with non‐VF or VT rhythm as the first cardiac rhythm (n = 52; participants with a non‐cardiac cause ‐ n = 11, and in‐hospital arrests ‐ n = 17) were small and showed no statistically significant effects (non‐VF or VT: RR 2.17, 95% CI 0.68 to 6.93; I2 statistic = 50%; two studies; HACA 2002; Hachimi‐Idrissi 2001) (non‐cardiac cause: RR 3.80, 95% CI 0.55 to 26.29; I2 statistic = 0%; two studies; HACA 2002; Hachimi‐Idrissi 2001) (in‐hospital: RR 1.64, 95% CI 0.47 to 5.73).
-
A small number of participants had non‐witnessed arrest (n = 22). Among these participants, effect size was substantially greater than the summary effect for the whole study population (RR 5.31, 95% CI 1.40 to 20.21; I2 statistic = 0%; three studies; Bernard 2002; HACA 2002; Hachimi‐Idrissi 2001).
-
For participants with witnessed cardiac arrest (n = 360), the risk ratio was 1.43 (95% CI 1.13 to 1.81; I2 statistic = 0%; three studies; Bernard 2002; HACA 2002; Hachimi‐Idrissi 2001).
Sensitivity analysis
Robustness against risk of bias in individual studies
Two out of four studies (445 participants) reported on adequate allocation concealment (HACA 2002; Hachimi‐Idrissi 2001); for one study (Mori 2000; 54 participants), we had no further information, and in another study, allocation concealment was not adequate (Bernard 2002; 77 participants; see Figure 3). Pooling of data for studies in which allocation concealment was adequate or unknown (medium risk) resulted in an effect size that was even augmented (from 1.94 to 2.46; three studies; see Table 2). Pooling of data for studies in which allocation concealment was adequate (low risk) led to an effect size that was virtually unchanged (from 1.94 to 1.97; two studies). Overall effects appeared robust against deficits in allocation concealment.
| Outcome or subgroup | Studies | Participants | Risk ratio (M‐H, Fixed, 95% CI) |
| Good neurological outcome for all studies with conventional cooling | 4 | 437 | 1.94 (1.18 to 3.21) |
| Studies with conventional cooling and adequate or unknown allocation concealment | 3 | 360 | 2.46 (0.96 to 6.28) |
| Studies with conventional cooling and adequate allocation concealment | 2 | 445 | 1.97 (0.71 to 5.45) |
| Studies with other cooling methods and adequate allocation concealment | 1 | 42 | 0.71 (0.32 to 1.54) |
Influence of model choice
To investigate whether model choice might influence results, we compared estimates from random‐effects models with those from fixed‐effect models. The effect estimate as presented in Figure 4 did not change much by model choice (fixed‐effect RR 1.67, 95% CI 1.32 to 2.11; random‐effects RR 1.94, 95% CI 1.18 to 3.21), indicating that the effect is robust against the model choice.
Publication bias
Currently, identified studies are too few to permit inferences from funnel plots; therefore, we have not presented them in the latest version of this review.
Secondary outcomes
Survival to hospital discharge and at six months
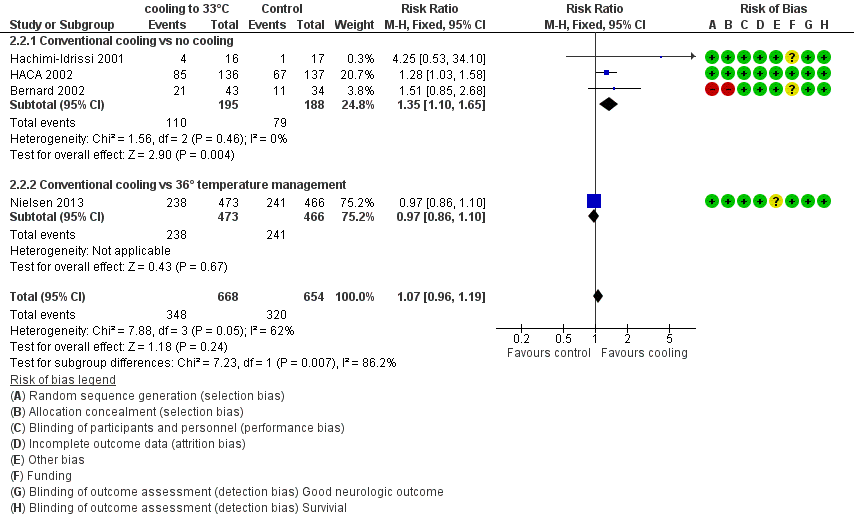
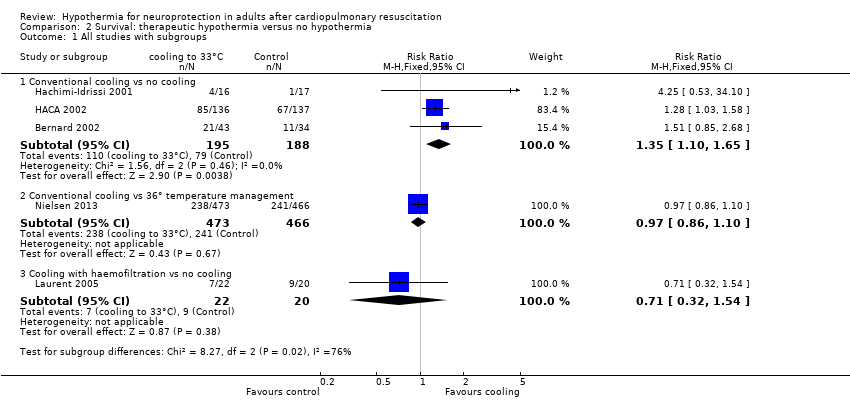
With three studies (Bernard 2002; HACA 2002; Hachimi‐Idrissi 2001; 383 participants) reporting on conventional cooling methods compared with no cooling, the pooled result showed benefit for survival for the conventional cooling group (RR 1.35, 95% CI 1.10 to 1.65; I2 statistic = 0%; see Figure 6; and Data and analyses). The quality of the evidence was moderate. We downgraded the quality of the evidence as the result of imprecision. One study included 42 participants undergoing haemofiltration after cardiac arrest (Laurent 2005), which introduced considerable clinical heterogeneity and prevented pooling of data with those of the studies described above. Cooling using haemofiltration did not result in differences in survival (RR 0.71, 95% CI 0.32 to 1.54; see Figure 6). The quality of the evidence was very low. We downgraded the quality of the evidence as the result of risk of bias, imprecision and indirectness. Another study (Nielsen 2013) evaluated effects of conventional cooling versus targeted temperature management at 36°C and reported no effects on survival when therapeutic hypothermia at 33°C was compared with temperature management at 36°C (RR 0.97, 95% CI 0.86 to 1.10; 939 participants; see Figure 6). The quality of the evidence was moderate. We downgraded the quality of the evidence for this single but large RCT as the result of indirectness.
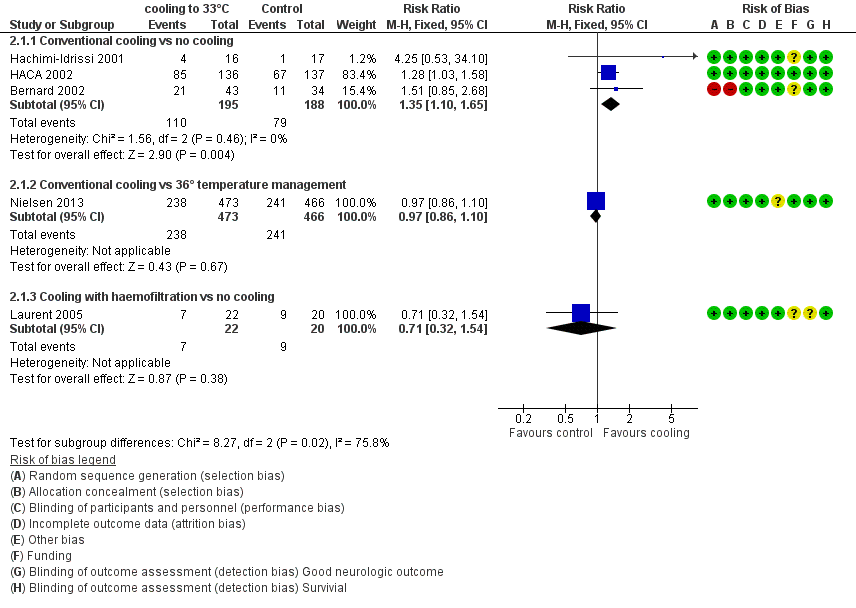
Forest plot of comparison: 3 Survival: therapeutic hypothermia versus no hypothermia, outcome: 3.1 All studies with subgroups.
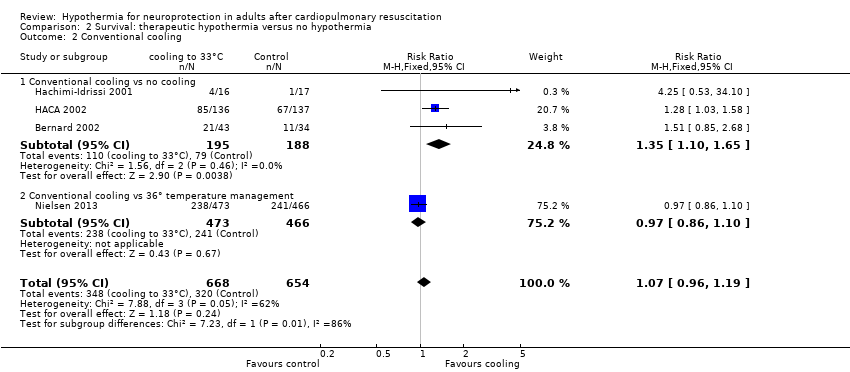
When all studies that used conventional cooling methods regardless of the control treatment (Bernard 2002; HACA 2002; Hachimi‐Idrissi 2001; Nielsen 2013) were pooled, we noted no survival benefit (RR 1.07, 95% CI 0.96 to 1.19; see Figure 7). We found considerable heterogeneity when pooling these studies, possibly because a different control group treatment was given in one study (Nielsen 2013). The test for subgroup differences according to control group treatment (no cooling vs target temperature at 36°C) was highly positive (Chi² = 6.36, df = 1 (P value = 0.01)). Cautious interpretation of this effect is therefore warranted, but to inform the current discussion, we present the pooled estimate for the primary outcome despite obvious limitations. We restricted the summary of findings to findings with the least ambiguity (summary of findings Table for the main comparison).

Forest plot of comparison: 3 Survival: therapeutic hypothermia versus no hypothermia, outcome: 3.2 Conventional cooling.
Long term survival
We found no data on this outcome.
Quality of life at six months and long term
We found no data on this outcome.
Dependency
Nielsen 2013 reported on the modified Rankin Scale at six months (RR 1.01, 95% CI 0.89 to 1.14; P value = 0.87). We found no additional data on this outcome.
Cost‐effectiveness
We found no data on this outcome.
Adverse events
We included in the analysis all trials that reported on adverse events, regardless of heterogeneity. The following adverse events were reported in five studies (Bernard 2002; HACA 2002; Hachimi‐Idrissi 2001; Laurent 2005; Nielsen 2013; 1358 participants): bleeding of any severity and at various locations, need for platelet transfusions, pneumonia, sepsis, pancreatitis, renal failure or oliguria, haemodialysis, pulmonary oedema, seizures, atrial fibrillation/flutter, lethal or long‐lasting arrhythmias, cardiac complications and electrolyte and metabolic imbalances (see Table 3).
| Outcome or subgroup | Studies | Participants | Risk ratio (M‐H, Fixed, 95% CI) |
| Bleeding of any severity | 2 | 1206 | 1.14 (0.96 to 1.35) |
| Need for platelet transfusion | 1 | 273 | 5.11 (0.25 to 105.47) |
| Significant haemorrhagic complications | 1 | 77 | Not estimable |
| Pneumonia | 2 | 1205 | 1.15 (1.02 to 1.30) |
| Pancreatitis | 1 | 273 | 0.51 (0.05 to 5.57) |
| Sepsis | 2 | 1206 | 1.14 (0.81 to 1.61) |
| Septic shock | 1 | 933 | 0.87 (0.50 to 1.52) |
| Renal failure or oliguria | 2 | 303 | 0.88 (0.48 to 1.61) |
| Haemodialysis | 3 | 1288 | 1.16 (0.80 to 1.67) |
| Seizures | 2 | 1202 | 1.18 (0.98 to 1.42) |
| Lethal or long‐lasting arrhythmia | 2 | 315 | 1.21 (0.88 to 1.67) |
| Any arrhythmia | 1 | 933 | 0.98 (0.93 to 1.04) |
| Pulmonary oedema | 1 | 269 | 1.76 (0.61 to 5.12) |
| Cardiac complications | 1 | No totals | |
| Hypokalaemia | 2 | 975 | 1.38 (1.03 to 1.84) |
| Hypophosphataemia | 2 | 975 | 1.10 (0.92 to 1.33) |
| Hypoglycaemia | 1 | 933 | 1.12 (0.64 to 1.97) |
| Hypomagnesaemia | 1 | 933 | 1.20 (0.88 to 1.65) |
| Pressure sores | 1 | 269 | Not estimable |
Two studies with 1205 participants (HACA 2002; Nielsen 2013) reported pneumonia, which was more frequent in the treatment group (RR 1.15, 95% CI 1.02 to 1.30; see summary of findings Table for the main comparison). The quality of the evidence was moderate. We downgraded the quality of the evidence as the result of indirectness (differences in control groups ‐ no temperature management and 36°C). Hypokalaemia was reported in two studies (Laurent 2005; Nielsen 2013) including 975 participants and was more frequent in the intervention group (RR 1.38, 95% C 1.03 to 1.84). The quality of the evidence was low. We downgraded the quality of the evidence as the result of very serious indirectness (differences in intervention ‐ conventional cooling and haemofiltration ‐ and control groups). Otherwise, researchers observed no significant differences between groups.
Discussion
Summary of main results
Evidence from five studies with 1370 participants contributing data to the primary outcomes of this review showed that therapeutic hypothermia with conventional cooling methods improved neurological outcome after cardiac arrest. The impact on survival was less certain, but a strong effect was evident when therapeutic hypothermia was compared with no temperature management.
Overall completeness and applicability of evidence
All studies reported on the same outcomes and, except for Mori 2000, for which we did not receive further information, all outcome assessors were blinded to treatment (Bernard 2002; HACA 2002; Hachimi‐Idrissi 2001; Laurent 2005; Nielsen 2013). The cerebral performance category (CPC) is well standardized and easy to measure, and gives a crude approximation of the person's ability to perform tasks of daily life. One of its limitations is lack of accuracy when it comes to estimating cognitive functions and personal and social impact of cardiac arrest.
After completing our literature search, we were able to include individual patient data (IPD) for only three out of five eligible studies retrieved (Bernard 2002; HACA 2002; Hachimi‐Idrissi 2001). Therefore, we had to omit the IPD analysis and could calculate only subgroup analyses using available data. Subsequently, precision in the subsets of participants was humble and maybe was too low to permit firm conclusions about the subgroups.
One of the challenges of this review was heterogeneity at the study level. In the case of Laurent 2005, the two treatment modalities (mild therapeutic hypothermia with and without haemodialysis) were clinically too heterogeneous to be combined with those of other studies. As mentioned in the Background section, one of the theories of the beneficial effects of cooling deals with attenuation of the effects of free radicals and other mediators. Haemofiltration may act in a similar way, by reducing the number of free radicals. This effect is likely to interact with the effect of therapeutic hypothermia.
Control group treatment is another important driver for heterogeneity. Nielsen 2013 differed considerably in terms of control group treatment, as investigators used a target temperature of 36°C in contrast to no temperature management as employed by the other studies. Despite seemingly subtle differences, this can be expressed as two distinct clinical questions: 'Does mild therapeutic hypothermia compared with no mild therapeutic hypothermia at all influence outcome?' versus 'Does temperature management targeted to 33°C compared with 36°C influence outcome?' These questions were often ignored in clinical discussions, however. To meet concerns of heterogeneity and at the same time give a better picture of available data, we decided to perform an ancillary analysis. Without temperature management in the control group, therapeutic hypothermia at 32°C to 34°C improves neurological outcome after cardiac arrest, and this effect persists when the control group receives active temperature management at 36°C. Whether 36°C, cooling to 32°C to 34°C and no cooling are equally effective can be judged only by an indirect comparison. This indirect comparison however should be performed when a sufficient degree of transitivity is present, which is not necessarily the case here (Storm 2014; Stub 2014).
In our sensitivity analysis, the effect was robust against allocation concealment and model choice.
Many cooling methods are available, ranging from expensive device‐controlled methods to very cheap cold fluids and ice packs. Proof of superiority of any cooling method above others is still lacking.
After publication of the two RCTs on therapeutic hypothermia (Bernard 2002; HACA 2002), guidelines were published by the International Liaison Committee on Resuscitation (ILCOR) on the application of therapeutic hypothermia after cardiac arrest (Nolan 2003). The publication of the Targeted Temperature Management (TTM) trial (Nielsen 2013) has led to ongoing discussion about optimal levels of target temperature. In their most recent statement, ILCOR members have advised that "Pending formal consensus on the optimal temperature, we suggest that clinicians provide post‐resuscitation care based on the current treatment recommendations. We accept that some clinicians may make a local decision to use a target temperature of 36°C pending this further guidance." Similar up‐to‐date guidelines of the European Resuscitation Council state the following: "Targeted temperature management remains important but there is now an option to target a temperature of 36°C instead of the previously recommended 32 to 34°C" (Soar 2015), and the American Heart Association provides this advice: "We recommend selecting and maintaining a constant target temperature between 32°C and 36°C for those patients in whom temperature control is used (strong recommendation, moderate quality evidence)" (Callaway 2015).
Investigators have observed that pyrexia after the cooling period is associated with increased mortality and unfavourable neurological outcome (Bro‐Jeppesen 2013; Leary 2013; Zeiner 2001). Mean body temperature 12 hours after the start of cooling in the 'normothermia group' was around 37.6°C in HACA 2002 and 37.4°C in Bernard 2002. Hachimi‐Idrissi 2001 did not report the body temperature of the control group. Adding results of Nielsen 2013 slightly reduced the effect size, but 33°C in comparison with higher temperatures still showed a significant and relevant beneficial effect for neurological outcome. A dose‐response effect over different levels of hypothermia is possible, but studies are still too few to prove this.
Quality of the evidence
Risk of bias was low for most studies and when present did not strongly influence the estimates. Therefore, we considered the results robust against risk of bias from within the studies, and this was confirmed by our sensitivity analysis.
We downgraded the quality of evidence to moderate for main outcomes, mainly as the result of imprecision, as the number of events fell below the limit of the suggested optimal information size (Guyatt 2011).
We graded indirectness as not relevant for the main analysis of our review because it reflects common practice. Furthermore, 90% (in HACA 2002) and 92% (in Bernard 2002) of all eligible participants were randomly assigned. In Laurent 2005 and Hachimi‐Idrissi 2001, inclusion of all eligible participants was reported. Generally, participants within the included studies appeared to be treated according to international guidelines. Indirectness,however, was an issue for the analysis of adverse events, for which we pooled all available studies regardless of differences in intervention and control group treatments.
The included studies represent a mixture of efficacy studies and one larger pragmatic study (Nielsen 2013). All studies were academia initiated.
Potential biases in the review process
One of the problems involved with merging the data for this review was the difference in inclusion criteria. Generally, among all participants resuscitated and brought to hospital, between 18% and 42% have non‐witnessed arrests, only 30% to 58% have a confirmed ventricular fibrillation (VF) rhythm as first rhythm (Haukoos 2004; Herlitz 2003a; Kim 2001) and 40% are resuscitated in‐hospital. In this review, the two larger studies with available IPD included only participants with a cardiac cause of cardiac arrest, and with VF or ventricular tachycardia (VT) rhythm as the first cardiac rhythm (Bernard 2002; HACA 2002). Most participants had an out‐of‐hospital cardiac arrest. From the pathogenesis of global cerebral ischaemias and theories as to why therapeutic hypothermia is effective, we could find no reason why therapeutic hypothermia should not be as effective in participants with asystole as the first cardiac rhythm or in those with non‐cardiac causes for cardiac arrest. In a meta‐analysis (Holzer 2005), the effect of therapeutic hypothermia was only sightly changed by baseline variables. A retrospective cohort study showed that the effect of therapeutic hypothermia was independent of various confounders, including cardiac arrest conditions (Arrich 2006).
The trial by Mori 2000 and colleagues was published as an abstract. In personal communications, we were able to receive information about the cooling method but not about quality criteria for this randomized controlled trial. Therefore, we have rated most of the quality criteria in our risk of bias assessment as 'unclear'.
The most recent study (Nielsen 2013) was the largest one in this field of research. Adding these data introduced considerable heterogeneity, which we had not observed with the existing studies. A clinical viewpoint suggests various reasons, the most obvious being the control group, which was kept at 36°C and not 'no cooling' as in other studies. The design of Nielsen 2013 was a pragmatic one (multi‐centre, different methods of cooling, etc.), which may not be suitable as long as the cooling 'dose', which is mainly target temperature and cooling duration, is not unequivocally characterized in proof of concept studies. Additionally, Nielsen 2013 had a very short duration from collapse to resuscitation (one minute) compared with the other trials (around 10 minutes). Reports show that the effect of therapeutic hypothermia depends strongly on this no flow time (Testori 2012). Knowing whether the results of this study should be added to existing data, especially as they caused a high level of heterogeneity, was challenging. To provide the most informative picture of all levels of hypothermia, we have decided to present an ancillary analysis at the study level. Despite controversial arguments against and for pooling of all studies, a beneficial and statistically significant effect on neurological outcome was seen when all studies on conventional cooling were pooled (RR 1.53, 95% CI 1.02 to 2.29).
For the subgroup of participants with non‐witnessed arrests, we observed an effect size substantially greater than the pooled summary effect (RR 5.31, 95% CI 1.40 to 20.21) (Table 1). However, the group of non‐witnessed arrests was small (22 participants only) and yielded large confidence intervals. Although it seems that participants benefited from the treatment provided, the result should be interpreted with caution.
Agreements and disagreements with other studies or reviews
We are aware of three other meta‐analyses with similar objectives. The meta‐analysis by Holzer 2005 is very similar to the one performed in our review method‐wise and in many ways was a predecessor to the first version of this Cochrane review. We were able to include two additional studies (Laurent 2005; Mori 2000), but the main result is comparable. Another meta‐analysis was published in 2011 (Nielsen 2011). The review authors judged the overall quality of the included studies to be at a lower level than we did in our review. From the available five studies, they combined four and five on the basis of a different judgement on clinical heterogeneity, and they provided a trial sequential analysis. The main findings were comparable between the two reviews, whereas their interpretation was more conservative than ours. We found a third meta‐analysis published recently, which focused on the safety effects of therapeutic hypothermia (Xiao 2013). Upon pooling randomized and non‐randomized studies, review authors found overall better survival with therapeutic hypothermia with a slightly elevated incidence of arrhythmia and hypokalaemia.
Study flow diagram.
Risk of bias graph: review authors' judgements about each risk of bias item presented as percentages across all included studies.
Risk of bias summary: review authors' judgements about each risk of bias item for each included study.

Forest plot of comparison: 1 Neurological outcome: therapeutic hypothermia versus no hypothermia, outcome: 1.1 All studies with subgroups.

Forest plot of comparison: 1 Neurological outcome: therapeutic hypothermia versus no hypothermia, outcome: 1.2 Conventional cooling.

Forest plot of comparison: 3 Survival: therapeutic hypothermia versus no hypothermia, outcome: 3.1 All studies with subgroups.
Forest plot of comparison: 3 Survival: therapeutic hypothermia versus no hypothermia, outcome: 3.2 Conventional cooling.
Comparison 1 Neurological outcome: therapeutic hypothermia versus no hypothermia, Outcome 1 All studies with subgroups.
Comparison 1 Neurological outcome: therapeutic hypothermia versus no hypothermia, Outcome 2 Conventional cooling.
Comparison 2 Survival: therapeutic hypothermia versus no hypothermia, Outcome 1 All studies with subgroups.
Comparison 2 Survival: therapeutic hypothermia versus no hypothermia, Outcome 2 Conventional cooling.
| Neurological outcome, survival and adverse events: conventional cooling compared with no cooling and 36°C for neuroprotection and survival in adults after cardiopulmonary resuscitation | ||||||
| Patient or population: adults after cardiopulmonary resuscitation | ||||||
| Outcomes | Illustrative comparative risks* (95% CI) | Relative effect | Number of participants | Quality of the evidence | Comments | |
| Assumed risk | Corresponding risk | |||||
| No cooling | Cooling 32°C to 34°C | |||||
| Good neurological outcome | Study population | RR 1.94 (1.18 to 3.21) | 437 | ⊕⊕⊕⊝ | ||
| 325 per 1000 | 631 per 1000 | |||||
| Survival | Study population | RR 1.35 | 383 | ⊕⊕⊕⊝ | ||
| 420 per 1000 | 567 per 1000 | |||||
| Adverse events ‐ pneumonia | Study population | RR 1.15 | 1205 | ⊕⊕⊕⊝ | ||
| 423 per 1000 | 486 per 1000 | |||||
| Adverse events ‐ hypokalaemia | Study population | RR 1.38 | 975 | ⊕⊕⊝⊝ | ||
| 134 per 1000 | 185 per 1000 | |||||
| *The basis for the assumed risk (e.g. median control group risk across studies) is provided in footnotes. The corresponding risk (with its 95% confidence interval) is based on assumed risk in the comparison group and relative effect of the intervention (and its 95% CI) GRADE Working Group grades of evidence | ||||||
| aOne quasi‐randomized trial (Bernard 2002) and one abstract (Mori 2000) but both not contributing to most data (see also Effects of interventions ‐ 'Sensitivity analysis') bTotal number of events < 300; imprecision therefore was rated as serious, and this resulted in downgrading of the overall quality of the evidence one level from high to moderate cOne quasi‐randomized trial not contributing to the majority of data (see also Effects of interventions ‐ 'Sensitivity analysis') dIndirectness was caused mostly by control group treatment (Nielsen 2013), which resulted in downgrading of the overall quality of the evidence one level from high to moderate eIndirectness was rated as very serious because of differences in intervention (haemofiltration, conventional cooling) and control group treatments (no cooling, 36°C), which resulted in downgrading of the overall quality of the evidence two levels from high to low fLaurent 2005 had some risk of bias but is not contributing to the majority of data | ||||||
| Outcome or subgroup | Studies | Participants | Risk ratio (M‐H, fixed, 95% CI) |
| Good neurological outcome by cardiac cause vs non‐cardiac cause | 3 | 383 | 1.54 (1.22 to 1.95) |
| Cardiac cause | 3 | 372 | 1.51 (1.19 to 1.91) |
| Non‐cardiac cause | 2 | 11 | 3.80 (0.55 to 26.29) |
| Good neurological outcome by location of cardiac arrest | 3 | 382 | 1.56 (1.23 to 1.98) |
| In‐hospital | 1 | 17 | 1.64 (0.47 to 5.73) |
| Out‐of‐hospital | 3 | 365 | 1.56 (1.23 to 1.99) |
| Good neurological outcome by witnessed cardiac arrest | 3 | 382 | 1.49 (1.18 to 1.88) |
| Witnessed cardiac arrest | 3 | 360 | 1.43 (1.13 to 1.81) |
| Non‐witnessed cardiac arrest | 3 | 22 | 5.31 (1.40 to 20.21) |
| Good neurological outcome by primary ECG rhythm | 3 | 382 | 1.51 (1.19 to 1.91) |
| VF/VT rhythm | 2 | 330 | 1.47 (1.15 to 1.88) |
| Non‐ VF/VT rhythm | 2 | 52 | 2.17 (0.68 to 6.93) |
| ECG = electrocardiogram VF/VT = ventricular fibrillation/ventricular tachycardia | |||
| Outcome or subgroup | Studies | Participants | Risk ratio (M‐H, Fixed, 95% CI) |
| Good neurological outcome for all studies with conventional cooling | 4 | 437 | 1.94 (1.18 to 3.21) |
| Studies with conventional cooling and adequate or unknown allocation concealment | 3 | 360 | 2.46 (0.96 to 6.28) |
| Studies with conventional cooling and adequate allocation concealment | 2 | 445 | 1.97 (0.71 to 5.45) |
| Studies with other cooling methods and adequate allocation concealment | 1 | 42 | 0.71 (0.32 to 1.54) |
| Outcome or subgroup | Studies | Participants | Risk ratio (M‐H, Fixed, 95% CI) |
| Bleeding of any severity | 2 | 1206 | 1.14 (0.96 to 1.35) |
| Need for platelet transfusion | 1 | 273 | 5.11 (0.25 to 105.47) |
| Significant haemorrhagic complications | 1 | 77 | Not estimable |
| Pneumonia | 2 | 1205 | 1.15 (1.02 to 1.30) |
| Pancreatitis | 1 | 273 | 0.51 (0.05 to 5.57) |
| Sepsis | 2 | 1206 | 1.14 (0.81 to 1.61) |
| Septic shock | 1 | 933 | 0.87 (0.50 to 1.52) |
| Renal failure or oliguria | 2 | 303 | 0.88 (0.48 to 1.61) |
| Haemodialysis | 3 | 1288 | 1.16 (0.80 to 1.67) |
| Seizures | 2 | 1202 | 1.18 (0.98 to 1.42) |
| Lethal or long‐lasting arrhythmia | 2 | 315 | 1.21 (0.88 to 1.67) |
| Any arrhythmia | 1 | 933 | 0.98 (0.93 to 1.04) |
| Pulmonary oedema | 1 | 269 | 1.76 (0.61 to 5.12) |
| Cardiac complications | 1 | No totals | |
| Hypokalaemia | 2 | 975 | 1.38 (1.03 to 1.84) |
| Hypophosphataemia | 2 | 975 | 1.10 (0.92 to 1.33) |
| Hypoglycaemia | 1 | 933 | 1.12 (0.64 to 1.97) |
| Hypomagnesaemia | 1 | 933 | 1.20 (0.88 to 1.65) |
| Pressure sores | 1 | 269 | Not estimable |
| Outcome or subgroup title | No. of studies | No. of participants | Statistical method | Effect size |
| 1 All studies with subgroups Show forest plot | 6 | Risk Ratio (M‐H, Random, 95% CI) | Subtotals only | |
| 1.1 Conventional cooling vs no cooling | 4 | 437 | Risk Ratio (M‐H, Random, 95% CI) | 1.94 [1.18, 3.21] |
| 1.2 Conventional cooling vs 36° temperature management | 1 | 933 | Risk Ratio (M‐H, Random, 95% CI) | 0.97 [0.85, 1.11] |
| 1.3 Cooling with haemofiltration vs no cooling | 1 | 42 | Risk Ratio (M‐H, Random, 95% CI) | 0.71 [0.32, 1.54] |
| 2 Conventional cooling Show forest plot | 5 | 1370 | Risk Ratio (M‐H, Random, 95% CI) | 1.53 [1.02, 2.29] |
| 2.1 Conventional cooling vs no cooling | 4 | 437 | Risk Ratio (M‐H, Random, 95% CI) | 1.94 [1.18, 3.21] |
| 2.2 Conventional cooling vs 36° temperature management | 1 | 933 | Risk Ratio (M‐H, Random, 95% CI) | 0.97 [0.85, 1.11] |
| Outcome or subgroup title | No. of studies | No. of participants | Statistical method | Effect size |
| 1 All studies with subgroups Show forest plot | 5 | Risk Ratio (M‐H, Fixed, 95% CI) | Subtotals only | |
| 1.1 Conventional cooling vs no cooling | 3 | 383 | Risk Ratio (M‐H, Fixed, 95% CI) | 1.35 [1.10, 1.65] |
| 1.2 Conventional cooling vs 36° temperature management | 1 | 939 | Risk Ratio (M‐H, Fixed, 95% CI) | 0.97 [0.86, 1.10] |
| 1.3 Cooling with haemofiltration vs no cooling | 1 | 42 | Risk Ratio (M‐H, Fixed, 95% CI) | 0.71 [0.32, 1.54] |
| 2 Conventional cooling Show forest plot | 4 | 1322 | Risk Ratio (M‐H, Fixed, 95% CI) | 1.07 [0.96, 1.19] |
| 2.1 Conventional cooling vs no cooling | 3 | 383 | Risk Ratio (M‐H, Fixed, 95% CI) | 1.35 [1.10, 1.65] |
| 2.2 Conventional cooling vs 36° temperature management | 1 | 939 | Risk Ratio (M‐H, Fixed, 95% CI) | 0.97 [0.86, 1.10] |