Ventilación con presión positiva no invasiva como estrategia de desconexión para adultos intubados con insuficiencia respiratoria
Referencias
References to studies included in this review
References to studies excluded from this review
References to ongoing studies
Additional references
References to other published versions of this review
Characteristics of studies
Characteristics of included studies [ordered by study ID]
| Methods | Pseudo‐randomized | |
| Participants | Participants were admitted with an acute exacerbation of COPD. Participants were invasively ventilated through a nasotracheal tube for 48 to 60 hours | |
| Interventions | Participants were randomly assigned by alternating day of the month to receive noninvasive ventilation in PS mode or continued weaning with invasive PS. PS and PEEP were gradually decreased to facilitate liberation from mechanical support. Ventilation was discontinued after a three‐hour SBT was completed and discontinuation criteria were met | |
| Outcomes | 1. Mortality | |
| Notes | ||
| Risk of bias | ||
| Bias | Authors' judgement | Support for judgement |
| Random sequence generation (selection bias) | High risk | Participants randomly assigned to group A or B on the basis of order of hospital admission |
| Allocation concealment (selection bias) | High risk | Used order of hospital admission |
| Incomplete outcome data (attrition bias) | Low risk | None missing |
| Selective reporting (reporting bias) | Unclear risk | Primary and secondary outcomes not specified. Clinically important outcomes reported |
| Methods | RCT Two centres Computer‐generated list held by investigator not involved in participant care | |
| Participants | Participants with ARF and persistent weaning failure requiring MV for at least 72 hours and failing a two‐hour T‐piece trial on three consecutive days. Participants were identified by daily screening prerandomization | |
| Interventions | Participants were randomly assigned to bilevel positive airway pressure in ST mode or invasive weaning with AC or PS. Daily T‐piece trials were conducted until extubation in the IPPV group. Periods of SB of increasing duration were used to wean NPPV. IPPV was discontinued after successful completion of a two‐hour SBT | |
| Outcomes | 1. ICU mortality | |
| Notes | ||
| Risk of bias | ||
| Bias | Authors' judgement | Support for judgement |
| Random sequence generation (selection bias) | Low risk | Participants randomly assigned with the use of a computer‐generated table for each centre |
| Allocation concealment (selection bias) | Low risk | Computer‐generated table held by an investigator not involved in the study |
| Incomplete outcome data (attrition bias) | Low risk | None missing |
| Selective reporting (reporting bias) | High risk | Proportions of weaning successes and failures not reported in publication of full trial. This outcome was previously reported in a smaller number of participants in an earlier abstract publication (2000). Study authors did not continue to collect data on this outcome |
| Methods | RCT Opaque envelopes | |
| Participants | Participants with acute‐on‐chronic respiratory failure (COPD, restrictive, mixed) failing a two‐hour T‐piece trial after invasive mechanical ventilation for at least 48 hours. Participants were identified through daily screening | |
| Interventions | Participants were randomly assigned to receive invasive pressure support or NPPV delivered in flow or pressure mode. NPPV was delivered intermittently following extubation, separated by periods of SB of increasing duration. Invasive PS was titrated by 3 to 5 cm H2O according to tolerance. Discontinuation of support followed successful completion of two periods of observation during SB (NPPV) or during PS weaning with optional SBTs (IPPV). Extubation was performed when PS was less than 8 cm H2O in the IPPV group | |
| Outcomes | 1. 90‐day mortality | |
| Notes | ||
| Risk of bias | ||
| Bias | Authors' judgement | Support for judgement |
| Random sequence generation (selection bias) | Unclear risk | Not specified. Randomization and introduction of the weaning procedure IPSV or NPPV were done during the 24 hours after the two‐hour SBT |
| Allocation concealment (selection bias) | Unclear risk | Opaque envelopes |
| Incomplete outcome data (attrition bias) | Low risk | None missing |
| Selective reporting (reporting bias) | Low risk | Protocol not available. Published manuscript reports on prespecified outcomes |
| Methods | RCT (n = 208) three arms, of which two arms (n = 138) were included in the pooled results 13 ICUs/centres Computer‐generated randomization table using variable blocks of four Sealed, opaque envelopes | |
| Participants | Participants with chronic hypercapneic respiratory failure based on history, chest radiograph, arterial blood gases in steady state and/or bicarbonate level and pulmonary function tests (if available) who were intubated for at least 48 hours, regardless of cause of the disorder. Participants were clinically stable for at least 24 hours and underwent an SBT after meeting weaning criteria as determined by a daily screening evaluation. Participants who failed an SBT were assigned to one of the three treatment groups. Two groups (invasive weaning and NPPV weaning) were included in the pooled analysis | |
| Interventions | Participants were randomly assigned to conventional invasive weaning (n = 69), oxygen‐therapy (n = 70) or noninvasive ventilation (n = 69). Conventional invasive weaning was performed using one or more daily SBTs with the use of a T‐piece or PSV (with or without PEEP) in 20% of participants. In the oxygen‐therapy and NPPV groups, respectively, SBTs were followed by a re‐ventilation period of at least 30 minutes duration and extubation (same day as randomization) or standard oxygen therapy to maintain SaO2> 90% or immediate NPPV with a face mask. NPPV was performed for > six hours and was administered continuously initially and intermittently subsequently with spontaneous breathing periods using supplemental oxygen | |
| Outcomes | 1. Mortality (before eighth day after randomization) 2. Mortality (before 29th day after randomization) 3. ICU mortality (before 29th day after randomization) 4. Hospital mortality (before 29th day after randomization) 5. Total duration of ventilation 6. Duraion of ventilation related to weaning 7. Ventilator‐free days 8. Complications (auto extubation, postextubation stridor, tube obstruction, respiratory encephalopathy, bronchial hypersecretion, nosocomial pneumonia, sinusitis, atelectasis, cardiac arrhythmia, haemodynamic collapse, ACPE, paralytic ileus, gastric distension, mask intolerance) 9. Respiratory support at discharge | |
| Notes | ||
| Risk of bias | ||
| Bias | Authors' judgement | Support for judgement |
| Random sequence generation (selection bias) | Low risk | Computer‐generated randomization table using variable blocks of four |
| Allocation concealment (selection bias) | Low risk | Sealed, opaque envelopes according to centre stratification |
| Incomplete outcome data (attrition bias) | Low risk | No missing outcome data |
| Selective reporting (reporting bias) | Low risk | All specific outcomes reported |
| Methods | RCT (abstract) Sealed, opaque envelopes | |
| Participants | Participants with acute respiratory failure admitted to a medical intensive care unit and failing a 30‐minute T‐piece trial were eligible. Participants were identified through daily screening | |
| Interventions | Participants were randomly assigned to receive VPAP using PS, delivered in ST mode, or invasive PS. In both arms, mechanical support was titrated to RR and tidal volume. Whereas two‐hour T‐piece trials were permitted to discontinue IPPV support in the IPPV group, NPPV was discontinued by gradually increasing periods between NPPV trials until participants were able to breathe spontaneously between NPPV sessions for two hours without increasing RR or dyspnoea | |
| Outcomes | 1. Mortality | |
| Notes | ||
| Risk of bias | ||
| Bias | Authors' judgement | Support for judgement |
| Random sequence generation (selection bias) | Unclear risk | Clarified to be randomized. Uncertain sequence generation |
| Allocation concealment (selection bias) | Low risk | Sealed, opaque envelopes (unclear whether sequentially numbered) |
| Incomplete outcome data (attrition bias) | Low risk | None missing |
| Selective reporting (reporting bias) | Low risk | Abstract publication only. Published abstract reports the duration of invasive ventilation |
| Methods | RCT Three centres | |
| Participants | Participants admitted with an acute exacerbation of COPD requiring intubation and MV for at least 36 to 48 hours. Relapse was defined as pH less than 7.33, PaO2 less than 45 mm Hg, severe dyspnoea in the absence of pneumonia or one of 11 nonoperative diagnoses. Participants who met permissive criteria and failed a one‐hour T‐piece trial were eligible for inclusion | |
| Interventions | Participants were intubated, sedated and paralysed for the first six to eight hours. Those failing a one‐hour T‐piece trial were randomly assigned to weaning with NPPV or IPPV. NPPV was delivered continuously with at least two periods of SB per day of increasing duration. PS was decreased by 2 to 4 cm H2O per day in the NPPV group. In the IPPV group, PS was titrated to an RR of less than 25 breaths/min, and twice‐daily SBTs were permitted. Discontinuation occurred after successful completion of a three‐hour period of SB (NPPV) or SBT (IPPV) and when discontinuation criteria were met | |
| Outcomes | 1. 60‐day mortality 2. VAP 3. Successful weaning at 60 days 4. Total duration of MV 5. ICU LOS 6. Adverse events 7. Tracheostomy | |
| Notes | ||
| Risk of bias | ||
| Bias | Authors' judgement | Support for judgement |
| Random sequence generation (selection bias) | Unclear risk | Participants "were randomly assigned" |
| Allocation concealment (selection bias) | Low risk | Using sealed, opaque, numbered envelopes |
| Incomplete outcome data (attrition bias) | Low risk | No missing outcome data |
| Selective reporting (reporting bias) | Low risk | Authors report on important outcomes, including weaning outcomes (success or failure), mortality, VAP, total duration of ventilation and ICU length of stay |
| Methods | ||
| Participants | ||
| Interventions | Participants were initially ventilated in AC mode and were treated with muscle relaxants and sedation to achieve standard ventilator settings. After at least 24 hours of MV and meeting permissive criteria, a T‐piece trial was conducted. Participants failing the T‐piece trial were randomly assigned to NPPV or IPPV weaning NPPV and IPPV were initiated in pressure mode (with a full face mask) and with the use of invasive PS, respectively. NPPV was applied continuously (except for meals, expectoration). IPAP and EPAP levels were adjusted to achieve satisfactory blood gases and RR less than 25 breaths/min. Thereafter, noninvasive or invasive PS was decreased by 2 cm H2O every four hours, titrated to good tolerance (monitoring for changes in saturations and RRs). Both noninvasive and invasive PS (above PEEP) were titrated to participant tolerance, blood gases and RR. Once NPPV was decreased to IPAP and EPAP of 8 and 4 cm H2O, respectively, and invasive PS and PEEP were titrated to 10 and 5 cm H2O, respectively, with pH greater than or equal to 7.35, SaO2 greater than or equal to 90%, RR < 30 breaths/min and FiO2 less than or equal to 40%, participants were allowed to breathe spontaneously on a Venturi mask or were extubated to a Venturi mask | |
| Outcomes | 1. 30‐day mortality | |
| Notes | ||
| Risk of bias | ||
| Bias | Authors' judgement | Support for judgement |
| Random sequence generation (selection bias) | Low risk | Reported using a Kendall and Babington table |
| Allocation concealment (selection bias) | Unclear risk | Not reported |
| Incomplete outcome data (attrition bias) | Low risk | No missing outcome data |
| Selective reporting (reporting bias) | Low risk | All specified outcomes reported |
| Methods | RCT One centre Allocation concealment not described | |
| Participants | Intubated participants with an acute‐on‐chronic exacerbation of COPD, who failed a two‐hour SBT despite meeting simple weaning criteria | |
| Interventions | After intubation, participants were ventilated in controlled mode, received sedation and paralysis for the first six to eight hours and were treated with PS for an additional 60 hours. A T‐piece trial was carried out once participants achieved a satisfactory neurological status and normal temperature and were haemodynamically stable. Participants failing the T‐piece trial were randomly assigned to NPPV (initiated by face mask or nasal mask using BiPAP in PAV/T mode) or continued invasive PS. IPPV was titrated by 2 to 4 cm H2O per day. NPPV was delivered until well tolerated (20 to 22 hours per day), spaced by periods of spontaneous inhalation of oxygen only during meals and for expectoration. The level of PS was decreased by 2 to 4 cm H2O per day in participants with good tolerance. At least two trials of spontaneous breathing of gradually increasing duration were attempted each day. Criteria for weaning from invasive PS or NPPV were SaO2 of 90% or greater with an FiO2 of 40% or less, pH of 7.35 or more, RR less than 35 breaths/min, haemodynamic stability, absence of severe dyspnoea and depressed neurological status. The absence of any of these criteria was considered failure to wean. Participants were screened daily for weaning criteria | |
| Outcomes | 1. Weaning failure | |
| Notes | ||
| Risk of bias | ||
| Bias | Authors' judgement | Support for judgement |
| Random sequence generation (selection bias) | Unclear risk | Treatment assignment "was randomized". Author confirms that he used a central computer and that group allocation was communicated by a computer |
| Allocation concealment (selection bias) | Low risk | The author reported that investigators did not know in advance to which arm the participant would be allocated |
| Incomplete outcome data (attrition bias) | Low risk | Personal communication: "Follow‐up was complete" |
| Selective reporting (reporting bias) | Low risk | The authors reported clinically important outcomes. Note is made that they did not report the duration of ventilation related to weaning, although this was not a prespecified outcome in this study |
| Methods | RCT (abstract) Allocation concealment not described | |
| Participants | Intubated participants with acute‐on‐chronic respiratory failure due to COPD who failed a two‐hour SBT, although they met simple criteria for weaning | |
| Interventions | Conventional invasive PSV (n = 130) was compared with NPPV immediately followed by extubation (n = 134) | |
| Outcomes | 1. Gas exchange 2. Duration of ETMV 3. Weaning failure 4. Nosocomial pneumonia 5. ICU LOS 6. Hospital LOS | |
| Notes | ||
| Risk of bias | ||
| Bias | Authors' judgement | Support for judgement |
| Random sequence generation (selection bias) | Low risk | Randomization sequence was determined using a central computer, and group allocation was communicated by the computer |
| Allocation concealment (selection bias) | Low risk | The author reported that investigators did not know in advance to which arm the participant would be allocated |
| Incomplete outcome data (attrition bias) | Low risk | All randomly assigned participants appear to be accounted for in the analysis |
| Selective reporting (reporting bias) | Low risk | The authors reported on gas exchange, duration of ETMV, weaning failure rates, nosocomial pneumonia rates and ICU and hospital LOS in their full publication |
| Methods | RCT (n = 42) One centre Opaque, sealed, numbered envelopes | |
| Participants | Participants invasively ventilated for longer than 48 hours who failed a two‐hour SBT, despite meeting simple weaning criteria | |
| Interventions | Participants who failed an SBT were randomly allocated to SIMV or noninvasive PAV ventilation In the control SIMV group, ventilatory parameters were adjusted until previous PaCO2 and pH values were reached within the first 60 minutes, and the respiratory rate was < 30 breaths/min. In the PAV group, flow and volume assist PAV were adjusted separately | |
| Outcomes | 1. Gas exchange 2. Duration of ventilatory support 3. Survival at 30 days 4. Complications: septic shock, pneumothorax and VAP | |
| Notes | ||
| Risk of bias | ||
| Bias | Authors' judgement | Support for judgement |
| Random sequence generation (selection bias) | Unclear risk | Not specified |
| Allocation concealment (selection bias) | Low risk | Random assignment was performed using opaque, sealed and numbered envelopes |
| Incomplete outcome data (attrition bias) | Low risk | The authors randomly assigned 42 participants (21 per group), and the denominators for reported outcomes reflect 21 participants per group |
| Selective reporting (reporting bias) | Low risk | All specified outcomes were reported |
| Methods | RCT (n = 65) One centre Sealed envelopes | |
| Participants | Participants receiving mechanical ventilation for longer than 48 hours who failed a 30‐minute spontaneous breathing trial. Participants considered apt to undergo the weaning procedure were submitted to an SBT. Participants had already been randomly assigned to one of the ventilator modes (NPPV or IPPV) that would be used in the event that they failed an SBT | |
| Interventions | After failing a T‐piece trial, participants were randomly divided into two groups: Participants were extubated and placed on NPPV or were returned to invasive mechanical ventilation. For participants randomly assigned to NPPV, IPAP was delivered according to participant tolerance (varied from 10 to 30 cm H2O), and EPAP was set to maintain gas exchange and FiO2 was set to maintain SpO2 greater than 90%. A face mask was used. Weaning from NPPV was performed on a daily basis by gradually reducing pressure levels until adequate VT and minute ventilation levels could be reached and proper alveolar ventilator established. In the IPPV group, a daily SBT was conducted to evaluate the possibility of extubation | |
| Outcomes | 1. ICU length of stay 2. Hospital length of stay 3. Total length of stay in hospital 4. ICU mortality 5. Hospital mortality 6. Duration of ventilation after randomization 7. Total duration of mechanical ventilation | |
| Notes | ||
| Risk of bias | ||
| Bias | Authors' judgement | Support for judgement |
| Random sequence generation (selection bias) | Unclear risk | The authors describe the trial as an "experimental randomized clinical trial" and state that a "randomized clinical trial was conducted" but do not provide details regarding sequence generation |
| Allocation concealment (selection bias) | Unclear risk | Sealed envelopes |
| Incomplete outcome data (attrition bias) | Low risk | No missing outcome data |
| Selective reporting (reporting bias) | Low risk | Study protocol is not available. The published manuscript includes prespecified outcomes |
| Methods | RCT (n = 20) Sealed opaque, sequentially numbered envelopes | |
| Participants | Included participants were mechanically ventilated for longer than 48 hours, had a PaO2/FiO2 ratio between 200 and 300 with FiO2< 0.60 in PS mode and total applied pressure (PEEP + inspired pressure) < 25 cm H2O, PaCO2< 50, pH > 7.35, RR < 30 breaths/min, core temperature < 38.5ºC, cough on suctioning, need for tracheobronchial suctioning < two per hour and GCS = 11 | |
| Interventions | Participants with hypoxaemic ARF were randomly assigned to early extubation followed by NPPV via helmet (helmet group) or conventional weaning through endotracheal tube (tube group) | |
| Outcomes | 1. Days of mechanical ventilation and adherence to study protocol (primary outcomes) 2. Weaning failure 2. Hospital mortality 4. ICU mortality 5. Tracheotomy 6. Continuous sedation 7. Weaning time 8. Septic complications | |
| Notes | ||
| Risk of bias | ||
| Bias | Authors' judgement | Support for judgement |
| Random sequence generation (selection bias) | Low risk | Authors used a table of random numbers, held by investigator not involved in study enrolment |
| Allocation concealment (selection bias) | Low risk | Participants were randomly assigned with the use of sealed, sequentially numbered, opaque envelopes |
| Incomplete outcome data (attrition bias) | Low risk | No missing outcome data |
| Selective reporting (reporting bias) | Low risk | All specified outcomes reported |
| Methods | RCT (n = 28) One respiratory intensive care unit Allocation concealment not described | |
| Participants | 28 invasively ventilated participants with COPD and bronchopulmonary infection. Participants were placed on volume‐controlled AC after intubation and then were switched to SIMV + PS + PEEP. When their infection had been brought under control (decreased sputum, sputum less tenacious and purulent, body temperature less than 37.5°C, WBC less than 10 × 109/L, chest x‐ray improved but not resolved), participants were treated differently | |
| Interventions | Participants in the IPPV group were ventilated until blood gases approached normal values and they had fulfilled the weaning criteria (spontaneous breathing for longer than three hours, FiO2 less than or equal to 40%, SpO2 greater than or equal to 90%, pH greater than or equal to 7.35 and RR less than or equal to 35 breaths/min, with stable haemodynamics and clear consciousness), at which time they were extubated. Participants in the NPPV group were extubated and were switched to mask NPPV with PS + PEEP. In both groups, investigators closely monitored the time infection was brought under control, blood gases and mechanical ventilation parameters | |
| Outcomes | 1. Time to control of lung infection 2. Length of ICU stay 3. Duration of mechanical ventilation 4. Mortality 5. VAP | |
| Notes | ||
| Risk of bias | ||
| Bias | Authors' judgement | Support for judgement |
| Random sequence generation (selection bias) | Unclear risk | Reported in the abstract that participants were "randomly assigned" and that "28 patients were randomized equally in 2 groups". No mention is made of sequence generation |
| Allocation concealment (selection bias) | Unclear risk | Not reported |
| Incomplete outcome data (attrition bias) | Low risk | No missing outcome data |
| Selective reporting (reporting bias) | Low risk | The authors reported clinically important outcomes in the context of wanting to explore the effects of and optimal timing for noninvasive weaning |
| Methods | RCT (n = 90) 11 teaching hospitals RICUs, MICUs Allocation concealment not described | |
| Participants | Intubated COPD participants, 85 years of age or younger, with severe hypercapneic respiratory failure due to bronchial pulmonary infection, who were capable of self care in the past year | |
| Interventions | Participants were ventilated with AC (4 to 12 hours) and subsequently with SIMV/PS. Ventiltor rate was gradually decreased to 10 to 12 breaths/min with 10 to 12 cm H2O PS. When the PIC window appeared, participants were randomly assigned to NPPV (BiPAP) or IPPV (continued SIMV/PS). Nonivasive PS (with PEEP of 4 to 6 cm H2O) was adjusted to RR < 28 breaths/min, PaO2 65 to 90 mm Hg and PaCO2 between 45 and 60 mm Hg or at level before extubation. NPPV was considered weaned when PS was decreased until the difference between IPAP and EPAP was less than or equal to 5 cm H2O and the participant was stable. In the IPPV group, participants were weaned using SIMV + PS. Participants were weaned when the SIMV rate had been decreased to 5 breaths/min, the level of PS was 5 to 7 cm H2O and the participant had remained stable for four hours | |
| Outcomes | 1. Hospital mortality | |
| Notes | ||
| Risk of bias | ||
| Bias | Authors' judgement | Support for judgement |
| Random sequence generation (selection bias) | Unclear risk | "A prospective randomized controlled trial was conducted in 11 teaching hospitals." Sequence generation not reported |
| Allocation concealment (selection bias) | Unclear risk | Not reported |
| Incomplete outcome data (attrition bias) | Low risk | No missing outcome data apparent |
| Selective reporting (reporting bias) | Low risk | The authors wanted to examine the feasibility and efficacy of early extubation with sequential NPPV and reported clinically important outcomes |
| Methods | RCT Allocation concealment not described | |
| Participants | Intubated participants with COPD with severe respiratory failure due to pulmonary infection, who were capable of self care in the past year | |
| Interventions | Once pulmonary infection had been significantly controlled (PIC window appeared), participants were randomly assigned to NPPV versus invasive PS. | |
| Outcomes | 1. Hospital mortality | |
| Notes | ||
| Risk of bias | ||
| Bias | Authors' judgement | Support for judgement |
| Random sequence generation (selection bias) | Unclear risk | Prospective, randomized, controlled clinical study. No mention of sequence generation |
| Allocation concealment (selection bias) | Unclear risk | Not reported |
| Incomplete outcome data (attrition bias) | Unclear risk | No denominators reported in binary outcomes |
| Selective reporting (reporting bias) | Low risk | Clinically important outcomes reported |
| Methods | RCT RICU (one hospital) Allocation concealment not described | |
| Participants | COPD participants (nasotracheally intubated) with respiratory failure due to pulmonary infection | |
| Interventions | All participants were initially treated with AC + SIMV + PS with 3 to 5 cm H2O PEEP. After the PIC window (1) full consciousness, effective expectoration, stable haemodynamics, (2) more noticeable absorption of patchy infectious infiltrates compared to before, with no merging shadows and (3) two or more of the following: (a) temperature lower than 38.0°C, (b) peripheral WBC lower than 10.0 × 10⁹/L or percent neutrophils lower than 78.0% and (c) noticeable decrease in the amount of phlegm, the colour of which had turned white or had become lighter and thickness decreased to below grade II) had been reached, participants were randomly assigned to NPPV or IPPV Whereas NPPV was applied with a face or nasal mask in pressure (ST mode), SIMV with PS was used in the IPPV group. IPAP and EPAP were titrated to respiratory condition, arterial gases, RR < 25 to 28 breaths/min, SpO2 > 90 and PaCO2 between 45 and 60 or at baseline. All participants were kept on noninvasive mechanical ventilation for longer than two hours during the initial application. Noninvasive time was gradually decreased and IPAP was gradually decreased until NPPV was stopped when BiPAP time was less than two hours each day and IPAP level was less than 10 cm H2O. Invasive PS was gradually reduced to less than or equal to 10 cm H2O with FiO2 less than or equal to 50% titrated to the same parameters and to a tidal volume of 8 mL/kg. IPPV was stopped when conditions were stable for longer than four hours and participants were able to swallow and expectorate spontaneously | |
| Outcomes | 1. Inpatient mortality | |
| Notes | ||
| Risk of bias | ||
| Bias | Authors' judgement | Support for judgement |
| Random sequence generation (selection bias) | Low risk | Digital table |
| Allocation concealment (selection bias) | Unclear risk | Not reported |
| Incomplete outcome data (attrition bias) | Unclear risk | No denominators reported in binary outcomes |
| Selective reporting (reporting bias) | Low risk | Clinically important outcomes reported |
RCT: randomized controlled trial; COPD: chronic obstructive pulmonary disease; b/min: breaths per minute; PaO2: arterial partial pressure of oxygen; PaCO2: arterial partial pressure of carbon dioxide; RR: respiratory rate; ARF: acute respiratory failure; MV: mechanical ventilation; AC: assist control; PS: pressure support; PAV: proportional assist ventilation; SIMV: synchronized intermittent mandatory ventilation; PEEP: positive end‐expiratory pressure; NPPV: noninvasive positive‐pressure ventilation; IPPV: invasive positive‐pressure ventilation; IPAP: inspiratory positive airway pressure; EPAP: expiratory positive airway pressure; VPAP: ventilator (delivered) positive airway pressure; SB: spontaneous breathing; SBT: spontaneous breathing trial; ST: spontaneous timed; T: timed mode; LOS: length of stay; VAP: ventilator‐associated pneumonia; ETMV: endotracheal mechanical ventilation; ICU: intensive care unit; PIC: pulmonary infection control window; RICU: respiratory intensive care unit; MICU: medical intensive care unit; PaO2: arterial partial pressure of oxygen; PaCO2: arterial partial pressure of carbon dioxide; SpO2: pulse oximetry oxygen saturation; FiO2: fractional concentration of inspired oxygen.
Characteristics of excluded studies [ordered by study ID]
| Study | Reason for exclusion |
| This study randomly assigned postoperatively 100 participants who had undergone coronary artery bypass surgery to the following four groups: (1) recruitment maneuver (RM) with sustained inflation (n = 25), (2) RM combined with NPPV applied for 30‐minute periods every six hours on the first postoperative day after tracheal extubation (n = 25), (3) NPPV after tracheal extubation (n = 25) and (4) a control group that received neither RM or NPPV (n = 25). The authors reported outcomes that included pulmonary function tests, oxygenation index and atelectasis on chest radiograph. This study was excluded because all participants were extubated within six hours of intervention, and because it did not report clinically important outcomes | |
| This trial of 32 elderly participants with ARDS randomly assigned participants to oronasal CPAP or SIMV + PS when the "ARDS control window" appeared. We excluded this trial because it compared extubation versus CPAP with no inspiratory assist. We did not consider CPAP to be a weaning modality | |
| This randomized trial compared noninvasive weaning (using a face mask) versus continued invasive weaning in 32 exclusively tracheostomized participants. We excluded this trial because (1) tracheostomy was an outcome of our review, (2) this study included a high proportion of participants undergoing prolonged mechanical ventilation and (3) interventions were applied in a different manner in the setting of a tracheostomy. For example, participants randomly assigned to noninvasive weaning could have met criteria to return to invasive ventilation per tracheostomy and subsequently could have been returned to noninvasive ventilation. Similarly, participants randomly assigned to invasive weaning could have undergone a series of SBTs before extubation | |
| This trial randomly assigned participants who failed a spontaneous breathing trial to standard treatment (placed back on supported breaths) and compared these participants with those who were extubated and placed on noninvasive ventilation. NPPV was initially set at the same support settings as the ventilator and was reduced accordingly by nursing staff. Conventionally ventilated participants underwent daily spontaneous breathing trials. The trial was aborted after approximately eight participants had been enrolled | |
| This nonrandomized study assessed the role of BIPAP in the management of respiratory failure after cardiovascular surgery. Twenty participants who required respiratory support for longer than 72 hours were studied. BiPAP (n = 8) was compared with unassisted oxygen treatment (n = 12) in the control group. Outcomes reported included respiratory index, alveolar arterial oxygen difference and shunt fraction. This study was excluded as it was not an RCT. In addition, NPPV was not used to facilitate weaning, and physiological end points alone were reported | |
| This RCT evaluated the effects of early application of NPPV on extubation outcome in 93 participants after elective (n = 56) or unplanned (n = 37) extubation. After extubation, participants were randomly assigned to receive NPPV or oxygen therapy. This study did not assess the role of NPPV as a weaning modality | |
| In this study, 60 participants, after cardiac surgery, were randomly assigned to PS‐CPAP or bilevel positive airway pressure, both administered invasively, with bilevel positive airway pressure continued after extubation. Outcomes included blood gases and haemodynamics on arrival to the ICU and one, two, four, six, eight and 12 hours later. This study was excluded, as both treatment groups were predominantly weaned invasively, participants were ventilated for less than 24 hours and the outcomes reported were physiological | |
| This RCT evaluated 572 participants who underwent median sternotomy and hypothermic cardiac arrest for cardiopulmonary bypass. Participants were randomly assigned to receive BiPAP (n = 280) or SIMV with PS (n = 292). Outcomes reported included duration of intubation (reported in hours), proportion of participants extubated within six hours, requirement for postoperative analgesia and reintubation rate. This study did not assess the role of NPPV as a weaning strategy in postoperative participants with respiratory failure | |
| This RCT evaluated 32 participants with COPD requiring intubation for hypercapneic respiratory failure. Participants were randomly assigned to receive BiPAP (n = 19) or conventional therapy (n = 13). Reported outcomes included gas exchange at 45 minutes and 12 hours after extubation and rates of reintubation. This study assessed the role of NPPV not as a weaning strategy, but rather as an aid in transitioning participants to spontaneous breathing. Moreover, in this study, the comparator group was not mechanically ventilated | |
| This RCT compared NPPV and IPPV as early treatment strategies in COPD participants requiring more than 24 hours of MV. The goals of the study were to compare (1) the influence of physiological parameters on the choice of mechanical ventilation strategy in the treatment of COPD and (2) outcomes using the alternative mechanical ventilation strategies. This study evaluated NPPV and IPPV as initial approaches to mechanical ventilation. | |
| In this RCT, 82 participants were randomly assigned to receive NPPV plus standard medical therapy or standard medical therapy (SMT). Outcomes included rate of meeting endotracheal intubation (ETI) criteria, mortality rate, respiratory rate, dyspnoea score and arterial blood gases. This study evaluated the role of NPPV in reducing the rate of ETI criteria, not as a weaning strategy | |
| In this prospective, randomized study, participants received BIPAP or PS in the early postoperative period after undergoing aortocoronary bypass surgery (seven hours plus or minus one hour). Criteria for eligibility included an awake participant with neuromuscular activity. The population studied represents a cohort of participants in the post–acute care setting that did not require formal weaning | |
| Participants were not consistently randomly assigned | |
| This prospective RCT allocated participants requiring MV for longer than 72 hours to receive NPPV or supplemental oxygen, by mask, after achieving criteria for extubation. Proportion of successful extubations, length of ICU stay and hospital mortality were reported. This study did not assess the role of NPPV as a weaning strategy, as the comparative group received unassisted oxygen alone | |
| This multicentre trial, involving 144 participants, randomly assigned participants to receive NPPV for 48 hours after planned extubation or conventional oxygen treatment. This trial did not assess the role of NPPV in weaning participants from mechanical ventilation, and the comparator group received supplemental oxygen alone | |
| This study was a retrospective study that compared participants managed with NPPV (n = 110) and those managed through invasive mechanical ventilation (n = 156). Duration of ventilatory support, hospital and ICU mortality and NPPV failure rate were reported. The study was not randomized | |
| This study compared early extubation and sequential NPPV application versus continued invasive ventilation in 11 participants with exacerbations of COPD due to pulmonary infection. The intervention group was compared with a cohort of 11 participants who continuously received invasive MV after control of pulmonary infection had been achieved. This was not an RCT | |
| This study represents a duplicate publication of Wang 2000 | |
| This study compared standard treatment versus standard treatment with NPPV and did not include invasively ventilated participants | |
| This study was a prospective cohort study that included 20 invasively ventilated COPD participants with respiratory failure. Reported outcomes included ventilation and oxygenation index, duration of ETMV, total duration of mechanical ventilation, hospital LOS and rates of reintubation and VAP. This study was excluded, as it was not randomized |
BiPAP: bilevel positive airway pressure; RCT: randomized controlled trial; NPPV: noninvasive positive‐pressure ventilation; SIMV: synchronized intermittent mandatory ventilation; PS: pressure support; ARF: acute respiratory failure; ICU: intensive care unit; COPD: chronic obstructive pulmonary disease; MV: mechanical ventilation.
Characteristics of ongoing studies [ordered by study ID]
| Trial name or title | Protocolized trial of invasive and noninvasive weaning off ventilation: the BREATHE trial |
| Methods | RCT (n = 920) http://www.warwick.ac.uk/breathe Allocation concealment not described |
| Participants | Participants with respiratory failure who received invasive ventilation for longer than 48 hours (from the time of intubation) and who failed a spontaneous breathing test (SBT) Inclusion criteria: 1. Male and female participants, age > 16 years 2. Participants with respiratory failure who had received invasive ventilation for longer than 48 hours (from intubation) 3. Failure of an SBT 4. Provision of written informed consent Exclusion criteria: 1. Presence of a tracheostomy 2. Profound neurological deficits 3. Any absolute contraindication to NIV 4. Home ventilation before ICU admission 5. Decision not to reintubate or withdrawal of care 6. Further surgery/procedure requiring sedation planned in the next 48 hours 7. Previous participation in the trial |
| Interventions | Invasive versus noninvasive weaning Protocolized invasive weaning arm: The participant will be restarted on PS ventilation at the previous settings. The level of PS will be titrated to achieve comfort and RR < 30 breaths/min. Causes for distress/fatigue/weaning failure will be sought and corrective treatments initiated as appropriate. The participant will be reassessed every two hours. If no signs of distress are noted, the level of PS will be reduced by 2 cm H2O. If at any stage the participant develops distress/fatigue, the PS will be increased by 2 cm H2O. FiO2 will be titrated to maintain SaO2 > 90%. A further SBT will take place each morning. This cycle will continue until the participant has been extubated (passing an SBT or tolerating PS 5 cm H2O) or a tracheostomy has been performed Protocolized noninvasive weaning arm: Participants will be extubated and immediately provided with NIV with an equivalent level of PS and PEEP to the ventilator settings before extubation. After two hours, if no signs of distress/fatigue are observed, the NIV interface will be removed and the participant will undergo a self‐ventilation trial with supplemental oxygen (equivalent to the previous FiO2) via a standard oxygen mask. If no signs of distress or fatigue develop during the self ventilation trial, the participant will continue to receive unsupported ventilation, with inhaled oxygen provided as required. If the participant subsequently develops signs of distress or fatigue, NIV will be restarted (as below). Otherwise, the participant will continue with unsupported self ventilation. FiO2 will be titrated to maintain SaO2 > 90%. If signs of distress or fatigue develop, NIV will be reinstated at the previous settings. The level of PS will be titrated to achieve participant comfort and a RR < 30 breaths/min. Causes for distress/fatigue/weaning failure will be sought and corrective treatments initiated as appropriate. The participant will be reassessed every two hours. If no signs of distress/fatigue are noted, a further trial of self ventilation will be commenced as described above. NIV will be withdrawn when the participant tolerates 12 hours of unsupported spontaneous ventilation In both groups, the active weaning protocol will occur between 8 am and 10 pm. Unless participants develop signs of fatigue or distress, ventilator settings will not be adjusted overnight |
| Outcomes | Primary: time from randomization to liberation from ventilation Secondary Efficacy: 1. Mortality at 30, 90 and 180 days 2. Duration of invasive mechanical ventilation and total ventilator‐free days (invasive and noninvasive ventilation) 3. Time to meeting ICU discharge criteria (defined as no further requirement for level 2/3 care) 4. Proportion of participants receiving antibiotics for presumed respiratory infection and total antibiotic days 5. Reintubation rates (protocolized end point and actual events) 6. Tracheostomy Safety 1. Adverse events 2. Serious adverse events Patient‐focused outcomes Health‐related quality of life, EuroQol, EQ‐5D and SF12 at baseline (estimated) and at three and six months |
| Starting date | 1 January 2013 |
| Contact information | Mrs Beverley Hoddell, Clinical Trials Unit, Warwick Medical School, Gibbet Hill Road, Coventry, UK |
| Notes |
| Trial name or title | NEXT: Comparison of noninvasive positive pressure ventilation for extubated patients who fail a single spontaneous breathing trial versus conventional weaning |
| Methods | RCT (n = 8) Stopped early because of the need to fulfil clinical requirements at another hospital |
| Participants | Inclusion criteria: 1. Participants will have to meet the criteria for reducing breathing support—will not be weaned until physiologically ready 2. Participants will have to be on a breathing machine attached to a tube in the mouth for at least 48 hours (participants who are on a breathing machine for < 48 hours are not seen as difficult to wean from a ventilator) 3. Age > 18 years—participant should be able to make own legal judgements regarding treatment 4. Written informed consent obtained 5. Failed an attempt to try breathing without help Exclusion criteria: 1. Participants are generally not suitable for NIV (grade 3/4 intubation) 2. Gastric/oesophageal surgery on this admission 3. Participants who would not be ready for reintubation once extubated (by investigator decision????) |
| Interventions | Noninvasive positive‐pressure ventilation versus conventional weaning |
| Outcomes | Primary outcome: duration of time with breathing support tube in the mouth in days Secondary outcomes: length of stay in the intensive care unit and hospital stay in days |
| Starting date | 13 March 2006 |
| Contact information | Dr Fang Gao Department of Anaesthetics, Birmingham Heartlands Hospital, Heart of England NHS Foundation Trust, Bordelsey Green East, Birmingham, UK |
| Notes |
MV: mechanical ventilation; GCS: Glasgow Coma Scale; PaO2/FiO2: ratio of arterial partial pressure of oxygen to fractional concentration of inspired oxygen; PEEP: positive end‐expiratory pressure; SBT: spontaneous breathing trial; PS: pressure support; NPPV: noninvasive positive‐pressure ventilation; VAP: ventilator‐associated pneumonia; ICU: intensive care unit; LOS: length of stay.
Data and analyses
| Outcome or subgroup title | No. of studies | No. of participants | Statistical method | Effect size |
| 1 Mortality Show forest plot | 16 | Risk Ratio (M‐H, Random, 95% CI) | Subtotals only | |
| Analysis 1.1  Comparison 1 Noninvasive versus invasive weaning, Outcome 1 Mortality. | ||||
| 1.1 COPD | 9 | 632 | Risk Ratio (M‐H, Random, 95% CI) | 0.36 [0.24, 0.56] |
| 1.2 Mixed | 7 | 362 | Risk Ratio (M‐H, Random, 95% CI) | 0.81 [0.47, 1.40] |
| Outcome or subgroup title | No. of studies | No. of participants | Statistical method | Effect size |
| 1 Weaning failure Show forest plot | 8 | Risk Ratio (M‐H, Random, 95% CI) | Subtotals only | |
| Analysis 2.1  Comparison 2 Noninvasive versus invasive weaning, Outcome 1 Weaning failure. | ||||
| 1.1 COPD | 3 | 351 | Risk Ratio (M‐H, Random, 95% CI) | 0.52 [0.36, 0.74] |
| 1.2 Mixed | 5 | 254 | Risk Ratio (M‐H, Random, 95% CI) | 0.73 [0.35, 1.51] |
| Outcome or subgroup title | No. of studies | No. of participants | Statistical method | Effect size |
| 1 Nosocomial pneumonia Show forest plot | 14 | Risk Ratio (M‐H, Random, 95% CI) | Subtotals only | |
| Analysis 3.1  Comparison 3 Noninvasive versus invasive weaning, Outcome 1 Nosocomial pneumonia. | ||||
| 1.1 COPD | 9 | 632 | Risk Ratio (M‐H, Random, 95% CI) | 0.22 [0.13, 0.37] |
| 1.2 Mixed | 5 | 321 | Risk Ratio (M‐H, Random, 95% CI) | 0.38 [0.15, 0.93] |
| Outcome or subgroup title | No. of studies | No. of participants | Statistical method | Effect size |
| 1 LOS ICU Show forest plot | 13 | Mean Difference (IV, Random, 95% CI) | Subtotals only | |
| Analysis 4.1  Comparison 4 Noninvasive versus invasive weaning, Outcome 1 LOS ICU. | ||||
| 1.1 COPD | 8 | 608 | Mean Difference (IV, Random, 95% CI) | ‐6.66 [‐9.41, ‐3.92] |
| 1.2 Mixed | 5 | 299 | Mean Difference (IV, Random, 95% CI) | ‐3.32 [‐6.78, 0.15] |
| Outcome or subgroup title | No. of studies | No. of participants | Statistical method | Effect size |
| 1 LOS hospital Show forest plot | 10 | Mean Difference (IV, Random, 95% CI) | Subtotals only | |
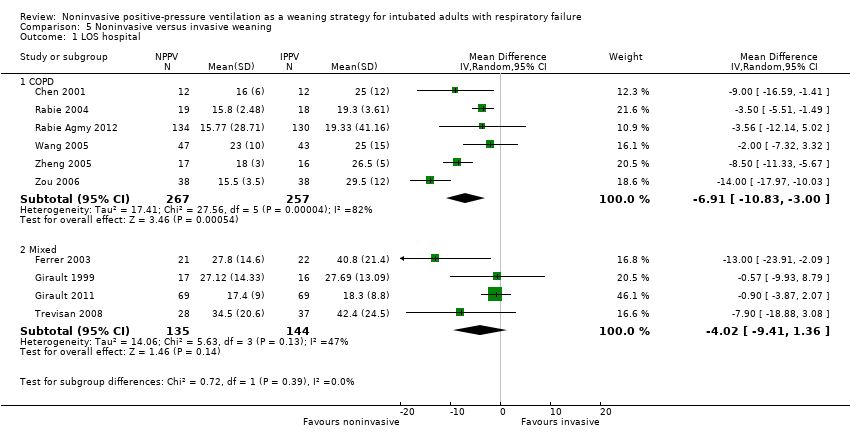
| Analysis 5.1  Comparison 5 Noninvasive versus invasive weaning, Outcome 1 LOS hospital. | ||||
| 1.1 COPD | 6 | 524 | Mean Difference (IV, Random, 95% CI) | ‐6.91 [‐10.83, ‐1.00] |
| 1.2 Mixed | 4 | 279 | Mean Difference (IV, Random, 95% CI) | ‐4.02 [‐9.41, 1.36] |
| Outcome or subgroup title | No. of studies | No. of participants | Statistical method | Effect size |
| 1 Average total duration of mechanical ventilatory support Show forest plot | 7 | Mean Difference (IV, Random, 95% CI) | Subtotals only | |
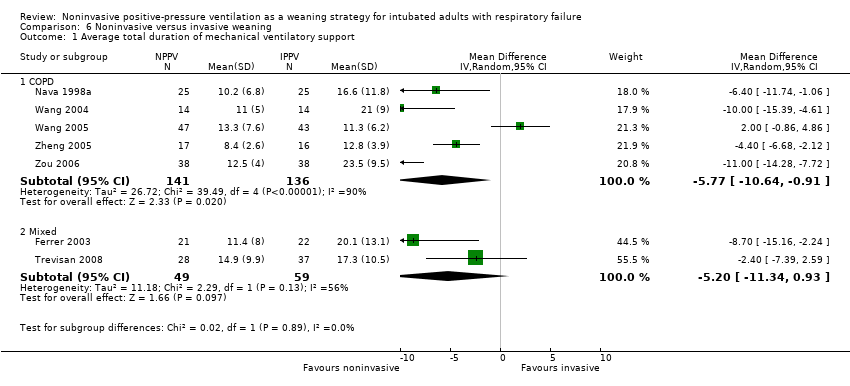
| Analysis 6.1  Comparison 6 Noninvasive versus invasive weaning, Outcome 1 Average total duration of mechanical ventilatory support. | ||||
| 1.1 COPD | 5 | 277 | Mean Difference (IV, Random, 95% CI) | ‐5.77 [‐10.64, ‐0.91] |
| 1.2 Mixed | 2 | 108 | Mean Difference (IV, Random, 95% CI) | ‐5.20 [‐11.34, 0.93] |
| Outcome or subgroup title | No. of studies | No. of participants | Statistical method | Effect size |
| 1 Average duration of ventilation related to weaning Show forest plot | 9 | Mean Difference (IV, Random, 95% CI) | Subtotals only | |
| Analysis 7.1  Comparison 7 Noninvasive versus invasive weaning, Outcome 1 Average duration of ventilation related to weaning. | ||||
| 1.1 COPD | 4 | 355 | Mean Difference (IV, Random, 95% CI) | ‐1.43 [‐3.12, 0.26] |
| 1.2 Mixed | 5 | 290 | Mean Difference (IV, Random, 95% CI) | 0.17 [‐4.01, 4.35] |
| Outcome or subgroup title | No. of studies | No. of participants | Statistical method | Effect size |
| 1 Duration of endotracheal mechanical ventilation Show forest plot | 12 | Mean Difference (IV, Random, 95% CI) | Subtotals only | |
| Analysis 8.1  Comparison 8 Noninvasive versus invasive weaning, Outcome 1 Duration of endotracheal mechanical ventilation. | ||||
| 1.1 COPD | 7 | 558 | Mean Difference (IV, Random, 95% CI) | ‐7.53 [‐11.47, ‐3.60] |
| 1.2 Mixed | 5 | 159 | Mean Difference (IV, Random, 95% CI) | ‐6.85 [‐10.75, ‐2.95] |
| Outcome or subgroup title | No. of studies | No. of participants | Statistical method | Effect size |
| 1 Reintubation Show forest plot | 10 | Risk Ratio (M‐H, Random, 95% CI) | Subtotals only | |
| Analysis 9.1  Comparison 9 Noninvasive versus invasive weaning, Outcome 1 Reintubation. | ||||
| 1.1 COPD | 3 | 430 | Risk Ratio (M‐H, Random, 95% CI) | 0.49 [0.35, 0.70] |
| 1.2 Mixed | 7 | 359 | Risk Ratio (M‐H, Random, 95% CI) | 0.82 [0.47, 1.43] |
| Outcome or subgroup title | No. of studies | No. of participants | Statistical method | Effect size |
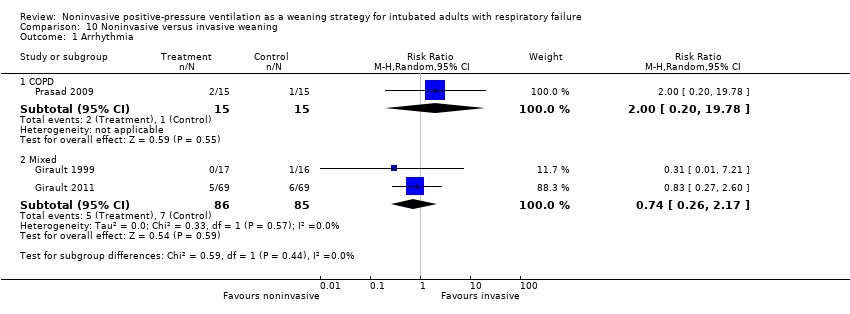
| 1 Arrhythmia Show forest plot | 3 | Risk Ratio (M‐H, Random, 95% CI) | Subtotals only | |
| Analysis 10.1  Comparison 10 Noninvasive versus invasive weaning, Outcome 1 Arrhythmia. | ||||
| 1.1 COPD | 1 | 30 | Risk Ratio (M‐H, Random, 95% CI) | 2.0 [0.20, 19.78] |
| 1.2 Mixed | 2 | 171 | Risk Ratio (M‐H, Random, 95% CI) | 0.74 [0.26, 2.17] |
| Outcome or subgroup title | No. of studies | No. of participants | Statistical method | Effect size |
| 1 Tracheostomy Show forest plot | 7 | Risk Ratio (M‐H, Random, 95% CI) | Subtotals only | |
| Analysis 11.1  Comparison 11 Noninvasive versus invasive weaning, Outcome 1 Tracheostomy. | ||||
| 1.1 COPD | 1 | 264 | Risk Ratio (M‐H, Random, 95% CI) | 0.04 [0.00, 0.60] |
| 1.2 Mixed | 6 | 308 | Risk Ratio (M‐H, Random, 95% CI) | 0.23 [0.09, 0.57] |
| Outcome or subgroup title | No. of studies | No. of participants | Statistical method | Effect size |
| 1 Mortality excluding quasi‐randomized trial Show forest plot | 15 | Risk Ratio (M‐H, Random, 95% CI) | Subtotals only | |
| Analysis 12.1  Comparison 12 Sensitivity analysis: noninvasive versus invasive weaning, Outcome 1 Mortality excluding quasi‐randomized trial. | ||||
| 2 Nosocomial pneumonia excluding quasi‐randomized trial Show forest plot | 13 | Risk Ratio (M‐H, Random, 95% CI) | Subtotals only | |
| Analysis 12.2  Comparison 12 Sensitivity analysis: noninvasive versus invasive weaning, Outcome 2 Nosocomial pneumonia excluding quasi‐randomized trial. | ||||
| Outcome or subgroup title | No. of studies | No. of participants | Statistical method | Effect size |
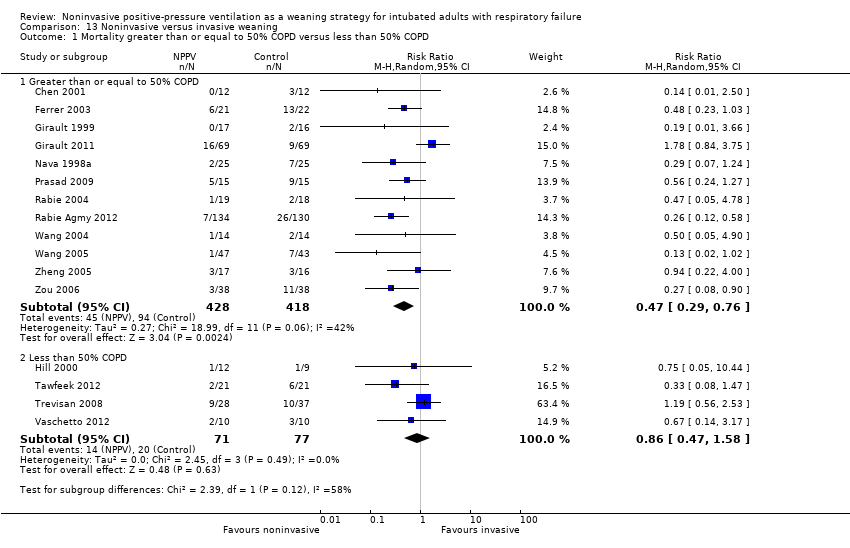
| 1 Mortality greater than or equal to 50% COPD versus less than 50% COPD Show forest plot | 16 | Risk Ratio (M‐H, Random, 95% CI) | Subtotals only | |
| Analysis 13.1  Comparison 13 Noninvasive versus invasive weaning, Outcome 1 Mortality greater than or equal to 50% COPD versus less than 50% COPD. | ||||
| 1.1 Greater than or equal to 50% COPD | 12 | 846 | Risk Ratio (M‐H, Random, 95% CI) | 0.47 [0.29, 0.76] |
| 1.2 Less than 50% COPD | 4 | 148 | Risk Ratio (M‐H, Random, 95% CI) | 0.86 [0.47, 1.58] |
| Outcome or subgroup title | No. of studies | No. of participants | Statistical method | Effect size |
| 1 Weaning failure greater than or equal to 50% COPD Show forest plot | 8 | Risk Ratio (M‐H, Random, 95% CI) | Subtotals only | |
| Analysis 14.1  Comparison 14 Noninvasive versus invasive weaning, Outcome 1 Weaning failure greater than or equal to 50% COPD. | ||||
| 1.1 Greater than or equal to 50% COPD | 5 | 522 | Risk Ratio (M‐H, Random, 95% CI) | 0.68 [0.46, 1.01] |
| 1.2 Less than 50% COPD | 3 | 83 | Risk Ratio (M‐H, Random, 95% CI) | 0.51 [0.12, 2.18] |
| Outcome or subgroup title | No. of studies | No. of participants | Statistical method | Effect size |
| 1 Weaning failure Show forest plot | 8 | Risk Ratio (M‐H, Random, 95% CI) | Subtotals only | |
| Analysis 15.1  Comparison 15 Noninvasive versus invasive weaning, Outcome 1 Weaning failure. | ||||
| 2 Nosocomial pneumonia Show forest plot | 14 | Risk Ratio (M‐H, Random, 95% CI) | Subtotals only | |
| Analysis 15.2  Comparison 15 Noninvasive versus invasive weaning, Outcome 2 Nosocomial pneumonia. | ||||
| 3 Average duration of ventilation related to weaning Show forest plot | 9 | Mean Difference (IV, Random, 95% CI) | Subtotals only | |
| Analysis 15.3  Comparison 15 Noninvasive versus invasive weaning, Outcome 3 Average duration of ventilation related to weaning. | ||||
| 4 Reintubation Show forest plot | 10 | Risk Ratio (M‐H, Random, 95% CI) | Subtotals only | |
| Analysis 15.4  Comparison 15 Noninvasive versus invasive weaning, Outcome 4 Reintubation. | ||||
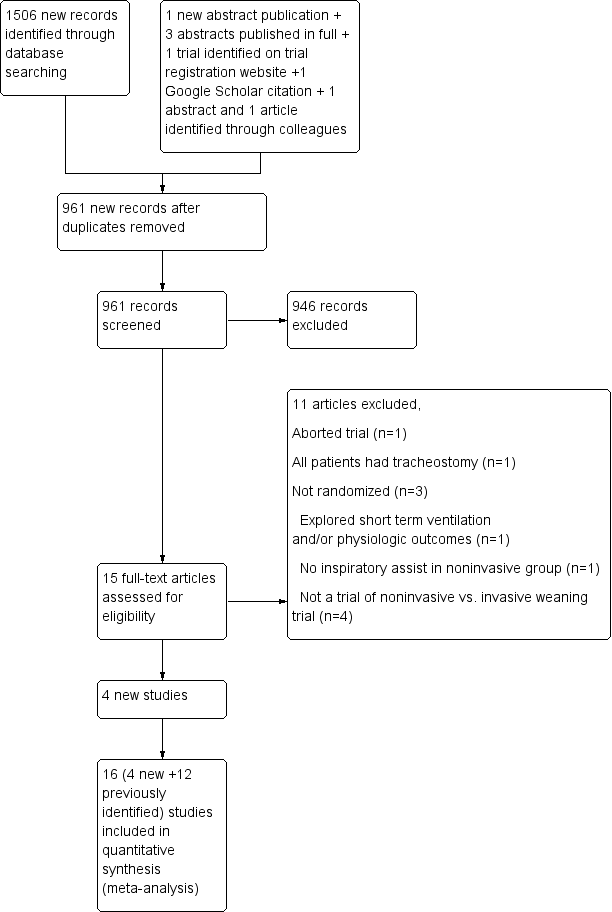
Study flow diagram.

Methodological quality graph: review authors' judgements about each methodological quality item presented as percentages across all included studies.
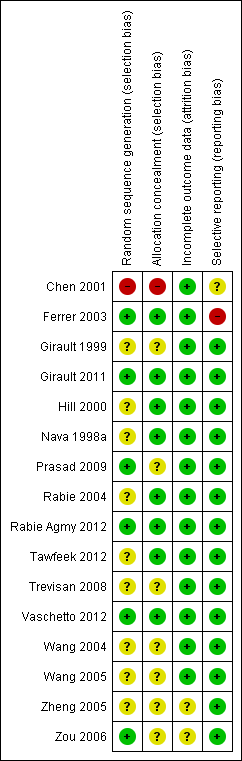
Methodological quality summary: review authors' judgements about each methodological quality item for each included study.

Comparison 1 Noninvasive versus invasive weaning, Outcome 1 Mortality.

Comparison 2 Noninvasive versus invasive weaning, Outcome 1 Weaning failure.

Comparison 3 Noninvasive versus invasive weaning, Outcome 1 Nosocomial pneumonia.

Comparison 4 Noninvasive versus invasive weaning, Outcome 1 LOS ICU.
Comparison 5 Noninvasive versus invasive weaning, Outcome 1 LOS hospital.
Comparison 6 Noninvasive versus invasive weaning, Outcome 1 Average total duration of mechanical ventilatory support.

Comparison 7 Noninvasive versus invasive weaning, Outcome 1 Average duration of ventilation related to weaning.

Comparison 8 Noninvasive versus invasive weaning, Outcome 1 Duration of endotracheal mechanical ventilation.

Comparison 9 Noninvasive versus invasive weaning, Outcome 1 Reintubation.
Comparison 10 Noninvasive versus invasive weaning, Outcome 1 Arrhythmia.

Comparison 11 Noninvasive versus invasive weaning, Outcome 1 Tracheostomy.

Comparison 12 Sensitivity analysis: noninvasive versus invasive weaning, Outcome 1 Mortality excluding quasi‐randomized trial.

Comparison 12 Sensitivity analysis: noninvasive versus invasive weaning, Outcome 2 Nosocomial pneumonia excluding quasi‐randomized trial.
Comparison 13 Noninvasive versus invasive weaning, Outcome 1 Mortality greater than or equal to 50% COPD versus less than 50% COPD.

Comparison 14 Noninvasive versus invasive weaning, Outcome 1 Weaning failure greater than or equal to 50% COPD.
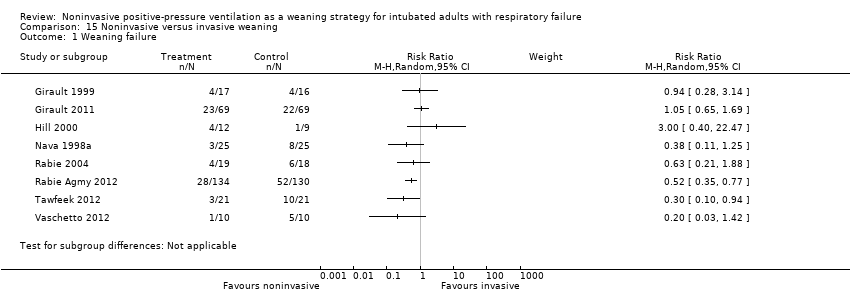
Comparison 15 Noninvasive versus invasive weaning, Outcome 1 Weaning failure.
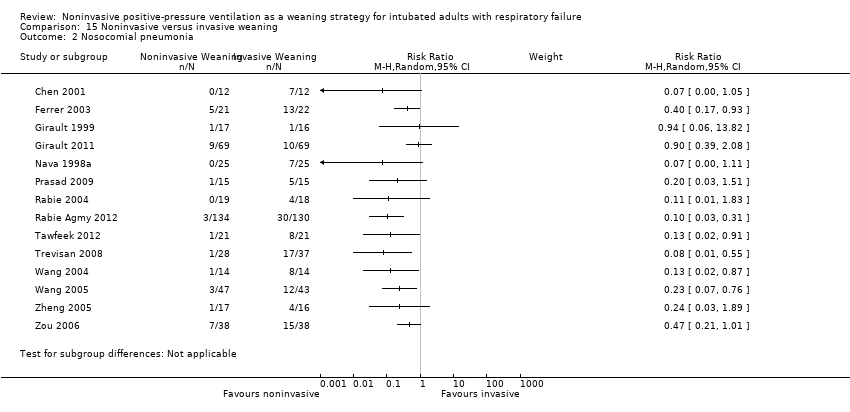
Comparison 15 Noninvasive versus invasive weaning, Outcome 2 Nosocomial pneumonia.
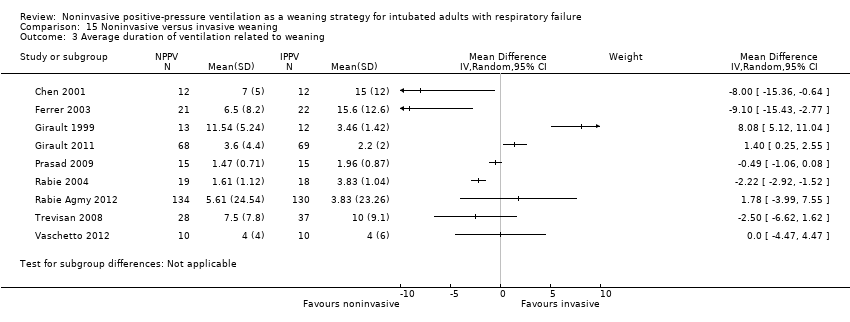
Comparison 15 Noninvasive versus invasive weaning, Outcome 3 Average duration of ventilation related to weaning.
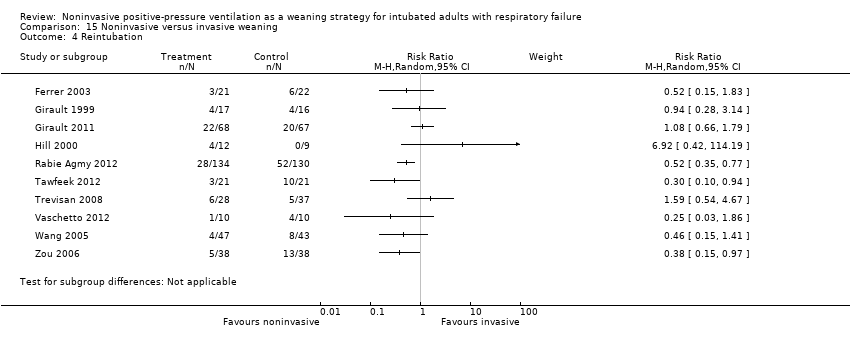
Comparison 15 Noninvasive versus invasive weaning, Outcome 4 Reintubation.
| Noninvasive versus invasive weaning for intubated adults with respiratory failure | ||||||
| Patient or population: intubated adults with respiratory failure | ||||||
| Outcomes | Illustrative comparative risks* (95% CI) | Relative effect | No of participants | Quality of the evidence | Comments | |
| Assumed risk | Corresponding risk | |||||
| Control | Noninvasive versus invasive weaning | |||||
| Mortality—COPD | Study population | RR 0.36 | 632 | ⊕⊕⊕⊝ | ||
| 225 per 1000 | 81 per 1000 | |||||
| Moderate | ||||||
| 200 per 1000 | 72 per 1000 | |||||
| Mortality—mixed | Study population | RR 0.81 | 362 | ⊕⊕⊝⊝ | ||
| 239 per 1000 | 194 per 1000 | |||||
| Moderate | ||||||
| 270 per 1000 | 219 per 1000 | |||||
| *The basis for the assumed risk (e.g. the median control group risk across studies) is provided in footnotes. The corresponding risk (and its 95% confidence interval) is based on the assumed risk in the comparison group and the relative effect of the intervention (and its 95% CI). | ||||||
| GRADE Working Group grades of evidence. | ||||||
| 1Fewer than 300 events. Test for subgroup differences (P = 0.02). | ||||||
| Noninvasive versus invasive weaning for intubated adults with respiratory failure | ||||||
| Patient or population: patients with intubated adults with respiratory failure | ||||||
| Outcomes | Illustrative comparative risks* (95% CI) | Relative effect | No of Participants | Quality of the evidence | Comments | |
| Assumed risk | Corresponding risk | |||||
| Control | Noninvasive versus invasive weaning | |||||
| Weaning failure | Study population | RR 0.63 | 605 | ⊕⊕⊕⊝ | ||
| 362 per 1000 | 228 per 1000 | |||||
| Moderate | ||||||
| 327 per 1000 | 206 per 1000 | |||||
| Nosocomial pneumonia | Study population | RR 0.25 | 953 | ⊕⊕⊝⊝ | ||
| 296 per 1000 | 74 per 1000 | |||||
| Moderate | ||||||
| 307 per 1000 | 77 per 1000 | |||||
| Average duration of ventilation related to weaning | The mean average duration of ventilation related to weaning in the intervention groups was | 645 | ⊕⊕⊝⊝ | |||
| Reintubation | Study population | RR 0.65 | 789 | ⊕⊕⊕⊝ | ||
| 310 per 1000 | 202 per 1000 | |||||
| Moderate | ||||||
| 286 per 1000 | 186 per 1000 | |||||
| *The basis for the assumed risk (e.g. the median control group risk across studies) is provided in footnotes. The corresponding risk (and its 95% confidence interval) is based on the assumed risk in the comparison group and the relative effect of the intervention (and its 95% CI). | ||||||
| GRADE Working Group grades of evidence | ||||||
| 1 Less than 300 events | ||||||
| Study | No of participants | Inclusion criteria (participants) | Inclusion criteria (weaning eligibility) | Experimental strategy | Control strategy |
| Nava 1998 | 50 | Exacerbation of COPD. Intubated for at least 36 to 48 hours | Simple weaning criteria, 1‐hour SBT failure | Noninvasive pressure support on conventional ventilator delivered with face mask | Invasive PS |
| Girault 1999 | 33 | Acute‐on‐chronic respiratory failure (COPD, restrictive, or mixed populations). Intubated for at least 48 hours | Simple weaning criteria, 2‐hour SBT failure | Flow or pressure mode with nasal or face mask | Flow or pressure mode (PS) |
| Hill 2000 | 21 | Acute respiratory failure | 30‐minute SBT failure | NPPV using VPAP in ST‐A mode | Invasive PS |
|
Chen 2001 |
24 |
Exacerbation of COPD. Intubated for at least 48 to 60 hours. Saturation > 88% on FiO2 of 40% |
Day 3+ weaning criteria |
Bilevel NPPV (pressure mode) |
Invasive PS |
| Ferrer 2003 | 43 | Acute respiratory failure and persistent weaning failure. Intubated for at least 72 hours | Two‐hour SBT failure on 3 consecutive days | Bilevel NPPV in ST mode delivered with face or nasal mask | AC or invasive PS |
| Rabie Agmy 2004 | 37 | Exacerbation of COPD | Two‐hour SBT failure | NPPV (proportional assist in timed mode) delivered by face or nasal mask | Invasive PS |
| Wang 2004 | 28 | COPD. Bronchopulmonary infection | PIC window | NPPV (pressure mode) delivered by mask (unspecified)
| SIMV + PS |
| Zheng 2005 | 33 | COPD. Severe pulmonary infection | PIC window | Bilevel NPPV (pressure mode) delivered by face or nasal mask | Invasive PS |
| Zou 2006 | 76 | COPD with severe respiratory failure. Pulmonary infection | PIC window | Bilevel NPPV (pressure, ST mode) delivered by nasal or oronasal mask | SIMV + PS |
| Wang 2005 | 90 | COPD with severe hypercapneic respiratory failure. Pneumonia or purulent bronchitis. Age < 85. Capable of self care in past year | PIC window | Bilevel NPPV (pressure mode) | SIMV + PS |
| Trevisan 2008 | 65 | Invasively ventilated > 48 hours | 30‐minute SBT failure | Bilevel NPPV (pressure mode) delivered by face mask | Invasive mechanical ventilation |
| Prasad 2009 | 30 | COPD. Hypercapneic respiratory failure | Two‐hour SBT failure | Bilevel NPPV (pressure mode) delivered by full face mask | Invasive PS |
| Girault 2011 | 138 | Chronic hypercapneic respiratory failure invasively ventilated for at least 48 hours | Two‐hour SBT failure | Noninvasive PS ± PEEP or bilevel NIV with face mask (initial choice) | Invasive PS with once‐daily SBT with T‐piece or PS ± PEEP |
| Rabie Agmy 2012 | 264 | Acute‐on‐chronic exacerbation of COPD
| Two‐hour SBT failure
| NPPV (pressure, ST mode) | Invasive PS |
| Tawfeek 2012 | 42 | Invasively ventilated for > 48 hours
| Two‐hour SBT failure
| Noninvasive PAV ventilation delivered by face mask | SIMV |
| Vaschetto 2012 | 20 | Hypoxemic respiratory failure invasively ventilated for at least 48 hours | PS with PEEP + inspiratory support, < 25 cm H2O
PEEP 8 to 13 cm H2O
PaO2/FiO2 200 to 300 mm Hg with FiO2< 0.6 | Helmet NPPV | Invasive PS with SBT when P/F ratio > 250 mm Hg |
| COPD = chronic obstructive pulmonary disease; NPPV = noninvasive positive‐pressure ventilation; PS = pressure support; PEEP = positive end‐expiratory pressure; PIC = pulmonary infection control window; ST = spontaneous timed; AC = assist control; SIMV = synchronized intermittent mandatory ventilation; P/F ratio = ratio of arterial concentration of oxygen to fractional concentration of oxygen administered; SBT = spontaneous breathing trial; PAV = proportional assist ventilation. | |||||
| Outcome or subgroup title | No. of studies | No. of participants | Statistical method | Effect size |
| 1 Mortality Show forest plot | 16 | Risk Ratio (M‐H, Random, 95% CI) | Subtotals only | |
| 1.1 COPD | 9 | 632 | Risk Ratio (M‐H, Random, 95% CI) | 0.36 [0.24, 0.56] |
| 1.2 Mixed | 7 | 362 | Risk Ratio (M‐H, Random, 95% CI) | 0.81 [0.47, 1.40] |
| Outcome or subgroup title | No. of studies | No. of participants | Statistical method | Effect size |
| 1 Weaning failure Show forest plot | 8 | Risk Ratio (M‐H, Random, 95% CI) | Subtotals only | |
| 1.1 COPD | 3 | 351 | Risk Ratio (M‐H, Random, 95% CI) | 0.52 [0.36, 0.74] |
| 1.2 Mixed | 5 | 254 | Risk Ratio (M‐H, Random, 95% CI) | 0.73 [0.35, 1.51] |
| Outcome or subgroup title | No. of studies | No. of participants | Statistical method | Effect size |
| 1 Nosocomial pneumonia Show forest plot | 14 | Risk Ratio (M‐H, Random, 95% CI) | Subtotals only | |
| 1.1 COPD | 9 | 632 | Risk Ratio (M‐H, Random, 95% CI) | 0.22 [0.13, 0.37] |
| 1.2 Mixed | 5 | 321 | Risk Ratio (M‐H, Random, 95% CI) | 0.38 [0.15, 0.93] |
| Outcome or subgroup title | No. of studies | No. of participants | Statistical method | Effect size |
| 1 LOS ICU Show forest plot | 13 | Mean Difference (IV, Random, 95% CI) | Subtotals only | |
| 1.1 COPD | 8 | 608 | Mean Difference (IV, Random, 95% CI) | ‐6.66 [‐9.41, ‐3.92] |
| 1.2 Mixed | 5 | 299 | Mean Difference (IV, Random, 95% CI) | ‐3.32 [‐6.78, 0.15] |
| Outcome or subgroup title | No. of studies | No. of participants | Statistical method | Effect size |
| 1 LOS hospital Show forest plot | 10 | Mean Difference (IV, Random, 95% CI) | Subtotals only | |
| 1.1 COPD | 6 | 524 | Mean Difference (IV, Random, 95% CI) | ‐6.91 [‐10.83, ‐1.00] |
| 1.2 Mixed | 4 | 279 | Mean Difference (IV, Random, 95% CI) | ‐4.02 [‐9.41, 1.36] |
| Outcome or subgroup title | No. of studies | No. of participants | Statistical method | Effect size |
| 1 Average total duration of mechanical ventilatory support Show forest plot | 7 | Mean Difference (IV, Random, 95% CI) | Subtotals only | |
| 1.1 COPD | 5 | 277 | Mean Difference (IV, Random, 95% CI) | ‐5.77 [‐10.64, ‐0.91] |
| 1.2 Mixed | 2 | 108 | Mean Difference (IV, Random, 95% CI) | ‐5.20 [‐11.34, 0.93] |
| Outcome or subgroup title | No. of studies | No. of participants | Statistical method | Effect size |
| 1 Average duration of ventilation related to weaning Show forest plot | 9 | Mean Difference (IV, Random, 95% CI) | Subtotals only | |
| 1.1 COPD | 4 | 355 | Mean Difference (IV, Random, 95% CI) | ‐1.43 [‐3.12, 0.26] |
| 1.2 Mixed | 5 | 290 | Mean Difference (IV, Random, 95% CI) | 0.17 [‐4.01, 4.35] |
| Outcome or subgroup title | No. of studies | No. of participants | Statistical method | Effect size |
| 1 Duration of endotracheal mechanical ventilation Show forest plot | 12 | Mean Difference (IV, Random, 95% CI) | Subtotals only | |
| 1.1 COPD | 7 | 558 | Mean Difference (IV, Random, 95% CI) | ‐7.53 [‐11.47, ‐3.60] |
| 1.2 Mixed | 5 | 159 | Mean Difference (IV, Random, 95% CI) | ‐6.85 [‐10.75, ‐2.95] |
| Outcome or subgroup title | No. of studies | No. of participants | Statistical method | Effect size |
| 1 Reintubation Show forest plot | 10 | Risk Ratio (M‐H, Random, 95% CI) | Subtotals only | |
| 1.1 COPD | 3 | 430 | Risk Ratio (M‐H, Random, 95% CI) | 0.49 [0.35, 0.70] |
| 1.2 Mixed | 7 | 359 | Risk Ratio (M‐H, Random, 95% CI) | 0.82 [0.47, 1.43] |
| Outcome or subgroup title | No. of studies | No. of participants | Statistical method | Effect size |
| 1 Arrhythmia Show forest plot | 3 | Risk Ratio (M‐H, Random, 95% CI) | Subtotals only | |
| 1.1 COPD | 1 | 30 | Risk Ratio (M‐H, Random, 95% CI) | 2.0 [0.20, 19.78] |
| 1.2 Mixed | 2 | 171 | Risk Ratio (M‐H, Random, 95% CI) | 0.74 [0.26, 2.17] |
| Outcome or subgroup title | No. of studies | No. of participants | Statistical method | Effect size |
| 1 Tracheostomy Show forest plot | 7 | Risk Ratio (M‐H, Random, 95% CI) | Subtotals only | |
| 1.1 COPD | 1 | 264 | Risk Ratio (M‐H, Random, 95% CI) | 0.04 [0.00, 0.60] |
| 1.2 Mixed | 6 | 308 | Risk Ratio (M‐H, Random, 95% CI) | 0.23 [0.09, 0.57] |
| Outcome or subgroup title | No. of studies | No. of participants | Statistical method | Effect size |
| 1 Mortality excluding quasi‐randomized trial Show forest plot | 15 | Risk Ratio (M‐H, Random, 95% CI) | Subtotals only | |
| 2 Nosocomial pneumonia excluding quasi‐randomized trial Show forest plot | 13 | Risk Ratio (M‐H, Random, 95% CI) | Subtotals only | |
| Outcome or subgroup title | No. of studies | No. of participants | Statistical method | Effect size |
| 1 Mortality greater than or equal to 50% COPD versus less than 50% COPD Show forest plot | 16 | Risk Ratio (M‐H, Random, 95% CI) | Subtotals only | |
| 1.1 Greater than or equal to 50% COPD | 12 | 846 | Risk Ratio (M‐H, Random, 95% CI) | 0.47 [0.29, 0.76] |
| 1.2 Less than 50% COPD | 4 | 148 | Risk Ratio (M‐H, Random, 95% CI) | 0.86 [0.47, 1.58] |
| Outcome or subgroup title | No. of studies | No. of participants | Statistical method | Effect size |
| 1 Weaning failure greater than or equal to 50% COPD Show forest plot | 8 | Risk Ratio (M‐H, Random, 95% CI) | Subtotals only | |
| 1.1 Greater than or equal to 50% COPD | 5 | 522 | Risk Ratio (M‐H, Random, 95% CI) | 0.68 [0.46, 1.01] |
| 1.2 Less than 50% COPD | 3 | 83 | Risk Ratio (M‐H, Random, 95% CI) | 0.51 [0.12, 2.18] |
| Outcome or subgroup title | No. of studies | No. of participants | Statistical method | Effect size |
| 1 Weaning failure Show forest plot | 8 | Risk Ratio (M‐H, Random, 95% CI) | Subtotals only | |
| 2 Nosocomial pneumonia Show forest plot | 14 | Risk Ratio (M‐H, Random, 95% CI) | Subtotals only | |
| 3 Average duration of ventilation related to weaning Show forest plot | 9 | Mean Difference (IV, Random, 95% CI) | Subtotals only | |
| 4 Reintubation Show forest plot | 10 | Risk Ratio (M‐H, Random, 95% CI) | Subtotals only | |