Гипербарическая оксигенотерапия при хронических ранах
Appendices
Appendix 1. Original search methods section 2003 and first update 2012
See: Cochrane Wounds Group search strategy.
Original review:
All publications potentially describing RCTs of therapeutic agents for chronic ulcers were sought from the Specialised Trials Register of the Wounds Group. The Wounds Group Trials Register contains citations of trials identified from searches of 19 electronic databases, including MEDLINE, and EMBASE, and through handsearching journals and conference proceedings.
The Cochrane Central Register of Controlled Trials (CENTRAL) was searched; MEDLINE (1966 to 2003) and EMBASE (1974 to 2003) were also searched.
In addition we made a systematic search for relevant controlled trials in specific hyperbaric literature sources:
-
Experts in the field and leading hyperbaric therapy centres (as identified by personal communication and searching the Internet) were contacted and asked for additional relevant data in terms of published or unpublished randomised trials.
-
Relevant hyperbaric textbooks (Kindwall 1999; Jain 1999; Oriani 1996), journals (Undersea and Hyperbaric Medicine, Hyperbaric Medicine Review, South Pacific Underwater Medicine Society (SPUMS) Journal, European Journal of Hyperbaric Medicine and Aviation, Space and Environmental Medicine Journal) and conference proceedings (Undersea and Hyperbaric Medical Society, SPUMS, European Undersea and Baromedical Society, International Congress of Hyperbaric Medicine) published since 1980 were handsearched.
-
Authors of relevant studies were contacted to request details of unpublished or ongoing investigations.
-
Database of randomised controlled trials in hyperbaric medicine was searched (DORCTHIM, Bennett 2003). We used the specific search terms "hyperbaric oxygenation", "wounds and injuries", "ulcer", "skin ulcer", "diabetic foot", "varicose ulcer" and "foot ulcer".
First update searches:
The Cochrane Wounds Group Specialised Register (searched January 12 2012);
The Cochrane Central Register of Controlled Trials (CENTRAL) (The Cochrane Library 2011, Issue 4);
Ovid MEDLINE (1950 to January Week 1 2012);
Ovid MEDLINE (In‐Process & Other Non‐Indexed Citations, January 11, 2012);
Ovid EMBASE (1980 to 2012 Week 01);
EBSCO CINAHL (1982 to January 6 2012).
Appendix 2. Ovid MEDLINE search strategy
1 exp Chronic Disease/
2 exp Wound Healing/
3 and/1‐2
4 exp Skin Ulcer/
5 exp Diabetic Foot/
6 (skin ulcer$ or foot ulcer$ or diabetic foot or varicose ulcer$ or venous ulcer$ or leg ulcer$ or stasis ulcer$ or arterial ulcer$ or (lower extremit$ adj ulcer$) or crural ulcer$ or ulcus cruris).ti,ab.
7 ((ischaemic or ischemic) adj (wound$ or ulcer$)).ti,ab.
8 (bed sore$ or pressure sore$ or pressure ulcer$ or decubitus ulcer$).ti,ab.
9 chronic wound$.ti,ab.
10 (chronic adj3 ulcer$).ti,ab.
11 or/3‐10
12 exp Hyperbaric Oxygenation/
13 (hyperbar$ adj oxygen$).ti,ab.
14 high pressure oxygen$.ti,ab.
15 oxygen.ti.
16 or/12‐15
Appendix 3. Ovid EMBASE search strategy
1 exp Chronic Wound/
2 exp Skin Ulcer/
3 exp Diabetic Foot/
4 (skin ulcer$ or foot ulcer$ or diabetic foot or varicose ulcer$ or venous ulcer$ or leg ulcer$ or stasis ulcer$ or arterial ulcer$ or (lower extremit$ adj ulcer$) or crural ulcer$ or ulcus cruris).ti,ab.
5 ((ischaemic or ischemic) adj (wound$ or ulcer$)).ti,ab.
6 (bed sore$ or pressure sore$ or pressure ulcer$ or decubitus ulcer$).ti,ab.
7 chronic wound$.ti,ab.
8 (chronic adj3 ulcer$).ti,ab.
9 or/1‐8
10 exp hyperbaric oxygen/
11 (hyperbar$ adj oxygen$).ti,ab.
12 high pressure oxygen$.ti,ab.
13 oxygen.ti.
14 or/10‐13
15 9 and 14
Appendix 4. EBSCO CINAHL search strategy
S14 S8 and S13
S13 (S9 or S10 or S11 or S12)
S12 TI oxygen
S11 TI high pressure oxygen or AB high pressure oxygen
S10 TI hyperbar* oxygen* or AB hyperbar* oxygen*
S9 (MH "Hyperbaric Oxygenation")
S8 S1 or S2 or S3 or S4 or S5 or S6 or S7
S7 TI ( chronic wound* or chronic ulcer* ) or AB ( chronic wound* or chronic ulcer* )
S6 TI ( bed sore* or pressure sore* or pressure ulcer* or decubitus ) or AB ( bed sore* or pressure sore* or pressure ulcer* or decubitus )
S5 AB skin ulcer* or foot ulcer* or diabetic foot* or diabetic feet or leg ulcer* or varicose ulcer* or venous ulcer* or stasis ulcer* or arterial ulcer* or ischemic ulcer* or ischaemic ulcer* or lower extremit*
S4 TI skin ulcer* or foot ulcer* or diabetic foot* or diabetic feet or leg ulcer* or varicose ulcer* or venous ulcer* or stasis ulcer* or arterial ulcer* or ischemic ulcer* or ischaemic ulcer* or lower extremit*
S3 (MH "Diabetic Foot")
S2 (MH "Skin Ulcer+")
S1 (MH "Wounds, Chronic")

Methodological quality summary: review authors' judgements about each methodological quality item for each included study.
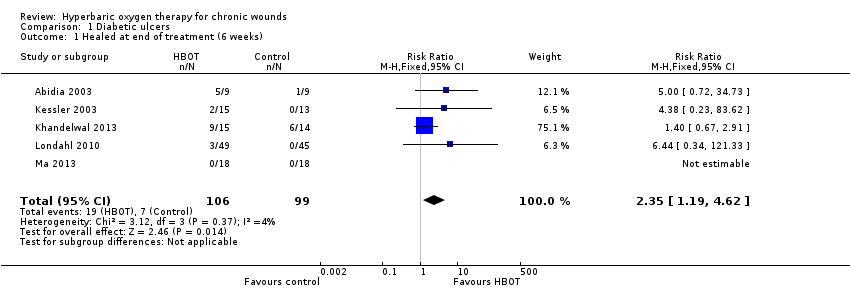
Comparison 1 Diabetic ulcers, Outcome 1 Healed at end of treatment (6 weeks).

Comparison 1 Diabetic ulcers, Outcome 2 Healed at end of treatment. Best‐case..
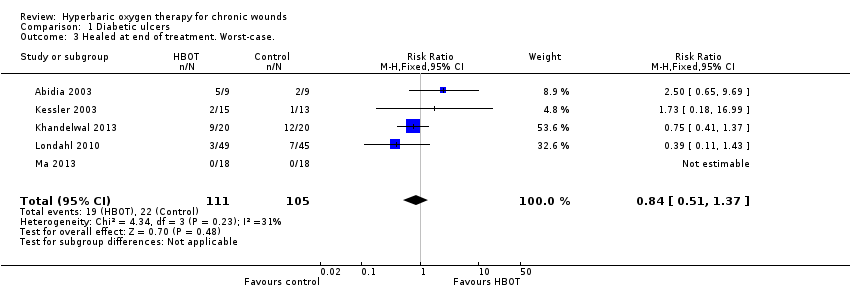
Comparison 1 Diabetic ulcers, Outcome 3 Healed at end of treatment. Worst‐case..

Comparison 1 Diabetic ulcers, Outcome 4 Healed at 6 months.
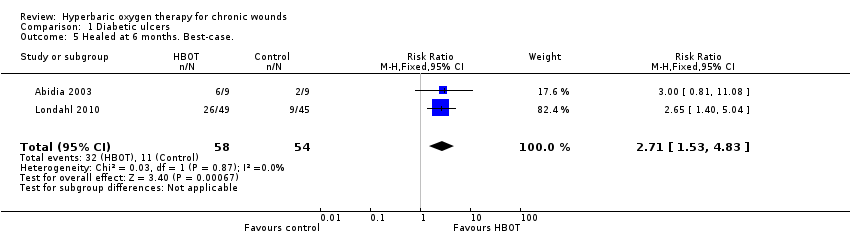
Comparison 1 Diabetic ulcers, Outcome 5 Healed at 6 months. Best‐case..

Comparison 1 Diabetic ulcers, Outcome 6 Healed at 6 months. Worst‐case..

Comparison 1 Diabetic ulcers, Outcome 7 Healed at 1 year.

Comparison 1 Diabetic ulcers, Outcome 8 Healed at 1 year. Peto analysis method..

Comparison 1 Diabetic ulcers, Outcome 9 Healed at 1 year. Best‐case..

Comparison 1 Diabetic ulcers, Outcome 10 Healed at 1 year. Worst‐case..

Comparison 1 Diabetic ulcers, Outcome 11 Major amputations.

Comparison 1 Diabetic ulcers, Outcome 12 Major amputations. Best‐case..

Comparison 1 Diabetic ulcers, Outcome 13 Major amputations. Worst‐case..
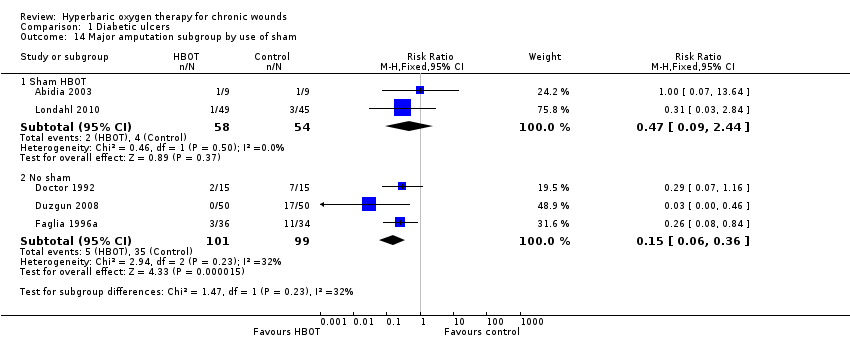
Comparison 1 Diabetic ulcers, Outcome 14 Major amputation subgroup by use of sham.
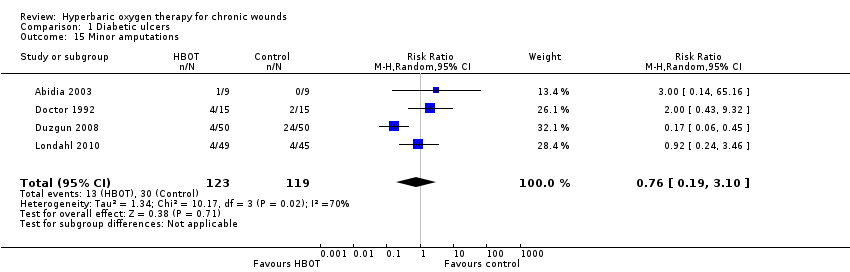
Comparison 1 Diabetic ulcers, Outcome 15 Minor amputations.

Comparison 1 Diabetic ulcers, Outcome 16 Minor amputations. Best‐case..

Comparison 1 Diabetic ulcers, Outcome 17 Minor amputations. Worst‐case..

Comparison 1 Diabetic ulcers, Outcome 18 Transcutaneous oxygen tensions change after treatment.

Comparison 1 Diabetic ulcers, Outcome 19 Absolute difference in transcutaneous oxygen at end of treatment.
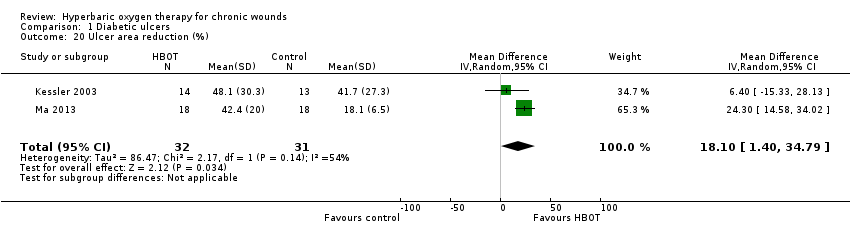
Comparison 1 Diabetic ulcers, Outcome 20 Ulcer area reduction (%).

Comparison 1 Diabetic ulcers, Outcome 21 Quality of life ‐ SF‐36 physical summary score.

Comparison 1 Diabetic ulcers, Outcome 22 Quality of life ‐ SF‐36 mental summary score.

Comparison 2 Venous ulcers, Outcome 1 Healed at 18 weeks.

Comparison 2 Venous ulcers, Outcome 2 Healed at 18 weeks. Best‐case..

Comparison 2 Venous ulcers, Outcome 3 Healed at 18 weeks. Worst‐case..

Comparison 2 Venous ulcers, Outcome 4 Wound size reduction at end treatment (6 weeks).

Comparison 2 Venous ulcers, Outcome 5 Wound size reduction at 18 weeks.

Comparison 3 Mixed ulcers types, Outcome 1 Healed at end of treatment (30 days).

Comparison 3 Mixed ulcers types, Outcome 2 Major amputations.

Comparison 3 Mixed ulcers types, Outcome 3 Periwound transcutaneous oxygen tensions at the end of treatment.

Comparison 3 Mixed ulcers types, Outcome 4 Ulcer area reduction (%).
| Hyperbaric Oxygen Therapy for chronic wounds | ||||||
| Patient or population: patients with chronic wounds | ||||||
| Outcomes | Illustrative comparative risks* (95% CI) | Relative effect | No of Participants | Quality of the evidence | Comments | |
| Assumed risk | Corresponding risk | |||||
| Control | Hyperbaric Oxygen Therapy | |||||
| Diabetic ulcers healed at 1 year. | Study population | RR 9.53 | 212 | ⊕⊕⊕⊝ | ||
| 115 per 1000 | 1000 per 1000 | |||||
| Low | ||||||
| 0 per 1000 | 0 per 1000 | |||||
| High | ||||||
| 0 per 1000 | 0 per 1000 | |||||
| Diabetic ulcers ‐ major amputations | Study population | RR 0.36 | 312 | ⊕⊕⊕⊝ | ||
| 247 per 1000 | 89 per 1000 | |||||
| Low | ||||||
| 0 per 1000 | 0 per 1000 | |||||
| High | ||||||
| 0 per 1000 | 0 per 1000 | |||||
| *The basis for the assumed risk (e.g. the median control group risk across studies) is provided in footnotes. The corresponding risk (and its 95% confidence interval) is based on the assumed risk in the comparison group and the relative effect of the intervention (and its 95% CI). | ||||||
| GRADE Working Group grades of evidence | ||||||
| 1 Analysis comprises small studies, some with zero events in control arm | ||||||
| Study | Missing but included | Missing total | Per cent of entered |
| 0 | 11 | 28% | |
| 0 | 0 | 0 | |
| 0 | 0 | 0 | |
| 0 | 0 | 0 | |
| 0 | 2 | 3% | |
| 0 | 0 | 0 | |
| 0 | 2 | 11% | |
| 0 | 5 | 31% | |
| 0 | 1 | <1% | |
| 0 | 0 | 0 | |
| 19 | 19 | 12% ‐ included in ITT | |
| 0 | 9 | 10% | |
| ITT: intention‐to‐treat | |||
| Outcome or subgroup title | No. of studies | No. of participants | Statistical method | Effect size |
| 1 Healed at end of treatment (6 weeks) Show forest plot | 5 | 205 | Risk Ratio (M‐H, Fixed, 95% CI) | 2.35 [1.19, 4.62] |
| 2 Healed at end of treatment. Best‐case. Show forest plot | 5 | 216 | Risk Ratio (M‐H, Fixed, 95% CI) | 4.61 [2.35, 9.08] |
| 3 Healed at end of treatment. Worst‐case. Show forest plot | 5 | 216 | Risk Ratio (M‐H, Fixed, 95% CI) | 0.84 [0.51, 1.37] |
| 4 Healed at 6 months Show forest plot | 2 | 112 | Risk Ratio (M‐H, Fixed, 95% CI) | 1.70 [0.90, 3.20] |
| 5 Healed at 6 months. Best‐case. Show forest plot | 2 | 112 | Risk Ratio (M‐H, Fixed, 95% CI) | 2.71 [1.53, 4.83] |
| 6 Healed at 6 months. Worst‐case. Show forest plot | 2 | 112 | Risk Ratio (M‐H, Fixed, 95% CI) | 0.93 [0.57, 1.54] |
| 7 Healed at 1 year Show forest plot | 3 | 212 | Risk Ratio (M‐H, Random, 95% CI) | 9.53 [0.44, 207.76] |
| 8 Healed at 1 year. Peto analysis method. Show forest plot | 3 | 212 | Peto Odds Ratio (Peto, Fixed, 95% CI) | 7.58 [4.33, 13.29] |
| 9 Healed at 1 year. Best‐case. Show forest plot | 3 | 212 | Risk Ratio (M‐H, Random, 95% CI) | 10.17 [0.47, 220.48] |
| 10 Healed at 1 year. Worst‐case. Show forest plot | 3 | 212 | Risk Ratio (M‐H, Random, 95% CI) | 6.55 [0.42, 101.71] |
| 11 Major amputations Show forest plot | 5 | 312 | Risk Ratio (M‐H, Random, 95% CI) | 0.36 [0.11, 1.18] |
| 11.1 Subgroup (30+ treatments) | 4 | 282 | Risk Ratio (M‐H, Random, 95% CI) | 0.40 [0.07, 2.23] |
| 11.2 Subgroup (< 30 treatments) | 1 | 30 | Risk Ratio (M‐H, Random, 95% CI) | 0.29 [0.07, 1.16] |
| 12 Major amputations. Best‐case. Show forest plot | 5 | 312 | Risk Ratio (M‐H, Fixed, 95% CI) | 0.20 [0.10, 0.38] |
| 13 Major amputations. Worst‐case. Show forest plot | 5 | 312 | Risk Ratio (M‐H, Random, 95% CI) | 0.62 [0.13, 2.98] |
| 14 Major amputation subgroup by use of sham Show forest plot | 5 | Risk Ratio (M‐H, Fixed, 95% CI) | Subtotals only | |
| 14.1 Sham HBOT | 2 | 112 | Risk Ratio (M‐H, Fixed, 95% CI) | 0.47 [0.09, 2.44] |
| 14.2 No sham | 3 | 200 | Risk Ratio (M‐H, Fixed, 95% CI) | 0.15 [0.06, 0.36] |
| 15 Minor amputations Show forest plot | 4 | 242 | Risk Ratio (M‐H, Random, 95% CI) | 0.76 [0.19, 3.10] |
| 16 Minor amputations. Best‐case. Show forest plot | 4 | 242 | Risk Ratio (M‐H, Random, 95% CI) | 0.55 [0.17, 1.75] |
| 17 Minor amputations. Worst‐case. Show forest plot | 4 | 242 | Risk Ratio (M‐H, Random, 95% CI) | 0.91 [0.21, 4.02] |
| 18 Transcutaneous oxygen tensions change after treatment Show forest plot | 1 | 68 | Mean Difference (IV, Fixed, 95% CI) | 9.0 [4.68, 13.32] |
| 19 Absolute difference in transcutaneous oxygen at end of treatment Show forest plot | 3 | 113 | Mean Difference (IV, Fixed, 95% CI) | 11.76 [5.68, 17.84] |
| 20 Ulcer area reduction (%) Show forest plot | 2 | 63 | Mean Difference (IV, Random, 95% CI) | 18.10 [1.40, 34.79] |
| 21 Quality of life ‐ SF‐36 physical summary score Show forest plot | 1 | 33 | Mean Difference (IV, Fixed, 95% CI) | ‐0.20 [‐8.58, 8.18] |
| 22 Quality of life ‐ SF‐36 mental summary score Show forest plot | 1 | 33 | Mean Difference (IV, Fixed, 95% CI) | 6.60 [‐3.93, 17.13] |
| Outcome or subgroup title | No. of studies | No. of participants | Statistical method | Effect size |
| 1 Healed at 18 weeks Show forest plot | 1 | 16 | Risk Ratio (M‐H, Fixed, 95% CI) | 5.0 [0.28, 90.18] |
| 2 Healed at 18 weeks. Best‐case. Show forest plot | 1 | 16 | Risk Ratio (M‐H, Fixed, 95% CI) | 9.0 [0.56, 143.89] |
| 3 Healed at 18 weeks. Worst‐case. Show forest plot | 1 | 16 | Risk Ratio (M‐H, Fixed, 95% CI) | 0.67 [0.15, 2.98] |
| 4 Wound size reduction at end treatment (6 weeks) Show forest plot | 1 | 16 | Mean Difference (IV, Fixed, 95% CI) | 33.0 [18.97, 47.03] |
| 5 Wound size reduction at 18 weeks Show forest plot | 1 | 11 | Mean Difference (IV, Fixed, 95% CI) | 29.60 [‐22.99, 82.19] |
| Outcome or subgroup title | No. of studies | No. of participants | Statistical method | Effect size |
| 1 Healed at end of treatment (30 days) Show forest plot | 1 | 30 | Risk Ratio (M‐H, Fixed, 95% CI) | 7.0 [0.39, 124.83] |
| 2 Major amputations Show forest plot | 1 | 30 | Risk Ratio (M‐H, Fixed, 95% CI) | 0.2 [0.03, 1.51] |
| 3 Periwound transcutaneous oxygen tensions at the end of treatment Show forest plot | 1 | 30 | Mean Difference (IV, Fixed, 95% CI) | 12.90 [4.00, 21.80] |
| 4 Ulcer area reduction (%) Show forest plot | 1 | 30 | Mean Difference (IV, Fixed, 95% CI) | 61.88 [41.91, 81.85] |