高压氧治疗慢性伤口
摘要
研究背景
慢性伤口是很常见的、严重影响生活质量的健康问题。多种病理都能引起组织的破坏,包括血液供应不良导致伤床供氧不足。高压氧治疗(HBOT)被认为可以改善伤口的供氧,从而改善伤口的愈合。
研究目的
评价辅助性HBOT治疗下肢慢性溃疡的利弊。
检索策略
針對第二次的更新,我們检索了Cochrane Wounds Group Specialised Register (2015年2月18日);Central Register of Controlled Trials (CENTRAL)(The Cochrane Library 2015年第1期);Ovid MEDLINE (1946年至2015年2月17日);Ovid MEDLINE (In‐Process & Other Non‐Indexed Citations, 2015年2月17日);Ovid EMBASE (1974年至2015年2月17日);EBSCO CINAHL (1982年到2015年2月17日)。
纳入排除标准
随机对照试验(RCTs),比较包含HBOT的治疗方案与不包含HBOT的治疗方案(有或没有伪疗法)对慢性伤口愈合的影响。
资料收集与分析
三位综述作者采用Cochrane方法独立评价了相关试验的偏倚风险,并提取了纳入试验的资料。我们通过讨论解决了意见分歧。
主要结果
我们纳入了12项试验,共577名受试者。10项试验(531名受试者)纳入了患有糖尿病足溃疡的患者:有205名受试者的5项试验的汇总数据显示,6周时使用HBOT可增加溃疡愈合率(风险比RR=2.35, 95%CI [1.19, 4.62];P=0.01),但这种好效果在一年的长期随访中并不明显。主要截肢率没有统计学意义上的差异(5项试验,312名受试者的合并数据,RR=0.36, 95%CI [0.11, 1.18])。一项试验(16名受试者)考虑了静脉溃疡,并报告了6周(伤口大小减少)和18周(伤口大小减少和溃疡愈合数量)的数据,并提示仅在6周时HBOT在溃疡面积减少方面有显著的好转(MD=33.00%, 95%CI [18.97, 47.03],P<0.00001)。我们确定了一项试验(30名受试者),该试验纳入了非愈合性糖尿病溃疡以及静脉溃疡("混合溃疡类型")的患者,患者接受30天的治疗。对于这种 "混合性溃疡",在治疗结束时(30天)溃疡面积减少方面,HBOT有显著的效果(MD=61.88%, 95%CI [41.91, 81.85],P<0.00001)。我们没有发现任何考虑动脉和压力溃疡的试验。
作者结论
在糖尿病引起的足部溃疡患者中,HBOT在短期内显著改善了溃疡的愈合情况,但在长期内并没有改善,试验在设计和/或报告中存在各种缺陷,这意味着我们对结果没有把握。目前需要更多的试验来正确评价慢性伤口患者的HBOT效果;这些试验必须有足够的动力和精密设计,以尽量减少各种偏倚。
PICO
简语概要
高压氧疗法治疗慢性伤口
研究背景
慢性伤口是指需要很长时间才能愈合、不愈合或复发的伤口,这些伤口通常是与糖尿病或动脉或静脉疾病(血液循环不良)有关的溃疡。伤口组织缺氧(氧气含量低)是慢性伤口的特征之一。慢性伤口较为常见,患者的生活质量会因此下降。
高压氧治疗(HBOT)针对于那些对其他治疗手段无效的伤口,通过增加氧气供应达到治疗目的。在高压氧治疗过程中,人们在专门设计的加压室中呼吸纯氧(比如用于缓解深海潜水员在上岸后会出现压力问题的加压室)。
系统综述问题
高压氧疗法(HBOT)是否能提高慢性伤口患者的治愈率并降低部分或全部下肢截肢的必要性?这种治疗安全性如何?
我们的发现
在此更新的综述中,我们纳入了十二项随机试验(577名受试者)。纳入的大多数试验都研究了糖尿病患者的足部溃疡(10项试验)。
对于与糖尿病相关的足部溃疡,我们发现HBOT似乎可以在短期内(最多六周)提高治愈率,而长期随访中则不能。HBOT可以降低患有慢性足溃疡的糖尿病患者的大面积截肢次数。
对于腿部静脉疾病导致的慢性伤口,我们发现HBOT可以缩小伤口的大小。
对于因动脉供血不足或慢性压迫性溃疡引起的慢性伤口,我们没有发现证实或反驳HBOT任何效果的证据。
因为我们纳入的评价均未报告任何重大不良事件,所以我们无法评价该疗法的安全性。
本简语概要为更新至15年1月23日。
Authors' conclusions
Summary of findings
| Hyperbaric Oxygen Therapy for chronic wounds | ||||||
| Patient or population: patients with chronic wounds | ||||||
| Outcomes | Illustrative comparative risks* (95% CI) | Relative effect | No of Participants | Quality of the evidence | Comments | |
| Assumed risk | Corresponding risk | |||||
| Control | Hyperbaric Oxygen Therapy | |||||
| Diabetic ulcers healed at 1 year. | Study population | RR 9.53 | 212 | ⊕⊕⊕⊝ | ||
| 115 per 1000 | 1000 per 1000 | |||||
| Low | ||||||
| 0 per 1000 | 0 per 1000 | |||||
| High | ||||||
| 0 per 1000 | 0 per 1000 | |||||
| Diabetic ulcers ‐ major amputations | Study population | RR 0.36 | 312 | ⊕⊕⊕⊝ | ||
| 247 per 1000 | 89 per 1000 | |||||
| Low | ||||||
| 0 per 1000 | 0 per 1000 | |||||
| High | ||||||
| 0 per 1000 | 0 per 1000 | |||||
| *The basis for the assumed risk (e.g. the median control group risk across studies) is provided in footnotes. The corresponding risk (and its 95% confidence interval) is based on the assumed risk in the comparison group and the relative effect of the intervention (and its 95% CI). | ||||||
| GRADE Working Group grades of evidence | ||||||
| 1 Analysis comprises small studies, some with zero events in control arm | ||||||
Background
Description of the condition
A chronic wound is any interruption in the continuity of the body's surface that requires a prolonged time to heal, does not heal, or recurs (Wysocki 1996). For the purpose of this review we have generally defined 'chronic' as those wounds where attempts to heal by means other than hyperbaric oxygen therapy have failed. Chronic wounds arise in a great variety of situations and may be associated with a number of pathological processes. In order to institute appropriate therapy, it is common practice to define such wounds by their most likely aetiology. Thus, wounds developing in the presence of demonstrated arterial insufficiency would be termed 'arterial ulcers' and therapeutic measures would aim to improve ischaemia in the limb in order to promote healing, perhaps through bypass surgery when technically possible (Fowkes 2008). In ulcers associated with venous insufficiency, on the other hand, compression bandaging is likely to be more appropriate (O'Meara 2009; Escaleira 2010). The most common chronic wounds encountered in western medical practice are a consequence of diabetes, arterial and/or venous disease, sustained pressure, and those as a result of therapeutic irradiation for the treatment of tumours. More than one such process may be present in an individual and contribute to the wound and they are more common in the elderly and those with multiple health problems (Dealey 1994; Lauterbach 2010).
Chronic wounds are common and constitute a significant health problem. The true incidence and impact are difficult to assess accurately given the wide range of disease, the fact that much care is delivered at home and that many wound care products are purchased directly in some countries. While most leg ulcers will be the result of venous insufficiency, about 25% are likely to be arterial (Andersson 1993; O'Meara 2009). Wound care in the UK costs in excess of GBP 1 billion per year and therefore treatment options that are both clinically effective and cost‐effective are vital (Banwell 1999). The availability of a great variety of treatment options for chronic wounds is a consequence of the range of different aetiologies. However, there is also a possibility that many of the treatment options are ineffective. By definition, chronic wounds are indolent or progressive and resistant to the wide array of treatments applied. There is a plethora of wound care products available ‐ many at considerable cost. In some areas, dedicated wound care teams have been developed in an attempt to maximise successful healing and contain costs through improved efficiency.
Wound management techniques are continuously being developed. Strategies include treatment of the underlying pathology (e.g. optimal diabetes care with blood glucose control, vein surgery, arterial reconstruction), systemic treatment aimed at improving the local wound environment (e.g. nutrition supplements, pentoxifylline, aspirin, flavonoids, thromboxane alpha‐2 agonists, sulodexide) (Langer 2003; Palfreyman 2006; Jull 2007) and local treatment aimed at improving the wound environment (e.g. dressings, negative local pressure, pressure‐relieving mattresses, ultrasound, application of growth factors, skin‐grafting) (Jull 2008; Ubbink 2008; Akbari Sari 2009; Jones 2009; Cullum 2010; Edwards 2010; Aziz 2011; Dumville 2011a; Dumville 2011b). There are many others. In practice, wound management is often a sequential search for a successful combined approach.
Wound types
Diabetic foot ulcer
One particular type of chronic wound often associated with ischaemia is the foot ulcer associated with diabetes. It has been estimated that 2% of the UK population have diabetes, of whom up to 25% experience foot ulceration and in whom the amputation rate is 15 to 70 times that in the general population (SIGN 1997; Calman 1998; Singh 2005). In diabetes mellitus, the development of foot ulcers is usually the result of peripheral neuropathy and/or peripheral vascular disease. The annual incidence of foot ulcers among people with diabetes has been variously estimated a between 2.5% to 10.7%, and the annual incidence of amputation is 0.25% to 1.8% (Apelqvist 1993; Lee 1993; Humphrey 1996; Boulton 2008). Ulcer care is responsible for a large proportion of the cost of health care for people with diabetes. The relapse rate for diabetic foot ulcers is 66% over five years. Approximately 12% of people with ulcers progress to lower extremity amputation (Apelqvist 1993).
Venous ulcer
Venous ulcers (also known as varicose or stasis ulcers) are caused by venous reflux or obstruction resulting in high venous pressure. Estimates for the prevalence of leg ulcers range between 1.5 and 3 per 1000 population, and 1% to 2% of people will have a venous ulcer at least once during their life (Amsler 2009). The rate increases with age to about 20 per 1000 people aged over 80 years (Callam 1985). It has been estimated that in the UK, the cost to the NHS of treatment for venous ulcers alone may be GBP 300 to 450 million annually (Bosanquet 1992), and that district nurses devote between 25% and 50% of their time to the care of people with ulcers (Lees 1992).
Arterial ulcer
Arterial ulcers are the result of impaired perfusion to the feet or legs and are viewed as one clinical sign of general arteriosclerosis. Intermittent claudication may accompany this disease and can be usually found at earlier stages of the arteriosclerosis, while skin lesions or even necrosis represent an end stage of the peripheral manifestation of general arteriosclerosis.
Pressure ulcer
Pressure ulcers (also known as pressure sores, decubitus ulcers and bed sores) may present as broken or necrotic skin, most often extending to the underlying tissue, including muscles and bone. They are caused by unrelieved pressure or friction and can be found predominantly below the waist and at bony prominences (sacrum, heels, hips). Increased age, reduced mobility and malnutrition constitute relevant risk factors, however, their respective impact on the genesis of ulcers remains unknown (Allman 1997; Reddy 2008). Pressure ulcers can be viewed as typical complications in all healthcare settings with a prevalence of 6% to 10% in National Health Services hospitals in the UK (O'Dea 1999)
Description of the intervention
Hyperbaric oxygen therapy (HBOT) is a treatment modality that has been used in chronic wounds for about 40 years (Kulonen 1968). It is relatively widely available in North America (where there are more than 300 facilities registered with the Undersea and Hyperbaric Medical Society (UHMS)), Russia, China and Cuba, but less well‐established in Europe and Australasia (UHMS 2001a). Treatment involves placing the patient in a compression chamber, increasing the environmental pressure within the chamber, and administering 100% oxygen for respiration. In this way, it is possible to deliver a greatly increased partial pressure of oxygen to the tissues. Typically, treatments involve pressurisation to between 2.0 and 2.5 atmospheres absolute (ATA) for periods between 60 and 120 minutes once or twice daily. A typical course might involve 15 to 30 such treatments.
How the intervention might work
The rationale for HBOT is that, despite the wide range of causative pathologies, the common denominator in many wounds is tissue hypoxia. Wound healing is a complex and incompletely understood process. While it appears that in acute wounds healing is enabled by the initial hypoxia, low pH and high lactate concentrations found in freshly injured tissue (Knighton 1983; Jensen 1986), some elements of tissue repair are extremely oxygen‐dependent, for example collagen elaboration and deposition by fibroblasts (Hunt 1972; Niinikoski 1972a) and bacterial killing by macrophages (Hohn 1976). In a complicated balance between wound hypoxia and peri‐wound oxygenation, it would seem that successful healing relies on adequate tissue oxygenation in the area surrounding the fresh wound. Certainly, wounds that lie in hypoxic tissue beds are those that most often display poor or absent healing (Niinikoski 1972b; Sheffield 1985).
Some causes of tissue hypoxia will be reversible with HBOT, while some will not. One very common cause for peripheral tissue hypoxia is ischaemia due to large vessel disease. In this situation, although the administration of HBOT will result in very high arterial partial pressures of oxygen, this oxygen will not reach the wound bed due to inadequate perfusion. In other clinical situations the cause of tissue hypoxia may be small vessel disease or oedema, and may be overcome by a high driving pressure of oxygen in the arterial blood. This has been demonstrated in hypoxic tissues where regional perfusion is reasonably preserved, through the use of transcutaneous and implantable oxygen electrodes (Sheffield 1985). In wound healing, insufficient supply of oxygen may prevent normal healing processes. The intermittent presentation of oxygen to those hypoxic tissues, therefore, may allow a resumption of normal healing. HBOT administration in man has been demonstrated to cause hyper‐oxygenation of tissue, vasoconstriction, fibroblast activation, down‐regulation of inflammatory cytokines, up‐regulation of growth factors, antibacterial effects, potentiation of antibiotics, and a reduction in leukocyte chemotaxis (Sheffield 1985; Rabkin 1988; Cianci 1993; Stevens 1993; Zhao 1994; Bayati 1998; Dimitrijevich 1999).
Oxygen in high doses is toxic to normally perfused tissue, in particular the brain and lungs. Therefore it is not possible to expose patients to typical wound treatment pressures for longer than one to two hours on a regular basis and the question arises as to how such short exposures could be expected to result in a clinical benefit. There are two principal reasons why this might be so. First, elevation of wound oxygen tension may persist for some hours following HBOT and so exert therapeutic effects for rather longer than might be expected (Siddiqui 1997). Second, there is experimental evidence that repeated 'on‐off' exposures do produce an environment favourable to healing when compared to oxygen or air at normobaric pressure. In a rabbit model where wounds were produced by irradiation to the lower face, Marx 1990 assessed the angiogenic properties of normobaric oxygen (100% oxygen at 1 ATA for 90 minutes daily) and hyperbaric oxygen (100% oxygen at 2.4 ATA for 90 minutes daily for 20 days), as compared with air‐breathing controls. Results indicated that normobaric oxygen had no angiogenic properties above the normal revascularisation of irradiated tissue than air‐breathing controls (P = 0.89). Hyperbaric oxygen demonstrated an eight‐ to nine‐fold increased vascular density over both normobaric oxygen and air‐breathing controls (P = 0.001).
Why it is important to do this review
HBOT is always presented as an adjunctive therapy to normal wound care measures, and is not proposed as an alternative therapy capable of inducing healing in the absence of good wound care (UHMS 2001). Using both clinical assessment and investigations designed to confirm significant peri‐wound hypoxia, hyperbaric practitioners attempt to select those wounds where a response to HBOT is considered likely. Often this decision is based on transcutaneous oxygen measurements of the peri‐wound area, both while air‐breathing at normal pressure and on administration of hyperbaric oxygen. If HBOT can be shown to have a beneficial effect on wound healing, then we hypothesise that the addition of this treatment modality may improve the proportion of wounds that achieve healing and thereby enhance the quality of life in such selected participants. One review suggests the addition of HBOT may reduce the overall costs associated with the treatment of diabetic ulcers (Chuck 2008).
HBOT is associated with some risk of adverse effects including damage to the ears, sinuses and lungs from the effects of pressure, temporary worsening of short‐sightedness, claustrophobia and oxygen poisoning (Clarke 2003). Although serious adverse events are rare, HBOT cannot be regarded as an entirely benign intervention. Furthermore, as an adjunct to standard therapy HBOT may be associated with increased costs, and any cost/benefit advantage should be carefully assessed. The administration of HBOT for people with chronic wounds remains controversial. While much of the justification derives from pathophysiology and anecdote, there have been a number of attempts to demonstrate a beneficial effect in formal clinical trials in a variety of disease states. In this review we have limited our interest to those chronic wounds associated with diabetes mellitus, peripheral arterial and venous disease and pressure‐related ulcers. The treatment of wounds related to therapeutic irradiation will be the subject of a separate review.
Objectives
The aim of this review was to assess the evidence for the benefit of hyperbaric oxygen treatment (HBOT) for the treatment of chronic wounds. Does HBOT:
-
increase the rate of healing of diabetic foot ulcers?
-
increase the rate of healing of venous leg ulcers?
-
increase the rate of healing of arterial ulcers of the lower limb?
-
increase the rate of healing of pressure ulcers?
-
reduce the proportion of people with diabetic foot ulcers who undergo partial or total amputation of the lower limb?
-
reduce the proportion of people with arterial ulcers of the lower limb who undergo partial or total amputation of the lower limb?
Is HBOT safe in the short and long term?
Methods
Criteria for considering studies for this review
Types of studies
Randomised controlled trials (RCTs) that compare the effect on chronic wound healing of treatment with HBOT compared with no HBOT.
Types of participants
Any person in any healthcare setting with a chronic wound associated with venous or arterial disease, diabetes mellitus or external pressure. We defined chronic wounds as described in the retrieved papers (prolonged healing or healing by secondary intention), but there must have been some attempt at treatment by other means prior to the application of HBOT.
Types of interventions
Wound care regimens which included HBOT compared with similar regimens that excluded HBOT. Where co‐interventions differed significantly between trials we clearly stated this and discussed the implications.
HBOT administered in a compression chamber between pressures of 1.5 ATA and 3.0 ATA and treatment times between 30 minutes and 120 minutes daily or twice daily. The comparator group was diverse; we accepted any standard treatment regimen designed to promote wound healing. The salient feature of the comparison group was that these measures had failed before enrolment in the trials. We planned subgroup analysis to evaluate the impact of different comparator strategies.
Types of outcome measures
Primary outcomes
Diabetic ulcers:
-
proportion of ulcers healed;
-
proportion of people undergoing major amputation (defined as amputation of the lower or upper extremity above the ankle or the wrist, respectively).
Venous ulcers:
-
proportion of ulcers healed.
Pressure ulcers:
-
proportion of ulcers healed.
Mixed ulcers group:
-
proportion of ulcers healed.
-
proportion of people undergoing major amputation (defined as amputation of the lower or upper extremity above the ankle or the wrist, respectively).
Secondary outcomes
Diabetic ulcers:
-
time to complete healing;
-
wound size reduction;
-
proportion undergoing minor amputation (defined as amputation of a hand or foot or any parts of either);
-
quality of life;
-
transcutaneous oxygen tensions and recurrence rate.
Venous ulcers:
-
time to complete healing;
-
wound size reduction;
-
quality of life;
-
pain;
-
recurrence rate.
Pressure ulcers:
-
time to complete healing;
-
wound size reduction;
-
quality of life;
-
recurrence rate.
Mixed ulcers group:
-
time to complete healing;
-
wound size reduction;
-
proportion undergoing minor amputation (defined as amputation of a hand or foot or any parts of either);
-
quality of life;
-
transcutaneous oxygen tensions and recurrence rate.
Adverse events of HBOT:
-
proportion of people with visual disturbance (short and long‐term);
-
barotrauma (aural, sinus, pulmonary in the short and long‐term);
-
oxygen toxicity (short‐term) with respect to HBOT obtained from the included trials;
-
any other adverse events.
We also examined the proportion of people withdrawn from treatment for any reason and planned to relate such withdrawals to the frequency and dose of HBOT where possible.
Search methods for identification of studies
The search methods section of the original version of this review can be found in Appendix 1.
Electronic searches
For this second update we searched the following electronic databases:
-
The Cochrane Wounds Group Specialised Register (searched 18 February 2015);
-
The Cochrane Central Register of Controlled Trials (CENTRAL) (The Cochrane Library 2015, Issue 1);
-
Ovid MEDLINE (1946 to 17 February 2015);
-
Ovid MEDLINE (In‐Process & Other Non‐Indexed Citations, 17 February 2015);
-
Ovid EMBASE (1974 to 17 February 2015);
-
EBSCO CINAHL (1982 to 17 February 2015).
We used the following search strategy in the Cochrane Central Register of Controlled Trials (CENTRAL):
#1 MeSH descriptor: [Chronic Disease] explode all trees 10595
#2 MeSH descriptor: [Wound Healing] explode all trees 4098
#3 #1 and #2 280
#4 MeSH descriptor: [Skin Ulcer] explode all trees 1720
#5 MeSH descriptor: [Diabetic Foot] explode all trees 433
#6 (skin next ulcer*) or (foot next ulcer*) or (diabetic next (foot or feet)) or (leg next ulcer*) or (varicose next ulcer*) or (venous next ulcer*) or (stasis next ulcer*) or (arterial next ulcer*) 2790
#7 ((ischaemic or ischemic) next (wound* or ulcer*)) 88
#8 (bed next sore*) or (pressure next sore*) or (pressure next ulcer*) or (decubitus next ulcer*) 1174
#9 (chronic next wound*) 292
#10 (chronic near ulcer*) 1099
#11 #3 or #4 or #5 or #6 or #7 or #8 or #9 or #10 4559
#12 MeSH descriptor: [Hyperbaric Oxygenation] explode all trees 358
#13 hyperbar* next oxygen* 751
#14 high next pressure next oxygen* 18
#15 oxygen*:ti 4393
#16 #12 or #13 or #14 or #15 4549
#17 #11 and #16 113
The search strategies for Ovid MEDLINE, Ovid EMBASE and EBSCO CINAHL can be found in Appendix 2; Appendix 3 and Appendix 4 respectively. We combined the Ovid MEDLINE search with the Cochrane Highly Sensitive Search Strategy for identifying randomised trials in MEDLINE: sensitivity‐ and precision‐maximising version (2008 revision) (Lefebvre 2011). We combined the Ovid EMBASE and EBSCO CINAHL searches with the trial filters developed by the Scottish Intercollegiate Guidelines Network (SIGN) (SIGN 2011). There were no restrictions with respect to language, date of publication or trial setting. We contacted authors to discuss any ambiguity about the published data.
Searching other resources
We searched the bibliographies of all retrieved and relevant publications to identify any further eligible trials.
Data collection and analysis
Selection of studies
For the original version of the review, one review author (MB) was responsible for handsearching and identifying appropriate trials for consideration. Three review authors (PK, MB and IR) independently examined the electronic search results and identified potentially relevant trials. We retrieved all comparative clinical trials identified and judged to be potentially relevant in full and three review authors reviewed them independently, two with content expertise in the treatment of chronic wounds with HBOT, one with content expertise in treating chronic wounds without HBOT. In addition, two of the review authors (MB, IR) have expertise in clinical epidemiology. For the review update, four review authors made trial selection decisions (SW, MB, MMSJ, and AS).
Data extraction and management
Using the data extraction form developed for this review, each review author extracted relevant data and made a recommendation for inclusion or exclusion in this review based on an appraisal of the trial methodology. The number of participants originally allocated to the HBOT and control groups was extracted to allow an 'intention‐to‐treat analysis' (ITT) approach in the meta‐analysis (see Dealing with missing data and Data synthesis). We identified losses to follow‐up where this information was reported.
For the update, MB and SW undertook data extraction and this was checked by PK. We settled any differences by consensus. The data extracted included the following.
-
Trial authors
-
Year of publication
-
Study design (RCT)
-
Inclusion criteria for participants
-
Baseline characteristics of participants
-
Numbers recruited and allocated
-
Method of randomisation
-
Method of participant allocation
-
Blinding of participants and trial personnel
-
Details of the intervention (treatment and comparator)
-
Setting of treatment
-
Duration of intervention/follow‐up periods
-
Outcomes measured
-
Number of participants completing
-
Reporting of withdrawals
-
Reasons for participant withdrawal
-
Statistical methods used in the analysis
-
Methods for handling missing data (per‐protocol or ITT analysis)
-
Results per group for each outcome
-
Adverse events
Assessment of risk of bias in included studies
We appraised each included trial to assess the risk of bias as outlined in section 8.5 of the Cochrane Handbook for Systematic Reviews of Interventions (Higgins 2011) and according to the criteria described below. 'Unclear risk' means that insufficient information was available to make a judgement.
1. Random sequence generation (selection bias)
Low risk: adequate sequence generation was reported using random number tables, computer random number generator, coin tossing or card/envelope shuffling.
High risk: used a system involving dates, names or admittance numbers for the allocation of participants. We considered such trials as quasi‐randomised and excluded them from the review.
Unclear risk: did not describe one of the adequate methods but mentioned randomisation.
2. Allocation concealment (selection bias)
Low risk: a randomisation method was described that would not allow an investigator/participant to know or influence allocation to an intervention group before an eligible participant entered the trial, such as central randomisation or serially numbered, opaque, sealed envelopes.
High risk: an inadequate method of allocation was used, such as alternate medical record numbers or unsealed envelopes; or there was information in the trial report indicating that investigators or participants could have influenced group allocation.
Unclear risk: the trial report mentioned randomisation but there was no information on the method used, or a method was reported that was not clearly adequate.
3. Blinding of participants (performance bias and detection bias)
We graded this item as 'low risk' for blinding participants, 'unclear' if the relevant information was not stated in the trial report and 'high risk' for unblinded participants.
4. Blinding of outcome assessors (performance bias and detection bias)
We graded this item as 'low risk' for blinded outcome assessment, 'unclear' if the relevant information was not stated in the trial report and 'high risk' for any statement indicating unblinded outcome assessment.
5. Incomplete outcome data addressed (description of withdrawals)
Low risk: numbers of withdrawals per group with reasons provided; or clear from report that there were no withdrawals.
High risk: some withdrawal evident but numbers per group and reasons not provided.
Unclear risk: unclear from trial report whether there were any withdrawals.
6. Incomplete outcome data addressed (use of intention‐to‐treat (ITT) analysis)
We defined ITT analysis as being conducted when all trial participants were analysed in the group to which they were randomised regardless of which (or how much) of the treatment they actually received, and regardless of other protocol irregularities, such as ineligibility.
Low risk: trial report stated that ITT was undertaken and this was confirmed on trial assessment, or not stated but evident from trial assessment that ITT was undertaken.
High risk: ITT not confirmed on trial assessment (participants who were randomised were not included in the analysis because they did not receive the trial intervention, they withdrew from the trial or were not included because of protocol violation) regardless of whether analysis described as ITT.
Unclear risk: described as ITT analysis, but unable to confirm on trial assessment, or not reported and unable to confirm by trial assessment.
7. Selective reporting
We defined selective reporting as whether all outcomes detailed in an original trial protocol were presented in the published report as follows:
Low risk: all outcomes in trial protocol are reported.
High risk: only certain outcomes from the original protocol (for example outcomes with a statistically significant beneficial effect) are reported
Unclear risk: full trial protocol not available (from trial investigators or a trials register).
In the absence of the availability of a full trial protocol for any included report, we noted whether the results section of the published report presented results for all outcomes that were described in the methods section.
Measures of treatment effect
Dichotomous data
For the dichotomous outcomes we presented the summary estimate as a risk ratio (RR) with 95% confidence intervals (CI). We estimated the RR using the intention‐to‐treat (ITT) data of the treatment group (HBOT) compared with the ITT of the control group. The dichotomous outcomes included the following.
-
Wounds healed
-
Major amputations
-
Minor amputations
-
Ulcer recurrence
-
Adverse events
In the original review we presented a RR of failing to heal. For this update, we presented the RR of healing in order to facilitate ease of interpretation for the reader of the healing outcomes. The interpretation of the RR was that a summary estimate in which HBOT increased the occurrence of healing would have a RR > 1.00 and a summary estimate in which HBOT reduced the occurrence of amputation, ulcer recurrence or adverse events would have a RR < 1.00.
For the dichotomous outcomes, we analysed the number of reported events in each arm against the number of participants originally randomised to that arm at trial enrolment (ITT). We then undertook sensitivity analyses to include people (events) potentially lost to follow‐up (see Dealing with missing data).
Continuous data
Where continuous outcomes were measured in the same way across trials, we presented a mean difference (MD) with 95% CI. We presented a standardised mean difference (SMD) where trials measured the same outcome using different methods. The continuous outcomes included the following.
-
Time to complete healing
-
Ulcer size reduction
-
Quality of life
-
Transcutaneous oxygen tension
-
Pain
Dealing with missing data
For the trials indicating missing data as participants allocated for whom no outcome data were presented, we adopted the ‘best‐case’ and ‘worst‐case’ scenario method cited in section 16.2 in the Cochrane Handbook for Systematic Reviews of Interventions (Higgins 2011). The ‘best‐case’ scenario is that all participants with missing outcomes in the experimental intervention group had good outcomes, and all those with missing outcomes in the control intervention group had poor outcomes. The ‘worst‐case’ scenario is the converse.
Data synthesis
We undertook statistical pooling using Cochrane RevMan software (version 5.3) (RevMan 2014). We assessed statistical between‐trial heterogeneity using the I2 statistic (Higgins 2011). We applied a fixed‐effect model where trials examined the same interventions, the populations and methods described were sufficiently similar, and low levels of between‐trial heterogeneity were evident (I2 ≤ 30%, Higgins 2011). If statistical heterogeneity was detected, we used a random‐effects model to produce an overall summary estimate. As an estimate of the clinical relevance of any difference between experimental intervention and control intervention we calculated the number needed to treat (NNT) with 95% CI as appropriate. We undertook and presented a narrative synthesis of all trials.
Subgroup analysis and investigation of heterogeneity
Since the obtained NNTs or numbers needed to harm (NNHs) differ depending on the underlying risk for an event in the trial population, we considered subgroup analyses due to different baseline risks, in which case we planned to use 'truncated' data restricting the analyses to a predefined control event rate.
Where appropriate data were available, we also considered subgroup analysis based on the following.
-
Wound entry grade or severity using established wound classification systems where the authors have employed those systems.
-
Dose of oxygen received (pressure, time and length of treatment course).
-
Nature of the comparative treatment modalities.
Sensitivity analysis
We undertook sensitivity analysis for the effects of missing data, employing the best‐case and worse‐case scenarios as described above.
Results
Description of studies
Results of the search
In our original report, we identified 26 publications dealing with the treatment of chronic wounds with adjunctive HBOT and for the first update we identified a further 25 publications, for the second update we identified a further 24 publications. Initial examination suggested 31 possible comparative trials where systemic hyperbaric oxygen was employed in at least one arm of the trial. After appraisal of the full report for these trials, we excluded 18 publications. Twelve trials met the inclusion criteria for the review. We identified two published protocols to ongoing trials and added those to Characteristics of ongoing studies for consideration in a subsequent update (O'Reilly 2011; Stoekenbroek 2015).
Included studies
In total, twelve trials contributed to this review and these were published between 1992 (Doctor 1992) and 2014 (Ma 2013). In total, these trials include data on 577 participants, 281 receiving HBOT and 267 receiving control or comparator treatment, and the largest (Duzgun 2008) accounts for 17% of participants. In the reports of Doctor 1992 and Lin 2001, the number of participants randomised to each arm was not specified, and we were unable to obtain this information through contact with the authors. We have assumed an equal distribution for this review. One of the trials included patients with venous ulcers (Hammarlund 1994), and one trial included a mixed group of patients with diabetic and venous ulcers (Kaur 2012), while the other ten included people with diabetic ulcers (See Characteristics of included studies).
Diabetic foot ulcers
Ten trials comparing HBOT with control (either with or without sham) enrolling a total of 531 people with diabetic ulcers were included in this analysis (Abidia 2003; Doctor 1992; Duzgun 2008; Faglia 1996a; Kessler 2003; Lin 2001; Londahl 2010; Khandelwal 2013; Ma 2013; Wang 2011). The treatment pressure and time schedule used for delivery of oxygen varied between trials. Doctor 1992 used 3.0 ATA for 45 minutes, while the remainder used between 2.2 and 2.5 ATA for between 60 and 120 minutes. Nine trials gave between 20 and 40 sessions once or twice daily either five or six days each week, whilst one trial (Doctor 1992) unusually applied four sessions only, over a period of two weeks. Three trials (Abidia 2003; Lin 2001; Londahl 2010) employed a sham treatment in the control group, on the same schedule as the HBOT group. The other seven trials did not employ a sham therapy (Doctor 1992; Faglia 1996a; Kessler 2003; Duzgun 2008; Khandelwal 2013; Ma 2013; Wang 2011).
Inclusion criteria varied in these trials. Doctor 1992 included any person with diabetes with a chronic foot lesion (time not specified); Faglia 1996a included people with diabetes and Wagner grade 2, 3 or 4 lesions (Wagner 1987); Lin 2001 and Kessler 2003 people with "early diabetic feet", Wagner grades 0, 1 or 2, while Duzgun 2008; Abidia 2003 and Londahl 2010 included people with diabetes whose lesions had been present for more than four weeks, six weeks and three months respectively. In addition, Londahl 2010 required evidence of good standard wound care in a specialist clinic setting for a minimum of two months. Exclusion criteria generally followed from the specific inclusions detailed above, but Abidia 2003 also specifically excluded participants for whom vascular surgical procedures were planned and Kessler 2003 excluded all patients with transcutaneous oxygen tensions of < 30 mmHg. Ma 2013 included patients with diagnosed diabetes, at least one full‐thickness wound below the ankle (Wagner grades III or less) for > 3 month, standard care for > 2 month, TcPO2 > 30 mmHg. Khandelwal 2013 included patients with a diabetic foot ulcer of at least 8 weeks duration, patients with only stage III and IV diabetic foot ulcer and the absence of vascular insufficiency.
Overall sample size ranged from 18 participants (Abidia 2003) to 100 participants (Duzgun 2008). Only one trial reported undertaking a sample size calculation, which was for amputation rate (34 in each arm, Faglia 1996a). There is a possibility that some of the included trials may have been underpowered to detect a statistically significant effect of HBOT on healing or amputation rates. Where baseline ulcer size and duration were reported (Abidia 2003; Kessler 2003; Londahl 2010), there were no between‐group imbalances evident from the published report.
Given the different centres involved, the comparator treatment was unlikely to have been exactly the same in any of the trials. One trial did not specify any comparator (Lin 2001). Sixtrials described a comprehensive and specialised multidisciplinary wound management programme to which HBOT was added for the active arm of the trial (Faglia 1996a; Abidia 2003; Kessler 2003; Duzgun 2008; Londahl 2010; Ma 2013), and one specified a surgical and dressing regimen common to both arms (Doctor 1992).
The follow‐up periods varied between trials. Two trials reported data immediately following the course of therapy (Lin 2001; Ma 2013), two trials followed patients to discharge from hospital (Doctor 1992; Faglia 1996a), one followed patients for two weeks after therapy (Kessler 2003), one followed patients for ten weeks or till the ulcers healed (Khandelwal 2013), two gave results at one year (Abidia 2003; Londahl 2010) and one trial followed patients for 22 months (Duzgun 2008). All included trials reported at least one outcome of interest. Other outcomes reported included positive wound cultures (Doctor 1992), number of outpatient visits and cost of wound dressings over one year (Abidia 2003), vascular responsiveness (Abidia 2003), transcutaneous oximetry (Kessler 2003) and laser‐Doppler perfusion scans (Lin 2001).
One trial (86 people) compared HBOT to extracorporeal shockwave therapy (ESWT) in a head‐to‐head manner (Wang 2011). Inclusion criteria were people with chronic non‐healing diabetic foot ulcers of greater than three months duration. HBOT was delivered at ATA 2.5 for 90 minutes, five days per week up to 20 treatments. The trial reported the proportion of ulcers healed at the end of treatment, laser‐Doppler perfusion, and cell proliferation and apoptosis.
Venous ulcers
Hammarlund 1994 used a treatment session of 2.4 ATA for 90 minutes to a total of 30 sessions over six weeks, and employed an air‐breathing sham treatment on the same schedule. The trial recruited 16 participants who were required to have persistent venous ulcers for more than one year with arterial blood pressures at the ankle and great toe within the normal range when compared with upper limb pressure. The ulcers were matched in pairs by size during the randomisation process, and mean wound areas were similar at the time of entry into the trial. Participants were excluded if they were currently smoking or had chronic illnesses such as diabetes or connective tissue disorders. The recruitment period for this trial is not known, but was over one year. The comparator treatment was not specified. Participants were followed up to 18 weeks from enrolment and data were obtained on wound area and the presence or absence of complete healing. The trial did not report undertaking a sample size calculation and may have been underpowered to detect any statistically significant effect of treatment.
Mixed ulcers group
Kaur 2012 included 30 consenting patients with nonhealing ulcers, despite conventional therapy of more than 4 weeks duration and different comorbidities (diabetes, hypertension, varicose vein, vascular insufficiency).The patients were randomized into either the control group (receiving only conventional treatment) or the HBOT group (receiving conventional treatment in addition to HBOT; HBOT was delivered at 2.5 ATA for 90 min, 6 days a week, a total of 30 sessions). The different comorbidities were equally distributed between the experimental and the control group (5 x Diabetes mellitus, 6 x hypertension, 2 x varicose vein, 2 x vascular insufficiency). The study report a sample size calculation for the primary outcome "wound size reduction". Participants were followed until the end of the treatment (30 days).
Excluded studies
We excluded 17 trials: six where allocation was not random (Holbach 1978; Baroni 1987; Oriani 1990; Zamboni 1997; Kalani 2000; Kalani 2002), two where the intervention of interest was topically applied oxygen (Heng 1984; Heng 2000), three where all participants received HBOT (Deng 2006; Efrati 2009; Kaya 2009), one dealing with acute burn wounds (Perrins 1967), one dealing with pelviperineal necrotising infections Cruz 2003, one which was an animal study (Whelan 2001) and one which was a study protocol with no further information available (Mathieu 2011). Three of the remaining reports were excluded as contributing no appropriate outcome data. (Faglia 1996b; Chin 2001) and an approach to contact the authors did not produce further data (see Characteristics of excluded studies).
Risk of bias in included studies
We estimated the risk of bias in each of these trials using the 'Risk of bias' tables and the assessments have been graphically represented in Figure 1.

Methodological quality summary: review authors' judgements about each methodological quality item for each included study.
Allocation
Random sequence generation
Five trials (Faglia 1996a; Kessler 2003; Duzgun 2008; Kaur 2012; Ma 2013) described using random number tables to generate the randomisation sequence and we deemed them to be at low risk of bias for this domain. All of the other included trials did not report how the randomisation sequence was generated and we classified them as at unclear risk of bias.
Allocation concealment
Information that the allocation process was concealed was provided by the trial author for one trial (Lin 2001). We classified this trial as being at low risk of bias for this domain. Two trials reported using sealed envelopes but did not report that the envelopes were sequentially numbered and opaque (Abidia 2003; Londahl 2010). We classified these and all other included trials as at unclear risk of bias.
Blinding
Blinding of participants and personnel
Participants were blind to treatment group allocation in three trials (Hammarlund 1994; Abidia 2003; Londahl 2010) and we therefore classified them as low risk of bias. One trial reported that participants were not blinded and we classified it as high risk (Wang 2011). One trial does not specify the treatment of the control arm and we assessed this study as unclear risk of bias (Lin 2001). All other trials did not offer a sham treatment to the control arm and we therefore classified them as high risk of bias (Doctor 1992; Duzgun 2008; Faglia 1996a; Kaur 2012; Khandelwal 2013; Ma 2013).
Blinding of outcome assessment
Statements that outcome assessors were blind to participant group allocation were reported in three trials that we classified as low risk of bias for this domain (Abidia 2003; Kessler 2003; Londahl 2010). All other included trials did not provide any statement regarding blinding of the outcome assessment and we classified them as at unclear risk of bias.
Incomplete outcome data
Incomplete outcome data reported
The number of participants withdrawing/excluded from each treatment arm, along with reasons, was reported in thee trials (Faglia 1996a; Londahl 2010; Wang 2011). Londahl 2010 reported both an intention‐to‐treat (using all enrolled participants) and a 'per‐protocol' analysis of those receiving at least 35 treatment sessions (11 participants allocated to HBOT and eight to sham). In the other trials there were no withdrawals or loss to follow‐up that appeared in the analysis in any of the trials. One trial reported that all participants completed treatment (Hammarlund 1994). We classified these trials as low risk. One trial (Khandelwal 2013) reported numbers of lost participants during follow‐up, however, without reporting reasons for withdrawal. Therefore, we classified this trial as high risk of bias.All of the other included trials did not provide a statement regarding attrition and we classified them as unclear risk. The numbers of participants lost to final follow‐up are summarised in Table 1. Overall, there were 49 participants lost to final follow‐up (8.5% of the total number enrolled).
| Study | Missing but included | Missing total | Per cent of entered |
| 0 | 11 | 28% | |
| 0 | 0 | 0 | |
| 0 | 0 | 0 | |
| 0 | 0 | 0 | |
| 0 | 2 | 3% | |
| 0 | 0 | 0 | |
| 0 | 2 | 11% | |
| 0 | 5 | 31% | |
| 0 | 1 | <1% | |
| 0 | 0 | 0 | |
| 19 | 19 | 12% ‐ included in ITT | |
| 0 | 9 | 10% |
ITT: intention‐to‐treat
Incomplete outcome data addressed
We classified one trial reporting that all recruited participants completed the intervention (Hammarlund 1994) as at low risk of bias. One trial reporting attrition of 22% in the HBOT arm presented both a per‐protocol (> 35 treatment sessions) and an intention‐to‐treat analysis (Londahl 2010). We also classified this trial as being at low risk of bias. One trial reported an intention‐to‐treat design, but excluded participants who withdrew from the final analysis (Abidia 2003), and two trials indicated that some participants who were randomised were not included in the analysis (Faglia 1996a; Kessler 2003). One trial (Khandelwal 2013) reported numbers of lost participants during follow‐up, however, it is unclear whether the analysis was performed on an intention‐to‐treat basis. We judged these trials as being at high risk of bias. Another trial presenting results for an analysis of completers, reported an imbalance of patient numbers withdrawing and the reasons for withdrawal between treatment arms, this trial was judged to be at high risk of bias (Wang 2011).
Selective reporting
We classified one trial for which a protocol was available as being at low risk of bias (Londahl 2010). For another trial, all outcomes detailed on a trials register were presented in the published report (Wang 2011). We also classified this trial as low risk of bias. For the remainder of the included published trials, no full protocol was available for inspection. As such, we classified all other included trials as unclear risk of bias for this domain.
Effects of interventions
See: Summary of findings for the main comparison Hyperbaric Oxygen Therapy for chronic wounds
Diabetic foot ulcers (10 trials)
Primary outcomes
We did not pre specify in the protocol for this review that we anticipated multiple time points and we have presented data as reported in the included trials.
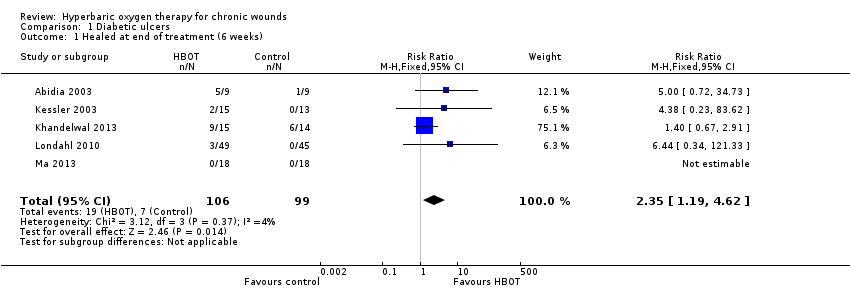
Proportion of ulcers healed at end of treatment period (six weeks)
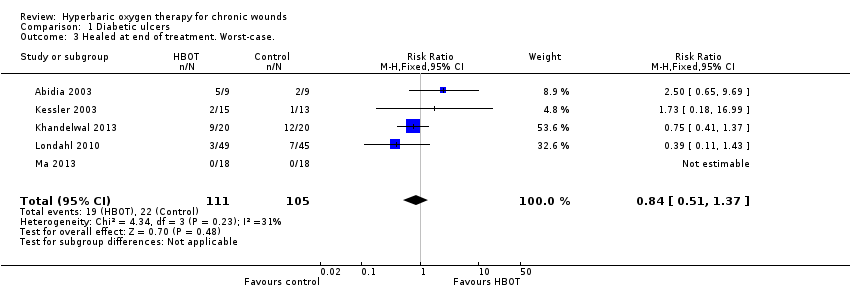
Five trials reported this outcome (Abidia 2003; Kessler 2003; Londahl 2010; Ma 2013; Khandelwal 2013), involving 205 participants (39% of the total people with diabetes in this review), with 99 participants randomised to sham or control and 106 to hyperbaric oxygen therapy (HBOT). The trial by Khandelwal 2013 contributes 75.1% of the weight to this analysis. Ma 2013 reported in both arms of the study no events. Therefore, this study was excluded from this meta‐analysis. There was a statistically significant increase in the proportion of ulcers healed following HBOT compared with control (P = 0.01) (risk ratio (RR) 2.35, 95% confidence interval (CI) 1.19 to 4.62 ; I2 = 4%) (Analysis 1.1). The pre‐planned sensitivity analysis examining the effect of allocation of drop‐outs suggested a benefit with HBOT in the best‐case scenario but not the worst‐case scenario (best‐case RR 4.61, 95% CI 2.35 to 9.08; P <0.00001, worst‐case RR 0.84, 95% CI 0.51 to 1.37, P = 0.48) (Analysis 1.2; Analysis 1.3).
In terms of risk of bias, only two of the trials contributing to these analyses provided detail of the randomisation process (Kessler 2003; Ma 2013) and none reported allocation concealment. Only two studies performed blinding of patients (Abidia 2003; Londahl 2010) and were considered as low risk; Kessler 2003; Khandelwal 2013; and Ma 2013 were assessed as high risk of performance bias due to study design (no sham therapy). Three were considered to be at low risk of bias in terms of blinded outcome assessment (Abidia 2003; Kessler 2003; Londahl 2010) and two were considered to be at unclear risk (Khandelwal 2013; Ma 2013). Only Londahl 2010 presented a valid intention‐to treat by including all participants randomised in the final analysis and was considered at low risk of attrition bias. Abidia 2003 , Kessler 2003, and Khandelwal 2013 each excluded participants who withdrew from their analyses and were at high risk of bias for this domain.
One trial with 41 participants (47 ulcers) assigned to extracorporeal shockwave therapy (ESWT) and 45 participants (47 ulcers) to HBOT (Wang 2011) reported this outcome. The unit of analysis reported was ulcers and the investigators reported a per‐protocol analysis showing a statistically significant difference in the proportion of ulcers healed following HBOT compared with ESWT following treatment (P = 0.003). However, as the number of participants healing was not reported the findings could not be confirmed. This trial was considered to be at high risk of performance bias and at high risk of attrition bias as participants who withdrew were excluded from the analysis.
Proportion of ulcers healed at six months
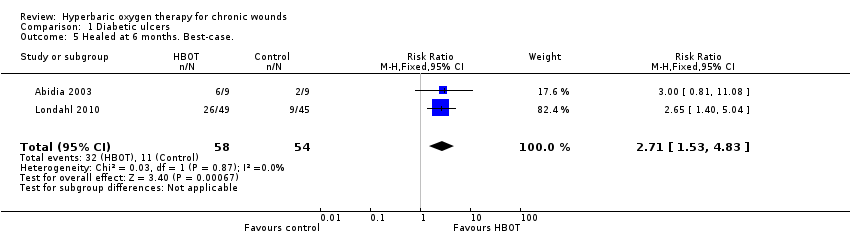
Two trials (112 participants) involved 30% of the total diabetic population in this review (Abidia 2003; Londahl 2010), with 54 participants randomised to sham or control and 58 to HBOT. There was no significant increase in the proportion of ulcers healed following HBOT (RR 1.70, 95% CI 0.90 to 3.20, P = 0.10, I2 = 0%) (Analysis 1.4). The sensitivity analysis examining the effect of allocation of drop‐outs suggested a benefit with HBOT only in the best‐case scenario (RR 2.71, 95% CI 1.53 to 4.83, P = 0.0007, I2 = 0%; worst‐case: RR 0.93, 95% CI 0.57 to 1.54, P = 0.79, I2 = 24%) (Analysis 1.5; Analysis 1.6). Neither trial reported on the randomisation or allocation process, but both reported that all participants and outcome assessors were blind to treatment allocation. However, only the trial by Londahl 2010 presented a valid intention‐to ‐treat.
Proportion of ulcers healed at one year
Three trials involved 212 participants (58% of the total diabetic participants in this review) (Abidia 2003; Duzgun 2008; Londahl 2010), with 104 randomised to sham or control and 108 to HBOT. Two trials reported no ulcers healed in the control arm (Abidia 2003; Duzgun 2008). A high level of between‐trial heterogeneity was evident for this comparison (I2 = 85%). In the original review the data was analysed as failure to heal rather than ulcers healed and demonstrated a significant effect in favour of HBOT. For this update, we presented the RR of healing in order to facilitate ease of interpretation for the reader of the healing outcomes. The interpretation of the RR was that a summary estimate in which HBOT increased the occurrence of healing would have a RR > 1.00. The pooled random‐effects model showed no statistically significant difference between the groups (RR 9.53, 95% CI 0.44 to 207.76; P = 0.15) (Analysis 1.7). This change in the result is mainly due to the fact that there are a small number of trials with small sample sizes, two of which have no events in the control arm. We took statistical advice which indicated that this made the random‐effects model for RR of healing unstable in these circumstances and repeated the analysis using a Peto odds ratio (OR) (OR, 7.58, 95% CI 4.33 to 13.29; P <0.00001) (Analysis 1.8). However, we must approach all these results with caution.
The sensitivity analysis examining the effect of allocation of drop‐outs shows no statistically significant difference between the two groups in either best‐case or worst‐case scenario (Analysis 1.9; Analysis 1.10). The trial by Duzgun 2008 was judged to be at overall unclear risk of bias.
Proportion of participants requiring major amputation
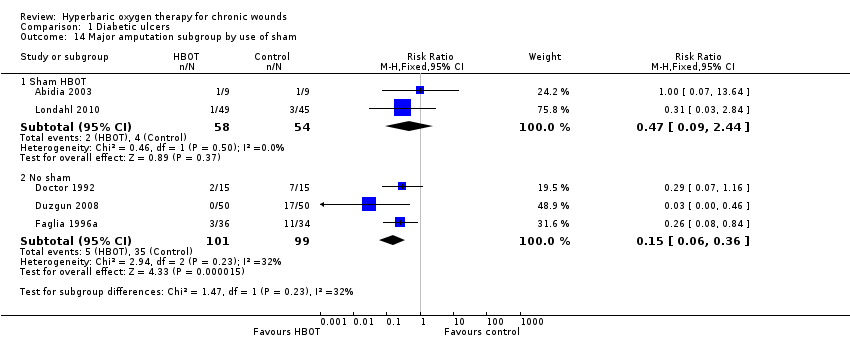
Five trials (309 participants) reported this outcome at final follow‐up (Doctor 1992 (at discharge); Faglia 1996a (seven weeks); Abidia 2003; Londahl 2010 (one year) and Duzgun 2008 (up to 92 weeks)); 159 were randomised to HBOT, 150 to sham or control. There was no statistically significant reduction in amputation rate with the application of HBOT (the RR of major amputation with HBOT was 0.36, 95% CI 0.11 to 1.18, P = 0.08, I2 = 50%) (Analysis 1.11). This result was sensitive to the assumptions made about drop‐outs (best‐case RR of amputation 0.20, 95% CI 0.10 to 0.38, P < 0.00001, worst‐case 0.62, 95% CI 0.13 to 2.98, P = 0.55) (Analysis 1.12; Analysis 1.13). Subgroup analysis by number of treatments did not significantly affect this outcome, with a RR for amputation after 30 or more treatments of 0.40 (95% CI 0.07 to 2.23, P = 0.29). For < 30 treatments the RR was 0.29, 95% CI 0.07 to 1.16, P = 0.08 (Analysis 1.11). A post hoc subgroup analysis according to the use of sham therapy compared with no sham indicated a significant effect of treatment effect only amongst trials with no sham procedure as control (RR of amputation, HBOT compared with sham 0.47, 95% CI 0.09 to 2.44, P = 0.37; RR HBOT compared to control without sham 0.15, 95% CI 0.06 to 0.36, P < 0.0001) (Analysis 1.14). The trial by Doctor 1992 was judged to be at high risk of performance bias and all other methodological quality aspects as unclear risk of bias. The trial by Faglia 1996a was judged as unclear risk of selection bias, performance bias, detection bias and reporting bias, and as at high risk of performance bias and attrition bias as participants who withdrew were excluded from the analysis. The study by Duzgun 2008 were considered as high risk of performance bias as the control arm did not receive a sham treatment.
Secondary outcomes
Proportion of participants requiring minor amputation
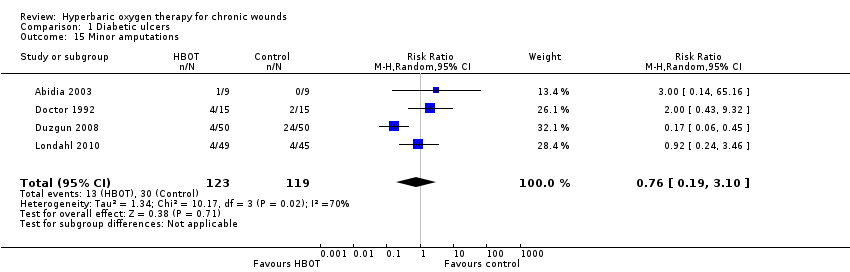
Four trials (242 participants) reported this outcome at final follow‐up (Doctor 1992; Abidia 2003; Duzgun 2008; Londahl 2010), 123 were randomised to HBOT compared with 119 to sham or control. There was no statistically significant change in rates of minor amputation with the application of HBOT (the RR of minor amputation with HBOT was 0.76, 95% CI 0.19 to 3.10, P = 0.71, I2 = 70%) (Analysis 1.15). This result was not sensitive to the allocation of drop‐outs (best‐case RR of amputation 0.55, 95% CI 0.17 to 1.75, P = 0.31, I2 = 63%, worst‐case RR 0.91, 95% CI 0.21 to 4.02, P = 0.90, I2 = 75%) (Analysis 1.16; Analysis 1.17). The analyses for this outcome may be subject to considerable between‐trial heterogeneity as indicated by the high I2 values (random effects), and these pooled results should be treated with caution.
Transcutaneous oxygen tension change in affected foot after treatment
Only one trial contributed results to this outcome (Faglia 1996a) involving 70 participants, 36 randomised to HBOT and 34 to a control regimen. Two participants were not included in the analysis (one control, one HBOT). There was a significantly greater increase in transcutaneous oxygen tension following HBOT (HBOT 14 mmHg, sham 5 mmHg, mean difference (MD) 9 mmHg, 95% CI 4.7 to 13.3, P = 0.0001) (Analysis 1.18). However this is a surrogate outcome measure and was not pre specified in the protocol for this review.
Absolute transcutaneous oxygen tensions in affected foot after treatment
Three trials (117 participants) (Faglia 1996a; Lin 2001; Abidia 2003) randomised 62 people to HBOT, 55 to control. Faglia 1996a contributed 59% of the participants to this analysis, and four participants were not included in the final analysis (two control, two HBOT). Transcutaneous oxygen tensions in the affected foot were significantly higher in those participants who had received HBOT (HBOT 11.8 mmHg higher, 95% CI 5.7 to 17.8, P = 0.0002, I2 = 25.4%) (Analysis 1.19). However this is a surrogate outcome measure and was not pre specified in the protocol for this review.
Wound size reduction
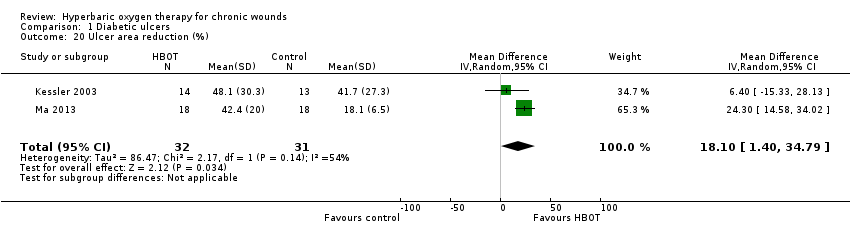
Two trials (63 participants) reported this outcome (Kessler 2003; Ma 2013). The trial from Kessler 2003 (27 participants) suggested ulcer healing was more rapid initially following treatment (after two weeks ulcers in the HBOT group had reduced by 41.8%, compared with 21.7% in the control group). A significant difference was reported (P = 0.04). However, four weeks following the completion of therapy there was no difference in the mean ulcer area reduction between the two groups (HBOT 48.1% versus 41.7%, MD 6.4%, 95% CI ‐15.3 to 28.1) (Analysis 1.20). This is a small trial which did not report a sample size calculation and may have been underpowered to detect any statistically significant effect. Whilst no between‐group differences in mean ulcer size or duration at baseline were evident from the trial report, no covariate adjusted analyses were reported as being undertaken. The trial recruited people with " early diabetic feet", Wagner grades 0, 1 or 2. The addition of the trial from Ma 2013 to the analysis suggested a statistically significant increased mean ulcer area reduction (P = 0.03) following HBOT compared with control at the end of the treatment (MD 18.10, 95% CI 1.40 to 34.79 ; I2 = 54%) (Analysis 1.20).This trial contributes to 65.3% of the weight to this analysis.
Time to complete healing
No data were available for this outcome.
Quality of life
Only one trial reported a quality of life assessment in a subsequent publication to the original article (Londahl 2010). In this trial this outcome was assessed using the 36‐Item Short‐Form Health Survey (McHorney 1993) for 23 of 49 participants assigned to HBOT and 10 of 45 participants assigned to control at the one‐year follow‐up. A significant improvement in the physical function role limitations due to emotional health and mental health summary score was reported in the HBOT group (P < 0.05). No statistically significant improvements were reported for any domain amongst the control group. There was no difference between the two groups on the overall physical summary score (MD ‐0.20, 95% CI ‐8.58 to 8.18, P = 0.96), or the overall mental summary score (MD 6.60, 95% CI ‐3.93 to 17.13, P = 0.22) (Analysis 1.21; Analysis 1.22).
Recurrence rate
No data were available for this outcome.
Venous ulcers (1 trial)
Primary outcomes
Proportion of ulcers healed at 18 weeks
One trial (16 participants) (Hammarlund 1994) randomised nine people to HBOT and eight to sham. There was no statistically significant increase in the proportion of ulcers healed in the HBOT group compared with sham treatment (RR 5.00, 95% CI 0.28 to 90.18, P = 0.28) (Analysis 2.1). The sensitivity analysis examining the effect of allocation of drop‐outs using a best‐case (all drop‐outs in active group deemed successes, all drop‐outs in sham group deemed failures) and worse‐case (all drop‐outs in the active group deemed failures, all in the sham group deemed successes) did not alter the result (best‐case RR 9.00, 95% CI 0.56 to 143.89, P = 0.12, worst‐case RR 0.67, 95% CI 0.15 to 2.98, P = 0.60) (Analysis 2.2; Analysis 2.3).
In terms of risk of bias, the study did not report methods for the randomization process, for concealment of allocation or for blinding of outcome assessors and was considered to be at unclear risk of bias for these domains. However participants were blinded and there were no withdrawals from the study.
Secondary outcomes
Reduction in wound area immediately after treatment (six weeks)
Hammarlund 1994 found a significantly greater reduction in wound area following HBOT. No between‐group differences in mean or median ulcer size were evident at baseline. Ulcer duration at baseline was not reported, although inclusion criteria was for ulcers >1 year. No covariate adjusted analyses were reported. This small trial did not report a sample size calculation and may have been underpowered to detect any statistically significant effect. There was a reduction in wound area in the HBOT group of 35.7% compared with 2.7% in the sham group (MD 33.00%, 95% CI 18.97 to 47.03, P < 0.00001) (Analysis 2.4).
Reduction in wound area at 18 weeks
Hammarlund 1994 reported that five participants were not included in this analysis (three sham, two HBOT). There was no significant difference in wound area reduction (HBOT 55.8%, sham 29.6%; MD 29.6%, 95% CI ‐23.0 to 82.2, P = 0.27) (Analysis 2.5).
Quality of life, pain reduction and recurrence rates for venous ulcers
No data were available for these outcomes.
Mixed ulcers (1 trial)
Primary outcomes
Healed at end of treatment (30 days)
Kaur 2012 enrolled patients with non‐healing diabetic ulcers as well as venous ulcers ("mixed ulcers types") and reported this outcome. The trial involved 30 participants, treated for 30 days, with 15 participants randomised to control and 15 to HBOT.
There was no statistically significant increase in the proportion of ulcers healed following HBOT compared with control (P = 0.19) (RR 7.0, 95% CI 0.39 to 124.83) (Analysis 3.1).
In terms of risk of bias, the study provided details of the randomization process but did not report methods for concealment of allocation. The study was considered to be at unclear risk of bias in terms of blinding of outcome assessors and high risk of bias in terms of blinding of patients and personnel. No withdrawals were described.
Major amputations
Kaur 2012 reported this outcome at the end of treatment (30 days). There was no statistically significant reduction in the amputation rate with the application of HBOT (RR 0.2, 95% CI 0.03 to 1.51, P = 0.12) (Analysis 3.2).
Secondary outcomes
Periwound transcutaneous oxygen tensions at the end of treatment
Kaur 2012 reported after 30 days, periwound TcPO2 improved by 11.8 mgHg in the HBOT group (P = 0.01) and decreased by 5.7 mgHg from baseline value in the control group (P = 0.2). The baseline TcPO2 values were not statistically different between both groups (P = 0.407). The periwound transcutaneous oxygen tensions in the affected tissue were significantly higher in those participants who had received HBOT (HBOT 11.8 mmHg higher, 95% CI 5.7 to 17.8, P = 0.0002, I2 = 25.4%) (Analysis 3.3).
Ulcer area reduction (%)
Kaur 2012 found a significantly greater reduction in wound area following HBOT. No between‐group differences in the wound tissue score were evident at baseline. Ulcer duration at baseline was more than 4 weeks with median wound duration of 2 month (interquartile range (IQR) 1‐60) in the HBOT group compared to 2.5 month (IQR 1‐36) in the control group. There was a reduction in wound area in the HBOT group of 59.27% compared with ‐2.61% in the control group (MD 61.88%, 95% CI 41.91 to 81.85, P < 0.00001) (Analysis 3.4).
Arterial and pressure ulcers
No eligible trials were identified investigating the use of HBOT for these ulcers.
Adverse effects of HBOT
Two trials (Doctor 1992; Abidia 2003) stated explicitly that there were no complications or adverse events as a result of HBOT. Kessler 2003 reported one person in the HBOT group who was removed from the trial due to barotrauma of the ear and in Londahl 2010, two participants were removed from treatment because of claustrophobia ‐ one in each arm of this sham‐controlled trial. Kaur 2012 reported in the HBOT group three patients with ear pain, two patients with claustrophobia, one patient with tinnitus, and one patient with headache. The other trials did not report on adverse events or complications of therapy in either arm.
Summary of Findings Table
We have included a Summary of Findings table in this review (summary of findings Table for the main comparison), which gives a concise overview and synthesis of the volume and quality of the evidence. The Summary of Findings table confirms our conclusion that the evidence is of moderate quality and on balance there is no strong evidence of a benefit of using HBOT for healing foot ulcers in people with diabetes.
Discussion
This review has included data from twelve trials, ten of which recruited people with diabetic foot ulcers. We believe these represent all randomised controlled trials (RCTs) in this area, both published and unpublished at the time of searching the databases. For the update, we presented a risk ratio (RR) of healing with hyperbaric oxygen therapy (HBOT), as opposed to a RR of failing to heal without HBOT (i.e. control) as presented in the original review. This was undertaken in order to facilitate ease of interpretation of the healing outcomes for users of this review. We found evidence from five trials that the addition of HBOT to a standard wound care regimen results in a significant improvement in wound healing by six weeks (RR 2.35; P = 0.01), but this benefit is not evident at longer‐term follow‐up (RR at one year or longer 9.53; P = 0.15). This was in contrast to this outcome presented as the RR of failing to heal with control, as presented in the original review, which was significant. However, the RR of healing at 12 months presented here should be interpreted with caution given that the analyses included trials of varying sizes, some of which had no healing events in the control arm. As such, the pooled estimation may be unreliable. Although we found some indication amongst the included trials that HBOT may decrease the major amputation rate in people with diabetic foot lesions, our pooled estimate was not statistically significant (RR 0.36, 95% CI 0.11 to 1.18, P = 0.08).
We found no evidence that HBOT increases the healing of venous ulcers, arterial or pressure ulcers.
Eleven trials with 491 participants in total were eligible for data pooling according to the planned analyses, and a meta‐analysis was not possible for many of the outcomes of interest for this review. Amongst the majority of the included trials, the reporting of a number of aspects of trial conduct to inform the risk of bias assessment was unclear. Only one of the trials reported sufficient detail to indicate in most of the quality aspects low risk of bias (Londahl 2010; Figure 1). Blinding of participants was only reported in three trials (Hammarlund 1994; Abidia 2003; Londahl 2010) and blinding of outcome assessors was only reported in three trials (Abidia 2003; Kessler 2003; Londahl 2010). Trials where blinding was not undertaken may have introduced a performance and detection bias to the results. It is not clear which of these factors is the more important in determining the different effect on the risk of major amputation when comparing those who were blinded with those who were not (Analysis 1.14). There is also a possibility that some of the included trials may have been underpowered to detect a statistically significant effect of HBOT on healing or amputation rates. Other limitations that should be considered include the variability in the participant inclusion criteria across trials and the nature and timing of outcome assessments. In particular, there is a possibility of clinical heterogeneity due to differential wound size or severity across trials at participant enrolment. The trial by Londahl 2010, for example, excluded all participants at high risk of major amputation. Excluding this trial from the analysis (data not presented) resulted in a significant effect of HBOT on decreasing the risk of major amputation (P = 0.009).
The included trials were published over a 22‐year period up to 2014. We had planned to perform subgroup analyses with respect to wound grade at trial enrolment, oxygen dose (treatment profile and number of treatments) and comparator therapy, however the paucity of eligible trials and poor reporting suggested the majority of these analyses would not be informative, and we only performed some subgroup analyses in diabetic ulcer trials. Overall patient inclusion criteria were not standard across trials and were poorly reported in some trials. The oxygen dose at each treatment was fairly consistent across trials, the lowest being 2.2 ATA for some participants in Faglia 1996a, while the highest was 3.0 ATA in Doctor 1992. The total number of treatments was similar in all trials except Doctor 1992, where only four treatments were administered over four weeks. While subgroup analysis by treatment number suggests the benefit of HBOT on major amputation rate was significant with either the short course or long course (> 30 treatment course: RR 0.40, P = 0.29; < 30 treatment course: RR 0.29, P = 0.08, ), this result should be interpreted with caution given the contribution of the trial by Londahl 2010 previously discussed. While all trials included in the meta‐analysis compared HBOT with some form of 'standard' wound care, these comparator therapies were generally poorly described and could not form the basis for a meaningful subgroup analysis with the exception of the analysis of the use of a HBOT sham or no sham as comparator.
Pooled data for clinical outcomes of interest could only be performed for diabetic foot lesions with respect to the proportion healed, and the risk of major and minor amputation. The analysis of the rate of major amputation was heterogenous (I2 = 50%), suggesting a between‐study variance that could not be explained by random variability. The risk of bias of the included trials was variable. The limited reporting of trial methodology in some reports (Doctor 1992; Duzgun 2008) resulted in an unclear risk of bias associated with the effect estimates these trials contributed to the pooled analyses. There were likely to be clinical differences in the individuals recruited to the included trials. The trial by Londahl 2010 excluded participants where major amputation was likely, while the other trials included a wider range of severity. Subgroup analysis by the number of treatment sessions delivered did not assist in the interpretation of this heterogeneity. Furthermore, it is not clear if the surgical decision to amputate was made while blinded to treatment allocation. This is an important potential source of bias and thus a threat to validity.
In general, the findings of this review are comparable to those of a previous review (Wang 2003). Wang considered all published comparative trials and case series including at least five participants, and concluded that, while the included trials suggested that HBOT might be of benefit in nonhealing diabetic ulcers, the overall trial quality was poor and there was insufficient evidence to recommend an appropriate time to initiate therapy. Further high‐quality RCTs were recommended to examine short and long‐term risks and benefits.
For venous ulceration we retrieved only one small trial (Hammarlund 1994) which indicated a significant reduction in wound area at six weeks following the administration of HBOT (33% mean difference (MD) in area ulcerated, 95% CI 19 to 47). This effect did not persist to 18 weeks and there was no significant increase in the proportion of ulcers healed at any time. While this trial suffered considerable data loss at 18 weeks, these results were not sensitive to the allocation of drop‐outs. For arterial and decubitus ulceration we could locate no eligible trials and therefore have no data on which to evaluate the efficacy of HBOT for these ulcers.
In this update, we identified one trial (Kaur 2012) which enrolled patients with different comorbidities and therefore different types of ulcers. Due to the possibility that in future more studies of this types will be found, we decided to add this as a new comparison termed "mixed ulcers types" to the analysis. For this "mixed ulcers" there was a significant benefit of HBOT in terms of reduction in ulcer area at the end of treatment (30 days) but no statistically significant difference in the healing rate of ulcers at the end of treatment or the rate of major amputation.
All of these findings are subject to a potential publication bias. While we have made every effort to locate further unpublished data, it remains possible that this review is subject to a positive publication bias, with generally favourable trials more likely to achieve reporting.
With regard to long‐term outcomes following HBOT, we have located no relevant data. Only one trial reported a quality of life assessment in a parallel publication (Londahl 2010), where no between‐group differences in the physical or mental health summary scores of the SF‐36 were evident. However, data were reported only for the completers of the quality of life assessment and as such an attrition bias may be present in the quality of life results. One trial evaluated the economic impact of the application of HBOT (Abidia 2003) and this trial suggested a saving of GBP 2960 on average per patient in the year following the HBOT. The savings were related to a large reduction in the number of visits required for dressings in the first year (34 versus 137). However, reliability of this analysis is not clear. The methodology was not reported and we have no information regarding the influence of treatment allocation on clinical decisions made during the period of economic evaluation. Therefore, these findings should be handled with caution until more valid data are available.
None of the included trials reported major adverse outcomes in either arm, and therefore we can report no data relating to risk with which to balance the benefit estimated. HBOT is regarded as a relatively benign intervention. There are few major adverse effects (pulmonary barotrauma, drug reactions, injuries or death related to chamber fire) and while these are all rare enough not to expect to see them in the trials included in this review, they should be included in consideration of the benefit of this therapy. In practice it is likely that a beneficial effect strong enough to be clearly identified in clinical trials would overwhelm the consideration of such rare events. There are however, a number of more minor complications that may occur commonly and several authors reported on these. Visual disturbance, usually reduction in visual acuity secondary to conformational changes in the lens, is very commonly reported ‐ perhaps as many as 50% of those having a course of 30 treatments (Khan 2003). While the great majority of participants recover spontaneously over a period of days to weeks, a small proportion of participants continue to require correction to restore sight to pre‐treatment levels. The second most common adverse effect associated with HBOT is aural barotrauma. Barotrauma can affect any air‐filled cavity in the body (including the middle ear, lungs and respiratory sinuses) and occurs as a direct result of compression. Aural barotrauma is by far the most common as the middle ear air space is small, largely surrounded by bone and the sensitive tympanic membrane, and usually requires active effort by the patient in order to inflate the middle ear through the Eustachian tube on each side. Barotrauma is thus not a consequence of HBOT directly, but rather of the physical conditions required to administer it. Most episodes of barotrauma are mild, easily treated or recover spontaneously and do not require the therapy to be abandoned.

Methodological quality summary: review authors' judgements about each methodological quality item for each included study.
Comparison 1 Diabetic ulcers, Outcome 1 Healed at end of treatment (6 weeks).

Comparison 1 Diabetic ulcers, Outcome 2 Healed at end of treatment. Best‐case..
Comparison 1 Diabetic ulcers, Outcome 3 Healed at end of treatment. Worst‐case..

Comparison 1 Diabetic ulcers, Outcome 4 Healed at 6 months.
Comparison 1 Diabetic ulcers, Outcome 5 Healed at 6 months. Best‐case..

Comparison 1 Diabetic ulcers, Outcome 6 Healed at 6 months. Worst‐case..

Comparison 1 Diabetic ulcers, Outcome 7 Healed at 1 year.

Comparison 1 Diabetic ulcers, Outcome 8 Healed at 1 year. Peto analysis method..

Comparison 1 Diabetic ulcers, Outcome 9 Healed at 1 year. Best‐case..

Comparison 1 Diabetic ulcers, Outcome 10 Healed at 1 year. Worst‐case..

Comparison 1 Diabetic ulcers, Outcome 11 Major amputations.

Comparison 1 Diabetic ulcers, Outcome 12 Major amputations. Best‐case..

Comparison 1 Diabetic ulcers, Outcome 13 Major amputations. Worst‐case..
Comparison 1 Diabetic ulcers, Outcome 14 Major amputation subgroup by use of sham.
Comparison 1 Diabetic ulcers, Outcome 15 Minor amputations.

Comparison 1 Diabetic ulcers, Outcome 16 Minor amputations. Best‐case..

Comparison 1 Diabetic ulcers, Outcome 17 Minor amputations. Worst‐case..

Comparison 1 Diabetic ulcers, Outcome 18 Transcutaneous oxygen tensions change after treatment.

Comparison 1 Diabetic ulcers, Outcome 19 Absolute difference in transcutaneous oxygen at end of treatment.
Comparison 1 Diabetic ulcers, Outcome 20 Ulcer area reduction (%).

Comparison 1 Diabetic ulcers, Outcome 21 Quality of life ‐ SF‐36 physical summary score.

Comparison 1 Diabetic ulcers, Outcome 22 Quality of life ‐ SF‐36 mental summary score.

Comparison 2 Venous ulcers, Outcome 1 Healed at 18 weeks.

Comparison 2 Venous ulcers, Outcome 2 Healed at 18 weeks. Best‐case..

Comparison 2 Venous ulcers, Outcome 3 Healed at 18 weeks. Worst‐case..

Comparison 2 Venous ulcers, Outcome 4 Wound size reduction at end treatment (6 weeks).

Comparison 2 Venous ulcers, Outcome 5 Wound size reduction at 18 weeks.

Comparison 3 Mixed ulcers types, Outcome 1 Healed at end of treatment (30 days).

Comparison 3 Mixed ulcers types, Outcome 2 Major amputations.

Comparison 3 Mixed ulcers types, Outcome 3 Periwound transcutaneous oxygen tensions at the end of treatment.

Comparison 3 Mixed ulcers types, Outcome 4 Ulcer area reduction (%).
| Hyperbaric Oxygen Therapy for chronic wounds | ||||||
| Patient or population: patients with chronic wounds | ||||||
| Outcomes | Illustrative comparative risks* (95% CI) | Relative effect | No of Participants | Quality of the evidence | Comments | |
| Assumed risk | Corresponding risk | |||||
| Control | Hyperbaric Oxygen Therapy | |||||
| Diabetic ulcers healed at 1 year. | Study population | RR 9.53 | 212 | ⊕⊕⊕⊝ | ||
| 115 per 1000 | 1000 per 1000 | |||||
| Low | ||||||
| 0 per 1000 | 0 per 1000 | |||||
| High | ||||||
| 0 per 1000 | 0 per 1000 | |||||
| Diabetic ulcers ‐ major amputations | Study population | RR 0.36 | 312 | ⊕⊕⊕⊝ | ||
| 247 per 1000 | 89 per 1000 | |||||
| Low | ||||||
| 0 per 1000 | 0 per 1000 | |||||
| High | ||||||
| 0 per 1000 | 0 per 1000 | |||||
| *The basis for the assumed risk (e.g. the median control group risk across studies) is provided in footnotes. The corresponding risk (and its 95% confidence interval) is based on the assumed risk in the comparison group and the relative effect of the intervention (and its 95% CI). | ||||||
| GRADE Working Group grades of evidence | ||||||
| 1 Analysis comprises small studies, some with zero events in control arm | ||||||
| Study | Missing but included | Missing total | Per cent of entered |
| 0 | 11 | 28% | |
| 0 | 0 | 0 | |
| 0 | 0 | 0 | |
| 0 | 0 | 0 | |
| 0 | 2 | 3% | |
| 0 | 0 | 0 | |
| 0 | 2 | 11% | |
| 0 | 5 | 31% | |
| 0 | 1 | <1% | |
| 0 | 0 | 0 | |
| 19 | 19 | 12% ‐ included in ITT | |
| 0 | 9 | 10% | |
| ITT: intention‐to‐treat | |||
| Outcome or subgroup title | No. of studies | No. of participants | Statistical method | Effect size |
| 1 Healed at end of treatment (6 weeks) Show forest plot | 5 | 205 | Risk Ratio (M‐H, Fixed, 95% CI) | 2.35 [1.19, 4.62] |
| 2 Healed at end of treatment. Best‐case. Show forest plot | 5 | 216 | Risk Ratio (M‐H, Fixed, 95% CI) | 4.61 [2.35, 9.08] |
| 3 Healed at end of treatment. Worst‐case. Show forest plot | 5 | 216 | Risk Ratio (M‐H, Fixed, 95% CI) | 0.84 [0.51, 1.37] |
| 4 Healed at 6 months Show forest plot | 2 | 112 | Risk Ratio (M‐H, Fixed, 95% CI) | 1.70 [0.90, 3.20] |
| 5 Healed at 6 months. Best‐case. Show forest plot | 2 | 112 | Risk Ratio (M‐H, Fixed, 95% CI) | 2.71 [1.53, 4.83] |
| 6 Healed at 6 months. Worst‐case. Show forest plot | 2 | 112 | Risk Ratio (M‐H, Fixed, 95% CI) | 0.93 [0.57, 1.54] |
| 7 Healed at 1 year Show forest plot | 3 | 212 | Risk Ratio (M‐H, Random, 95% CI) | 9.53 [0.44, 207.76] |
| 8 Healed at 1 year. Peto analysis method. Show forest plot | 3 | 212 | Peto Odds Ratio (Peto, Fixed, 95% CI) | 7.58 [4.33, 13.29] |
| 9 Healed at 1 year. Best‐case. Show forest plot | 3 | 212 | Risk Ratio (M‐H, Random, 95% CI) | 10.17 [0.47, 220.48] |
| 10 Healed at 1 year. Worst‐case. Show forest plot | 3 | 212 | Risk Ratio (M‐H, Random, 95% CI) | 6.55 [0.42, 101.71] |
| 11 Major amputations Show forest plot | 5 | 312 | Risk Ratio (M‐H, Random, 95% CI) | 0.36 [0.11, 1.18] |
| 11.1 Subgroup (30+ treatments) | 4 | 282 | Risk Ratio (M‐H, Random, 95% CI) | 0.40 [0.07, 2.23] |
| 11.2 Subgroup (< 30 treatments) | 1 | 30 | Risk Ratio (M‐H, Random, 95% CI) | 0.29 [0.07, 1.16] |
| 12 Major amputations. Best‐case. Show forest plot | 5 | 312 | Risk Ratio (M‐H, Fixed, 95% CI) | 0.20 [0.10, 0.38] |
| 13 Major amputations. Worst‐case. Show forest plot | 5 | 312 | Risk Ratio (M‐H, Random, 95% CI) | 0.62 [0.13, 2.98] |
| 14 Major amputation subgroup by use of sham Show forest plot | 5 | Risk Ratio (M‐H, Fixed, 95% CI) | Subtotals only | |
| 14.1 Sham HBOT | 2 | 112 | Risk Ratio (M‐H, Fixed, 95% CI) | 0.47 [0.09, 2.44] |
| 14.2 No sham | 3 | 200 | Risk Ratio (M‐H, Fixed, 95% CI) | 0.15 [0.06, 0.36] |
| 15 Minor amputations Show forest plot | 4 | 242 | Risk Ratio (M‐H, Random, 95% CI) | 0.76 [0.19, 3.10] |
| 16 Minor amputations. Best‐case. Show forest plot | 4 | 242 | Risk Ratio (M‐H, Random, 95% CI) | 0.55 [0.17, 1.75] |
| 17 Minor amputations. Worst‐case. Show forest plot | 4 | 242 | Risk Ratio (M‐H, Random, 95% CI) | 0.91 [0.21, 4.02] |
| 18 Transcutaneous oxygen tensions change after treatment Show forest plot | 1 | 68 | Mean Difference (IV, Fixed, 95% CI) | 9.0 [4.68, 13.32] |
| 19 Absolute difference in transcutaneous oxygen at end of treatment Show forest plot | 3 | 113 | Mean Difference (IV, Fixed, 95% CI) | 11.76 [5.68, 17.84] |
| 20 Ulcer area reduction (%) Show forest plot | 2 | 63 | Mean Difference (IV, Random, 95% CI) | 18.10 [1.40, 34.79] |
| 21 Quality of life ‐ SF‐36 physical summary score Show forest plot | 1 | 33 | Mean Difference (IV, Fixed, 95% CI) | ‐0.20 [‐8.58, 8.18] |
| 22 Quality of life ‐ SF‐36 mental summary score Show forest plot | 1 | 33 | Mean Difference (IV, Fixed, 95% CI) | 6.60 [‐3.93, 17.13] |
| Outcome or subgroup title | No. of studies | No. of participants | Statistical method | Effect size |
| 1 Healed at 18 weeks Show forest plot | 1 | 16 | Risk Ratio (M‐H, Fixed, 95% CI) | 5.0 [0.28, 90.18] |
| 2 Healed at 18 weeks. Best‐case. Show forest plot | 1 | 16 | Risk Ratio (M‐H, Fixed, 95% CI) | 9.0 [0.56, 143.89] |
| 3 Healed at 18 weeks. Worst‐case. Show forest plot | 1 | 16 | Risk Ratio (M‐H, Fixed, 95% CI) | 0.67 [0.15, 2.98] |
| 4 Wound size reduction at end treatment (6 weeks) Show forest plot | 1 | 16 | Mean Difference (IV, Fixed, 95% CI) | 33.0 [18.97, 47.03] |
| 5 Wound size reduction at 18 weeks Show forest plot | 1 | 11 | Mean Difference (IV, Fixed, 95% CI) | 29.60 [‐22.99, 82.19] |
| Outcome or subgroup title | No. of studies | No. of participants | Statistical method | Effect size |
| 1 Healed at end of treatment (30 days) Show forest plot | 1 | 30 | Risk Ratio (M‐H, Fixed, 95% CI) | 7.0 [0.39, 124.83] |
| 2 Major amputations Show forest plot | 1 | 30 | Risk Ratio (M‐H, Fixed, 95% CI) | 0.2 [0.03, 1.51] |
| 3 Periwound transcutaneous oxygen tensions at the end of treatment Show forest plot | 1 | 30 | Mean Difference (IV, Fixed, 95% CI) | 12.90 [4.00, 21.80] |
| 4 Ulcer area reduction (%) Show forest plot | 1 | 30 | Mean Difference (IV, Fixed, 95% CI) | 61.88 [41.91, 81.85] |