Ventilación no invasiva para el tratamiento de la insuficiencia respiratoria hipercápnica aguda debida a la exacerbación de la enfermedad pulmonar obstructiva crónica
Información
- DOI:
- https://doi.org/10.1002/14651858.CD004104.pub4Copiar DOI

- Base de datos:
-
- Cochrane Database of Systematic Reviews
- Versión publicada:
-
- 13 julio 2017see what's new
- Tipo:
-
- Intervention
- Etapa:
-
- Review
- Grupo Editorial Cochrane:
-
Grupo Cochrane de Vías respiratorias
- Copyright:
-
- Copyright © 2017 The Cochrane Collaboration. Published by John Wiley & Sons, Ltd.
Cifras del artículo
Altmetric:
Citado por:
Autores
Contributions of authors
CO and VT updated the latest version of the review, including protocol revision, literature screening, data extraction, data analysis, and write‐up of results. KC provided assistance with all of these activities. JP and JW contributed to the previous publication of this review (April 2004) and assisted in protocol design and review of the draft for the latest version of the review. Felix SF Ram, Josephine Lightowler, and JW completed the original review.
Sources of support
Internal sources
-
Respiratory Medicine Department, The Queen Elizabeth Hospital, Australia.
External sources
-
The authors declare that no such funding was received for this systematic review, Other.
Declarations of interest
CO: none known.
VT: none known.
KC: none known.
JP: none known.
JW: none known.
BS: none known.
Acknowledgements
We would like to acknowledge all authors involved in earlier versions of this Cochrane review (Felix SF Ram, Josephine Lightowler, and Jadwiga Wedzicha) for their substantial contributions to the text and content of this review. We wish to thank authors of studies who responded to requests for clarification or further data regarding their trials (Avdeev 1998; Bott 1993; Khilnani 2010; Kramer 1995; Plant 2001; Thys 2002). We would like to thank the following colleagues for providing assistance with data extraction and translation of articles published in languages other than English: Alieksei Seniukovich, Yi Liu, Claudio Bravo, Petra Kristyna Matejkova, Hong Fan, Zongwang Zhang, and Jan Strojil.
Rebecca Normansell was the Editor for this review and commented critically on the review.
The Methods sections of this review were based on a standard template used by the Cochrane Airways Review Group.
This project was supported by the National Institute for Health Research (NIHR), via Cochrane Infrastructure funding to the Cochrane Airways Group. The views and opinions expressed therein are those of the review authors and do not necessarily reflect those of the Systematic Reviews Programme, NIHR, NHS, or the Department of Health.
Version history
| Published | Title | Stage | Authors | Version |
| 2017 Jul 13 | Non‐invasive ventilation for the management of acute hypercapnic respiratory failure due to exacerbation of chronic obstructive pulmonary disease | Review | Christian R Osadnik, Vanessa S Tee, Kristin V Carson‐Chahhoud, Joanna Picot, Jadwiga A Wedzicha, Brian J Smith | |
| 2004 Jul 19 | Non‐invasive positive pressure ventilation for treatment of respiratory failure due to exacerbations of chronic obstructive pulmonary disease | Review | Felix SF Ram, Joanna Picot, Josephine Lightowler, Jadwiga A Wedzicha | |
| 2003 Oct 20 | Non‐invasive positive pressure ventilation for treatment of respiratory failure due to exacerbations of chronic obstructive pulmonary disease | Review | Felix S F Ram, Joanna Picot, J Lightowler, J A Wedzicha | |
Differences between protocol and review
Updates undertaken since publication of the original review resulted in the following changes to the protocol.
-
Significant updates to the methods to bring the review in line with current Cochrane (MECIR) standards. This included insertion of a 'Summary of findings' table and updates to the risk of bias methods (removal of the Jadad scale). This process included evaluation of the following additional domains of potential bias: imbalance of outcome measures at baseline, comparability of intervention and control group characteristics at baseline, protection against contamination, and selective recruitment of participants.
-
Following critical feedback regarding this review, we amended the definition of AHRF from the initial review to now include reference to pH < 7.35. We deemed this essential to enhance its consistency with clinical practice.
-
Amendment of primary review outcomes. In the initial version, the primary outcome was 'treatment failure', defined according to any combination of intubation, mortality, or treatment failure. To remove ambiguity regarding overlap between these definitions, the current version lists treatment intolerance as an independent secondary review outcome. We also made clarifications to the definition of our primary outcome 'need for endotracheal intubation' to minimise ambiguity.
-
Exclusion of one study that was included in the original review (Conti 2002) due to inclusion of mechanical ventilation as a comparator intervention; and reclassification of one study originally included in the review (Servillo 1994) to 'Awaiting classification' due to lack of sufficient information pertaining to mean baseline pH to determine eligibility for inclusion in the review in accordance with our revised definition of AHRF.
-
Replacement of one abstract included in the original review with a full‐text version in the update (Khilnani 2002 is now Khilnani 2010).
-
Minor edits to wording of two eligibility criteria to explicitly clarify that (a) studies of patients who commenced NIV before hospital admission are ineligible for inclusion in the review; and (b) 'usual medical care' may not include any form of positive pressure ventilation considered to be 'usual' for that study centre.
-
Thys 2002 was originally included as an 'ICU' study in the subgroup analysis of ward versus ICU care. As this study was based in an emergency department (potentially more intensive than a ward, but not an ICU setting), in keeping with the primary aim of the review, we excluded this study from the ward versus ICU subgroup analysis for the present (and subsequent) updates.
-
Data from Bott 1993 were originally included in some of the meta‐analyses related to blood gas tensions; however owing to lack of sufficient study information regarding the number of participants included in these outcome data, this study was subsequently removed from the meta‐analysis and was reported separately. Additionally, mortality data were removed from the meta‐analysis, as they were identified as relevant to the post‐discharge period, not to in‐hospital mortality.
-
We conducted subgroup analyses of admission pH and location only for the primary outcomes of interest for this review (mortality and need for endotracheal intubation), rather than for all outcomes.
-
One additional table (percentage change in PaCO2 at one hour post intervention) included in the earlier review was removed.
-
Type of NIV for subgroup analysis was removed from the investigation of heterogeneity section of the protocol, as all studies except one used pressure‐cycled NIV.
Keywords
MeSH
Medical Subject Headings (MeSH) Keywords
Medical Subject Headings Check Words
Adult; Humans;
PICO
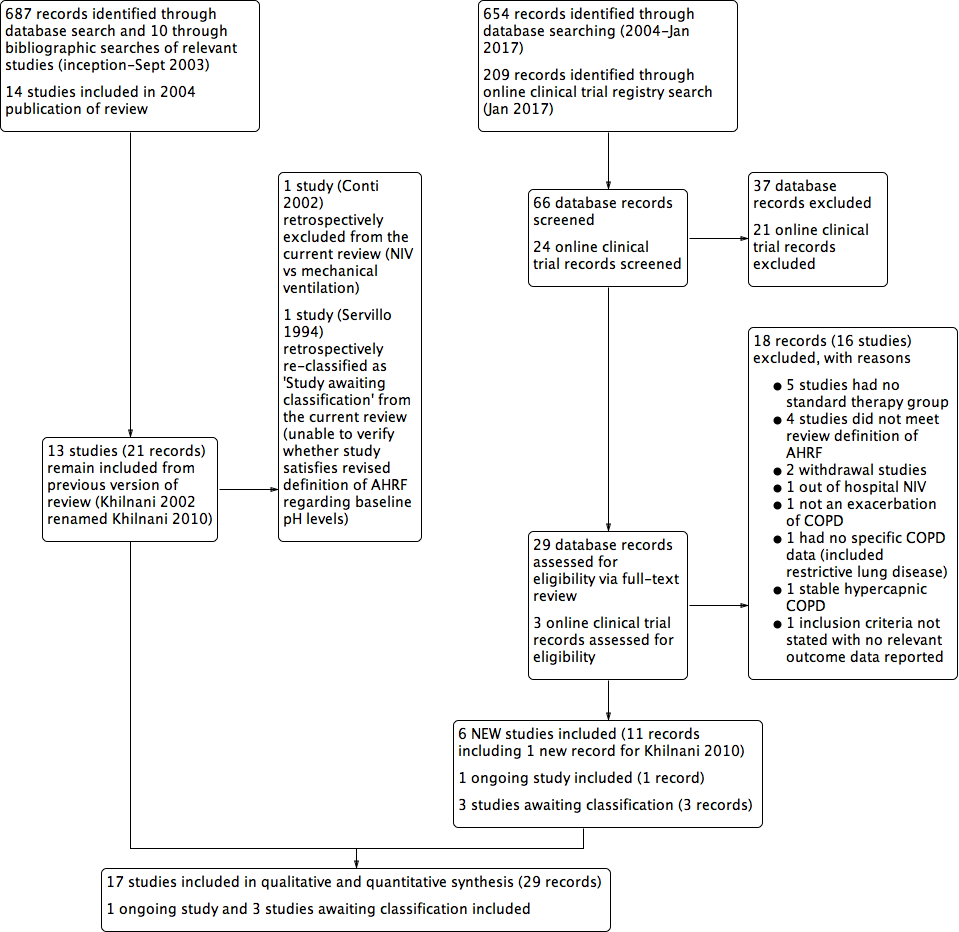
Study flow diagram for 2004‐2017 literature searches.
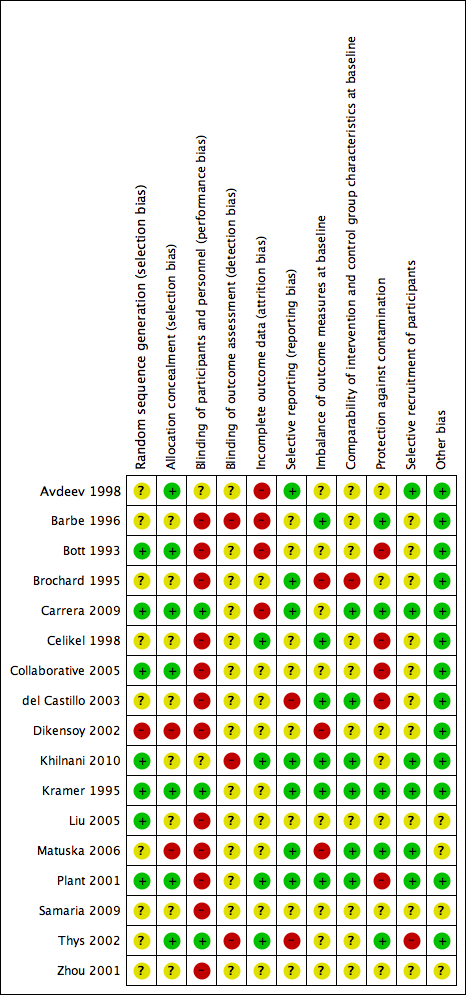
Methodological quality summary: review authors' judgements about each methodological quality item for each included study.

NIV vs usual care (overall) ‐ Mortality

Cates plot Analysis 1.1 (mortality), NIV group: In the usual care group, 18 of 100 people died during the period of hospitalisation, compared with 10 (95% CI 7 to 14) of 100 in the NIV group.

Funnel plot of comparison: 1 NIV vs usual care ‐ Overall, outcome: 1.1 Mortality.
NIV vs usual care (overall) ‐ Need for endotracheal intubation

Cates plot Analysis 1.2 (need for endotracheal intubation), NIV group: In the usual care group, 34 of 100 people experienced the need for endotracheal intubation during the period of hospitalisation, compared with 12 (95% CI 10 to 16) of 100 in the NIV group.

Funnel plot of comparison: 1 NIV vs usual care ‐ Overall, outcome: 1.2 Need for endotracheal intubation.

Comparison 1 NIV vs usual care ‐ Overall, Outcome 1 Mortality.

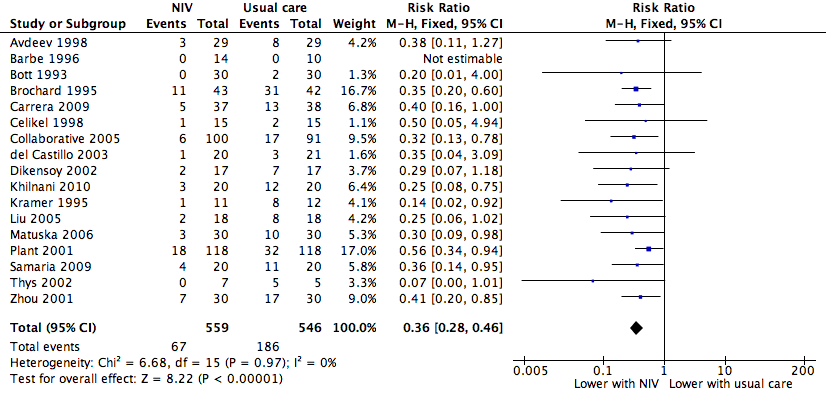
Comparison 1 NIV vs usual care ‐ Overall, Outcome 2 Need for endotracheal intubation.
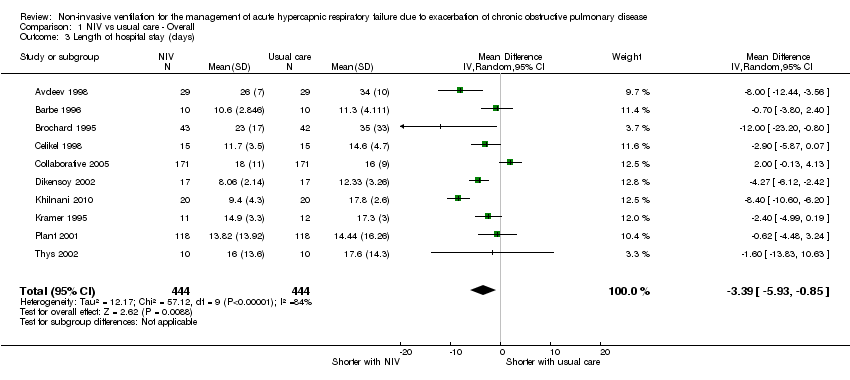
Comparison 1 NIV vs usual care ‐ Overall, Outcome 3 Length of hospital stay (days).
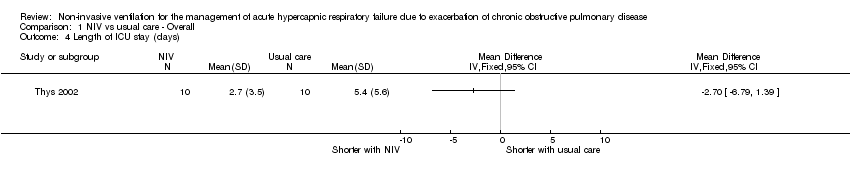
Comparison 1 NIV vs usual care ‐ Overall, Outcome 4 Length of ICU stay (days).

Comparison 1 NIV vs usual care ‐ Overall, Outcome 5 Symptom scores (higher score means more dyspnoea).

Comparison 1 NIV vs usual care ‐ Overall, Outcome 6 Treatment intolerance.
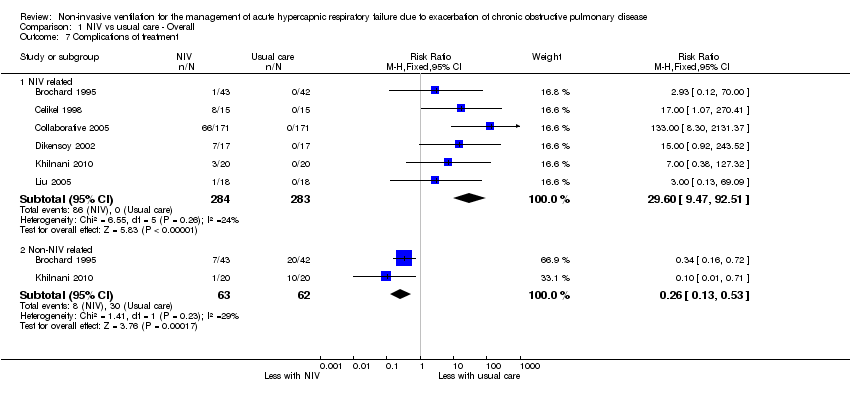
Comparison 1 NIV vs usual care ‐ Overall, Outcome 7 Complications of treatment.

Comparison 1 NIV vs usual care ‐ Overall, Outcome 8 pH 1 hour post intervention.

Comparison 1 NIV vs usual care ‐ Overall, Outcome 9 PaCO2 mmHg ‐ 1 hour post intervention.

Comparison 1 NIV vs usual care ‐ Overall, Outcome 10 PaO2 mmHg ‐ 1 hour post intervention.

Comparison 2 NIV vs UMC ‐ Admission pH subgroups, Outcome 1 Mortality.
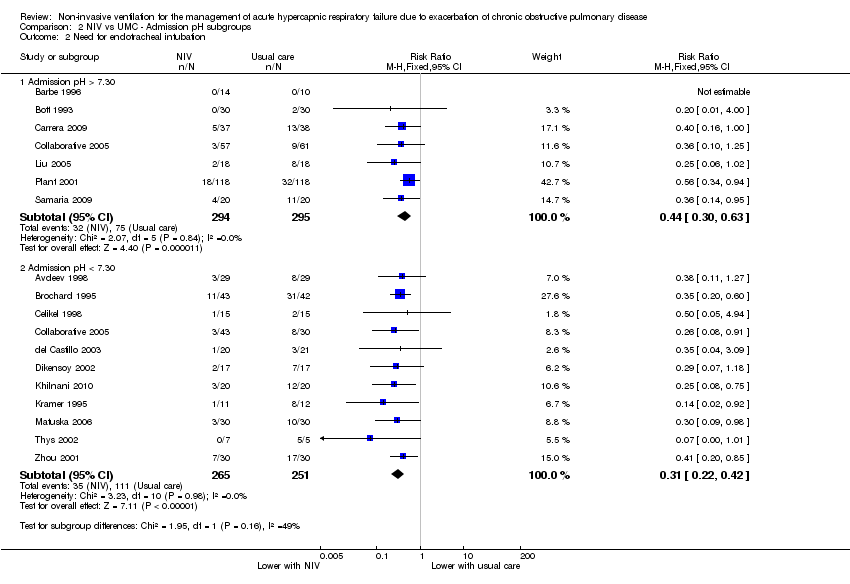
Comparison 2 NIV vs UMC ‐ Admission pH subgroups, Outcome 2 Need for endotracheal intubation.
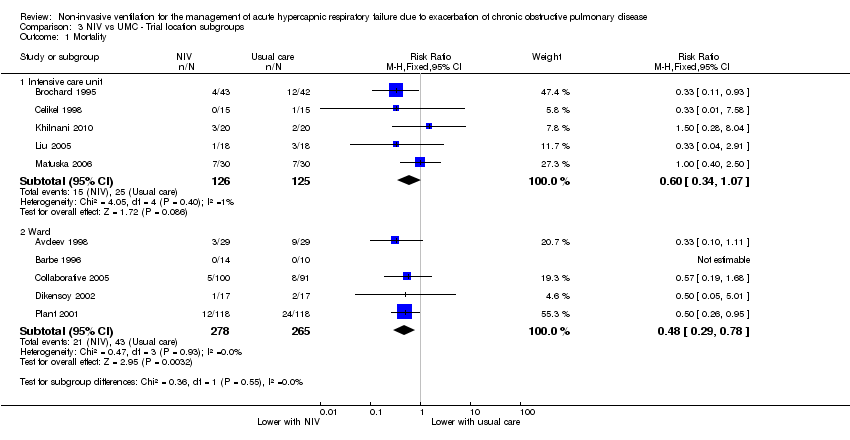
Comparison 3 NIV vs UMC ‐ Trial location subgroups, Outcome 1 Mortality.
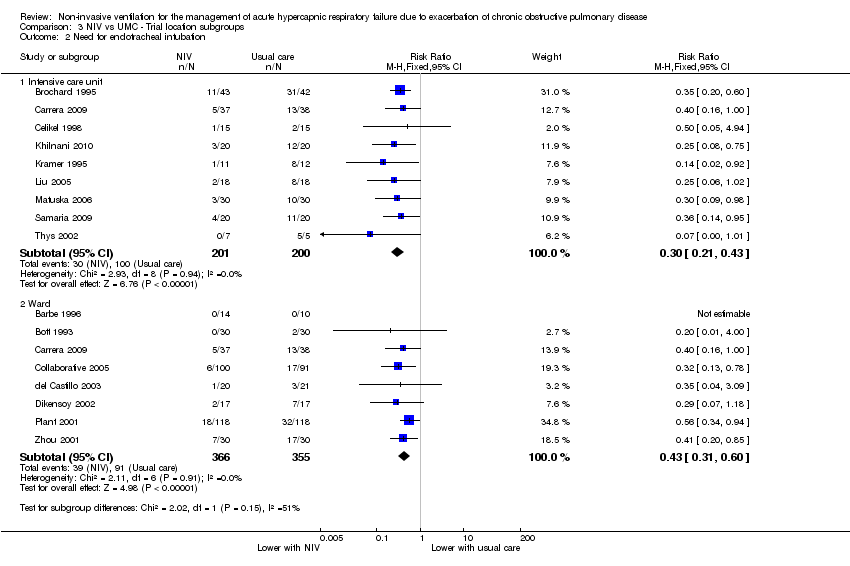
Comparison 3 NIV vs UMC ‐ Trial location subgroups, Outcome 2 Need for endotracheal intubation.
| Non‐invasive ventilation versus usual medical care for management of acute hypercapnic respiratory failure due to exacerbation of chronic obstructive pulmonary disease (overall effects) | ||||||
| Patient or population: Patients admitted to hospital with acute hypercapnic respiratory failure due to an exacerbation of chronic obstructive pulmonary disease (COPD) | ||||||
| Outcomes | Anticipated absolute effects* (95% CI) | Relative effect | No. of participants | Quality of the evidence | Comments | |
| Risk with usual care ‐ Overall | Risk with NIV | |||||
| Mortality | 183 per 1000 | 99 per 1000 | RR 0.54 | 854 | ⊕⊕⊕⊝ | Downgraded owing to risk of bias for some included studies |
| Need for endotracheal intubation | 341 per 1000 | 123 per 1000 | RR 0.36 | 1105 | ⊕⊕⊕⊝ | Downgraded owing to risk of bias for some included studies |
| Length of hospital stay (days) | Mean length of hospital stay (days) was 17.5 | MD 3.39 lower | ‐ | 888 | ⊕⊕⊕⊝ | Downgraded owing to risk of bias and inconsistency of findings for some included studies |
| *The risk in the intervention group (and its 95% confidence interval) is based on assumed risk in the comparison group and the relative effect of the intervention (and its 95% CI) | ||||||
| GRADE Working Group grades of evidence | ||||||
| aSeveral risk of bias items rated 'unclear' bOne study reported an effect estimate that favoured usual medical care (non‐significant); significant statistical heterogeneity identified within the intensive care unit subgroup was unable to be resolved | ||||||
| Outcome or subgroup title | No. of studies | No. of participants | Statistical method | Effect size |
| 1 Mortality Show forest plot | 12 | 854 | Risk Ratio (M‐H, Fixed, 95% CI) | 0.54 [0.38, 0.76] |
| 2 Need for endotracheal intubation Show forest plot | 17 | 1105 | Risk Ratio (M‐H, Fixed, 95% CI) | 0.36 [0.28, 0.46] |
| 3 Length of hospital stay (days) Show forest plot | 10 | 888 | Mean Difference (IV, Random, 95% CI) | ‐3.39 [‐5.93, ‐0.85] |
| 4 Length of ICU stay (days) Show forest plot | 1 | Mean Difference (IV, Fixed, 95% CI) | Totals not selected | |
| 5 Symptom scores (higher score means more dyspnoea) Show forest plot | 4 | 484 | Std. Mean Difference (IV, Fixed, 95% CI) | ‐0.16 [‐0.34, 0.02] |
| 5.1 Borg score | 2 | 82 | Std. Mean Difference (IV, Fixed, 95% CI) | ‐0.35 [‐0.79, 0.08] |
| 5.2 Visual analogue scale | 1 | 60 | Std. Mean Difference (IV, Fixed, 95% CI) | ‐0.87 [‐1.40, ‐0.34] |
| 5.3 Dyspnoea score at 24 hours | 1 | 342 | Std. Mean Difference (IV, Fixed, 95% CI) | 0.0 [‐0.21, 0.21] |
| 6 Treatment intolerance Show forest plot | 6 | 252 | Risk Difference (M‐H, Fixed, 95% CI) | 0.11 [0.04, 0.17] |
| 7 Complications of treatment Show forest plot | 6 | Risk Ratio (M‐H, Fixed, 95% CI) | Subtotals only | |
| 7.1 NIV related | 6 | 567 | Risk Ratio (M‐H, Fixed, 95% CI) | 29.60 [9.47, 92.51] |
| 7.2 Non‐NIV related | 2 | 125 | Risk Ratio (M‐H, Fixed, 95% CI) | 0.26 [0.13, 0.53] |
| 8 pH 1 hour post intervention Show forest plot | 8 | 585 | Mean Difference (IV, Random, 95% CI) | 0.05 [0.02, 0.07] |
| 9 PaCO2 mmHg ‐ 1 hour post intervention Show forest plot | 8 | 585 | Mean Difference (IV, Random, 95% CI) | ‐4.62 [‐11.05, 1.80] |
| 10 PaO2 mmHg ‐ 1 hour post intervention Show forest plot | 8 | 585 | Mean Difference (IV, Random, 95% CI) | 7.47 [0.78, 14.16] |
| Outcome or subgroup title | No. of studies | No. of participants | Statistical method | Effect size |
| 1 Mortality Show forest plot | 12 | Risk Ratio (M‐H, Fixed, 95% CI) | Subtotals only | |
| 1.1 Admission pH > 7.30 | 5 | 454 | Risk Ratio (M‐H, Fixed, 95% CI) | 0.50 [0.30, 0.84] |
| 1.2 Admission pH < 7.30 | 8 | 400 | Risk Ratio (M‐H, Fixed, 95% CI) | 0.57 [0.35, 0.90] |
| 2 Need for endotracheal intubation Show forest plot | 17 | Risk Ratio (M‐H, Fixed, 95% CI) | Subtotals only | |
| 2.1 Admission pH > 7.30 | 7 | 589 | Risk Ratio (M‐H, Fixed, 95% CI) | 0.44 [0.30, 0.63] |
| 2.2 Admission pH < 7.30 | 11 | 516 | Risk Ratio (M‐H, Fixed, 95% CI) | 0.31 [0.22, 0.42] |
| Outcome or subgroup title | No. of studies | No. of participants | Statistical method | Effect size |
| 1 Mortality Show forest plot | 10 | Risk Ratio (M‐H, Fixed, 95% CI) | Subtotals only | |
| 1.1 Intensive care unit | 5 | 251 | Risk Ratio (M‐H, Fixed, 95% CI) | 0.60 [0.34, 1.07] |
| 1.2 Ward | 5 | 543 | Risk Ratio (M‐H, Fixed, 95% CI) | 0.48 [0.29, 0.78] |
| 2 Need for endotracheal intubation Show forest plot | 16 | Risk Ratio (M‐H, Fixed, 95% CI) | Subtotals only | |
| 2.1 Intensive care unit | 9 | 401 | Risk Ratio (M‐H, Fixed, 95% CI) | 0.30 [0.21, 0.43] |
| 2.2 Ward | 8 | 721 | Risk Ratio (M‐H, Fixed, 95% CI) | 0.43 [0.31, 0.60] |