Asistencia respiratoria oscilatoria de alta frecuencia versus asistencia respiratoria convencional para el síndrome de dificultad respiratoria aguda
Información
- DOI:
- https://doi.org/10.1002/14651858.CD004085.pub4Copiar DOI

- Base de datos:
-
- Cochrane Database of Systematic Reviews
- Versión publicada:
-
- 04 abril 2016see what's new
- Tipo:
-
- Intervention
- Etapa:
-
- Review
- Grupo Editorial Cochrane:
-
Grupo Cochrane de Atención crítica y de emergencia
- Copyright:
-
- Copyright © 2018 The Cochrane Collaboration. Published by John Wiley & Sons, Ltd.
Cifras del artículo
Altmetric:
Citado por:
Autores
Contributions of authors
Sachin Sud (SS), Maneesh Sud (MS), Jan O Friedrich (JOF), Hannah Wunsch (HW), Maureen O Meade (MOM), Niall D Ferguson (NDF), Neill KJ Adhikari (NKJA):
All authors contributed to the study concept and design, revised the manuscript for important intellectual content, and approved the final version.
SS conceived the study, acquired data, analysed and interpreted data, and drafted the manuscript.
MS, JOF, NKJA and HW acquired, analysed and interpreted the data.
MOM, NDF, and HW interpreted the data.
NKJA and JOF contributed equally to this study.
SS, JOF, NKJA are guarantors.
Sources of support
Internal sources
-
New Source of support, Other.
This study received no specific funding or support
External sources
-
New Source of support, Other.
This study received no specific funding or support
Declarations of interest
All authors have completed the Cochrane online conflicts of interest form and declare the following:
Sachin Sud: nothing to declare.
Maneesh Sud: nothing to declare.
Jan O Friedrich: no financial interests to declare; Dr. Friedrich is a co‐investigators for the Canadian Institutes of Health Research (CIHR) funded OSCILLATE study, which was included in this review (Ferguson 2013). CareFusion (formerly SensorMedics) is providing study oscillators to some of the hospitals involved in the OSCILLATE study for the duration of the study.
Hannah Wunsch: nothing to declare.
Maureen O Meade:no financial interests to declare; Dr. Meade is a primary investigator for the Canadian Institutes of Health Research (CIHR) funded OSCILLATE study, which was included in this review (Ferguson 2013). CareFusion (formerly SensorMedics) is providing study oscillators to some of the hospitals involved in the OSCILLATE study for the duration of the study.
Niall D Ferguson:no financial interests to declare; Dr. Ferguson is a primary investigator for the Canadian Institutes of Health Research (CIHR) funded OSCILLATE study, which was included in this review (Ferguson 2013). CareFusion (formerly SensorMedics) is providing study oscillators to some of the hospitals involved in the OSCILLATE study for the duration of the study.
Neill KJ Adhikari: no financial interests to declare; Dr. Adhikari is a co‐investigators for the Canadian Institutes of Health Research (CIHR) funded OSCILLATE study, which was included in this review (Ferguson 2013). CareFusion (formerly SensorMedics) is providing study oscillators to some of the hospitals involved in the OSCILLATE study for the duration of the study.
Four of the seven authors (JOF, NKJA, NDF, MOM) co‐authored one of the included studies Ferguson 2013 and were not involved in the acquisition and interpretation of data, or the assessment of risk of bias for this study (which was performed by SS and MS). JOF verified the calculation of ratio of means (which was first performed independently by SS and MS), for physiologic outcomes for all studies, including Ferguson 2013.
Acknowledgements
We would like to acknowledge James Mapstone for contributions made to earlier versions of this systematic review (Wunsch 2004).
We would like to thank Mathew Zacharias (content editor), Marialena Trivella (statistical editor), Rodrigo Cavallazzi, Hansjoerg Waibel, Arash Afshari (peer reviewers) and Janet Wale (consumer editor) for their help and editorial advice during the preparation of a previous update of this systematic review (Sud 2013).
We would like to thank Javier Eslava‐Schmalbach (content editor), Nathan Pace (statistical editor), Andrew MacDuff, Ewan C Goligher, Antoine Roch (peer reviewers), Shunjie Chua (consumer referee) for their help and editorial advice during the preparation of the current update of this systematic review.
We thank all primary investigators who provided additional data for this review: Steven Derdak and Tom Bachman; Casper Bollen; Spyros Mentzelopoulos; Rujipat Samransamruajkit; and Sanjoy Shah.
Version history
| Published | Title | Stage | Authors | Version |
| 2016 Apr 04 | High‐frequency oscillatory ventilation versus conventional ventilation for acute respiratory distress syndrome | Review | Sachin Sud, Maneesh Sud, Jan O Friedrich, Hannah Wunsch, Maureen O Meade, Niall D Ferguson, Neill KJ Adhikari | |
| 2013 Feb 28 | High‐frequency ventilation versus conventional ventilation for treatment of acute lung injury and acute respiratory distress syndrome | Review | Sachin Sud, Maneesh Sud, Jan O Friedrich, Hannah Wunsch, Maureen O Meade, Niall D Ferguson, Neill KJ Adhikari | |
| 2004 Jan 26 | High‐frequency ventilation versus conventional ventilation for treatment of acute lung injury and acute respiratory distress syndrome | Review | Hannah Wunsch, James Mapstone | |
| 2002 Jun 26 | High‐frequency ventilation versus conventional ventilation for treatment of acute lung injury and acute respiratory distress syndrome | Protocol | Hannah Wunsch, James Mapstone | |
Differences between protocol and review
| Original Protocol | Amended Protocol (March 27 2009; July 01 2013) | Reason (outcome #) |
| Primary: Mortality (Intensive care unit (ICU), hospital, 30 days, 60 plus days) | Primary outcomes: 1. Hospital or 30‐day mortality.
| Hospital mortality is the most common endpoint in critical care studies. ICU mortality is not a patient‐centred outcome. Hospital mortality and 30‐day mortality are considered equivalent. We included longer‐term mortality as a secondary outcome. |
| Secondary: 1. Total length of mechanical ventilation (high‐frequency and conventional combined) 2. Length of stay in the intensive care unit 3. Length of hospital stay 4. Any long‐term quality of life measurements 5. Any long‐term cognitive measurements 6. Cost effectiveness. | Secondary outcomes: 1. Six‐month mortality 2. Duration of mechanical ventilation (in days, as stated by the authors) 3. Ventilator‐free days to day 28 or 30 (in days, as stated by the authors) 4. Health‐related quality of life at one year 5. Treatment failure, leading to cross‐over to the other arm or discontinuation of the study protocol. We accepted authors’ definitions of treatment failure, which could include severe oxygenation failure, ventilation failure, hypotension, or barotrauma (pneumothorax, pneumomediastinum, subcutaneous emphysema) 6. The ratio of partial pressure of arterial oxygen (PaO₂) to inspired fraction of oxygen (FiO₂) (PaO₂/FiO₂ ratio) at 24, 48, and 72 hours after randomization 7. Oxygenation index (OI, defined as 100 x mean airway pressure/PaO₂/FiO₂ ratio) measured at 24, 48, and 72 hours after randomization 8. Ventilation, measured by partial pressure of carbon dioxide (PaCO₂) at 24, 48, and 72 hours after randomization 9. Mean airway pressure 24, 48, and 72 hours after randomization 10. Barotrauma (as stated by the authors) 11. Hypotension (as stated by the authors) 12. Endotracheal tube obstruction due to secretions, 13. Technical complications and equipment failure in participants treated with HFO (including unintentional system air leaks, and problems with the oscillatory diaphragm, humidifier, and alarm systems)
| Total duration of mechanical ventilation (1) is ambiguous, as it may be measured in two ways in critical care trials: days of mechanical ventilation or ventilator‐free days. Since these endpoints cannot be combined we analysed them separately. We did not analyse length of ICU stay or hospital length of stay (2, 3) as these were likely to be confounded by mortality (an intervention that improves survival will also increase ICU or hospital length of stay). Long‐term quality of life measurements (4) and long‐term cognitive measurements (5) were not precisely defined and unlikely to be reported in studies to date. We chose to analyse health‐related quality of life at one year, if reported.
We did not analyse cost effectiveness (6) because it is unlikely that cost‐effectiveness studies would be performed, since this intervention has not been yet proven to be effective.
We included several physiologic endpoints not in the original review in order to assess the effect of HFO on oxygenation (6, 7) and ventilation (8, 9).
We included several additional safety endpoints prior to undertaking this update in order to assess potential complications of HFO (10 ‐ 13). |
| Subgroup analyses: None | Subgroup analyses: See Subgroup analysis and investigation of heterogeneity; Sensitivity analysis. | See text |
| Search strategy:
See previous version: Wunsch 2004.
| Search strategy:
See Appendix 1
| We designed a more sensitive (but less specific) search strategy using published sensitive strategies for retrieving randomized trials (Haynes 2005; Wong 2006). We also improved the sensitivity of the search strategy by searching conference proceedings and contacting primary investigators. |
Notes
December 2015:
We have included 'Risk of bias' and 'Summary of findings' tables, and updated the Background section in this updated version.
We have changed the title of the review to 'High‐frequency oscillatory ventilation versus conventional ventilation for treatment of acute respiratory distress syndrome' (previously 'High‐frequency ventilation versus conventional ventilation for treatment of acute lung injury and acute respiratory distress syndrome'), as this better reflects the content of the review, and because the term acute lung injury has been removed from the Berlin Definition of ARDS.
Keywords
MeSH
Medical Subject Headings (MeSH) Keywords
Medical Subject Headings Check Words
Adolescent; Adult; Child; Child, Preschool; Humans; Infant;
PICO

Study flow diagram for the updated literature search (from 2011 to Dec 2015, see also Results of the search)
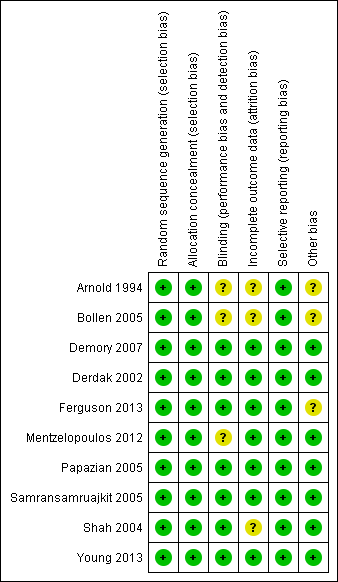
Methodological quality summary: review authors' judgements about each methodological quality item for each included study.

Methodological quality graph: review authors' judgements about each methodological quality item presented as percentages across all included studies.
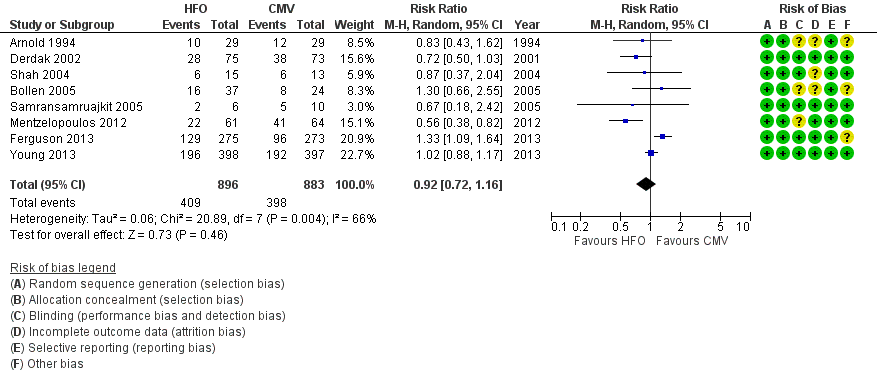
Forest plot of comparison: 1 Mortality, outcome: 1.1 Hospital or 30‐day mortality. (HFO = high frequency oscillation, CMV = conventional mechanical ventilation)
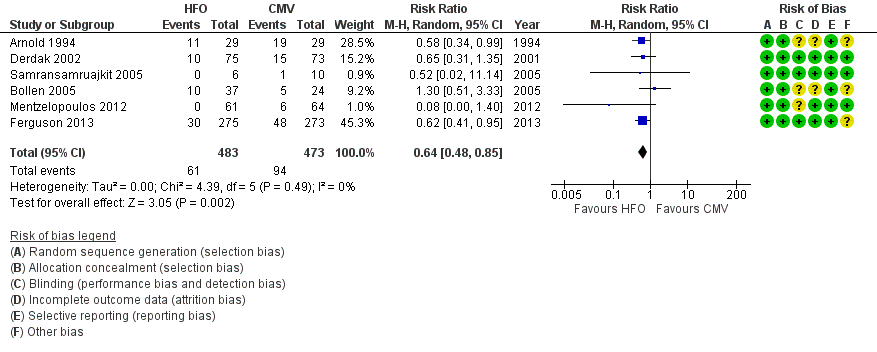
Forest plot of comparison: 2 Adverse events, outcome: 2.1 Treatment failure (intractable hypoxia, hypotension, acidosis, hypercapnoea requiring discontinuation of study intervention). (HFO = high frequency oscillation, CMV = conventional mechanical ventilation)
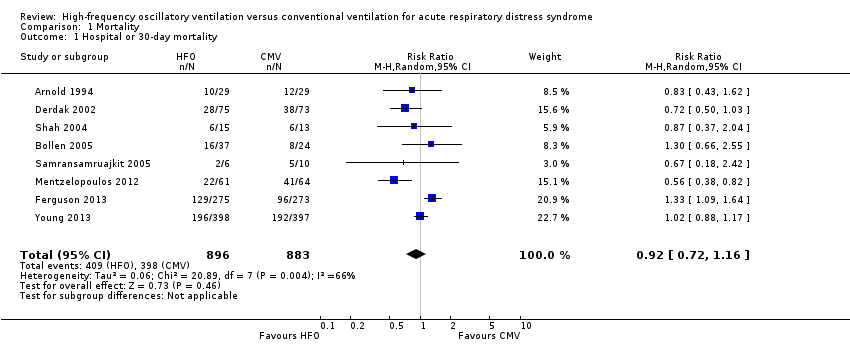
Comparison 1 Mortality, Outcome 1 Hospital or 30‐day mortality.

Comparison 1 Mortality, Outcome 2 Hospital or 30‐day mortality (Bollen 2005 and Mentzelopoulos 2012 participants lost to follow‐up censored).
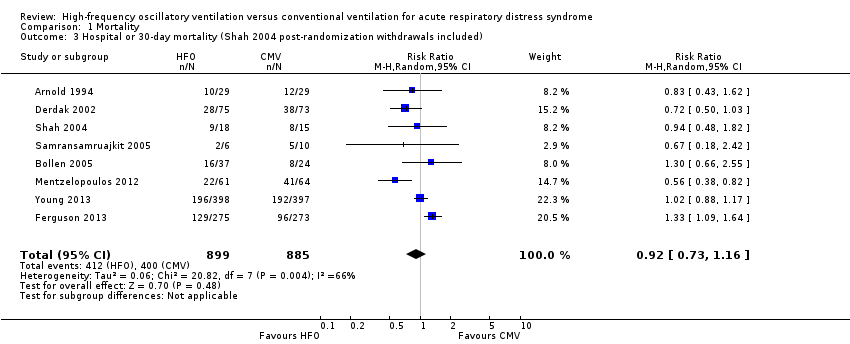
Comparison 1 Mortality, Outcome 3 Hospital or 30‐day mortality (Shah 2004 post‐randomization withdrawals included).

Comparison 1 Mortality, Outcome 4 Hospital or 30‐day mortality: adult versus paediatric trials.

Comparison 1 Mortality, Outcome 5 Hospital or 30‐day mortality: lung‐protective ventilation mandatory vs non‐mandatory.
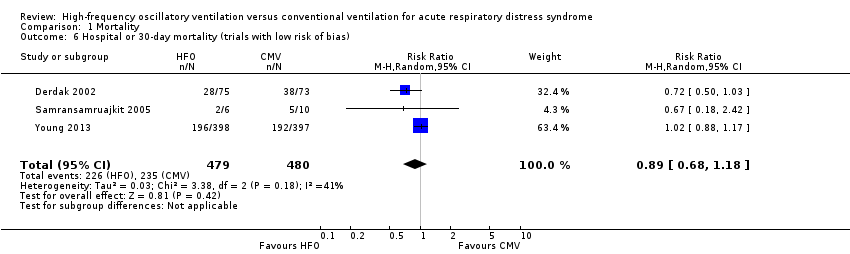
Comparison 1 Mortality, Outcome 6 Hospital or 30‐day mortality (trials with low risk of bias).

Comparison 2 Ventilator dependency, Outcome 1 Duration of mechanical ventilation.

Comparison 2 Ventilator dependency, Outcome 2 Ventilator‐free days.
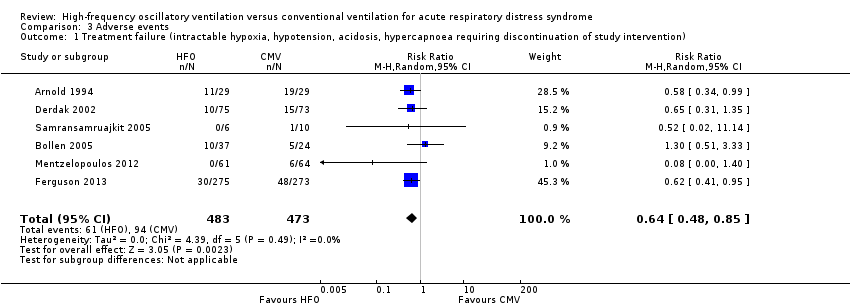
Comparison 3 Adverse events, Outcome 1 Treatment failure (intractable hypoxia, hypotension, acidosis, hypercapnoea requiring discontinuation of study intervention).
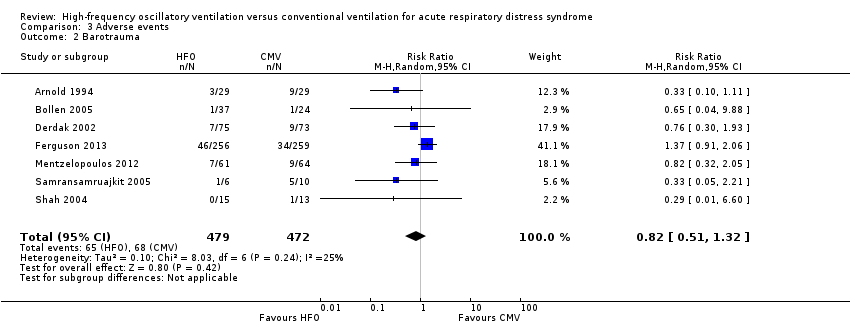
Comparison 3 Adverse events, Outcome 2 Barotrauma.

Comparison 3 Adverse events, Outcome 3 Hypotension.
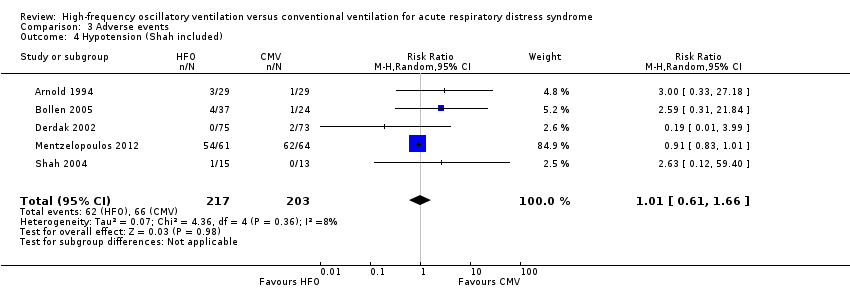
Comparison 3 Adverse events, Outcome 4 Hypotension (Shah included).

Comparison 3 Adverse events, Outcome 5 ETT obstruction.
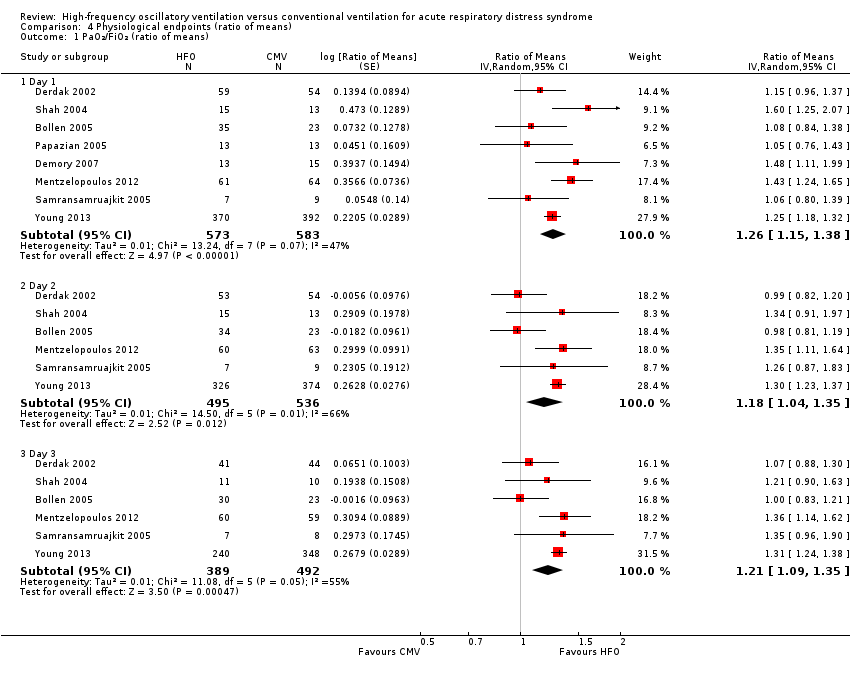
Comparison 4 Physiological endpoints (ratio of means), Outcome 1 PaO₂/FiO₂ (ratio of means).
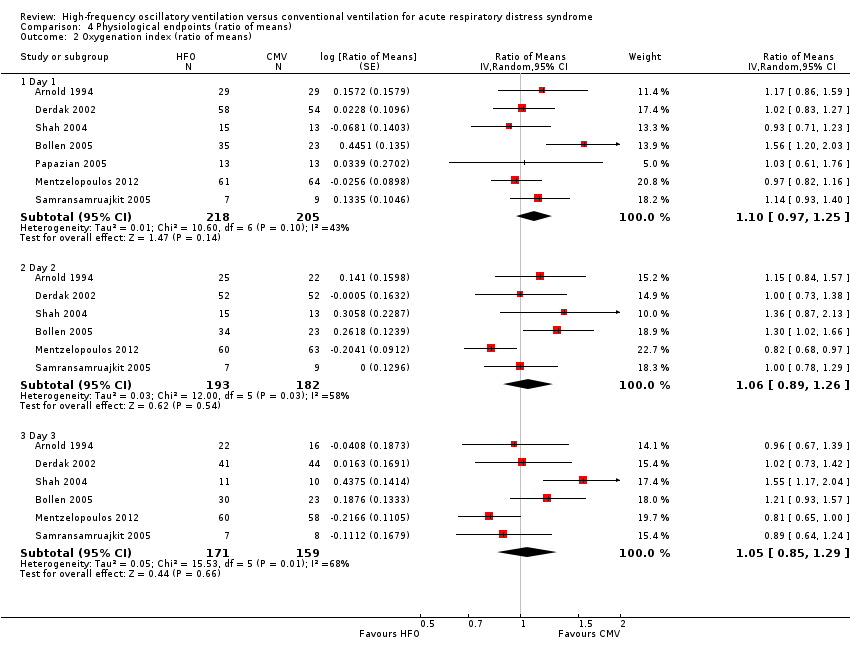
Comparison 4 Physiological endpoints (ratio of means), Outcome 2 Oxygenation index (ratio of means).
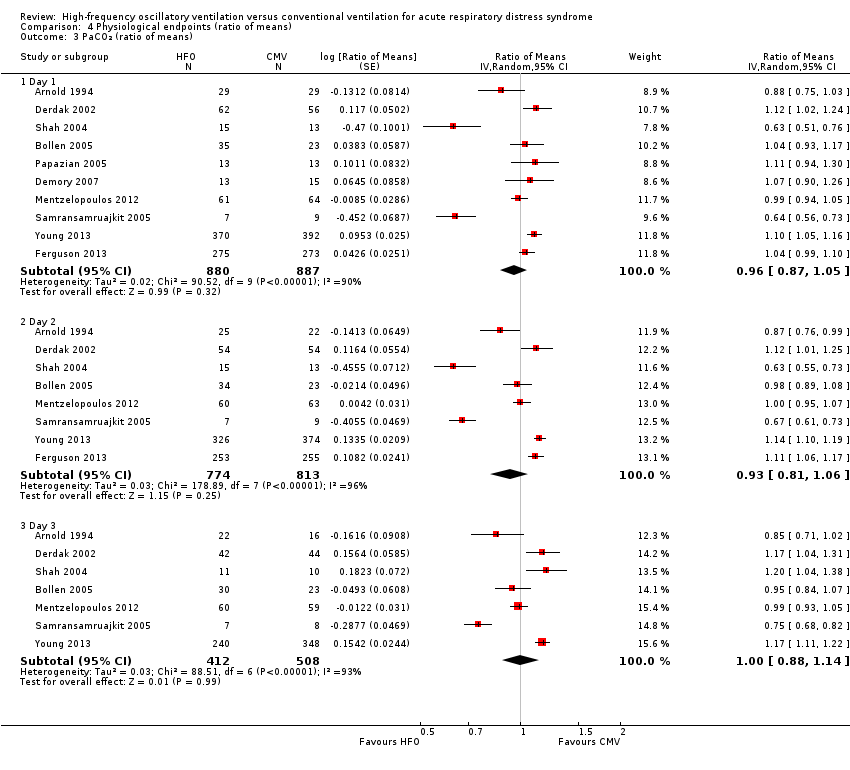
Comparison 4 Physiological endpoints (ratio of means), Outcome 3 PaCO₂ (ratio of means).

Comparison 4 Physiological endpoints (ratio of means), Outcome 4 Mean airway pressure (ratio of means).
| Patient or population: people with Acute Respiratory Distress Syndrome | ||||||
| Outcomes** | Illustrative comparative risks* (95% CI) | Relative effect | No of Participants | Quality of the evidence | Comments | |
| Assumed risk | Corresponding risk | |||||
| Conventional Mechanical Ventilation | High Frequency Oscillation | |||||
| Mortality (at 30 days or until hospital discharge) | Medium risk population1 | RR 0.92 | 1779 | ⊕⊝⊝⊝ | ||
| 470 per 1000 | 432 per 1000 | |||||
| Mortality (at 6 months) | Medium risk population | RR 0.79 | 148 | ⊕⊝⊝⊝ | ||
| 590 per 1000 | 466 per 1000 | |||||
| Treatment failure | Medium risk population1 | RR 0.64 | 956 | ⊕⊝⊝⊝ | ||
| 190 per 1000 | 122 per 1000 | |||||
| Duration of mechanical ventilation | The mean duration of mechanical ventilation in the control groups was | The mean duration of mechanical ventilation in the intervention groups was | 1142 | ⊕⊝⊝⊝ | ||
| Barotrauma | Medium risk population1 | RR 0.82 | 951 | ⊕⊝⊝⊝ | ||
| 131 per 1000 | 121 per 1000 | |||||
| Hypotension | Medium risk population1 | RR 1.02 | 392 | ⊕⊝⊝⊝ | ||
| 381 per 1000 | 389 per 1000 | |||||
| *The basis for the assumed risk (e.g. the median control group risk across studies) is provided in footnotes. The corresponding risk (and its 95% confidence interval) is based on the assumed risk in the comparison group and the relative effect of the intervention (and its 95% CI). ** Not shown:ventilator‐free days (very low quality 2,3,4,5, pooled analysis not performed due to extreme heterogeneity), endotracheal tube obstruction (very low quality2,4,5, pooled analysis not performed because all events occurred in one study), non‐clinical endpoints (i.e. physiologic endpoints, for example mean airway pressure, because these are not patient‐important outcomes). | ||||||
| GRADE Working Group grades of evidence | ||||||
| 1The basis of the assumed risk is the median risk in the control groups across trials. | ||||||
| Outcome or subgroup title | No. of studies | No. of participants | Statistical method | Effect size |
| 1 Hospital or 30‐day mortality Show forest plot | 8 | 1779 | Risk Ratio (M‐H, Random, 95% CI) | 0.92 [0.72, 1.16] |
| 2 Hospital or 30‐day mortality (Bollen 2005 and Mentzelopoulos 2012 participants lost to follow‐up censored) Show forest plot | 8 | 1775 | Risk Ratio (M‐H, Random, 95% CI) | 0.92 [0.73, 1.16] |
| 3 Hospital or 30‐day mortality (Shah 2004 post‐randomization withdrawals included) Show forest plot | 8 | 1784 | Risk Ratio (M‐H, Random, 95% CI) | 0.92 [0.73, 1.16] |
| 4 Hospital or 30‐day mortality: adult versus paediatric trials Show forest plot | 8 | 1779 | Risk Ratio (M‐H, Random, 95% CI) | 0.92 [0.72, 1.16] |
| 4.1 Adult trials | 6 | 1705 | Risk Ratio (M‐H, Random, 95% CI) | 0.93 [0.71, 1.21] |
| 4.2 Paediatric trials | 2 | 74 | Risk Ratio (M‐H, Random, 95% CI) | 0.80 [0.44, 1.43] |
| 5 Hospital or 30‐day mortality: lung‐protective ventilation mandatory vs non‐mandatory Show forest plot | 8 | 1779 | Risk Ratio (M‐H, Random, 95% CI) | 0.92 [0.72, 1.16] |
| 5.1 Lung‐protective ventilation not mandatory | 4 | 1062 | Risk Ratio (M‐H, Random, 95% CI) | 0.94 [0.77, 1.15] |
| 5.2 Lung‐protective ventilation mandatory | 4 | 717 | Risk Ratio (M‐H, Random, 95% CI) | 0.85 [0.47, 1.53] |
| 6 Hospital or 30‐day mortality (trials with low risk of bias) Show forest plot | 3 | 959 | Risk Ratio (M‐H, Random, 95% CI) | 0.89 [0.68, 1.18] |
| Outcome or subgroup title | No. of studies | No. of participants | Statistical method | Effect size |
| 1 Duration of mechanical ventilation Show forest plot | 5 | 1142 | Mean Difference (IV, Random, 95% CI) | 0.59 [‐1.09, 2.28] |
| 2 Ventilator‐free days Show forest plot | 2 | Mean Difference (IV, Random, 95% CI) | Totals not selected | |
| Outcome or subgroup title | No. of studies | No. of participants | Statistical method | Effect size |
| 1 Treatment failure (intractable hypoxia, hypotension, acidosis, hypercapnoea requiring discontinuation of study intervention) Show forest plot | 6 | 956 | Risk Ratio (M‐H, Random, 95% CI) | 0.64 [0.48, 0.85] |
| 2 Barotrauma Show forest plot | 7 | 951 | Risk Ratio (M‐H, Random, 95% CI) | 0.82 [0.51, 1.32] |
| 3 Hypotension Show forest plot | 4 | 392 | Risk Ratio (M‐H, Random, 95% CI) | 1.02 [0.54, 1.90] |
| 4 Hypotension (Shah included) Show forest plot | 5 | 420 | Risk Ratio (M‐H, Random, 95% CI) | 1.01 [0.61, 1.66] |
| 5 ETT obstruction Show forest plot | 4 | Risk Ratio (M‐H, Random, 95% CI) | Totals not selected | |
| Outcome or subgroup title | No. of studies | No. of participants | Statistical method | Effect size |
| 1 PaO₂/FiO₂ (ratio of means) Show forest plot | 8 | Ratio of Means (Random, 95% CI) | Subtotals only | |
| 1.1 Day 1 | 8 | 1156 | Ratio of Means (Random, 95% CI) | 1.26 [1.15, 1.38] |
| 1.2 Day 2 | 6 | 1031 | Ratio of Means (Random, 95% CI) | 1.18 [1.04, 1.35] |
| 1.3 Day 3 | 6 | 881 | Ratio of Means (Random, 95% CI) | 1.21 [1.09, 1.35] |
| 2 Oxygenation index (ratio of means) Show forest plot | 7 | Ratio of Means (Random, 95% CI) | Subtotals only | |
| 2.1 Day 1 | 7 | 423 | Ratio of Means (Random, 95% CI) | 1.10 [0.97, 1.25] |
| 2.2 Day 2 | 6 | 375 | Ratio of Means (Random, 95% CI) | 1.06 [0.89, 1.26] |
| 2.3 Day 3 | 6 | 330 | Ratio of Means (Random, 95% CI) | 1.05 [0.85, 1.29] |
| 3 PaCO₂ (ratio of means) Show forest plot | 10 | Ratio of Means (Random, 95% CI) | Subtotals only | |
| 3.1 Day 1 | 10 | 1767 | Ratio of Means (Random, 95% CI) | 0.96 [0.87, 1.05] |
| 3.2 Day 2 | 8 | 1587 | Ratio of Means (Random, 95% CI) | 0.93 [0.81, 1.06] |
| 3.3 Day 3 | 7 | 920 | Ratio of Means (Random, 95% CI) | 1.00 [0.88, 1.14] |
| 4 Mean airway pressure (ratio of means) Show forest plot | 9 | Ratio of Means (Random, 95% CI) | Subtotals only | |
| 4.1 Day 1 | 9 | 985 | Ratio of Means (Random, 95% CI) | 1.30 [1.26, 1.35] |
| 4.2 Day 2 | 7 | 888 | Ratio of Means (Random, 95% CI) | 1.25 [1.19, 1.31] |
| 4.3 Day 3 | 6 | 338 | Ratio of Means (Random, 95% CI) | 1.16 [1.06, 1.27] |