Asistencia respiratoria oscilatoria de alta frecuencia versus asistencia respiratoria convencional para el síndrome de dificultad respiratoria aguda
Resumen
Antecedentes
La oscilación de alta frecuencia (OAF) es una opción a la asistencia respiratoria mecánica convencional que a veces se utiliza para tratar a los pacientes con síndrome de dificultad respiratoria aguda, aunque no se conocen los efectos sobre la oxigenación, la mortalidad y los resultados clínicos adversos. Esta revisión se publicó originalmente en 2004, se actualizó en 2013 y nuevamente en 2015.
Objetivos
Determinar los efectos de la OAF comparada con la asistencia respiratoria mecánica convencional sobre los resultados fisiológicos, los resultados clínicos, y la mortalidad cuando se utiliza para el tratamiento del síndrome de dificultad respiratoria aguda (SDRA).
Métodos de búsqueda
Se hicieron búsquedas electrónicas en el Registro Cochrane Central de Ensayos Controlados (Cochrane Central Register of Controlled Trials) (CENTRAL) (Ovid), MEDLINE (Ovid), EMBASE (Ovid), y en ISI, desde su inicio hasta diciembre 2015. La búsqueda original se realizó en 2002. Se realizaron búsquedas manuales en las listas de referencias de los estudios incluidos y los artículos de revisión; se buscaron las actas de congresos de la American Thoracic Society (1994 a 2015), la Society of Critical Care Medicine (1994 a 2015), la European Society of Intensive Care Medicine (1994 a 2015) y el American College of Chest Physicians (1994 a 2015); se estableció contacto con expertos clínicos en el campo; y se buscaron ensayos no publicados y en curso en clinicaltrials.gov y controlled-trials.com.
Criterios de selección
Ensayos controlados aleatorizados (ECA) que compararan el tratamiento con OAF versus la asistencia respiratoria mecánica convencional en niños y adultos con diagnóstico de SDRA.
Obtención y análisis de los datos
Tres revisores extrajeron de forma independiente los datos sobre los resultados clínicos, fisiológicos y de seguridad según un protocolo predefinido. Se estableció contacto con los investigadores de todos los estudios incluidos para clarificar los métodos y obtener datos adicionales. Se utilizaron modelos de efectos aleatorios en los análisis.
Resultados principales
Se incluyeron 10 ECA (n = 1850); casi todos los participantes tenían SDRA moderado o grave. Para el análisis principal, el riesgo de sesgo fue bajo en tres estudios e incierto en cinco; la calidad general de la evidencia fue muy baja debido a la imprecisión, la incoherencia, la falta de direccionalidad de y las limitaciones metodológicas. En los participantes asignados al azar a la OAF, no hubo diferencias significativas en la mortalidad hospitalaria o a 30 días (riesgo relativo (RR) 0,92, intervalo de confianza (IC) del 95%: 0,72 a 1,16; P = 0,46, I² = 66%; 8 ensayos, 1.779 participantes, 807 muertes) en comparación con la ventilación convencional. Un ECA multicéntrico grande se interrumpió de forma temprana debido a la mayor mortalidad en los participantes asignados a la OAF en comparación con la asistencia respiratoria mecánica con volumen tidal bajo y presión positiva espiratoria final alta, y la OAF se reservó solamente como un tratamiento de rescate. Se encontró heterogeneidad estadística significativa entre los ensayos (I² = 0% a 66%) para los resultados clínicos, incluida la mortalidad.
Conclusiones de los autores
Los hallazgos de esta revisión sistemática sugieren que la OAF no reduce la mortalidad hospitalaria ni de 30 días debida al SDRA; la calidad de la evidencia fue muy baja. Los hallazgos no apoyan el uso de la OAF como una estrategia de primera línea en los pacientes sometidos a asistencia respiratoria mecánica por SDRA.
PICO
Resumen en términos sencillos
Oscilación de alta frecuencia para el tratamiento del síndrome de dificultad respiratoria aguda (SDRA)
Antecedentes
El síndrome de dificultad respiratoria aguda (SDRA) es un trastorno potencialmente mortal. Se caracteriza por inflamación pulmonar aguda, rigidez en los pulmones que aumenta el trabajo de la respiración y reducción en la capacidad de los pulmones de oxigenar suficientemente la sangre. Los que sobreviven pueden tener una calidad de vida reducida. Los pacientes que presentan SDRA suelen requerir un respirador artificial para evitar la muerte. La asistencia respiratoria con oscilación de alta frecuencia (OAF) es diferente de la asistencia respiratoria convencional en cuanto a que se administran respiraciones muy pequeñas muy rápidamente (180 a 900 respiraciones por minuto). La OAF ayuda a que el tejido pulmonar colapsado se abra al proporcionar presión positiva constante en las vías respiratorias del paciente. Se realizó una revisión sistemática para determinar si la OAF mejora los resultados clínicos (incluida la prevención de la muerte) en comparación con la asistencia respiratoria mecánica convencional en adultos y niños con SDRA.
Características de los estudios
Se incluyeron 10 ensayos controlados aleatorizados (ECA) que reclutaron a 1850 participantes en esta revisión actualizada. Un ensayo grande se interrumpió debido a la mayor cantidad de muertes entre los participantes asignados al azar a la OAF. Cuatro ensayos informaron al menos algún financiamiento de los fabricantes de respiradores para OAF.
Resultados clave
La OAF no redujo el riesgo de muerte hospitalaria en ocho ensayos que incluyeron a 1779 participantes. La capacidad de los pulmones de oxigenar la sangre, medida a las 24 a 72 horas de respiración asistida después de la asignación al azar, fue del 18% al 26% mejor en los pacientes que recibieron OAF. La OAF no tuvo efecto sobre el período de tiempo que se necesitó una máquina de asistencia respiratoria artificial. No aumentó el riesgo de efectos secundarios indeseables, que incluye presión arterial baja o lesiones adicionales a los pulmones por la alta presión en las vías respiratorias.
Calidad de la evidencia
Se encontró una inconsistencia significativa entre los ensayos clínicos que informaron el efecto de la OAF sobre el riesgo de muerte en los participantes con SDRA. La calidad de la evidencia es muy baja para resultados que serían muy importantes para los pacientes. Este hecho se debe a una falta de precisión y consistencia, y a que en muchos casos los métodos utilizados por los investigadores durante los ensayos clínicos no tuvieron el estándar más alto. Lo anterior indica que hay dudas considerables con respecto al efecto de la OAF sobre la muerte. Ensayos aleatorizados adicionales podrían cambiar estos resultados.
Authors' conclusions
Summary of findings
| Patient or population: people with Acute Respiratory Distress Syndrome | ||||||
| Outcomes** | Illustrative comparative risks* (95% CI) | Relative effect | No of Participants | Quality of the evidence | Comments | |
| Assumed risk | Corresponding risk | |||||
| Conventional Mechanical Ventilation | High Frequency Oscillation | |||||
| Mortality (at 30 days or until hospital discharge) | Medium risk population1 | RR 0.92 | 1779 | ⊕⊝⊝⊝ | ||
| 470 per 1000 | 432 per 1000 | |||||
| Mortality (at 6 months) | Medium risk population | RR 0.79 | 148 | ⊕⊝⊝⊝ | ||
| 590 per 1000 | 466 per 1000 | |||||
| Treatment failure | Medium risk population1 | RR 0.64 | 956 | ⊕⊝⊝⊝ | ||
| 190 per 1000 | 122 per 1000 | |||||
| Duration of mechanical ventilation | The mean duration of mechanical ventilation in the control groups was | The mean duration of mechanical ventilation in the intervention groups was | 1142 | ⊕⊝⊝⊝ | ||
| Barotrauma | Medium risk population1 | RR 0.82 | 951 | ⊕⊝⊝⊝ | ||
| 131 per 1000 | 121 per 1000 | |||||
| Hypotension | Medium risk population1 | RR 1.02 | 392 | ⊕⊝⊝⊝ | ||
| 381 per 1000 | 389 per 1000 | |||||
| *The basis for the assumed risk (e.g. the median control group risk across studies) is provided in footnotes. The corresponding risk (and its 95% confidence interval) is based on the assumed risk in the comparison group and the relative effect of the intervention (and its 95% CI). ** Not shown:ventilator‐free days (very low quality 2,3,4,5, pooled analysis not performed due to extreme heterogeneity), endotracheal tube obstruction (very low quality2,4,5, pooled analysis not performed because all events occurred in one study), non‐clinical endpoints (i.e. physiologic endpoints, for example mean airway pressure, because these are not patient‐important outcomes). | ||||||
| GRADE Working Group grades of evidence | ||||||
| 1The basis of the assumed risk is the median risk in the control groups across trials. | ||||||
Background
Description of the condition
Acute respiratory distress syndrome (ARDS) is a life‐threatening condition characterized by acute lung inflammation causing pulmonary congestion, hypoxaemia, and decreased pulmonary compliance. ARDS is defined as a syndrome characterized by acute onset (i.e. within seven days), bilateral pulmonary infiltrates on chest radiograph not fully explained by cardiac failure or fluid overload, and ratio of arterial oxygen tension to fraction of inspired oxygen (PaO₂/FiO₂) less than 300. People with mild ARDS (formerly called acute lung injury) have a PaO₂/FiO₂ between 200 and 300. Moderate and severe ARDS refer to the more severely ill subset of people in whom the PaO₂/FiO₂ ratio is less than or equal to 200 and 100 respectively (ARDS Definition Task Force 2012). ARDS has a fairly high incidence (Rubenfeld 2005) and is associated with substantial mortality (Phua 2009; Rubenfeld 2005), morbidity (Angus 2001; Herridge 2003; Herridge 2011), and costs (Cheung 2006).
Description of the intervention
High‐frequency oscillation (HFO) is an alternative ventilation technique in which very small tidal volumes are delivered at very high frequencies using an oscillatory pump while mean airway pressure is held constant. Humidified, oxygenated gas (bias flow) passes in front of a diaphragm which oscillates at high frequencies (3 to 15 Hz, or 180 to 900 breaths per minute). The mean airway pressure is determined by the rate of bias flow and by a resistance valve at the end of the bias flow circuit. Tidal volumes are much smaller during high‐frequency oscillation (1 to 4 mL/kg) compared to mechanical ventilation, and the constant mean airway pressure leads to smaller changes in alveolar pressure. Because tidal volumes during HFO may be smaller than anatomic dead space, gas exchange occurs through gas mixing as opposed to bulk flow. Mechanisms of gas exchange during HFO include direct ventilation of proximal alveoli, Taylor dispersion, asymmetric velocity profiles, pendelluft, and diffusion (Slutsky 2002).
How the intervention might work
Mechanical ventilation is usually required for adequate tissue oxygenation (Artigas 1998) but may also perpetuate lung injury by over‐distending and rupturing healthy alveoli, and by triggering a secondary inflammatory response that amplifies lung injury from repeatedly opening and collapsing lung units (Dreyfuss 1988; Gattinoni 2005; Muscedere 1994; Ranieri 1999). Lung‐protective ventilation seeks to limit alveolar distension, recruit non‐aerated alveoli, and prevent further alveolar collapse (Gattinoni 2006). Low tidal volumes with (Amato 1998; Meade 2008; Mercat 2008; Villar 2006) or without (ARDS Network 2000; Brochard 1998; Stewart 1998) high positive end‐expiratory pressure may reduce ventilator‐induced lung injury. Nevertheless, mortality in people with ARDS remains high (Phua 2009; Rubenfeld 2005). HFO theoretically meets the goals of a lung‐protective ventilation strategy (Rimensberger 2003), with extremely small tidal volumes (1 to 4 mL/kg) and constant lung recruitment.
Why it is important to do this review
Although HFO is used in some centres in people with ARDS who do not tolerate conventional mechanical ventilation (Chan 2005; Finkielman 2006; Mehta 2004), its role, especially outside the realm of ‘rescue’ therapy, remains controversial (Ferguson 2008; Kacmarek 2008). Several observational studies (Ferguson 2005; Fort 1997; Mehta 2001) show improved oxygenation when hypoxaemia seems refractory. Our earlier systematic review of randomized controlled trials (Sud 2013) included eight small trials, and found that HFO might reduce mortality, although several trials did not mandate optimal lung‐protective ventilation in control groups. Additional studies have subsequently become available. Furthermore, in the context of recent (Dominguez‐Cherit 2009; Kumar 2009) and future pandemics, there is a pressing need for evidence‐based syntheses of the effects of potentially life‐saving interventions for people with ARDS. We have therefore updated our previous systematic review and meta‐analysis of randomized controlled trials (Sud 2013) comparing HFO to conventional mechanical ventilation for adults and children with ARDS, to determine the effects of HFO on mortality, other clinical and physiological outcomes, and adverse events, to address these issues.
Objectives
To determine the effects of HFO compared to conventional mechanical ventilation on physiological outcomes, clinical outcomes, and mortality when used for the treatment of acute respiratory distress syndrome (ARDS).
Methods
Criteria for considering studies for this review
Types of studies
We included parallel‐group, randomized controlled trials (RCTs) which compared HFO to conventional mechanical ventilation for the treatment of ARDS and reported at least one of our prespecified outcomes.
Types of participants
We included adults or children (greater than four weeks old and 42 weeks post‐conception) with ARDS who were receiving conventional mechanical ventilation. We accepted authors' definitions of ARDS. In trials enrolling participants with other forms of respiratory failure, we stipulated that a minimum of 70% of participants must have ARDS to meet the inclusion criteria. We included trials that enrolled both adults and children because we believed that the physiological benefits of lung recruitment and reduction in tidal volume that occur during high‐frequency oscillation would be similar for both adult and paediatric ARDS (Albuali 2007; ARDS Network 2000; Hanson 2006; Miller 2008).
Types of interventions
We included studies in which participants were randomly assigned to two or more groups, including an experimental group that received HFO and a control group that received conventional mechanical ventilation for ARDS. We also included trials in which a secondary intervention was delivered as part of HFO, such as tracheal gas insufflation or recruitment manoeuvres, since these are applied in association with HFO in some centres. We included trials in which the duration of HFO was 24 hours or less for physiological outcome analyses but excluded them from analyses of major clinical outcomes, such as mortality.
Types of outcome measures
Primary outcomes
-
Hospital or 30‐day mortality
Secondary outcomes
-
Six‐month mortality
-
Duration of mechanical ventilation (in days, as stated by the authors)
-
Ventilator‐free days to day 28 or 30 (in days, as stated by the authors)
-
Health‐related quality of life at one year
-
Treatment failure, leading to cross‐over to the other arm or discontinuation of the study protocol. We accepted authors’ definitions of treatment failure, which could include severe oxygenation failure, ventilation failure, hypotension, or barotrauma (pneumothorax, pneumomediastinum, subcutaneous emphysema)
-
The ratio of partial pressure of arterial oxygen (PaO₂) to inspired fraction of oxygen (FiO₂) (PaO₂/FiO₂ ratio) at 24, 48, and 72 hours after randomization
-
Oxygenation index ((OI), defined as 100 x mean airway pressure/(PaO₂/FiO₂ ratio)) measured at 24, 48, and 72 hours after randomization
-
Ventilation, measured by partial pressure of carbon dioxide (PaCO₂) at 24, 48, and 72 hours after randomization
-
Mean airway pressure 24, 48, and 72 hours after randomization
-
Barotrauma (as stated by the authors)
-
Hypotension (as stated by the authors)
-
Endotracheal tube obstruction due to secretions
-
Technical complications and equipment failure in participants treated with HFO (including unintentional system air leaks and problems with the oscillatory diaphragm, humidifier, and alarm systems) (Cartotto 2004; Finkielman 2006)
Search methods for identification of studies
We used systematic methods to identify published and unpublished RCTs comparing HFO to conventional mechanical ventilation in participants with ARDS, or other forms of hypoxaemic respiratory failure (Meade 1997).
For the previous version of this review (Sud 2013) we searched until 2011.
Electronic searches
To update our previous literature search, we:
-
electronically searched the Cochrane Central Register of Controlled Trials (CENTRAL) (the Cochrane Library 2015, Issue 11), MEDLINE (OvidSP) (1948 to December 2015), and EMBASE (OvidSP) (1980 to December 2015); please see Appendix 1 for search details; and
-
searched for unpublished and ongoing trials in clinicaltrials.gov and controlled‐trials.com.
Searching other resources
In addition to the electronic search, we:
-
manually searched reference lists from included studies and review articles;
-
searched conference proceedings of the American Thoracic Society (1994 to 2015), Society of Critical Care Medicine (1994 to 2015), European Society of Intensive Care Medicine (1994 to 2015), and American College of Chest Physicians (1994 to 2015); and
-
contacted clinical experts in the field.
Data collection and analysis
We collected and analysed data according to a prespecified protocol and analysis plan (Sud 2013; Differences between protocol and review). We assessed the quality of evidence for major clinical outcomes including mortality and treatment failure according to recommendations of the GRADE working group (Schünemann 2008).
Selection of studies
Two review authors (SS, MS) who were not blinded to study authors or results (Berlin 1997) independently evaluated study eligibility and resolved differences by consensus. We recorded the selection process in sufficient detail to complete a PRISMA flow diagram (Moher 2015), and Characteristics of excluded studies tables. We did not impose any language restrictions.
Data extraction and management
Three review authors (SS, MS, JF), using a standardized spreadsheet, independently abstracted data on study methods, details of ventilation strategies, and study outcomes. We resolved any disagreements remaining after author contact by consensus.
Assessment of risk of bias in included studies
We abstracted data on methods of randomization and allocation concealment (Chalmers 1983), number of post‐randomization withdrawals and losses to follow‐up, cross‐overs between assigned groups, blinding of outcome assessors (Schulz 1995), and early stopping for benefit (Montori 2005). We summarized the risk of bias for individual studies using the Cochrane ‘Risk of bias’ instrument (Higgins 2011). Since blinding of caregivers, participants, and family members was impossible in these trials, we determined whether important co‐interventions (weaning, sedation, and paralysis) and use of rescue therapies for refractory respiratory failure (inhaled nitric oxide, prone positioning, steroids, and extracorporeal oxygenation) were standardized or equally applied in treatment groups.
Measures of treatment effect
We reported continuous outcomes using the mean difference (MD), a measure of absolute change, and binary outcomes as risk ratios (RRs). For continuous physiological outcomes we reported ratio of means (RoM), a measure of relative change (Friedrich 2008). We considered a (two‐sided) P value < 0.05 as statistically significant and report individual trial and summary results with 95% confidence intervals (CIs).
Unit of analysis issues
For clinical outcomes, the unit of analysis was the participant. We did not identify any issues of 'double‐counting', for example the reporting of number of events instead of the number of participants who experienced an event.
For physiologic outcomes, the unit of analysis was at the study level since investigators reported the mean, standard error or standard deviation, and the number of participants with measurements. Because several trials used repeated measurements for physiologic endpoints (for example PaO₂/FiO₂) we chose to perform a separate meta‐analysis for each of these endpoints at the prespecified times of 24, 48, and 72 hours after randomization.
Dealing with missing data
We contacted primary investigators of all included trials by email and fax to request additional data and to clarify methodology after careful review of each study. Primary investigators provided additional clinical (Demory 2007; Derdak 2002; Mentzelopoulos 2012; Papazian 2005; Samransamruajkit 2005; Shah 2004) or physiologic data (Derdak 2002; Mentzelopoulos 2012; Samransamruajkit 2005; Shah 2004), or clarified data or methods (Arnold 1994; Bollen 2005; Demory 2007; Derdak 2002; Ferguson 2013; Mentzelopoulos 2012; Papazian 2005; Samransamruajkit 2005; Shah 2004; Young 2013).
Assessment of heterogeneity
Potential sources of clinical and methodological heterogeneity between studies included participants, ventilation strategies, and outcome definitions. Because we felt that this diversity would not support the underlying assumptions of a fixed‐effect model, we used random‐effects models for all pooled analyses. Random‐effects models incorporate both within‐study and between‐study variation and typically provide wider CIs when heterogeneity is present. We assessed between‐study statistical heterogeneity for each outcome using the I² measure (Higgins 2002; Higgins 2003) and used published guidelines for low (I² = 25% to 49%), moderate (I² = 50% to 74%), and high (I² ≥ 75%) heterogeneity (Higgins 2003). We investigated potential sources of clinical and methodological heterogeneity through a priori subgroup analyses and sensitivity analyses (see Subgroup analysis and investigation of heterogeneity; Sensitivity analysis).
Assessment of reporting biases
We tested for publication bias statistically using the Begg’s Rank Correlation test (Begg 1994) and Macaskill’s regression test (Macaskill 2001) as modified by Peters et al (Peters 2006).
Data synthesis
For each prespecified outcome, we employed random‐effects models to perform meta‐analysis with Review Manager 5 (RevMan 2014) where at least two trials with similar participants, interventions, and outcome definitions reported adequate data. We used the Mantel‐Haenszel variance estimator to obtain pooled risk ratios for dichotomous outcomes, and the generic inverse variance method to pool ratio‐of‐means outcomes. We generated forest plots to summarize our results and reported risk ratio or ratio of means with corresponding 95% CIs. We used Microsoft Excel with equations for the ratio of means to generate the ratio and standard error.
We used the metabias command in STATA 9.2 (Stata 9.2) for statistical tests of publication bias. Given the low statistical power of these tests, we assumed a more liberal level of significance (P value < 0.10) to indicate possible publication bias.
Subgroup analysis and investigation of heterogeneity
A priori, we planned subgroup analyses to explore potential heterogeneity for the primary outcome of hospital or 30‐day mortality and to test whether results were consistent for important subgroups of trials or participants.
First, we hypothesized that age might influence the benefit from HFO. Increasing age worsens the prognosis in ARDS and thus older participants might benefit less from HFO compared with younger participants (Brun‐Buisson 2004; Flori 2005). Conversely, HFO is commonly used for neonatal respiratory distress syndrome and thus children may benefit more from HFO compared to adults (Cools 2015). We therefore performed a subgroup analysis comparing effects of HFO in trials enrolling post‐neonatal children (weight ≤ 35 kg, as defined in the paediatric trials) versus adults.
Second, we hypothesized that the subset of participants with severe and life‐threatening hypoxaemia may benefit more from HFO, recognizing that most people with ARDS do not die of hypoxaemia (Montgomery 1985; Stapleton 2005). We therefore planned a subgroup analysis of participants with a higher (≥ 150) versus lower (< 150) baseline PaO₂/FiO₂ ratio, but insufficient data precluded this analysis.
We performed a post hoc subgroup analysis comparing trials which mandated lung‐protective ventilation in the control group, defined as ≤ 8 mL/kg of ideal or predicted body weight, to trials that did not mandate tidal volumes ≤ 8 mL/kg, to examine whether the benefit of HFO might be greater when compared to conventional ventilation with higher tidal volumes compared to conventional ventilation with smaller tidal volumes (ARDS Network 2000; Brochard 1998; Stewart 1998).
We assessed any subgroup effects using a z‐test for interaction.
Sensitivity analysis
A priori, we hypothesized that potential methodological biases (e.g. quasi‐randomization or unclear or unconcealed allocation) might influence the results of our meta‐analysis in favour of HFO, whereas excessive cross‐overs or losses to follow‐up might bias the results against HFO. We therefore performed a sensitivity analysis limited to trials at low risk of bias, across all domains of the Cochrane 'Risk of bias' tool.
We also performed a sensitivity analysis in which we excluded trials at risk of bias due to early termination for benefit or harm.
Finally, we performed additional sensitivity analyses to test the robustness of our findings under alternative assumptions where data were incomplete or missing after author contact (for example, censoring participants who were lost to follow‐up). These are described in the text (see Effects of interventions).
Results
Description of studies
Results of the search
In our original review (Sud 2013) we identified eight trials that were relevant to our topic of interest. We included eight RCTs (Arnold 1994; Bollen 2005; Demory 2007; Derdak 2002; Mentzelopoulos 2012; Papazian 2005; Samransamruajkit 2005; Shah 2004) and excluded seven studies (Carlon 1983; Dobyns 2002; Fessler 2008; Hurst 1984; Hurst 1990; Mentzelopoulos 2007a; Mentzelopoulos 2010).
In this updated version, we searched from the start of 2011 to December 2015; we identified 1111 citations from searches of electronic bibliographic databases and eight citations from our previous systematic review (Arnold 1994; Bollen 2005; Demory 2007; Derdak 2002; Mentzelopoulos 2012; Papazian 2005; Samransamruajkit 2005; Shah 2004). We retrieved 12 citations for detailed evaluation, of which 10 were unique RCTs (Arnold 1994; Bollen 2005; Demory 2007; Derdak 2002; Ferguson 2013; Mentzelopoulos 2012; Papazian 2005; Samransamruajkit 2005; Shah 2004; Young 2013) which met the criteria for this review. One citation was an abstract for an RCT which was included after we obtained additional details from the primary investigator (Shah 2004), and one citation was for an RCT which did not meet our inclusion criteria (Vrettou 2014). Review authors were in perfect agreement for study inclusion.
See Figure 1.

Study flow diagram for the updated literature search (from 2011 to Dec 2015, see also Results of the search)
Included studies
The 10 included trials (Arnold 1994; Bollen 2005; Demory 2007; Derdak 2002; Ferguson 2013; Mentzelopoulos 2012; Papazian 2005; Samransamruajkit 2005; Shah 2004; Young 2013) (see Characteristics of included studies) enrolled 1850 participants with ARDS. Nine trials (Bollen 2005; Demory 2007; Derdak 2002; Ferguson 2013; Mentzelopoulos 2012; Papazian 2005; Samransamruajkit 2005; Shah 2004; Young 2013) enrolled participants exclusively with ARDS (n = 1780), and 86% of the participants in the 10th trial had ARDS (Arnold 1994). Two trials enrolled only children (Arnold 1994; Samransamruajkit 2005). One trial is currently published as an abstract (Shah 2004). All trials (Arnold 1994; Bollen 2005; Demory 2007; Derdak 2002; Ferguson 2013; Mentzelopoulos 2012; Papazian 2005; Samransamruajkit 2005; Shah 2004; Young 2013) studied HFO as an initial ventilation strategy for ARDS as opposed to rescue therapy for refractory hypoxaemia. The trials enrolled participants within 48 (Demory 2007; Papazian 2005; Samransamruajkit 2005) or 72 (Mentzelopoulos 2012) hours of diagnosis of ARDS, or shortly after initiation of mechanical ventilation, mean of less than three days (Bollen 2005; Derdak 2002; Ferguson 2013; Young 2013) or five days (Arnold 1994; Shah 2004). All trials treated participants continuously with HFO except for one that applied HFO for six to 24 hours per day (most participants were treated for at least four days) according to a protocol until predefined criteria for resolution of severe ARDS had been met (Mentzelopoulos 2012). In two trials participants were treated for ≤ 24 hours (Demory 2007; Papazian 2005). The median baseline PaO₂/FiO₂ ratio was 113 (range 102 to 122) in nine trials (Bollen 2005; Demory 2007; Derdak 2002; Ferguson 2013; Mentzelopoulos 2012; Papazian 2005; Samransamruajkit 2005; Shah 2004; Young 2013).
Details of high frequency oscillation
Participants received HFO for a prespecified period (Demory 2007; Papazian 2005) (n = 54), until prespecified criteria for weaning from HFO were met (Arnold 1994; Bollen 2005; Derdak 2002; Ferguson 2013; Mentzelopoulos 2012; Samransamruajkit 2005; Young 2013) (n = 1763), or until clinical resolution of ARDS (Shah 2004) (n = 33). All studies standardized HFO implementation (Arnold 1994; Bollen 2005; Demory 2007; Derdak 2002; Ferguson 2013; Mentzelopoulos 2012; Papazian 2005; Samransamruajkit 2005; Shah 2004; Young 2013). HFO was initiated with a mean airway pressure 2 to 5 cm H₂O above mean airway pressure while on conventional ventilation (Arnold 1994; Bollen 2005; Demory 2007; Derdak 2002; Mentzelopoulos 2012; Papazian 2005; Samransamruajkit 2005; Shah 2004) (n = 507), 5 cm H₂0 above plateau pressure (Young 2013) (n = 795), or at 30 cm H₂0 (Ferguson 2013) (n = 548). The initial frequency was set between 4 and 10 Hz. Pressure amplitude of oscillation was determined subjectively by chest wall vibration (Arnold 1994; Bollen 2005; Derdak 2002; Shah 2004) (n = 312), set according to arterial partial pressure of carbon dioxide (Demory 2007; Mentzelopoulos 2012; Papazian 2005) (n = 195), set at 10 cm H₂O above the peak inspiratory pressure during prerandomization conventional mechanical ventilation (Samransamruajkit 2005) (n = 16), or set at 90 cm H₂0 (Ferguson 2013) (n = 548). Many trials described adjunctive measures during HFO, including partial endotracheal tube cuff leak for hypercarbia (Demory 2007; Derdak 2002; Ferguson 2013; Mentzelopoulos 2012; Papazian 2005; Shah 2004) (n = 908), tracheal gas insufflation (Mentzelopoulos 2012) (n = 125), and recruitment manoeuvres (Demory 2007; Ferguson 2013; Mentzelopoulos 2012; Papazian 2005) (n = 727).
Details of conventional mechanical ventilation
All trials provided a description of conventional mechanical ventilation. Protocols for adjusting settings during conventional mechanical ventilation were described in six trials (Demory 2007; Derdak 2002; Ferguson 2013; Mentzelopoulos 2012; Papazian 2005; Shah 2004) (n = 908). Five trials (Demory 2007; Ferguson 2013; Mentzelopoulos 2012; Papazian 2005; Shah 2004) (n = 760) used low tidal volume ventilation in all participants (6 to 8 mL/kg predicted body weight (Demory 2007; Ferguson 2013; Mentzelopoulos 2012; Shah 2004) or ideal body weight (Papazian 2005)), and five trials (Demory 2007; Ferguson 2013; Mentzelopoulos 2012; Samransamruajkit 2005; Shah 2004) (n = 750) mandated plateau pressure below 35 cm H₂O. Eight trials (Bollen 2005; Demory 2007; Derdak 2002; Ferguson 2013; Mentzelopoulos 2012; Papazian 2005; Shah 2004; Young 2013 ) (n = 1764) reported a mean positive end‐expiratory pressure of 11 to 18 cm H₂O during the first 72 hours of conventional mechanical ventilation.
Excluded studies
See Characteristics of excluded studies.
In our original review we excluded two studies (Carlon 1983; Hurst 1990) because they enrolled participants without ARDS, four studies (Dobyns 2002; Fessler 2008; Mentzelopoulos 2007a; Mentzelopoulos 2010) because they randomized on interventions other than HFO, and one study (Hurst 1984) which was a cross‐over trial. In this update, we excluded one additional trial (Vrettou 2014) which was a cross‐over trial.
Awaiting classification
We found no studies awaiting classification.
Ongoing studies
We found no ongoing studies.
Risk of bias in included studies
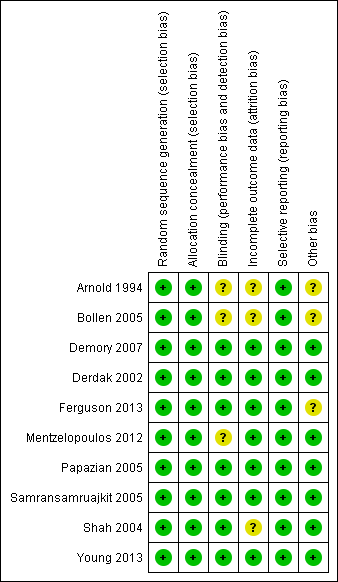
Five trials (Demory 2007; Derdak 2002; Papazian 2005; Samransamruajkit 2005; Young 2013 ) had low risk of bias for our main outcome, hospital or 30‐day mortality, across all domains of the Cochrane 'Risk of bias' tool (except for blinding, which was not possible because of the nature of the intervention). The risk of bias was unclear in five studies (Arnold 1994; Bollen 2005; Ferguson 2013; Mentzelopoulos 2012; Shah 2004;) (see Characteristics of included studies; Figure 2; Figure 3).

Methodological quality summary: review authors' judgements about each methodological quality item for each included study.

Methodological quality graph: review authors' judgements about each methodological quality item presented as percentages across all included studies.
Allocation
All trials concealed allocation and analysed clinical outcomes for participants by assigned group (Arnold 1994; Bollen 2005; Demory 2007; Derdak 2002; Ferguson 2013; Mentzelopoulos 2012; Papazian 2005; Shah 2004; Young 2013) or provided enough information to perform analyses according to assigned group (Samransamruajkit 2005).
Blinding
Although no study could be completely blinded due to the nature of the intervention, the primary outcome for our systematic review was hospital or 30‐day mortality, which would be less susceptible to detection bias. Three studies reported partial blinding of: study investigators (Derdak 2002; Ferguson 2013); trial sponsors (Derdak 2002); and radiologists who assessed for barotrauma (Arnold 1994). All included trials used standardized protocols for the implementation of HFO, and six trials used protocols for adjusting settings during conventional mechanical ventilation (Demory 2007; Derdak 2002; Ferguson 2013; Mentzelopoulos 2012; Papazian 2005; Shah 2004, n = 908) or provided guidelines to standardize conventional mechanical ventilation (Young 2013, n = 795), which would have reduced performance bias.
Incomplete outcome data
Seven trials (Bollen 2005; Demory 2007; Ferguson 2013; Mentzelopoulos 2012; Papazian 2005; Samransamruajkit 2005; Young 2013) reported no post‐randomization withdrawals; in three trials 1.4% (2/148) (Derdak 2002), 17% (12/70) (Arnold 1994), and 15% (5/33) (Shah 2004) of participants were withdrawn after randomization. After contacting investigators, we obtained mortality data for withdrawn participants in two trials (Derdak 2002; Shah 2004).
There was no loss to follow‐up in eight studies (Arnold 1994; Demory 2007; Derdak 2002; Ferguson 2013; Papazian 2005; Shah 2004; Samransamruajkit 2005; Young 2013) Two studies reported losses to follow‐up: intensive care unit (ICU) but not 30‐day mortality was available for 5% (3/61) of participants in one study (Bollen 2005); in another trial, one of 61 participants randomized to HFO was lost to follow‐up after being discharged to another institution on day 31 after randomization (Mentzelopoulos 2012).
Selective reporting
We found no evidence of selective reporting within in the included studies.
We found no evidence of publication bias. Neither Begg’s Rank Correlation test (P value = 0.71) nor Macaskill‐Peters' regression test (P value = 0.401) was significant.
Other potential sources of bias
Two trials were terminated early because of low recruitment (Bollen 2005) or after early stopping criteria for harm were nearly met (Ferguson 2013).
Seven trials (Arnold 1994; Bollen 2005; Derdak 2002; Ferguson 2013; Mentzelopoulos 2012; Samransamruajkit 2005; Young 2013) reported cross‐overs between groups (range 1.3% to 52% of all randomized participants), which involved 0% to 19% of participants randomized to HFO (11/29 (Arnold 1994), 7/37 (Bollen 2005), 4/75 (Derdak 2002), 0/27 (Mentzelopoulos 2012), 0/6 (Samransamruajkit 2005) and 0/398 (Young 2013); and 2.5% to 65% of participants randomized to conventional ventilation (19/29 (Arnold 1994), 4/24 (Bollen 2005), 9/73 (Derdak 2002), 31/273 (Ferguson 2013), 2/27 (Mentzelopoulos 2012), 1/10 (Samransamruajkit 2005), and 10/397 (Young 2013)).
Effects of interventions
Primary outcomes
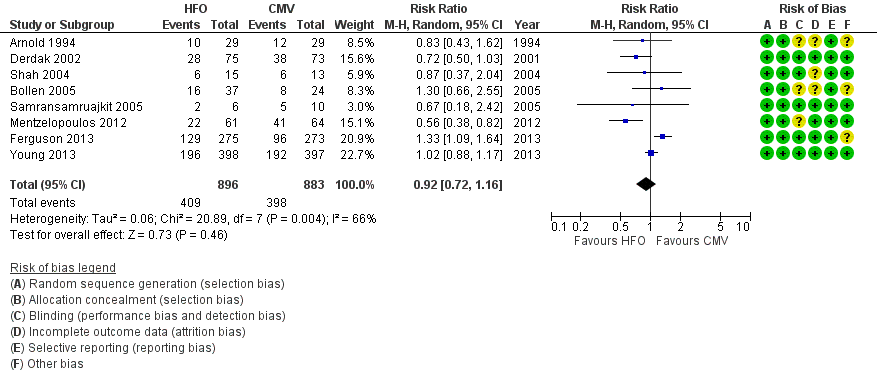
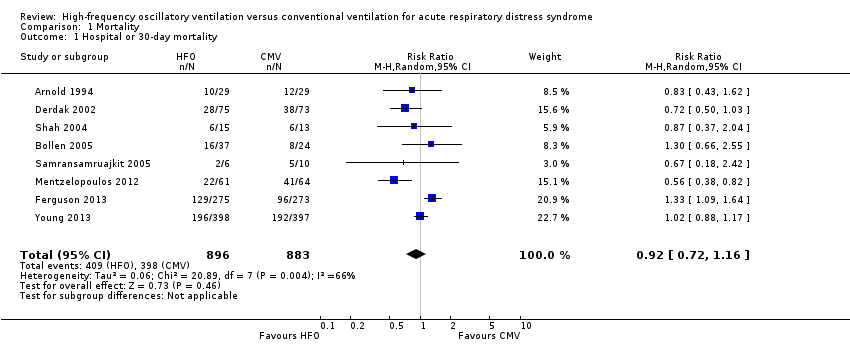
1. Hospital or 30‐day mortality
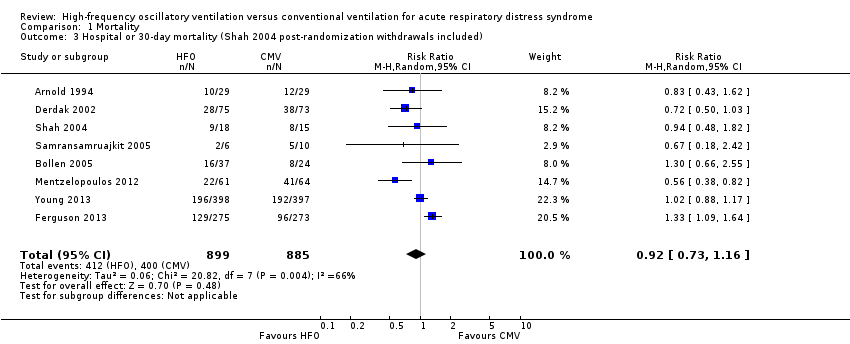
In the primary analysis, including eight trials that treated participants with HFO until prespecified criteria for weaning or resolution of ARDS (Arnold 1994; Bollen 2005; Derdak 2002; Ferguson 2013; Mentzelopoulos 2012; Samransamruajkit 2005; Shah 2004; Young 2013) (n = 1779), the median hospital or 30‐day mortality in the control group was 47% (range 33% to 67%). HFO did not reduce hospital or 30‐day mortality (RR 0.92, 95% CI 0.72 to 1.16; P = 0.46; Figure 4).

Forest plot of comparison: 1 Mortality, outcome: 1.1 Hospital or 30‐day mortality. (HFO = high frequency oscillation, CMV = conventional mechanical ventilation)
Mortality was determined at discharge from hospital (Ferguson 2013; Mentzelopoulos 2012; Samransamruajkit 2005; Young 2013) or at 30 days after randomization (Arnold 1994; Bollen 2005; Derdak 2002; Shah 2004). In two trials, 3/61 participants alive at discharge from the ICU (Bollen 2005) and 1/125 participants alive at the time of transfer to another facility (Mentzelopoulos 2012) were assumed to have survived; censoring these participants did not alter the results of the meta‐analysis (RR 0.92, 95% CI 0.73 to 1.16; P = 0.48; Analysis 1.2). Including three HFO and two conventional ventilation participants in one study (Shah 2004) who were withdrawn because they died less than 48 hours after randomization, but for whom no other baseline or outcome data were available after author contact, did not alter our findings ( RR 0.92, 95% CI 0.73 to 1.16, I2 = 66%, Analysis 1.3).
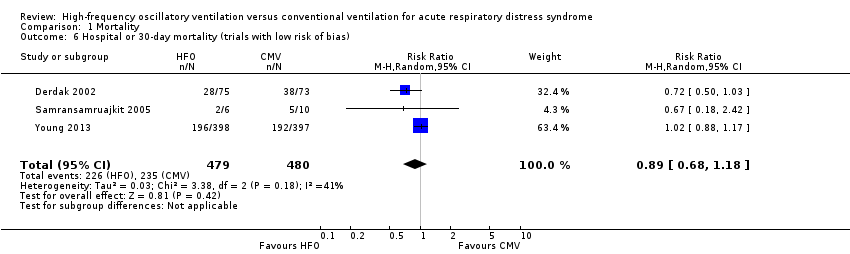
Subgroup analyses did not show significant differences in treatment effect among six adult (Bollen 2005; Derdak 2002; Ferguson 2013; Mentzelopoulos 2012; Shah 2004; Young 2013) versus two paediatric (Arnold 1994; Samransamruajkit 2005) trials (P = 0.63 for interaction z‐test; Analysis 1.4). In a post hoc subgroup analysis, there was no significant difference in treatment effect among four trials (Ferguson 2013; Mentzelopoulos 2012; Samransamruajkit 2005; Shah 2004) that mandated tidal volumes ≤ 8 mL/kg in the control group and four trials (Arnold 1994; Bollen 2005; Derdak 2002; Young 2013) that permitted higher tidal volumes (z‐test for interaction P = 0.74; Analysis 1.5). Excluding one trial (Ferguson 2013) terminated early for harm did not alter our findings (RR 0.83, 95% CI 0.65 to 1.06; P = 0.08, I² = 48%). Similarly excluding five trials at unclear risk of bias (Arnold 1994; Bollen 2005; Ferguson 2013; Mentzelopoulos 2012; Shah 2004) did not alter our findings (RR 0.89, 95% CI 0.68 to 1.18; P = 0.42, I² = 41%, Analysis 1.6).
We found evidence of moderate statistical heterogeneity (I² = 66%) for our primary endpoint of hospital or 30‐day mortality, but statistical heterogeneity was low for secondary and adverse outcomes (I² = 0% ‐ 14%).
Secondary outcomes
2. Six‐month mortality
Only one trial (Derdak 2002) (n = 148) reported six‐month mortality, with no significant effect of HFO (RR 0.79, 95% CI 0.58 to 1.08; P = 0.14).
3. Duration of mechanical ventilation
The duration of mechanical ventilation (MD 0.59 days, 95% CI ‐1.09 to 2.28; P = 0.49; 5 trials, 1142 participants; Analysis 2.1) (Arnold 1994; Derdak 2002; Mentzelopoulos 2012; Samransamruajkit 2005; Young 2013) did not significantly differ between groups.
4. Ventilator‐free days to day 28 or 30
We do not report a pooled result for ventilator‐free days because heterogeneity was extremely high ((I² = 95%) across two studies (Mentzelopoulos 2012; Young 2013) that reported this outcome.
5. Health‐related quality of life at one year
No trial reported health‐related quality of life. We identified one trial which collected health‐related quality of life at six months and one year; data are not yet available (Young 2013).
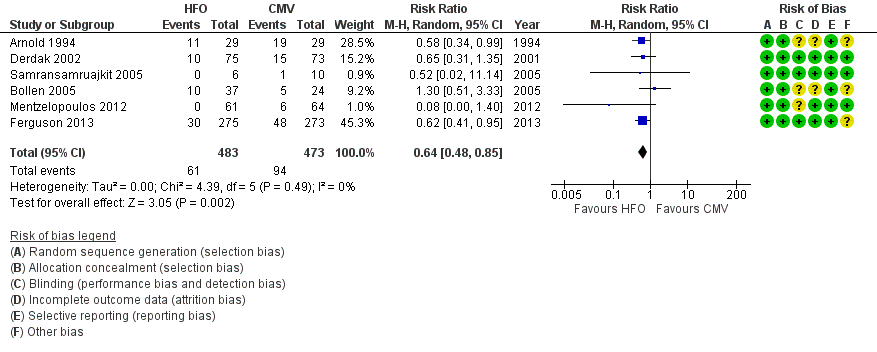
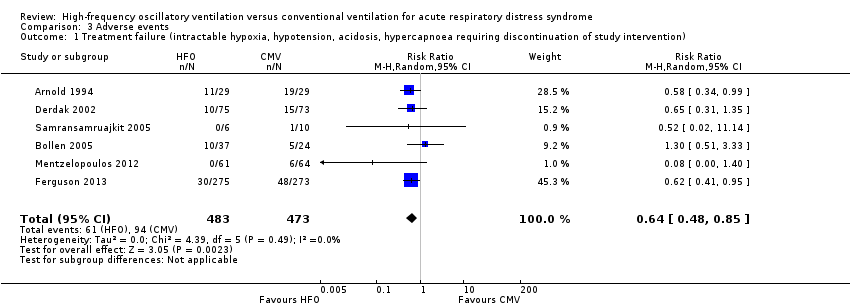
6. Treatment failure
In six trials (Arnold 1994; Bollen 2005; Derdak 2002; Ferguson 2013; Mentzelopoulos 2012; Samransamruajkit 2005) (n = 956) HFO reduced the risk of treatment failure compared with conventional mechanical ventilation (RR 0.64, 95% CI 0.48 to 0.85; P = 0.002; Figure 5). Three trials (Arnold 1994; Bollen 2005; Derdak 2002) (n = 267) reported treatment failure according to predefined criteria. Three trials (Ferguson 2013; Mentzelopoulos 2012; Samransamruajkit 2005) (n = 699) did not report this outcome but we obtained data directly from the authors (Mentzelopoulos 2012; Samransamruajkit 2005) or from outcomes in the published report (Ferguson 2013). In one trial, one participant randomized to conventional ventilation with early treatment failure who crossed over to HFO because of barotrauma was analysed as a treatment failure in the conventional mechanical ventilation group (Samransamruajkit 2005). When we did not count the two participants randomized to conventional ventilation in one trial (Mentzelopoulos 2012) who crossed over to HFO for only three and six hours as treatment failures, the pooled result remained significant (RR 0.64, 95% CI 0.48 to 0.86; P = 0.003). No trial reported blinding of outcome assessors or independent adjudication of treatment failure.

Forest plot of comparison: 2 Adverse events, outcome: 2.1 Treatment failure (intractable hypoxia, hypotension, acidosis, hypercapnoea requiring discontinuation of study intervention). (HFO = high frequency oscillation, CMV = conventional mechanical ventilation)
Physiologic outcomes
Physiological outcomes for day one, day two, and day three are summarized in Analysis 4.1; Analysis 4.2; Analysis 4.3; Analysis 4.4; and Appendix 2.
Day one measurements were obtained at 24 hours except in two studies where they were obtained at 12 hours (Demory 2007; Papazian 2005). Analyses were by intention‐to‐treat except for one participant in one trial (Samransamruajkit 2005) who crossed over from conventional ventilation to HFO shortly after randomizations and was analysed as treated because we were unable to obtain sufficient data (after contacting the author) to permit an intention‐to‐treat analysis.
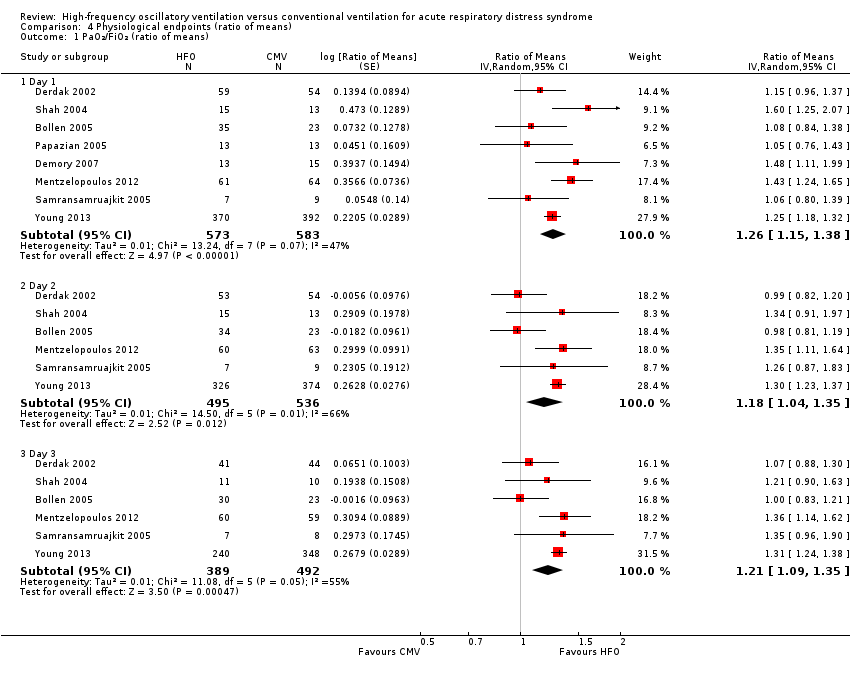
7. PaO₂/FiO₂ ratio at 24, 48, and 72 hours after randomization
At 24, 48, and 72 hours, HFO increased the PaO₂/FiO₂ ratio by 18% to 26% relative to conventional mechanical ventilation (see Analysis 4.1 and Appendix 2).
One trial included in our review combined tracheal gas insufflation and recruitment manoeuvres with HFO (Mentzelopoulos 2012). Because a separate randomized cross‐over trial (not included in this review due to cross‐over design) (Mentzelopoulos 2007a) showed that these co‐interventions may improve oxygenation, we performed a sensitivity analysis in which data from Mentzelopoulos 2012 were not included in the analysis of the effect of HFO on the PaO₂/FiO₂ ratio. Results were similar: ratio of means (RoM) of 1.23 (95% CI 1.11 to 1.35; P = 0.0001, I² = 39%) on day one, 1.15 (95% CI 0.98 to 1.35; P = 0.10, I² = 71%) on day two, and 1.18 (95% CI 1.03 to1.35; P = 0.02, I² = 62%) on day three.
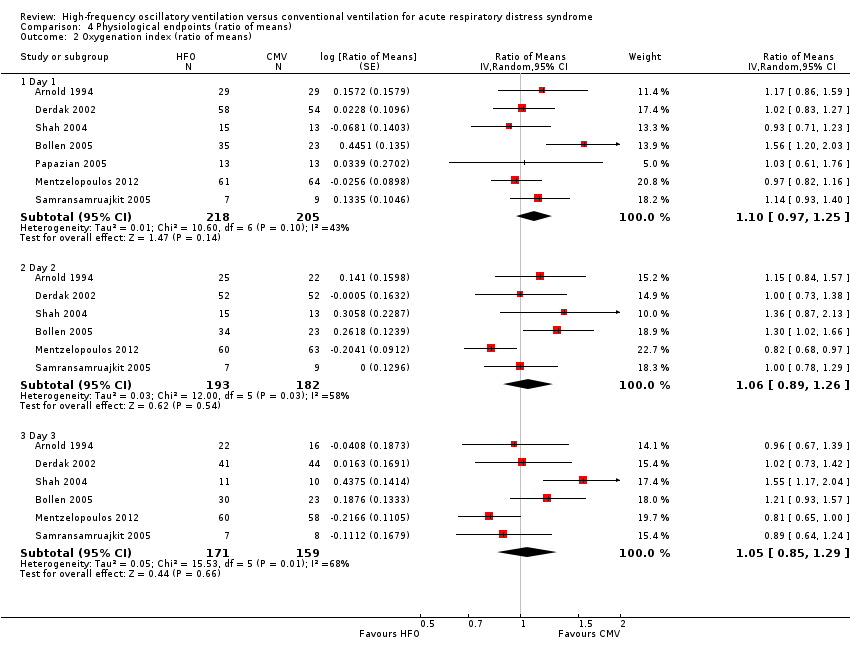
8. Oxygenation index at 24, 48, and 72 hours after randomization
Effects on the oxygenation index did not significantly differ between HFO and conventional ventilation (see Analysis 4.2 and Appendix 2).
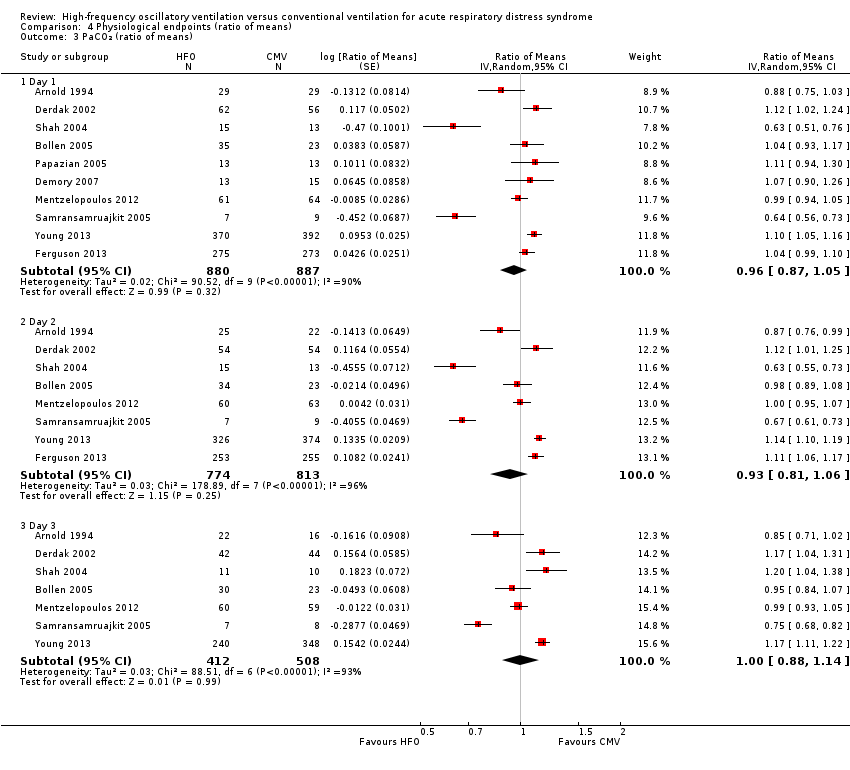
9. PaCO₂ at 24, 48, and 72 hours after randomization
We do not report a pooled result because heterogeneity was extremely high (I² > 90%) in all analyses (Analysis 4.3 and Appendix 2).
10. Mean airway pressure 24, 48, and 72 hours after randomization
At 24, 48, and 72 hours, HFO increased mean airway pressure by 16% to 30% relative to conventional mechanical ventilation (see Analysis 4.4).
Adverse events
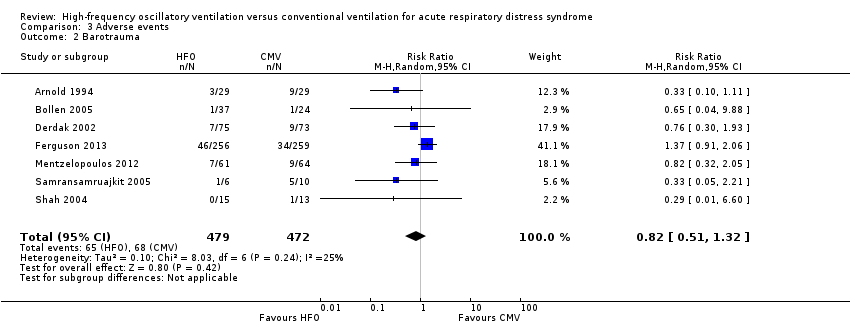
11. Barotrauma
We found no significant differences in the risk of barotrauma (7 trials, 951 participants; Analysis 3.2) (Arnold 1994; Bollen 2005; Derdak 2002; Ferguson 2013; Mentzelopoulos 2012; Samransamruajkit 2005; Shah 2004). Included studies varied in definitions of barotrauma: one study reported only pneumothorax (Shah 2004), three studies reported any pulmonary air leak (Derdak 2002; Mentzelopoulos 2012; Samransamruajkit 2005), one study reported any pulmonary air leak that developed during the protocol (Ferguson 2013), and two studies reported severe air leak resulting in treatment failure (Arnold 1994; Bollen 2005).
12. Hypotension
We found no significant differences in the risk of hypotension (4 trials, 392 participants; Analysis 3.3) (Arnold 1994; Bollen 2005; Derdak 2002; Mentzelopoulos 2012). Three studies reported intractable hypotension (Arnold 1994; Bollen 2005; Derdak 2002). One trial (Shah 2004) reported transient hypotension in one participant at the time of HFO initiation (1/15 in high‐frequency oscillation group and 0/13 in conventional ventilation group). Including these data minimally changed the pooled result (RR 1.01, 95% CI 0.61 to 1.66; P = 0.98, I² = 8%; Analysis 3.4).
13. Endotracheal tube obstruction due to secretions
We found no significant differences in the risk of endotracheal tube obstruction (4 trials, 246 participants) (Derdak 2002; Mentzelopoulos 2012; Samransamruajkit 2005; Shah 2004). Although four trials reported on endotracheal tube obstruction, all events occurred in a single study (Derdak 2002), precluding a pooled analysis.
14. Technical complications and equipment failure in participants treated with HFO
There were no serious technical problems during HFO in the four trials that provided these data (Shah 2004; Samransamruajkit 2005; Derdak 2002; Mentzelopoulos 2012). One trial (n = 125) reported minor technical problems, including water accumulation in the circuit (number of instances not reported) and unintentional air leaks (21 instances in 223 uninterrupted sessions lasting six to 48 hours) and tearing of the ventilator diaphragm (seven instances in 223 uninterrupted sessions lasting six to 48 hours) (Mentzelopoulos 2012). A second trial (n = 148) reported four HFO device failures resulting from overheating, which was solved by switching to another Sensormedics 3100B HFO ventilator (Derdak 2002); the number of conventional ventilators which failed was not recorded.
Discussion
Summary of main results
The main finding of our systematic review and meta‐analysis is that HFO did not reduce hospital and 30‐day mortality in participants with ARDS compared to conventional mechanical ventilation. This finding was based on a small number of trials (eight for the primary analysis), participants (1779) and events (807), resulting in wide confidence intervals. The quality of evidence for the effect of HFO on mortality was very low, due to imprecision, inconsistency, indirectness and methodologic limitations (see summary of findings Table for the main comparison). The risk of adverse events was similar.
Overall completeness and applicability of evidence
Our primary analysis was based on a small number of trials, some of which included relatively small numbers of participants and few outcome events, and have wide confidence intervals. Furthermore, although we found moderate heterogeneity for our primary outcome (hospital or 30‐day mortality), this may be an underestimate, given the small number of trials. A priori subgroup analyses did not adequately explain heterogeneity, although heterogeneity appeared to be slightly lower (I² = 41%) in three trials with low risk of bias (Derdak 2002; Samransamruajkit 2005; Young 2013). Nevertheless, HFO did not reduce mortality when only studies with low risk of bias were pooled (Analysis 1.6).
Although our meta‐analysis suggests HFO might reduce treatment failure, the criteria for treatment failure varied across trials (Arnold 1994; Bollen 2005; Derdak 2002) or were not predefined (Ferguson 2013; Mentzelopoulos 2012; Samransamruajkit 2005), and outcome assessors were not blinded. Therefore caution should be used when interpreting this finding, especially in view of the overall neutral effect of HFO on mortality in our systematic review, and the results of the second largest HFO trial to date (Ferguson 2013) which found that HFO increased mortality.
Limited data precluded subgroup analyses based on the degree of hypoxaemia and analyses of longer‐term mortality and health‐related quality of life. We found moderate to high heterogeneity for physiological endpoints, which limited their interpretability. Because of limited data, we were unable to analyse duration of mechanical ventilation separately for survivors and non‐survivors to address the possibility that differences in early mortality could drive overall differences in duration of mechanical ventilation. The risk of bias was low in five studies (Demory 2007; Derdak 2002; Papazian 2005; Samransamruajkit 2005; Young 2013) but remained unclear in five studies (Arnold 1994; Bollen 2005; Ferguson 2013; Mentzelopoulos 2012; Shah 2004). Thus, our findings do not support HFO for the treatment for ARDS. The overall quality of the evidence is very low for the most important outcomes to patients, such as mortality (see summary of findings Table for the main comparison), indicating considerable uncertainty, and that future trials may impact our findings (Schünemann 2008).
Quality of the evidence
See summary of findings Table for the main comparison.
The evidence for our main outcome of hospital of 30‐day mortality is drawn from three trials (Derdak 2002; Samransamruajkit 2005; Young 2013 ) with a low risk of bias and five trials (Arnold 1994; Bollen 2005; Ferguson 2013; Mentzelopoulos 2012; Shah 2004) with unclear risk of bias. Subgroup and sensitivity analyses did not provide a convincing explanation for observed variation between the results of the studies(seeAnalysis 1.4; Analysis 1.6; Analysis 1.5). We judged the quality of evidence for our main outcome of hospital or 30‐day mortality to be very low. We downgraded our assessment for the quality of evidence for serious indirectness in the comparator (four trials: Arnold 1994; Bollen 2005; Derdak 2002; Young 2013, n = 1062, did not mandate low tidal volume conventional ventilation in participants who received conventional mechanical ventilation); inconsistency (we detected moderate statistical heterogeneity, I² = 66%, for our primary outcome of hospital or 30‐day mortality); imprecision due to wide confidence intervals around our estimate of treatment effect; serious methodologic limitations (blinding was not possible in all studies; cross‐overs between treatment groups > 10% occurred in three trials (Arnold 1994; Bollen 2005; Derdak 2002); post‐randomization withdrawals ranging from 1.4% to 17% occurred in three trials (Arnold 1994; Derdak 2002; Shah 2004)).
Potential biases in the review process
Strengths of our review include methods to minimize bias, including a comprehensive literature search, duplicate data abstraction, and use of a predefined protocol outlining our hypotheses, methodological assessment of primary studies, and statistical analysis plan. We considered important clinical, physiological, and safety endpoints. Although blinding of participants, their families, and clinicians was not feasible, five of 10 trials had low risk of bias.
Our meta‐analysis may have overestimated the treatment effect of HFO because the control group of four studies (Arnold 1994; Bollen 2005; Derdak 2002; Young 2013), including the largest trial (Young 2013) which dominated the pooled analyses, was exposed to higher tidal volumes (> 6 to 8 mL/kg predicted body weight) than currently recommended (ARDS Network 2000). However, a sensitivity analysis showed no difference in trials that implemented lower tidal volume lung‐protective ventilation in the control group. Alternatively, the higher rate of cross‐overs due to treatment failure in participants randomized to conventional ventilation may have reduced the measured effect of HFO. In three studies (Arnold 1994; Bollen 2005; Ferguson 2013) more than 10% of participants crossed over from their assigned mode of ventilation.
Metholodical diversity in the primary studies may account for the inconsistency in some of the reported findings. In the second largest study (Ferguson 2013, n = 548), investigators reported an increase in mortality associated with early application of HFO in participants with ARDS. This trial, however, may have been susceptible to truncation bias due to early termination for harm. Furthermore, the control arm used a protocol incorporating recruitment manoeuvres and high positive end expiratory pressure, which may have conferred additional benefit over conventional ventilation with low tidal volumes in participants with ARDS (Briel 2010; Meade 2008). Conversely, Mentzelopoulos 2012 reported a statistically significant reduction in mortality associated with HFO; however this study differed from others because HFO was used intermittently and for a variable period of time each day based on a predefined protocol, and was combined with tracheal gas insufflation. Furthermore, participants who received protocolized HFO were cared for by selected experts (Mentzelopoulos 2012; personal correspondence), which was not the case for participants undergoing conventional ventilation, which may have led to performance bias. Finally, the largest trial (Young 2013, n = 795) utilized a different HFO ventilator (Novalung R100) which differed from the other studies which used HFO ventilators designed by Sensormedics.
Agreements and disagreements with other studies or reviews
Our findings differ from our previous systematic review (Sud 2013), which found reduced mortality and treatment failure in participants with ARDS receiving HFO. However, we have included two additional trials (Ferguson 2013; Young 2013) of HFO compared to conventional ventilation and unpublished data provided by primary investigators, which generated more reliable estimates of treatment effects through increases in sample size and outcome events.
The improvements in PaO₂/FiO₂ that we observed are consistent with observational studies (Ferguson 2005; Fort 1997; Mehta 2001). Although HFO increased PaO₂/FiO₂ compared to conventional ventilation, there was no difference in oxygenation index (defined as 100 x mean airway pressure/(PaO₂/FiO₂ ratio)) because of the higher mean airway pressure applied during HFO. Although high airway pressure during conventional ventilation is harmful to the lungs (Ranieri 1999), the importance of the higher mean airway pressure during HFO is unclear because of its incompletely characterized relationship to alveolar pressure, which is a more important determinant of lung injury than mean airway pressure in ARDS. Direct comparisons of mean airway pressure and oxygenation index between HFO and conventional ventilation may not be valid because, in contrast to conventional ventilation, mean airway pressures measured in the trachea during HFO are 6 to 8 cm H₂O lower than values displayed on the ventilator (Muellenbach 2007). From a clinical perspective, improved oxygenation may not always be associated with improved clinical outcomes in ARDS (Bernard 2008; Slutsky 2009), because death due to refractory hypoxaemia is relatively uncommon, compared with death due to multiple organ failure.
Our findings seem inconsistent with experimental studies in animals showing that HFO reduces histologic alveolar over‐distension compared to conventional mechanical ventilation (Sedeek 2003), possibly because of the delivery of smaller tidal volumes (Hager 2007), and by corollary, other clinical trials which have shown that smaller tidal volumes improve mortality in participants with ARDS (ARDS Network 2000). Although we found no increase in barotrauma or hypotension resulting from higher mean airway pressures employed during HFO in pooled analyses, in one trial (Ferguson 2013) HFO was associated with increased need for vasoactive medications, and increased use of sedatives and analgesics which may have offset the theoretical benefit of HFO.

Study flow diagram for the updated literature search (from 2011 to Dec 2015, see also Results of the search)
Methodological quality summary: review authors' judgements about each methodological quality item for each included study.

Methodological quality graph: review authors' judgements about each methodological quality item presented as percentages across all included studies.
Forest plot of comparison: 1 Mortality, outcome: 1.1 Hospital or 30‐day mortality. (HFO = high frequency oscillation, CMV = conventional mechanical ventilation)
Forest plot of comparison: 2 Adverse events, outcome: 2.1 Treatment failure (intractable hypoxia, hypotension, acidosis, hypercapnoea requiring discontinuation of study intervention). (HFO = high frequency oscillation, CMV = conventional mechanical ventilation)
Comparison 1 Mortality, Outcome 1 Hospital or 30‐day mortality.

Comparison 1 Mortality, Outcome 2 Hospital or 30‐day mortality (Bollen 2005 and Mentzelopoulos 2012 participants lost to follow‐up censored).
Comparison 1 Mortality, Outcome 3 Hospital or 30‐day mortality (Shah 2004 post‐randomization withdrawals included).

Comparison 1 Mortality, Outcome 4 Hospital or 30‐day mortality: adult versus paediatric trials.

Comparison 1 Mortality, Outcome 5 Hospital or 30‐day mortality: lung‐protective ventilation mandatory vs non‐mandatory.
Comparison 1 Mortality, Outcome 6 Hospital or 30‐day mortality (trials with low risk of bias).

Comparison 2 Ventilator dependency, Outcome 1 Duration of mechanical ventilation.

Comparison 2 Ventilator dependency, Outcome 2 Ventilator‐free days.
Comparison 3 Adverse events, Outcome 1 Treatment failure (intractable hypoxia, hypotension, acidosis, hypercapnoea requiring discontinuation of study intervention).
Comparison 3 Adverse events, Outcome 2 Barotrauma.

Comparison 3 Adverse events, Outcome 3 Hypotension.
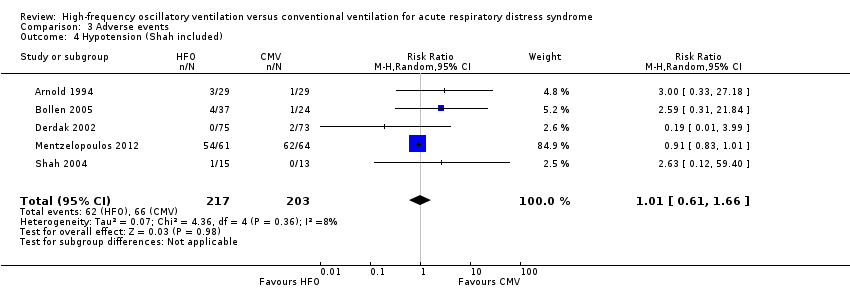
Comparison 3 Adverse events, Outcome 4 Hypotension (Shah included).

Comparison 3 Adverse events, Outcome 5 ETT obstruction.
Comparison 4 Physiological endpoints (ratio of means), Outcome 1 PaO₂/FiO₂ (ratio of means).
Comparison 4 Physiological endpoints (ratio of means), Outcome 2 Oxygenation index (ratio of means).
Comparison 4 Physiological endpoints (ratio of means), Outcome 3 PaCO₂ (ratio of means).

Comparison 4 Physiological endpoints (ratio of means), Outcome 4 Mean airway pressure (ratio of means).
| Patient or population: people with Acute Respiratory Distress Syndrome | ||||||
| Outcomes** | Illustrative comparative risks* (95% CI) | Relative effect | No of Participants | Quality of the evidence | Comments | |
| Assumed risk | Corresponding risk | |||||
| Conventional Mechanical Ventilation | High Frequency Oscillation | |||||
| Mortality (at 30 days or until hospital discharge) | Medium risk population1 | RR 0.92 | 1779 | ⊕⊝⊝⊝ | ||
| 470 per 1000 | 432 per 1000 | |||||
| Mortality (at 6 months) | Medium risk population | RR 0.79 | 148 | ⊕⊝⊝⊝ | ||
| 590 per 1000 | 466 per 1000 | |||||
| Treatment failure | Medium risk population1 | RR 0.64 | 956 | ⊕⊝⊝⊝ | ||
| 190 per 1000 | 122 per 1000 | |||||
| Duration of mechanical ventilation | The mean duration of mechanical ventilation in the control groups was | The mean duration of mechanical ventilation in the intervention groups was | 1142 | ⊕⊝⊝⊝ | ||
| Barotrauma | Medium risk population1 | RR 0.82 | 951 | ⊕⊝⊝⊝ | ||
| 131 per 1000 | 121 per 1000 | |||||
| Hypotension | Medium risk population1 | RR 1.02 | 392 | ⊕⊝⊝⊝ | ||
| 381 per 1000 | 389 per 1000 | |||||
| *The basis for the assumed risk (e.g. the median control group risk across studies) is provided in footnotes. The corresponding risk (and its 95% confidence interval) is based on the assumed risk in the comparison group and the relative effect of the intervention (and its 95% CI). ** Not shown:ventilator‐free days (very low quality 2,3,4,5, pooled analysis not performed due to extreme heterogeneity), endotracheal tube obstruction (very low quality2,4,5, pooled analysis not performed because all events occurred in one study), non‐clinical endpoints (i.e. physiologic endpoints, for example mean airway pressure, because these are not patient‐important outcomes). | ||||||
| GRADE Working Group grades of evidence | ||||||
| 1The basis of the assumed risk is the median risk in the control groups across trials. | ||||||
| Outcome or subgroup title | No. of studies | No. of participants | Statistical method | Effect size |
| 1 Hospital or 30‐day mortality Show forest plot | 8 | 1779 | Risk Ratio (M‐H, Random, 95% CI) | 0.92 [0.72, 1.16] |
| 2 Hospital or 30‐day mortality (Bollen 2005 and Mentzelopoulos 2012 participants lost to follow‐up censored) Show forest plot | 8 | 1775 | Risk Ratio (M‐H, Random, 95% CI) | 0.92 [0.73, 1.16] |
| 3 Hospital or 30‐day mortality (Shah 2004 post‐randomization withdrawals included) Show forest plot | 8 | 1784 | Risk Ratio (M‐H, Random, 95% CI) | 0.92 [0.73, 1.16] |
| 4 Hospital or 30‐day mortality: adult versus paediatric trials Show forest plot | 8 | 1779 | Risk Ratio (M‐H, Random, 95% CI) | 0.92 [0.72, 1.16] |
| 4.1 Adult trials | 6 | 1705 | Risk Ratio (M‐H, Random, 95% CI) | 0.93 [0.71, 1.21] |
| 4.2 Paediatric trials | 2 | 74 | Risk Ratio (M‐H, Random, 95% CI) | 0.80 [0.44, 1.43] |
| 5 Hospital or 30‐day mortality: lung‐protective ventilation mandatory vs non‐mandatory Show forest plot | 8 | 1779 | Risk Ratio (M‐H, Random, 95% CI) | 0.92 [0.72, 1.16] |
| 5.1 Lung‐protective ventilation not mandatory | 4 | 1062 | Risk Ratio (M‐H, Random, 95% CI) | 0.94 [0.77, 1.15] |
| 5.2 Lung‐protective ventilation mandatory | 4 | 717 | Risk Ratio (M‐H, Random, 95% CI) | 0.85 [0.47, 1.53] |
| 6 Hospital or 30‐day mortality (trials with low risk of bias) Show forest plot | 3 | 959 | Risk Ratio (M‐H, Random, 95% CI) | 0.89 [0.68, 1.18] |
| Outcome or subgroup title | No. of studies | No. of participants | Statistical method | Effect size |
| 1 Duration of mechanical ventilation Show forest plot | 5 | 1142 | Mean Difference (IV, Random, 95% CI) | 0.59 [‐1.09, 2.28] |
| 2 Ventilator‐free days Show forest plot | 2 | Mean Difference (IV, Random, 95% CI) | Totals not selected | |
| Outcome or subgroup title | No. of studies | No. of participants | Statistical method | Effect size |
| 1 Treatment failure (intractable hypoxia, hypotension, acidosis, hypercapnoea requiring discontinuation of study intervention) Show forest plot | 6 | 956 | Risk Ratio (M‐H, Random, 95% CI) | 0.64 [0.48, 0.85] |
| 2 Barotrauma Show forest plot | 7 | 951 | Risk Ratio (M‐H, Random, 95% CI) | 0.82 [0.51, 1.32] |
| 3 Hypotension Show forest plot | 4 | 392 | Risk Ratio (M‐H, Random, 95% CI) | 1.02 [0.54, 1.90] |
| 4 Hypotension (Shah included) Show forest plot | 5 | 420 | Risk Ratio (M‐H, Random, 95% CI) | 1.01 [0.61, 1.66] |
| 5 ETT obstruction Show forest plot | 4 | Risk Ratio (M‐H, Random, 95% CI) | Totals not selected | |
| Outcome or subgroup title | No. of studies | No. of participants | Statistical method | Effect size |
| 1 PaO₂/FiO₂ (ratio of means) Show forest plot | 8 | Ratio of Means (Random, 95% CI) | Subtotals only | |
| 1.1 Day 1 | 8 | 1156 | Ratio of Means (Random, 95% CI) | 1.26 [1.15, 1.38] |
| 1.2 Day 2 | 6 | 1031 | Ratio of Means (Random, 95% CI) | 1.18 [1.04, 1.35] |
| 1.3 Day 3 | 6 | 881 | Ratio of Means (Random, 95% CI) | 1.21 [1.09, 1.35] |
| 2 Oxygenation index (ratio of means) Show forest plot | 7 | Ratio of Means (Random, 95% CI) | Subtotals only | |
| 2.1 Day 1 | 7 | 423 | Ratio of Means (Random, 95% CI) | 1.10 [0.97, 1.25] |
| 2.2 Day 2 | 6 | 375 | Ratio of Means (Random, 95% CI) | 1.06 [0.89, 1.26] |
| 2.3 Day 3 | 6 | 330 | Ratio of Means (Random, 95% CI) | 1.05 [0.85, 1.29] |
| 3 PaCO₂ (ratio of means) Show forest plot | 10 | Ratio of Means (Random, 95% CI) | Subtotals only | |
| 3.1 Day 1 | 10 | 1767 | Ratio of Means (Random, 95% CI) | 0.96 [0.87, 1.05] |
| 3.2 Day 2 | 8 | 1587 | Ratio of Means (Random, 95% CI) | 0.93 [0.81, 1.06] |
| 3.3 Day 3 | 7 | 920 | Ratio of Means (Random, 95% CI) | 1.00 [0.88, 1.14] |
| 4 Mean airway pressure (ratio of means) Show forest plot | 9 | Ratio of Means (Random, 95% CI) | Subtotals only | |
| 4.1 Day 1 | 9 | 985 | Ratio of Means (Random, 95% CI) | 1.30 [1.26, 1.35] |
| 4.2 Day 2 | 7 | 888 | Ratio of Means (Random, 95% CI) | 1.25 [1.19, 1.31] |
| 4.3 Day 3 | 6 | 338 | Ratio of Means (Random, 95% CI) | 1.16 [1.06, 1.27] |