High‐frequency ventilation versus conventional ventilation for treatment of acute lung injury and acute respiratory distress syndrome
Appendices
Appendix 1. Search strategies
MEDLINE (OvidSP, 1948 to March 2011)
1. Exp High‐Frequency Ventilation/
2. (high adj3 oscillat$).mp.
3. 1 or 2
4. clinical trial.mp. or clinical trial.pt. or random:.mp. or tu.xs.
5. 3 and 4 [NOTE this is the same as the following command: limit 3 to “therapy (sensitivity)”]
6. (animals not humans).sh.
7. 5 not 6
8. Infants, newborn.sh.
9. 7 not 8
EMBASE (1980 to March 2011)
1. Exp High Frequency Ventilation/
2. (high adj3 oscillat$).mp.
3. 1 or 2
4. random:.tw. or clinical trial:.mp. or exp health care quality/
5. 3 and 4 [NOTE this is the same as the following command: limit 3 to "treatment (2 or more terms high sensitivity)"]
6. (animal$ not human$).sh,hw.
7. 5 not 6
8. newborn/
9. 7 not 8
CENTRAL (Issue 1, 2011)
1. (high adj3 oscillat$).af.
ISI (1 March 2011)
1. High Frequency Oscillat* OR High Frequency Ventilat* (topic)
2. Random* or Random Alloc* OR Controlled Clinical Trial (topic)
Notes: ‘$’, ‘:’, and ‘*’ retrieve unlimited suffix variations; the .mp. extension includes the title, original title and abstract fields in MEDLINE and EMBASE; the .af. extension includes all searchable fields. Filters for MEDLINE (line 4) and EMBASE (line 4) are based on published sensitive strategies for retrieving randomized trials (Haynes 2005; Wong 2006). References from these four databases were combined and duplicates were removed manually.
Appendix 2. Physiologic outcomes on Day 1 to 3 after randomization
| Outcome
| No of trials
| No of patients
| Treatment Effect | Heterogeneity | ||
| Ratio of means* | (95% CI) | P value | I2 (%)
| |||
| Day 1 (24 hours) | ||||||
| PaO2/FiO2 | 7 | 323 | 1.24 | (1.11 to 1.40) | <0.001 | 45
|
| Mean airway pressure | 7 | 331 | 1.33 | (1.27 to 1.40) | <0.001 | 21
|
| Oxygenation index | 6 | 294 | 1.11 | (0.97 to 1.26) | 0.12 | 38
|
| PaCO2 | 6 | 300 | 0.91 | (0.78 to 1.07) | 0.25 | 91
|
| Day 2 (48 hours) | ||||||
| PaO2/FiO2 | 5 | 262 | 1.16 | (0.97 to 1.37) | 0.10 | 62
|
| Mean airway pressure | 5 | 262 | 1.26 | (1.16 to 1.37) | <0.001 | 58
|
| Oxygenation index | 5 | 259 | 1.07 | (0.92 to 1.24) | 0.38 | 39
|
| PaCO2
| 5 | 263 | 0.87 | (0.72 to 1.06) | 0.16 | 95 |
| Day 3 (72 hours) | ||||||
| PaO2/FiO2 | 5 | 228 | 1.17 | (1.02 to 1.35) | 0.02 | 44
|
| Mean airway pressure | 5 | 236 | 1.22 | (1.07 to 1.39) | 0.003 | 78
|
| Oxygenation index | 5 | 228 | 1.07 | (0.88 to 1.29) | 0.51 | 58
|
| PaCO2 | 6 | 267 | 0.98 | (0.84 to 1.14) | 0.78 | 90
|
| PaO2/FiO2 = ratio of arterial partial pressure of oxygen to fraction of inspired oxygen; PaCO2 = arterial partial pressure of carbon dioxide. *Mean value in high frequency oscillation group divided by mean value in conventional ventilation group. Random effects models used for all meta‐analyses. | ||||||
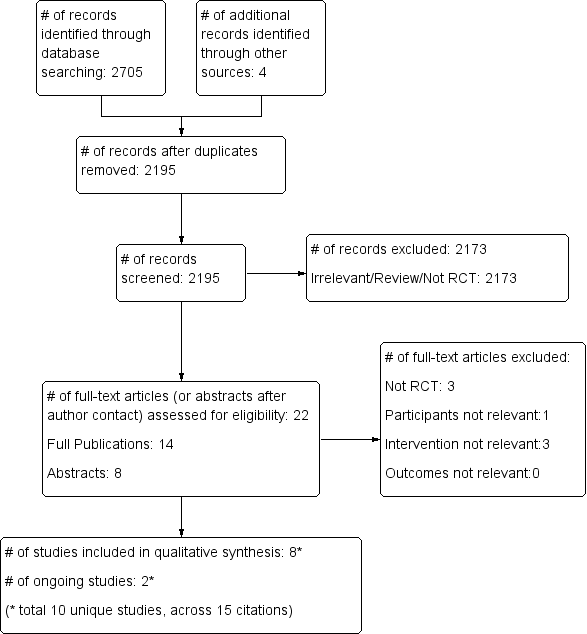
Study flow diagram.
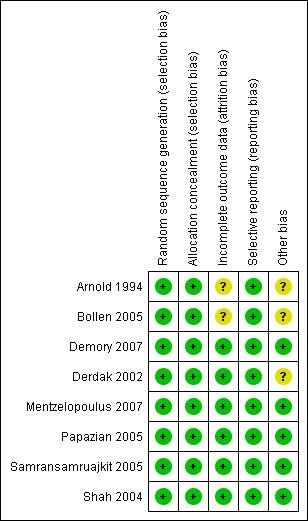
Methodological quality summary: review authors' judgements about each methodological quality item for each included study.
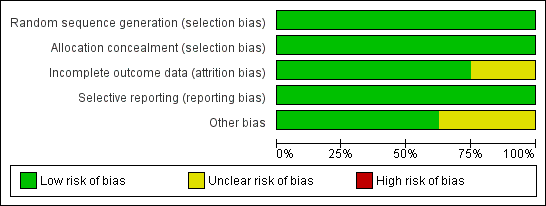
Methodological quality graph: review authors' judgements about each methodological quality item presented as percentages across all included studies.
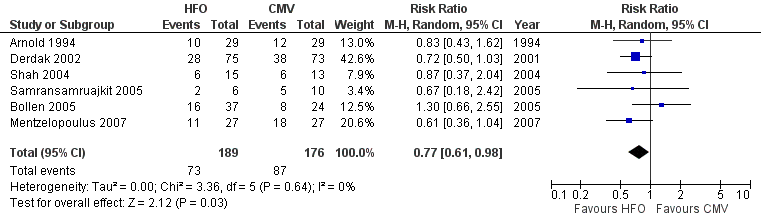
Forest plot of comparison: 1 Mortality, outcome: 1.1 Hospital or 30‐day mortality.

Forest plot of comparison: 2 Adverse events, outcome: 2.1 Treatment failure (intractable hypoxia, hypotension, acidosis, hypercapnoea requiring discontinuation of study intervention).

Comparison 1 Mortality, Outcome 1 Hospital or 30‐day Mortality.

Comparison 1 Mortality, Outcome 2 Hospital or 30‐day Mortality (Bollen 2005 patients lost to follow‐up excluded).

Comparison 1 Mortality, Outcome 3 Hospital or 30‐day mortality: Adult versus paediatric trials.

Comparison 1 Mortality, Outcome 4 Hospital or 30‐day Mortality: Low risk of bias versus unclear risk of bias.
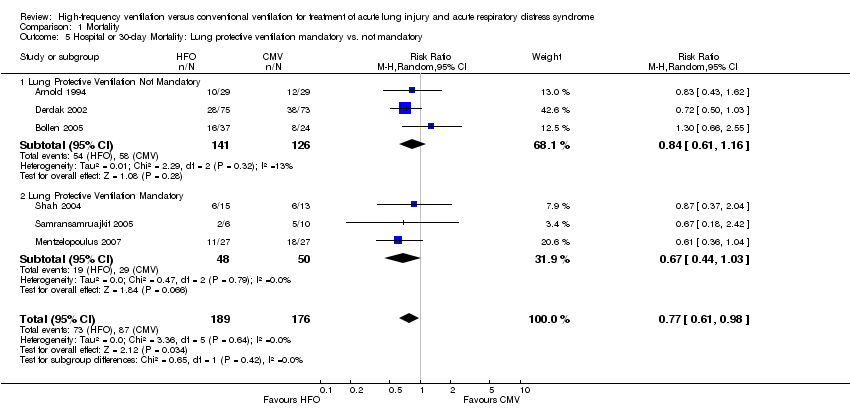
Comparison 1 Mortality, Outcome 5 Hospital or 30‐day Mortality: Lung protective ventilation mandatory vs. not mandatory.
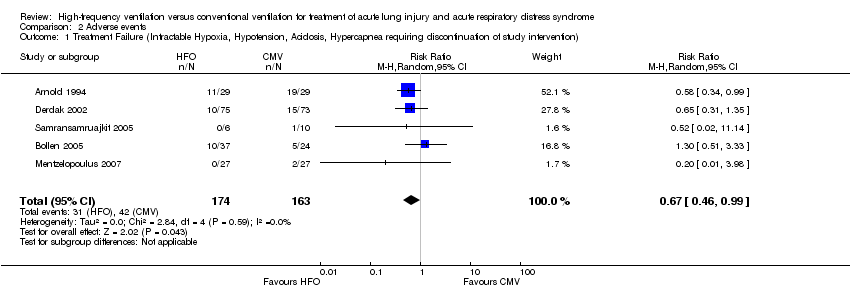
Comparison 2 Adverse events, Outcome 1 Treatment Failure (Intractable Hypoxia, Hypotension, Acidosis, Hypercapnea requiring discontinuation of study intervention).

Comparison 2 Adverse events, Outcome 2 Barotrauma.
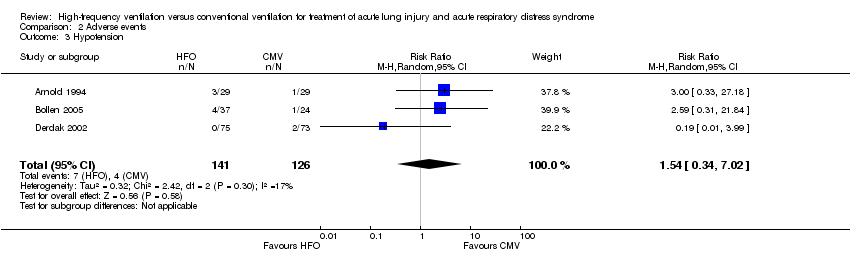
Comparison 2 Adverse events, Outcome 3 Hypotension.

Comparison 2 Adverse events, Outcome 4 Hypotension (Shah and Mentzelopoulos included).

Comparison 2 Adverse events, Outcome 5 ETT Obstruction.
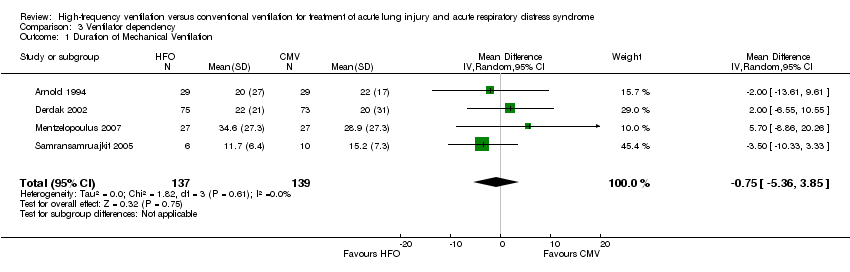
Comparison 3 Ventilator dependency, Outcome 1 Duration of Mechanical Ventilation.
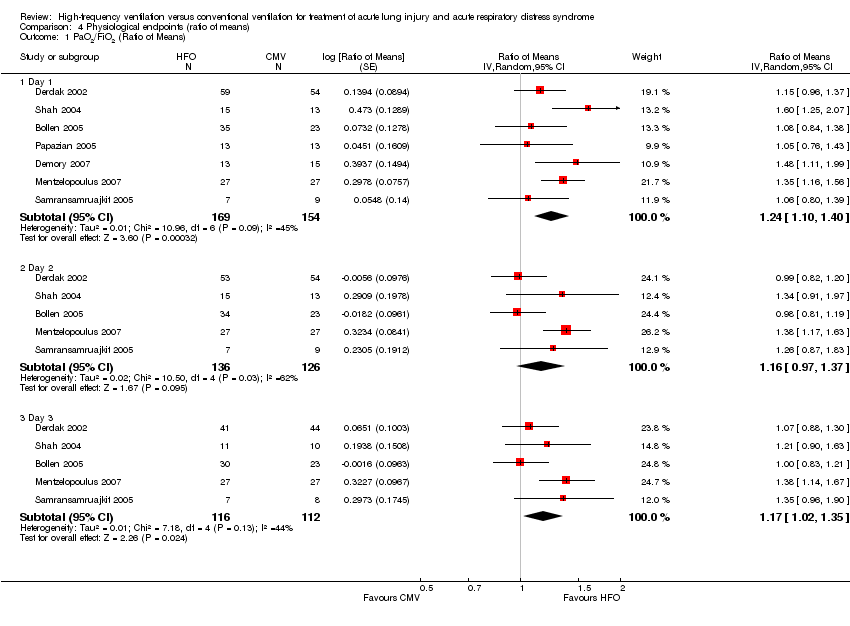
Comparison 4 Physiological endpoints (ratio of means), Outcome 1 PaO2/FiO2 (Ratio of Means).

Comparison 4 Physiological endpoints (ratio of means), Outcome 2 Oxygenation Index (Ratio of Means).

Comparison 4 Physiological endpoints (ratio of means), Outcome 3 PaCO2 (Ratio of Means).

Comparison 4 Physiological endpoints (ratio of means), Outcome 4 Mean Airway Pressure (Ratio of Means).
| HFO compared to conventional mechanical ventilation for ALI and ARDS | ||||||
| Patient or population: patients with ALI and ARDS | ||||||
| Outcomes | Illustrative comparative risks* (95% CI) | Relative effect | No of Participants | Quality of the evidence | Comments | |
| Assumed risk | Corresponding risk | |||||
| Conventional mechanical ventilation | High Frequency Oscillation | |||||
| Hospital (or 30 day) mortality | Typical risk1 | RR 0.77 | 365 | ⊕⊕⊕⊝ | ||
| 443 per 1000 | 341 per 1000 | |||||
| 6 month mortality | 589 per 10004 | 465 per 1000 | RR 0.79 | 148 | ⊕⊕⊝⊝ | |
| *The basis for the assumed risk (e.g. the median control group risk across studies) is provided in footnotes. The corresponding risk (and its 95% confidence interval) is based on the assumed risk in the comparison group and the relative effect of the intervention (and its 95% CI). | ||||||
| GRADE Working Group grades of evidence | ||||||
| 1 The basis of the assumed risk is a systematic review and meta‐analysis of the mortality in patients with ARDS (Phua 2009). | ||||||
| Outcome or subgroup title | No. of studies | No. of participants | Statistical method | Effect size |
| 1 Hospital or 30‐day Mortality Show forest plot | 6 | 365 | Risk Ratio (M‐H, Random, 95% CI) | 0.77 [0.61, 0.98] |
| 2 Hospital or 30‐day Mortality (Bollen 2005 patients lost to follow‐up excluded) Show forest plot | 6 | 362 | Risk Ratio (M‐H, Random, 95% CI) | 0.77 [0.61, 0.98] |
| 3 Hospital or 30‐day mortality: Adult versus paediatric trials Show forest plot | 6 | 365 | Risk Ratio (M‐H, Random, 95% CI) | 0.77 [0.61, 0.98] |
| 3.1 Adult Trials | 4 | 291 | Risk Ratio (M‐H, Random, 95% CI) | 0.77 [0.58, 1.02] |
| 3.2 Paediatric Trials | 2 | 74 | Risk Ratio (M‐H, Random, 95% CI) | 0.80 [0.44, 1.43] |
| 4 Hospital or 30‐day Mortality: Low risk of bias versus unclear risk of bias Show forest plot | 6 | 365 | Risk Ratio (M‐H, Random, 95% CI) | 0.77 [0.61, 0.98] |
| 4.1 Low Risk of Bias Trials (free of selection, reporting, and attrition bias) | 4 | 246 | Risk Ratio (M‐H, Random, 95% CI) | 0.70 [0.53, 0.92] |
| 4.2 Unclear Risk of Bias Trials (possible selection, reporting or attrition bias) | 2 | 119 | Risk Ratio (M‐H, Random, 95% CI) | 1.04 [0.65, 1.66] |
| 5 Hospital or 30‐day Mortality: Lung protective ventilation mandatory vs. not mandatory Show forest plot | 6 | 365 | Risk Ratio (M‐H, Random, 95% CI) | 0.77 [0.61, 0.98] |
| 5.1 Lung Protective Ventilation Not Mandatory | 3 | 267 | Risk Ratio (M‐H, Random, 95% CI) | 0.84 [0.61, 1.16] |
| 5.2 Lung Protective Ventilation Mandatory | 3 | 98 | Risk Ratio (M‐H, Random, 95% CI) | 0.67 [0.44, 1.03] |
| Outcome or subgroup title | No. of studies | No. of participants | Statistical method | Effect size |
| 1 Treatment Failure (Intractable Hypoxia, Hypotension, Acidosis, Hypercapnea requiring discontinuation of study intervention) Show forest plot | 5 | 337 | Risk Ratio (M‐H, Random, 95% CI) | 0.67 [0.46, 0.99] |
| 2 Barotrauma Show forest plot | 6 | 365 | Risk Ratio (M‐H, Random, 95% CI) | 0.68 [0.37, 1.22] |
| 3 Hypotension Show forest plot | 3 | 267 | Risk Ratio (M‐H, Random, 95% CI) | 1.54 [0.34, 7.02] |
| 4 Hypotension (Shah and Mentzelopoulos included) Show forest plot | 5 | 349 | Risk Ratio (M‐H, Random, 95% CI) | 1.46 [0.77, 2.76] |
| 5 ETT Obstruction Show forest plot | 4 | Risk Ratio (M‐H, Random, 95% CI) | Totals not selected | |
| Outcome or subgroup title | No. of studies | No. of participants | Statistical method | Effect size |
| 1 Duration of Mechanical Ventilation Show forest plot | 4 | 276 | Mean Difference (IV, Random, 95% CI) | ‐0.75 [‐5.36, 3.85] |
| Outcome or subgroup title | No. of studies | No. of participants | Statistical method | Effect size |
| 1 PaO2/FiO2 (Ratio of Means) Show forest plot | 7 | Ratio of Means (Random, 95% CI) | Subtotals only | |
| 1.1 Day 1 | 7 | 323 | Ratio of Means (Random, 95% CI) | 1.24 [1.10, 1.40] |
| 1.2 Day 2 | 5 | 262 | Ratio of Means (Random, 95% CI) | 1.16 [0.97, 1.37] |
| 1.3 Day 3 | 5 | 228 | Ratio of Means (Random, 95% CI) | 1.17 [1.02, 1.35] |
| 2 Oxygenation Index (Ratio of Means) Show forest plot | 7 | Ratio of Means (Random, 95% CI) | Subtotals only | |
| 2.1 Day 1 | 7 | 352 | Ratio of Means (Random, 95% CI) | 1.11 [0.97, 1.26] |
| 2.2 Day 2 | 6 | 306 | Ratio of Means (Random, 95% CI) | 1.07 [0.92, 1.24] |
| 2.3 Day 3 | 6 | 266 | Ratio of Means (Random, 95% CI) | 1.07 [0.88, 1.29] |
| 3 PaCO2 (Ratio of Means) Show forest plot | 8 | Ratio of Means (Random, 95% CI) | Subtotals only | |
| 3.1 Day 1 | 8 | 386 | Ratio of Means (Random, 95% CI) | 0.91 [0.78, 1.07] |
| 3.2 Day 2 | 6 | 310 | Ratio of Means (Random, 95% CI) | 0.87 [0.72, 1.06] |
| 3.3 Day 3 | 6 | 267 | Ratio of Means (Random, 95% CI) | 0.98 [0.84, 1.14] |
| 4 Mean Airway Pressure (Ratio of Means) Show forest plot | 8 | Ratio of Means (Random, 95% CI) | Subtotals only | |
| 4.1 Day 1 | 8 | 389 | Ratio of Means (Random, 95% CI) | 1.33 [1.27, 1.40] |
| 4.2 Day 2 | 6 | 309 | Ratio of Means (Random, 95% CI) | 1.26 [1.16, 1.37] |
| 4.3 Day 3 | 6 | 274 | Ratio of Means (Random, 95% CI) | 1.22 [1.07, 1.39] |