| Docetaxel versus non‐docetaxel‐containing regimens for advanced gastric cancer |
| Patient or population: people with advanced gastric cancer
Settings: outpatient clinics participating in international multicentre studies
Intervention: docetaxel Control: non‐docetaxel‐containing regimens |
| Overall survival | Study population | HR 0.86 (0.78 to 0.95) | 2001
(8 studies) | ⊕⊕⊕⊕
high | Weighted average of median survival durations from included studies |
| 9.9 months | 11.2 months |
| Overall survival ‐ Substitutive comparisons | Study population | HR 1.05 (0.87 to 1.27) | 479
(3 studies) | ⊕⊕⊕⊝
moderate1 | Weighted average of median survival durations from included studies |
| 9.4 months | 9.2 months |
| Overall survival ‐ Additive comparisons | Study population | HR 0.80 (0.71 to 0.91) | 1466
(4 studies) | ⊕⊕⊕⊝
moderate2 | Weighted average of median survival durations from included studies |
| 10.6 months | 12.3 months |
| Overall survival ‐ Other comparisons | Study population | HR 0.80 (0.46 to 1.39) | 56
(1 study) | ⊕⊝⊝⊝
very low1,2,3 | Median survival durations from the only included study |
| 9.5 months | 11.9 months |
| Tumour response | Study population | OR 1.37 (1.03 to 1.83) | 1820
(9 studies) | ⊕⊕⊕⊝
moderate4 | |
| 311 per 1000 | 382 per 1000
(317 to 452) |
| Moderate |
| 310 per 1000 | 381 per 1000
(316 to 451) |
| Tumour response ‐ Substitutive comparison | Study population | OR 1.03 (0.71 to 1.50) | 525
(4 studies) | ⊕⊕⊕⊝
moderate1 | |
| 314 per 1000 | 320 per 1000
(245 to 407) |
| Moderate |
| 327 per 1000 | 334 per 1000
(256 to 422) |
| Tumour response ‐ Additive comparison | Study population | OR 1.83 (1.45 to 2.32) | 1235
(4 studies) | ⊕⊕⊕⊕
high | |
| 295 per 1000 | 434 per 1000
(378 to 493) |
| Moderate |
| 296 per 1000 | 435 per 1000
(379 to 494) |
| Tumour response ‐ Other comparison | Study population | OR 0.33 (0.12 to 0.96) | 60
(1 study) | ⊕⊝⊝⊝
very low1,3 | |
| 600 per 1000 | 331 per 1000
(153 to 590) |
| Moderate |
| 600 per 1000 | 331 per 1000
(153 to 590) |
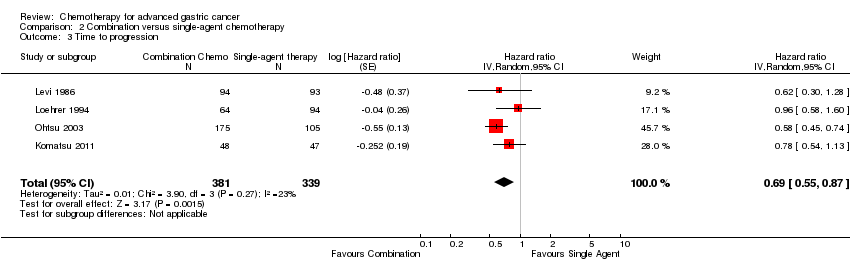
| Time to progression | Study population | HR 1.06 (0.85 to 1.32) | 360
(2 studies) | ⊕⊝⊝⊝
very low1,2,3 | Weighted average of median survival durations from included studies |
| 6.0 months | 5.9 months |
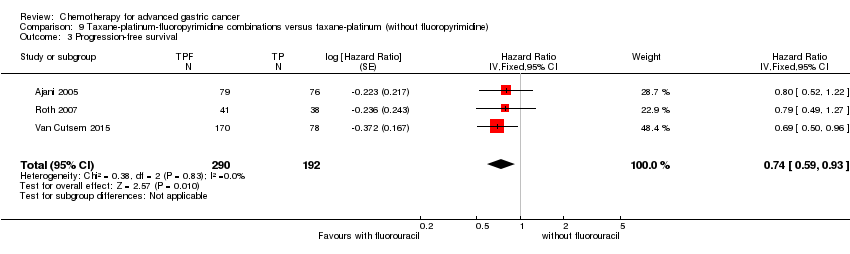
| Progression‐free survival | Study population | HR 0.76 (0.63 to 0.91) | 1498
(5 studies) | ⊕⊕⊕⊝
moderate4 | Weighted average of median survival durations from included studies |
| 4.8 months | 6.0 months |
| Progression‐free survival ‐ Substitutive comparisons | Study population | HR 1.15 (0.77 to 1.72) | 119
(1 study) | ⊕⊝⊝⊝
very low1,2,3 | Median survival durations from the only included study |
| 4.9 months | 4.6 months |
| Progression‐free survival ‐ Additive comparison | Study population | HR 0.70 (0.61 to 0.81) | 1323
(3 studies) | ⊕⊕⊕⊕
high | Weighted average of median survival durations from included studies |
| 4.3 months | 6.0 months |
| Progression‐free survival ‐ Other comparison | Study population | HR 0.94 (0.55 to 1.60) | 56
(1 study) | ⊕⊝⊝⊝
very low1,3 | Median survival durations from the only included study |
| 6.4 months | 6.8 months |
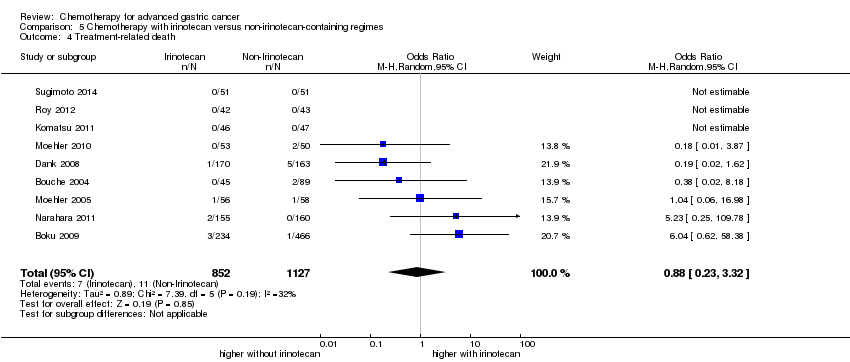
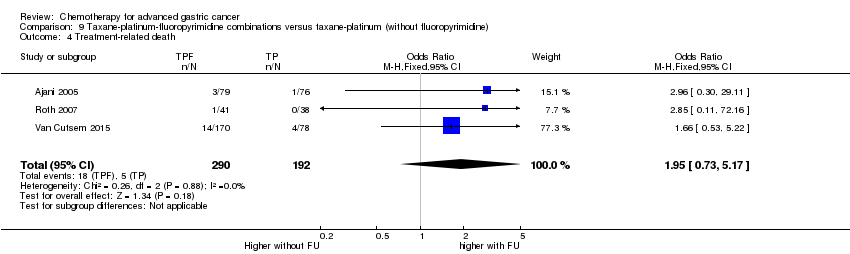
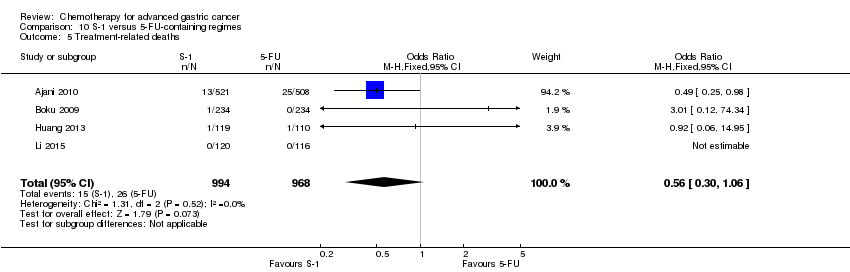
| Treatment‐related death | Study population | OR 1.10
(0.55 to 2.20) | 2113
(7 studies) | ⊕⊕⊕⊝
moderate1 | |
| 12 per 1000 | 14 per 1000
(7 to 27) |
| Moderate |
| 5 per 1000 | 5 per 1000
(3 to 11) |
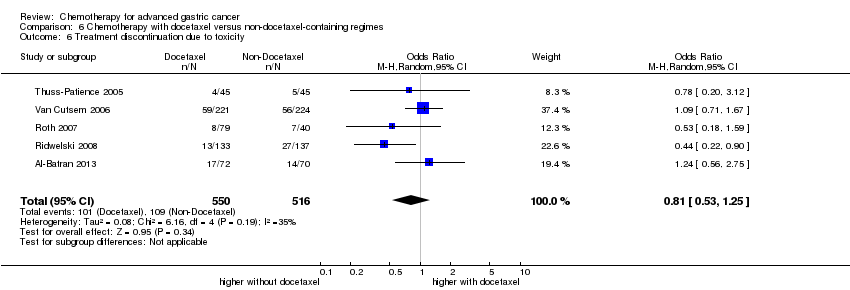
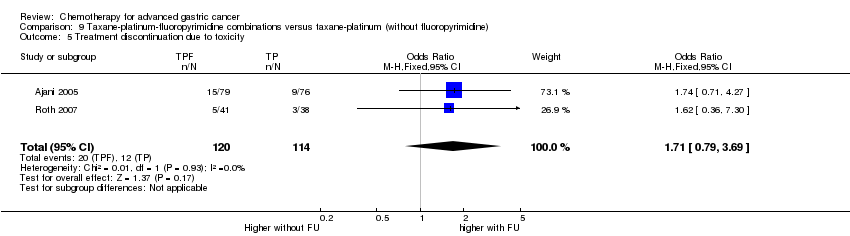
| Treatment discontinuation due to toxicity | Study population | OR 0.81 (0.53 to 1.25) | 1066
(5 studies) | ⊕⊕⊝⊝
low1,4 | |
| 211 per 1000 | 178 per 1000
(124 to 251) |
| Moderate |
| 197 per 1000 | 166 per 1000
(115 to 235) |
| *For time‐to‐event outcomes, e.g. overall survival, the assumed and corresponding risks were obtained by calculating the weighted average of the median survival durations reported in included studies. For dichotomous outcomes, the assumed and corresponding risks (and their 95% confidence interval) are based on proportions of events in the control and intervention groups respectively.
CI: Confidence interval; OR: Odds ratio; HR: Hazard ratio; |
| GRADE Working Group grades of evidence
High quality: Further research is very unlikely to change our confidence in the estimate of effect.
Moderate quality: Further research is likely to have an important impact on our confidence in the estimate of effect and may change the estimate.
Low quality: Further research is very likely to have an important impact on our confidence in the estimate of effect and is likely to change the estimate.
Very low quality: We are very uncertain about the estimate. |