위암말기환자를 위한 화학요법
초록
배경
위암은 전세계적으로 5번째로 흔한 암이다. 서방 국가에서는 거의 대부분의 환자가 말기 단계 또는 치료 목적의 수술 이후 재발함으로써 진단받는 모습을 보인다. 말기 환자의 경우, 표적 치료법으로 얻는 중요한 혜택은 일차적으로 트라스투주맙(trastuzumab)을 이용한 HER‐2 양성질환에 한정된다. 이차적으로는 생존 혜택이 입증된 라무시루맙(ramucirumab)이 단독 혹은 파클리탁셀(paclitaxel)과 병용되어 사용된다. 즉, 전신 화학요법은 말기 위암 치료의 주류 요법으로 남아있다. 치료 요법의 선택에 따른 불확실성이 존재한다.
목적
말기 위암에 대한 화학요법과 지지 요법(BSC)을 비교평가하기 위해 복합제제 화학요법 대 단일제제 화학요법과 타 화학요법의 조합을 비교한다.
검색 전략
2016년 6월까지의 Cochrane Central Register of Controlled Trials, MEDLINE 및 Embase의 참고문헌목록을 검색하고 제약 기업과 전문가에게 연락을 취하였으며 무작위대조시험(RCT)의 확인을 실시했다.
선정 기준
본 연구는 전신, 정맥 혹은 경구 화학요법 대 지지요법(BSC)에 해당하는 무작위대조시험만을 고려하였으며, 말기 위암에 있어서의 복합제제요법 대 단일제제요법 및 타 화학요법을 비교하였다.
자료 수집 및 분석
2명의 검토자가 독립적으로 연구를 확인하고 데이터를 추출하였다. 이견이 있을 경우 제 3의 검토자에게 의견을 구했다. 부족한 정보는 임상시험의 연구자와 연락을 취하여 얻었다.
주요 결과
64건의 무작위대조시험(RCT)를 포함하였고 이 중 60건의 RCT(참가자 11,698명)에서 얻은 데이터를 전체 생존률(OS)의 메타분석에 사용하였다. 그 결과, 화학요법에 의한 OS가 BSC보다 약 6.7개월 가량 긴 것으로 나타났다(위험비(HR) 0.3, 95% 신뢰구간(CI) 0.24˜0.55, 참가자 184명, 3건의 임상시험, 근거의 질 중간). 병용 화학요법은 단일제제 화학요법보다 OS가 약간(1개월) 길어졌지만(HR 0.84, 95% CI 0.79˜0.89, 참가자 4,447명, 23건의 임상시험, 근거의 질 중간) 이는 독성의 증가로 인해 부분적으로 상쇄되고 있었다. 3개 화학제제 조합에서 시스플라틴이 옥살리플라틴, 5‐FU가 카페시타빈으로 대체된 상태의 에피루비신의 혜택은 불분명하다.
이리노테칸 처방은 이리노테칸을 포함하지 않는 처방에 비해 OS를 약간(1.6개월 정도) 증가시켰다(HR 0.87, 95% CI 0.80˜0.95, 참가자 2,135명, 10건의 임상시험, 근거의 질 높음).
도세탁셀은 도세탁셀을 포함하지 않는 처방에 비해 OS를 약간(1개월) 연장시켰다(HR 0.86, 95% CI 0.78˜0.95, 참가자 2,001명, 8건의 임상시험, 근거의 질 높음). 그러나 하위집단분석 결과, 도세탁셀을 포함한 병용 요법(단일제제 또는 2개 화학제제의 병용에 도세탁셀을 추가)에 의해 OS가 연장되는지에 대한 여부는 확실하지 않다(HR 0.80, 95% CI 0.71˜0.91, 참가자 1,466명, 4건의 임상시험, 근거의 질 중간). 다른 화학요법 대신에 도세탁셀을 사용해도 OS에 차이가 거의 없거나 전혀 없었다(HR 1.05, 참가자 479명, 3건의 임상시험, 근거의 질 중간). 카페시타빈 대 5‐FU의 경우는 OS에 차이가 거의 없거나 전혀 없는 것으로 나타났다(HR 0.94, 95% CI 0.79˜1.11, 참가자 732명, 5건의 임상시험, 근거의 질 중간). 카페시타빈 대 5‐FU의 경우는 OS에 차이가 거의 없거나 전혀 없는 것으로 나타났다(HR 0.94, 95% CI 0.79˜1.11, 참가자 732명, 5건의 임상시험, 근거의 질 중간).
옥살리플라틴은 시스플라틴을 포함한 처방보다 OS가(1개월 미만) 연장된 것으로 나타났다(HR 0.81, 95% CI 0.67˜0.98, 참가자 1,105명, 5건의 임상시험, 근거의 질 낮음). 탁산‐백금 제제 조합 요법에 플루오로피리미딘을 추가하는 경우에(추가하지 않는 경우보다) OS의 연장 여부는 확실하지 않다(HR 0.86, 95% CI 0.71˜1.06, 참가자 482명, 3건의 임상시험, 근거의 질 매우 낮음). S‐1 처방은 5‐FU를 포함한 처방보다 약간(1개월 미만) OS가 개선되었지만(HR 0.91, 95% CI 0.83˜1.00, 참가자 1,793명, 4건의 임상시험, 근거의 질 높음), 아시아인과 비아시아인의 S‐1의 용량 및 스케줄이 다르기 때문에 이 결과가 개별 집단에 적용되는지는 확실하지 않다.
연구진 결론
화학요법은 BSC에 비해 생존률을(6.7개월) 개선시켰으며 병용 화학요법은 5‐FU 단일제제화학요법에 비해 생존률을(1개월) 개선시켰다. 전체 환자를 대상으로 한 HER‐2 검사가 HER‐2 양성 종양 환자를 식별하는 데 도움이 될 수 있으며, 이들에게는 금지되지 않는 이상 트라스투주맙과 카페시타빈 또는 5‐FU와 시스플라틴의 병용이 효과적으로 나타난다. HER‐2 음성인 경우, 이리노테칸, 도세탁셀, 옥살리플라틴 또는 경구 5‐FU 전구약물을 포함한 서로 다른 2개 제제 및 3개 제제 병용요법이 말기 위암에 유효하며, 각 처방에 대한 부작용을 치료법을 선택할 때 필수적으로 고려하여야 한다. 이리노테칸을 포함한 병용 요법과 도세탁셀을 포함한 병용 요법(단일제제 또는 2개 제제(Platinum 제제/5‐FU 병용)에 도세탁셀을 추가)에서 위의 비교 시 유의미한 혜택이 나타났다. 더해서, 도세탁셀을 포함한 3개 제제 병용 요법은 반응률이 개선되었지만, 해당 요법(DCF 요법, FLO‐T 요법)의 효과는 독성의 증가로 상쇄되고 있다. 또한 옥살리플라틴을 포함한 처방은 시스플라틴을 포함한 동일한 처방에 비해 OS에서 유익하고 S‐1은 5‐FU를 포함한 처방에 비해 크지는 않지만 효과가 있었다.
시스플라틴, 5‐FU 및 에피루비신을 포함한 3개 제제 병용요법을 에피루비신을 포함하지 않는 동일한 처방과 비교했을 때의 효과는 이차치료가 지속적으로 관리될 때 여전히 유효하였다. 또한 시스플라틴을 옥살리플라틴, 5‐FU를 카페시타빈으로 대체한 경우의 효과는 아직 의문이다. 또한 3개 제제 화학요법에서 확인된 생존률 혜택의 정도는 미국 임상 종양 학회(ASCO) (Ellis 2014)에서 임상적으로 의미있는 정도는 아니라고 정의되었다. 2개 제제 요법에 세 번째 약 추가를 통해 독성 증가라는 비용을 치르고 생존 혜택이 관찰된 것과는 대조적으로, 다른 화학요법을 이리노테칸으로 대체한 요법의 경우 독성의 증가없이 생존 혜택(통계적 유의성의 경계)을 가져왔다. 이 때문에 이리노테칸/5‐FU를 포함한 병용요법은 주요 치료의 유력한 대안이 된다. 신중하게 해석할 필요가 있지만, 임상시험 하나에서 이뤄진 하위집단분석은 고령 환자에서 시스플라틴 기반 처방보다 옥살리플라틴에서 얻을 수 있는 혜택이 더 크게 나타나며, 국소적 말기 질환 환자와 65세 미만의 환자에게서 5‐FU, 도세탁셀 및 옥살리플라틴을 포함한 3개 제제 요법이 5‐FU와 옥살리플라틴을 조합한 2개 제제 요법보다 유용할 수 있다는, 후속 연구가 필요한 가설이 제시되었다. 상태가 양호한 환자에 대한 이차 화학요법이 여러 RCT에 의해 확립되어왔다.
PICO
쉬운 말 요약
위암말기환자를 위한 화학요법
배경
검진이 정기적으로 실시되고 있지 않은 국가에서는 전체 위암 환자의 80˜90%가 종양의 수술이 불가능한 말기 단계에 진단되거나 수술 후 5년 이내에 재발한다. 말기 단계에 전신 화학요법을 시작하기 전에 Human Epidermal growth factor Receptor‐2(인간 표피 성장 인자 수용체 2) (줄여서 HER‐2)의 과잉 발현의 확인이 필수이며, HER‐2가 과잉 발현하는 경우는 금지되지 않은 이상 시스플라틴/플루오로피리미딘 제제를 기반으로 한 화학요법과 트라스투주맙(즉, 인간 표피 성장 인자 수용체 II에 결합하는 단클론 항체)의 조합에 의한 치료를 받아야 한다.
연구 특징
생의학 데이터베이스(MEDLINE, Embase, Cochrane Central Register of Clinical Trials)를 2016년 6월까지 검색하였다. 무작위대조시험(RCT) 64건을 고찰 대상으로 포함시켰으며, 그 중 60건은 참가자 총 11,698명의 전체 생존률 데이터가 포함되어 있었다. 195건을 다양한 이유로 제외하였다.
근거의 질
근거의 질은 대조 및 결과 평가를 통해 매우 낮은 정도부터 높은 정도까지 이르렀다. 질을 낮추는 요인은 눈가림 부족으로 인한 바이어스 위험 또는 독립적이지 못한 방사선학적 검토와 비정밀성 혹은 이질성 등이다.
주요 결과
지지 요법(BSC) 단독 시행과 비교하여 화학요법에서 생존 기간(6.7 개월) 및 QOL(삶의 질)이 개선되었으며 주요 치료에서 병용 화학요법은 5‐FU 단일제제에 비해 생존률을(1개월) 개선시켰다.
백금‐플루오로피리미딘 제제 기반 화학요법 처방에 도세탁셀을 추가함으로 인하여 독성이 증가하지만, 생존률도(한 달 이상) 증가하는 것으로 보인다. 백금‐플루오로피리미딘 제제에 의한 2개 제제 병용 화학요법에 세 번째 약제(도세탁셀 또는 에피루비신)를 추가할 때 혜택이 독성을 능가하는가에 대한 여부는 아직 불분명하다
따라서 종양의 부담과 신속한 반응을 이끌어낼 필요성뿐만 아니라 부작용의 내용 및 그 부작용이 각 환자의 QOL에 미치는 영향을 고려하는 것이 처방을 선택하는데 필수적이다. 더하여, 이리노테칸을 포함한 처방은 포함하지 않는 처방에 비해 전체 생존률을(1.6 개월) 연장했다.
Authors' conclusions
Summary of findings
| Chemotherapy versus best supportive care for advanced gastric cancer | ||||||
| Patient or population: people with advanced gastric cancer Control: best supportive care alone | ||||||
| Outcomes | Illustrative comparative risks* (95% CI) | Relative effect | No of Participants | Quality of the evidence | Comments | |
| Assumed risk | Corresponding risk | |||||
| Best supportive care | Chemotherapy | |||||
| Overall survival | Study population | HR 0.37 | 184 | ⊕⊕⊕⊝ | Weighted average of median survival durations from included studies | |
| 4.3 months | 11.0 months | |||||
| Time to progression | Study population | HR 0.31 | 144 | ⊕⊕⊕⊝ | Weighted average of median survival durations from included studies | |
| 2.5 months | 7.4 months | |||||
| *For time‐to‐event outcomes, e.g. overall survival, the assumed and corresponding risks were obtained by calculating the weighted average of the median survival durations reported in included studies. For dichotomous outcomes, the assumed and corresponding risks (and their 95% confidence interval) are based on proportions of events in the control and intervention groups respectively. | ||||||
| GRADE Working Group grades of evidence | ||||||
| 1 Early termination of Pyrhönen 1995; downgraded by one level for risk of bias. Outcomes shown include those which were measured in the studies, or reported in a consistent fashion across included studies. Several critical outcomes (e.g. tumour response, treatment‐related death, and discontinuation due to toxicity) were not evaluated or reported in a consistent fashion in these studies, as they were mainly conducted before year 2000. | ||||||
| Combination versus single‐agent chemotherapy for advanced gastric cancer | ||||||
| Patient or population: people with advanced gastric cancer Control: single‐agent chemotherapy | ||||||
| Outcomes | Illustrative comparative risks* (95% CI) | Relative effect | No of Participants | Quality of the evidence | Comments | |
| Assumed risk | Corresponding risk | |||||
| Single‐agent chemotherapy | Combination | |||||
| Overall survival | Study population | HR 0.84 | 4447 | ⊕⊕⊕⊝ | Weighted average of median survival durations from included studies | |
|
|
| |||||
| Tumour response | Study population | OR 2.30 | 2833 | ⊕⊕⊕⊕ | ||
| 226 per 1000 | 402 per 1000 | |||||
| Moderate | ||||||
| 231 per 1000 | 409 per 1000 | |||||
| Time to progression | Study population | HR 0.69 | 720 | ⊕⊕⊕⊝ | Weighted average of median survival durations from included studies | |
| 2.8 months | 4.1 months | |||||
| Treatment‐related death | Study population | OR 1.64 | 3876 | ⊕⊕⊝⊝ | ||
| 5 per 1000 | 9 per 1000 | |||||
| Moderate | ||||||
| 0 per 1000 | 0 per 1000 | |||||
| *For time‐to‐event outcomes, e.g. overall survival, the assumed and corresponding risks were obtained by calculating the weighted average of the median survival durations reported in included studies. For dichotomous outcomes, the assumed and corresponding risks (and their 95% confidence interval) are based on proportions of events in the control and intervention groups respectively. | ||||||
| GRADE Working Group grades of evidence | ||||||
| 1 Downgraded by one level for risk of bias. | ||||||
| 5‐FU/cisplatin/anthracycline combinations versus 5‐FU/cisplatin combinations (without anthracyclines) for advanced gastric cancer | ||||||
| Patient or population: people with advanced gastric cancer Control: 5‐FU/cisplatin combinations (without anthracyclines) | ||||||
| Outcomes | Illustrative comparative risks* (95% CI) | Relative effect | No of Participants | Quality of the evidence | Comments | |
| Assumed risk | Corresponding risk | |||||
| 5‐FU/cisplatin combinations (without anthracyclines) | 5‐FU/cisplatin/anthracycline combinations | |||||
| Overall survival | Study population | HR 0.74 | 579 | ⊕⊕⊕⊝ | Weighted average of median survival durations from included studies | |
| 8.6 months | 9.9 months | |||||
| Tumour response | Study population | OR 2.86 | 78 | ⊕⊕⊝⊝ | ||
| 385 per 1000 | 641 per 1000 | |||||
| Moderate | ||||||
| 385 per 1000 | 642 per 1000 | |||||
| Time to progression | Study population | HR 0.62 | 78 | ⊕⊕⊝⊝ | Median survival durations from the only included study | |
| 7.9 months | 12.1 months | |||||
| *For time‐to‐event outcomes, e.g. overall survival, the assumed and corresponding risks were obtained by calculating the weighted average of the median survival durations reported in included studies. For dichotomous outcomes, the assumed and corresponding risks (and their 95% confidence interval) are based on proportions of events in the control and intervention groups respectively. | ||||||
| GRADE Working Group grades of evidence | ||||||
| 1 Downgraded by one level for risk of bias. Outcomes shown include those which were measured in the studies, or reported in a consistent fashion across included studies. Several critical outcomes (e.g. treatment‐related death and discontinuation due to toxicity) were not evaluated or reported in a consistent fashion in these studies, as they were mainly conducted before year 2000. | ||||||
| 5‐FU/cisplatin/anthracycline combinations versus 5‐FU/anthracycline combinations (without cisplatin) for advanced gastric cancer | ||||||
| Patient or population: people with advanced gastric cancer Control: 5‐FU/cisplatin combinations (without anthracyclines) | ||||||
| Outcomes | Illustrative comparative risks* (95% CI) | Relative effect | No of Participants | Quality of the evidence | Comments | |
| Assumed risk | Corresponding risk | |||||
| 5‐FU/anthracycline combinations (without cisplatin) | 5‐FU/cisplatin/anthracycline combinations | |||||
| Overall survival | Study population | HR 0.82 | 1147 | ⊕⊕⊝⊝ | Weighted average of median survival durations from included studies | |
| 6.2 months | 8.4 months | |||||
| *For time‐to‐event outcomes, e.g. overall survival, the assumed and corresponding risks were obtained by calculating the weighted average of the median survival durations reported in included studies. For dichotomous outcomes, the assumed and corresponding risks (and their 95% confidence interval) are based on proportions of events in the control and intervention groups respectively. | ||||||
| GRADE Working Group grades of evidence | ||||||
| 1 Downgraded by one level for risk of bias. Several critical outcomes (i.e. tumour response, progression‐free survival, treatment‐related death and discontinuation due to toxicity) were not evaluated or reported in a consistent fashion in these studies, most of which were conducted before year 2000. | ||||||
| Irinotecan versus non‐irinotecan‐containing regimens for advanced gastric cancer | ||||||
| Patient or population: people with advanced gastric cancer Control: non‐irinotecan‐containing regimens | ||||||
| Outcomes | Illustrative comparative risks* (95% CI) | Relative effect | No of Participants | Quality of the evidence | Comments | |
| Assumed risk | Corresponding risk | |||||
| Non‐irinotecan‐containing regimens | Chemotherapy with Irinotecan | |||||
| Overall survival | Study population | HR 0.87 | 2135 | ⊕⊕⊕⊝ | Weighted average of median survival durations from included studies | |
| 9.7 months | 11.3 months | |||||
| Overall survival ‐ Substitutive comparisons | Study population | HR 0.87 (0.75 to 1.00) | 826 | ⊕⊕⊕⊝ | Weighted average of median survival durations from included studies | |
| 9.1 months | 9.9 months | |||||
| Overall survival ‐ Additive comparisons | Study population | HR 0.88 | 500 | ⊕⊕⊝⊝ | Weighted average of median survival durations from included studies | |
| 10.9 months | 11.9 months | |||||
| Overall survival ‐ Other comparisons | Study population | HR 0.87 | 809 | ⊕⊝⊝⊝ | Weighted average of median survival durations from included studies | |
| 11.4 months | 12.6 months | |||||
| Tumour response | Study population | OR 1.72 (1.24 to 2.40) | 1266 | ⊕⊕⊝⊝ | ||
| 288 per 1000 | 410 per 1000 | |||||
| Moderate | ||||||
| 275 per 1000 | 395 per 1000 | |||||
| Tumour response ‐ Substitutive comparisons | Study population | OR 1.53 (0.93 to 2.50) | 756 | ⊕⊕⊝⊝ | ||
| 297 per 1000 | 393 per 1000 | |||||
| Moderate | ||||||
| 294 per 1000 | 389 per 1000 | |||||
| Tumour response ‐ Additive comparisons | Study population | OR 2.18 (1.25 to 3.80) | 345 | ⊕⊕⊝⊝ | ||
| 224 per 1000 | 386 per 1000 | |||||
| Moderate | ||||||
| 219 per 1000 | 379 per 1000 | |||||
| Tumour response ‐ Other comparisons | Study population | OR 1.87 | 165 | ⊕⊝⊝⊝ | ||
| 376 per 1000 | 530 per 1000 | |||||
| Moderate | ||||||
| 367 per 1000 | 520 per 1000 | |||||
| Progression‐free survival | Study population | HR 0.76 (0.69 to 0.84) | 1640 | ⊕⊕⊕⊕ | Weighted average of median survival durations from included studies | |
| 4.4 months | 5.9 months | |||||
| Progression‐free survival ‐ Substitutive comparison | Study population | HR 0.85 (0.72 to 1.00) | 741 | ⊕⊕⊕⊝ | Weighted average of median survival durations from included studies | |
| 4.2 months | 5.3 months | |||||
| Progression‐free survival ‐ Additive comparisons | Study population | HR 0.51 | 90 | ⊕⊕⊕⊝ | Median survival durations from the only included study | |
| 3.2 months | 6.9 months | |||||
| Progression‐free survival ‐ Other comparisons | Study population | HR 0.74 (0.66 to 0.84) | 809 | ⊕⊕⊕⊕ | Weighted average of median survival durations from included studies | |
| 5.4 months | 6.6 months | |||||
| Treatment‐related death | Study population | OR 0.88 (0.23 to 3.32) | 1979 | ⊕⊕⊝⊝ | ||
| 10 per 1000 | 9 per 1000 | |||||
| Moderate | ||||||
| 2 per 1000 | 2 per 1000 | |||||
| Treatment discontinuation due to toxicity | Study population | OR 1.00 (0.46 to 2.20) | 1979 | ⊕⊝⊝⊝ | ||
| 137 per 1000 | 137 per 1000 | |||||
| Moderate | ||||||
| 215 per 1000 | 215 per 1000 | |||||
| *For time‐to‐event outcomes, e.g. overall survival, the assumed and corresponding risks were obtained by calculating the weighted average of the median survival durations reported in included studies. For dichotomous outcomes, the assumed and corresponding risks (and their 95% confidence interval) are based on proportions of events in the control and intervention groups respectively. | ||||||
| GRADE Working Group grades of evidence | ||||||
| 1 Downgraded by one level for risk of bias. | ||||||
| Docetaxel versus non‐docetaxel‐containing regimens for advanced gastric cancer | ||||||
| Patient or population: people with advanced gastric cancer Control: non‐docetaxel‐containing regimens | ||||||
| Outcomes | Illustrative comparative risks* (95% CI) | Relative effect | No of Participants | Quality of the evidence | Comments | |
| Assumed risk | Corresponding risk | |||||
| Non‐docetaxel‐containing regimens | Chemotherapy with docetaxel | |||||
| Overall survival | Study population | HR 0.86 (0.78 to 0.95) | 2001 | ⊕⊕⊕⊕ | Weighted average of median survival durations from included studies | |
| 9.9 months | 11.2 months | |||||
| Overall survival ‐ Substitutive comparisons | Study population | HR 1.05 (0.87 to 1.27) | 479 | ⊕⊕⊕⊝ | Weighted average of median survival durations from included studies | |
| 9.4 months | 9.2 months | |||||
| Overall survival ‐ Additive comparisons | Study population | HR 0.80 (0.71 to 0.91) | 1466 | ⊕⊕⊕⊝ | Weighted average of median survival durations from included studies | |
| 10.6 months | 12.3 months | |||||
| Overall survival ‐ Other comparisons | Study population | HR 0.80 (0.46 to 1.39) | 56 | ⊕⊝⊝⊝ | Median survival durations from the only included study | |
| 9.5 months | 11.9 months | |||||
| Tumour response | Study population | OR 1.37 (1.03 to 1.83) | 1820 | ⊕⊕⊕⊝ | ||
| 311 per 1000 | 382 per 1000 | |||||
| Moderate | ||||||
| 310 per 1000 | 381 per 1000 | |||||
| Tumour response ‐ Substitutive comparison | Study population | OR 1.03 (0.71 to 1.50) | 525 | ⊕⊕⊕⊝ | ||
| 314 per 1000 | 320 per 1000 | |||||
| Moderate | ||||||
| 327 per 1000 | 334 per 1000 | |||||
| Tumour response ‐ Additive comparison | Study population | OR 1.83 (1.45 to 2.32) | 1235 | ⊕⊕⊕⊕ | ||
| 295 per 1000 | 434 per 1000 | |||||
| Moderate | ||||||
| 296 per 1000 | 435 per 1000 | |||||
| Tumour response ‐ Other comparison | Study population | OR 0.33 (0.12 to 0.96) | 60 | ⊕⊝⊝⊝ | ||
| 600 per 1000 | 331 per 1000 | |||||
| Moderate | ||||||
| 600 per 1000 | 331 per 1000 | |||||
| Time to progression | Study population | HR 1.06 (0.85 to 1.32) | 360 | ⊕⊝⊝⊝ | Weighted average of median survival durations from included studies | |
| 6.0 months | 5.9 months | |||||
| Progression‐free survival | Study population | HR 0.76 (0.63 to 0.91) | 1498 | ⊕⊕⊕⊝ | Weighted average of median survival durations from included studies | |
| 4.8 months | 6.0 months | |||||
| Progression‐free survival ‐ Substitutive comparisons | Study population | HR 1.15 (0.77 to 1.72) | 119 | ⊕⊝⊝⊝ | Median survival durations from the only included study | |
| 4.9 months | 4.6 months | |||||
| Progression‐free survival ‐ Additive comparison | Study population | HR 0.70 (0.61 to 0.81) | 1323 | ⊕⊕⊕⊕ | Weighted average of median survival durations from included studies | |
| 4.3 months | 6.0 months | |||||
| Progression‐free survival ‐ Other comparison | Study population | HR 0.94 (0.55 to 1.60) | 56 | ⊕⊝⊝⊝ | Median survival durations from the only included study | |
| 6.4 months | 6.8 months | |||||
| Treatment‐related death | Study population | OR 1.10 | 2113 | ⊕⊕⊕⊝ | ||
| 12 per 1000 | 14 per 1000 | |||||
| Moderate | ||||||
| 5 per 1000 | 5 per 1000 | |||||
| Treatment discontinuation due to toxicity | Study population | OR 0.81 (0.53 to 1.25) | 1066 | ⊕⊕⊝⊝ | ||
| 211 per 1000 | 178 per 1000 | |||||
| Moderate | ||||||
| 197 per 1000 | 166 per 1000 | |||||
| *For time‐to‐event outcomes, e.g. overall survival, the assumed and corresponding risks were obtained by calculating the weighted average of the median survival durations reported in included studies. For dichotomous outcomes, the assumed and corresponding risks (and their 95% confidence interval) are based on proportions of events in the control and intervention groups respectively. | ||||||
| GRADE Working Group grades of evidence | ||||||
| 1 Downgraded by one level for imprecision. | ||||||
| Capecitabine versus 5‐FU‐containing regimens for advanced gastric cancer | ||||||
| Patient or population: people with advanced gastric cancer Control: 5‐FU‐containing regimens | ||||||
| Outcomes | Illustrative comparative risks* (95% CI) | Relative effect | No of Participants | Quality of the evidence | Comments | |
| Assumed risk | Corresponding risk | |||||
| 5‐FU‐containing regimens | Capecitabine‐containing regimens | |||||
| Overall Survival | Study population | HR 0.94 (0.79 to 1.11) | 732 | ⊕⊕⊕⊝ | Weighted average of median survival durations from included studies | |
| 10.9 months | 10.8 months | |||||
| Tumour response | Study population | OR 0.85 (0.40 to 1.79) | 636 | ⊕⊝⊝⊝ | ||
| 384 per 1000 | 347 per 1000 | |||||
| Moderate | ||||||
| 394 per 1000 | 356 per 1000 | |||||
| Time to progression | Study population | HR 0.72 (0.47 to 1.12) | 85 | ⊕⊝⊝⊝ | Median survival durations from the only included study | |
| 5.5 months | 6.8 months | |||||
| Progression‐free survival | Study population | HR 0.98 (0.77 to 1.23) | 647 | ⊕⊝⊝⊝ | Weighted average of median survival durations from included studies | |
| 6.7 months | 6.5 months | |||||
| Treatment‐related death | Study population | OR 1.88 (0.23 to 15.15) | 481 | ⊕⊝⊝⊝ | ||
| 21 per 1000 | 38 per 1000 | |||||
| Moderate | ||||||
| 24 per 1000 | 44 per 1000 | |||||
| Treatment discontinuation due to toxicity | Study population | OR 0.99 (0.56 to 1.77) | 311 | ⊕⊕⊝⊝ | ||
| 181 per 1000 | 179 per 1000 | |||||
| Moderate | ||||||
| 181 per 1000 | 180 per 1000 | |||||
| *For time‐to‐event outcomes, e.g. overall survival, the assumed and corresponding risks were obtained by calculating the weighted average of the median survival durations reported in included studies. For dichotomous outcomes, the assumed and corresponding risks (and their 95% confidence interval) are based on proportions of events in the control and intervention groups respectively. | ||||||
| GRADE Working Group grades of evidence | ||||||
| 1 Downgraded by one level for risk of bias. | ||||||
| Oxaliplatin versus the same regimen including cisplatin for advanced gastric cancer | ||||||
| Patient or population: people with advanced gastric cancer Control: the same regimen including cisplatin | ||||||
| Outcomes | Illustrative comparative risks* (95% CI) | Relative effect | No of Participants | Quality of the evidence | Comments | |
| Assumed risk | Corresponding risk | |||||
| Cisplatin‐containing regimen | Oxaliplatin‐containing regimen | |||||
| Overall Survival | Study population | HR 0.81 (0.67 to 0.98) | 1105 | ⊕⊕⊝⊝ | Weighted average of median survival durations from included studies | |
| 11.3 months | 14.0 months | |||||
| Tumour response | Study population | OR 1.38 (1.08 to 1.76) | 1081 | ⊕⊕⊕⊝ | ||
| 468 per 1000 | 548 per 1000 | |||||
| Moderate | ||||||
| 458 per 1000 | 538 per 1000 | |||||
| Progression‐free survival | Study population | HR 0.88 (0.66 to 1.19) | 1034 | ⊕⊕⊝⊝ | Weighted average of median survival durations from included studies | |
| 4.9 months | 6.0 months | |||||
| Treatment‐related death | Study population | OR 0.47 (0.17 to 1.30) | 1132 | ⊕⊕⊝⊝ | ||
| 20 per 1000 | 9 per 1000 | |||||
| Moderate | ||||||
| 24 per 1000 | 11 per 1000 | |||||
| Treatment discontinuation due to toxicity | Study population | OR 0.97 (0.44 to 2.13) | 970 | ⊕⊝⊝⊝ | ||
| 95 per 1000 | 93 per 1000 | |||||
| Moderate | ||||||
| 102 per 1000 | 99 per 1000 | |||||
| *For time‐to‐event outcomes, e.g. overall survival, the assumed and corresponding risks were obtained by calculating the weighted average of the median survival durations reported in included studies. For dichotomous outcomes, the assumed and corresponding risks (and their 95% confidence interval) are based on proportions of events in the control and intervention groups respectively. | ||||||
| GRADE Working Group grades of evidence | ||||||
| 1 Downgraded by one level for risk of bias. | ||||||
| Taxane‐platinum‐fluoropyrimidine combinations versus taxane‐platinum (without fluoropyrimidine) for advanced gastric cancer | ||||||
| Patient or population: people with advanced gastric cancer Control: taxane‐platinum (without fluoropyrimidine) | ||||||
| Outcomes | Illustrative comparative risks* (95% CI) | Relative effect | No of Participants | Quality of the evidence | Comments | |
| Assumed risk | Corresponding risk | |||||
| Taxane‐platinum (without fluoropyrimidine) | Taxane‐platinum‐fluoropyrimidine combination | |||||
| Overall survival | Study population | OR 0.86 | 482 | ⊕⊝⊝⊝ | Weighted average of median survival durations from included studies | |
| 10.0 months | 11.7 months | |||||
| Tumour response | Study population | OR 2.08 | 482 | ⊕⊕⊝⊝ | ||
| 234 per 1000 | 389 per 1000 | |||||
| Moderate | ||||||
| 231 per 1000 | 385 per 1000 | |||||
| Progression‐free survival | Study population | OR 0.74 | 482 | ⊕⊕⊕⊝ | Weighted average of median survival durations from included studies | |
| 4.4 months | 5.7 months | |||||
| Treatment‐related death | Study population | OR 1.95 | 482 | ⊕⊝⊝⊝ | ||
| 26 per 1000 | 50 per 1000 | |||||
| Moderate | ||||||
| 13 per 1000 | 25 per 1000 | |||||
| Treatment discontinuation due to toxicity | Study population | OR 1.71 | 234 | ⊕⊝⊝⊝ | ||
| 105 per 1000 | 167 per 1000 | |||||
| Moderate | ||||||
| 99 per 1000 | 158 per 1000 | |||||
| *For time‐to‐event outcomes, e.g. overall survival, the assumed and corresponding risks were obtained by calculating the weighted average of the median survival durations reported in included studies. For dichotomous outcomes, the assumed and corresponding risks (and their 95% confidence interval) are based on proportions of events in the control and intervention groups respectively. | ||||||
| GRADE Working Group grades of evidence | ||||||
| 1 Downgraded by one level for risk of bias. | ||||||
| S‐1 versus 5‐FU‐containing regimens for advanced gastric cancer | ||||||
| Patient or population: people with advanced gastric cancer Control: 5‐FU‐containing regimens | ||||||
| Outcomes | Illustrative comparative risks* (95% CI) | Relative effect | No of Participants | Quality of the evidence | Comments | |
| Assumed risk | Corresponding risk | |||||
| 5‐FU‐containing regimens | S‐1 containing regimens | |||||
| Overall Survival | Study population | HR 0.91 | 1793 | ⊕⊕⊕⊕ | Weighted average of median survival durations from included studies | |
| 9.1 months | 9.6 months | |||||
| Tumour response | Study population | OR 1.73 | 1753 | ⊕⊝⊝⊝ | ||
| 256 per 1000 | 374 per 1000 | |||||
| Moderate | ||||||
| 320 per 1000 | 449 per 1000 | |||||
| Progression‐free survival | Study population | HR 0.85 | 1942 | ⊕⊕⊝⊝ | Weighted average of median survival durations from included studies | |
| 4.3 months | 5.0 months | |||||
| Time‐to treatment failure | Study population | HR 0.88 | 1818 | ⊕⊕⊝⊝ | Weighted average of median survival durations from included studies | |
| 3.1 months | 3.9 months | |||||
| Treatment‐related deaths | Study population | OR 0.56 | 1962 | ⊕⊕⊕⊝ | ||
| 27 per 1000 | 15 per 1000 | |||||
| Moderate | ||||||
| 5 per 1000 | 3 per 1000 | |||||
| Treatment discontinuation due to toxicity | Study population | OR 0.85 | 1726 | ⊕⊕⊕⊕ | ||
| 128 per 1000 | 111 per 1000 | |||||
| Moderate | ||||||
| 144 per 1000 | 125 per 1000 | |||||
| *For time‐to‐event outcomes, e.g. overall survival, the assumed and corresponding risks were obtained by calculating the weighted average of the median survival durations reported in included studies. For dichotomous outcomes, the assumed and corresponding risks (and their 95% confidence interval) are based on proportions of events in the control and intervention groups respectively. | ||||||
| GRADE Working Group grades of evidence | ||||||
| 1 Downgraded by two levels for severe statistical heterogeneity. | ||||||
Background
Description of the condition
Epidemiology and pathogenesis
With an estimated 1.3 million new cases in 2015, gastric cancer is currently the fifth most common malignancy and the third leading cause of cancer‐related mortality worldwide (GBD Cancer Collaboration 2017). Only approximately 25% of all people with gastric cancer have resectable disease at presentation. Stomach cancer incidence rates show substantial variation internationally, with endemic regions in Asia, Eastern Europe and South America (Ferro 2014). Helicobacter pylori, atrophic gastritis, intestinal metaplasia, and dysplasia have been identified as important steps in the pathogenesis of gastric cancer (Correa 1996). Due to improvements in food conservation and diet, as well as eradication of Helicobacter pylori, gastric cancer incidence and mortality has steadily fallen in the last 50 years (Peleteiro 2012).
In contrast, a dramatic rise in cardial and gastroesophageal junction tumour incidence rates has been observed in middle‐aged, male, white Caucasians (Abrams 2013; Sharma 2003; Wu 2001). A proportion of these cases seems to be associated with Barrett's epithelium (intestinal metaplasia of the distal oesophagus), developing from chronic oesophageal reflux disease (MacDonald 1992; Wu‐Williams 1990). Although it is difficult to determine whether these cancers are gastroesophageal junction tumours or distal oesophageal malignancies (Rusch 2004), in clinical studies for advanced disease they are usually treated in the same manner.
Gastric cancer is a heterogenous disease entity, with major differences in growth patterns, differentiation, and molecular pathogenesis. More than 90% of stomach tumours are adenocarcinomas. While Lauren already in 1965 distinguished (Lauren 1965) the well‐differentiated or intestinal type and the undifferentiated or diffuse‐type, the current World Health Organization (WHO) classification Bosman 2010 differentiates the following five major histopathological subtypes: papillary, tubular, and mucinous adenocarcinoma, as well as poorly cohesive (with or without signet cells) and mixed carcinoma. While the first three types correspond to the former "well differentiated or intestinal type", the undifferentiated or diffuse type according to Lauren corresponds to the poorly cohesive type in the current classification.
While the intestinal type is more common in males, older age groups, and in high‐risk geographic areas, diffuse‐type carcinomas have a more equal male to female distribution, are more frequent in younger individuals, and have a more uniform geographic distribution (Crew 2004; Kelley 2003; Lauren 1965; Munoz 1968). Ninety per cent of gastric cancers are sporadic. Hereditary diffuse gastric cancer is rare, with less than 3% of cases. According to a recently published landmark paper (TCGA 2014), which describes the results of a comprehensive molecular evaluation of 295 primary gastric adenocarcinomas as part of The Cancer Genome Atlas (TCGA), the following four molecular subtypes can be distinguished.
-
Tumours positive for Epstein–Barr virus, which display recurrent PIK3CA mutations, extreme DNA hyper methylation, and amplification of JAK2, CD274 (also known as PD‐L1) and PDCD1LG2 (also known as PD‐L2).
-
Microsatellite unstable tumours, which show elevated mutation rates.
-
Genomically stable tumours, which are enriched for the diffuse histological variant and mutations of RHOA or fusions involving RHO‐family GTPase‐activating proteins.
-
Tumours with chromosomal instability, which show marked aneuploidy and focal amplification of receptor tyrosine kinases.
While this classification has no impact in the choice of systemic treatment at present, it will provide a roadmap for patient stratification and development of targeted therapies in the future.
In contrast, the over expression of the Human Epidermal growth factor Receptor‐2 (HER‐2), which is observed in 10% to 20% of the people, is clinically relevant today as it predicts a significant benefit from treatment with trastuzumab (Bang 2010). Further details of the pathogenesis of gastric cancer have been reviewed recently by Wadhwa and colleagues (Wadhwa 2013).
Prognosis and management options
Apart from endoscopic treatment for a minority of very small tumours, partial or complete gastrectomy with lymphadenectomy is the only potentially curative therapy for gastric cancer. Stage I to IV M0 tumours are principally resectable (MacDonald 2001a). However, although surgery carries a high cure rate for stage IA and IB cancers, the results for stage IIIA and IIIB cancers are poor. Many people with advanced disease, especially stage IIIA/B, are technically inoperable. Results for both resectable and locally advanced gastric cancer may be improved by either perioperative (e.g. Cunningham 2006; Ychou 2011) or adjuvant chemotherapy (Bang 2012; Paoletti 2013; Sakuramoto 2007). Unfortunately, even after an apparently 'curative' gastrectomy, relapse rates in prospective studies remain in the range of 40% to 60% (Bonenkamp 1999; Cunningham 2006; MacDonald 2001b; Songun 2010) in European studies. In the Western world, most people are diagnosed at an advanced stage, when the tumour is inoperable. People with inoperable, recurrent or metastatic tumours have a poor prognosis with a median survival time of three to five months without chemotherapy. Several small randomised studies have provided evidence that first‐line chemotherapy improves survival in these people (Glimelius 1994; Pyrhönen 1995; Scheithauer 1996), but benefit has to be weighed against treatment‐related toxicities. Furthermore, second‐line chemotherapy has shown to improve survival and quality of life in several recent randomised studies (Ford 2014; Kang 2012; Thuss‐Patience 2011).
While a significant number of phase‐III studies have studied the value of targeted therapies in advanced gastric cancer (e.g. Lordick 2013; Ohtsu 2011; Ohtsu 2013; Satoh 2014), only three phase III studies (Bang 2010; Fuchs 2014; Wilke 2014) have had positive results and impact on clinical practice:
According to the randomised phase III "TOGA" study (Bang 2010), response rate, progression‐free‐ and overall survival are greatly improved by adding the monoclonal antibody trastuzumab to the combination of cisplatin and capecitabine in HER‐2 positive gastric cancer, and introduced trastuzumab as a standard of care for HER‐2 positive disease. This study changed the workup of all people with advanced gastric cancer since all people with advanced gastric cancer must now undergo HER‐2 testing before the initiation of any chemotherapy and, in the absence of contraindications, be treated with trastuzumab in combination with cisplatin and 5‐FU or capecitabine in case of HER‐2 over expression on IHC (IHC 3+, or IHC 2+/FISH+). All other treatment options discussed in this review (oxaliplatin, irinotecan, docetaxel, as well as the anthracycline‐containing regimen ECF) are therefore valid only for people with HER‐2 negative disease. Studies on combinations of other chemotherapies with trastuzumab are currently limited to phase II and cannot be recommended for this reason. Furthermore, the VEGF‐receptor‐targeting antibody ramucirumab, with or without chemotherapy, has been evaluated in two phase III studies as second‐line treatment, and emerged as a new treatment option in this indication. Thus, despite this recent progress, chemotherapy remains the mainstay of treatment for the majority of people with advanced gastric cancer.
Description of the intervention
Systemic chemotherapy
5‐FU is not only the most important and extensively studied single agent in this disease, but it is part of most combination chemotherapy regimens as well. Its single‐agent response rate is about 20%. Differences in effect and toxicity profile are the reasons for its application as continuous infusion. Oral capecitabine (Cunningham 2008) or S‐1 (Ajani 2010) may replace infusional 5‐FU, thus avoiding the risk and inconvenience associated with portable pumps. Other single agents with relevant activities are cisplatin (Leichman 1991) and anthracyclines (Preusser 1988). Furthermore, oxaliplatin, docetaxel, and irinotecan have been evaluated in recent phase III studies (Al Batran 2008; Cunningham 2008; Dank 2008; Van Cutsem 2006).
How the intervention might work
5‐FU, an antimetabolite, pyrimidine‐antagonist and inhibitor of thymidilate‐synthethase is the backbone of chemotherapy in gastric cancer. Capecitabine is an oral fluoropyrimidine that is selectively activated in tumour tissue by a three‐step enzymatic conversion, S‐1 another oral fluoropyrimidine. Cisplatin is an alkylan, which acts through induction of intra‐ and inter‐strand crosslinks. The diamino‐cyclohexane platinum derivative oxaliplatin also leads to the formation of DNA crosslinks, but they are not recognised by the intracellular mismatch repair system. Docetaxel, as well as paclitaxel are agents which inhibit depolymerization of micro tubuli. Irinotecan is an inhibitor of topoisomerase I, thereby disrupting DNA replication and cell division. These drugs have major differences in their toxicity profile.
Why it is important to do this review
Combination chemotherapy has become an accepted standard for first‐line treatment. Although a large number of different regimens have been tested in randomised studies, uncertainty remains regarding the choice of the regimen.
Objectives
To evaluate the effect of chemotherapy in participants with advanced adenocarcinoma of the stomach and gastroesophageal junction.
Comparisons were as follows.
-
First‐line chemotherapy plus best supportive care (BSC) versus BSC alone.
-
First‐line combination versus single‐agent chemotherapy.
-
First‐line 5‐FU/cisplatin/anthracycline‐containing combinations versus 5‐FU/cisplatin combinations (without anthracyclines).
-
First‐line 5‐FU/cisplatin/anthracycline‐containing combinations versus 5‐FU/anthracycline combinations (without cisplatin).
-
First‐line chemotherapy with irinotecan versus non‐irinotecan‐containing regimens.
-
First‐line chemotherapy with docetaxel versus non‐docetaxel‐containing regimens.
-
First‐line chemotherapy with capecitabine versus 5‐FU‐containing regimens.
-
First‐line chemotherapy with oxaliplatin versus the same regimen containing cisplatin.
-
First‐line taxane‐platinum‐fluoropyrimidine combinations versus taxane‐platinum (without fluoropyrimidine).
-
First‐line S‐1 versus 5‐FU‐containing regimens.
Due to limited information, we considered second‐line therapy only in selected sensitivity analyses of first‐line therapy where data were available. In addition to comparisons 1 and 2, which were planned and described in the first version of the protocol, we performed two more comparisons (3 and 4) in the original version of the review (Wagner 2005). As there was a large number of categories of different combination chemotherapy regimens and the number of relevant studies in each category was not known when writing the protocol, it was impossible to plan in advance the best way to compare directly the different categories of combination chemotherapies. We chose to perform these additional comparisons based on their clinical relevance and the availability of a sufficient number of relevant studies.
In the first update of this review (Other published versions of this review, Wagner 2010), comparisons (5) to (8) (5: First‐line chemotherapy with irinotecan versus non‐irinotecan‐containing regimens, 6: First‐line chemotherapy with docetaxel versus non‐docetaxel‐containing regimens, 7: First‐line chemotherapy with capecitabine versus 5‐FU‐containing regimens, 8: First‐line chemotherapy with oxaliplatin versus the same regimen containing cisplatin were added. In this second update,comparisons (9) to (10) (9: First‐line taxane‐platinum‐fluoropyrimidine combinations versus taxane‐platinum (without fluoropyrimidine) and 10: First‐line S‐1 versus 5‐FU‐containing regimens) were added (see ‐ Differences between protocol and review).
Methods
Criteria for considering studies for this review
Types of studies
We included only randomised controlled studies, with or without blinding. We included abstracts or unpublished data if sufficient information on study design, characteristics of participants, interventions, and outcomes was available and if full information and final results were confirmed by the first author. We excluded cross‐over studies in order to assess the overall treatment effect on survival. We excluded quasi‐randomised studies, e.g. treatment allocation alternate or by date of birth, as we considered this study design to be not of sufficiently high quality.
Types of participants
We included participants with histologically confirmed, unresectable (as decided by a multidisciplinary team), recurrent or metastatic adenocarcinoma of the stomach or gastroesophageal junction without any prior chemotherapy or radiotherapy for comparisons 1 to 10. We also included studies which included participants with adenocarcinoma of the distal oesophagus. Most studies included participants with locally advanced, relapsed and/or metastatic tumours, with the greater number of participants already having metastatic disease. However, in some studies only participants with locally advanced cancer of the stomach were reported in order to assess secondary resectability. We did not consider these studies in this review. The proportion of participants with locally advanced versus metastatic tumours is given for each study.
Types of interventions
We included studies of systemic intravenous or oral, first‐line chemotherapy and/or best supportive care (BSC). Chemotherapy encompasses all cytotoxic or anti‐neoplastic drug treatment, but excluding hormonal, biological, or targeted therapies, which are the subject of a separate Cochrane review (Song 2016). However, studies on targeted therapies with clinical impact, as well as studies on second‐line chemotherapy are considered in the discussion.
We included single‐agent as well as combination chemotherapy studies in all doses and schedules, but did not consider combined radio‐chemotherapy.
Types of outcome measures
Primary outcomes
-
Overall survival on intention‐to‐treat analysis. Median, one‐, two‐ and three‐year as well as five‐year survival in participants with locally advanced, secondary resectable tumours.
Secondary outcomes
-
Tumour response.
-
Time to progression.
-
Secondary resectability in participants with locally advanced gastric cancer.
-
Toxicity, classified according to WHO or National Cancer Institute Common Toxicity Criteria (NCI‐CTC).
Quality of life is difficult to measure and was assessed with various instruments. Quality of life results of recent phase‐III studies are described in the results section and considered in the discussion if available.
Search methods for identification of studies
Electronic searches
We originally identified studies by searching the Cochrane Central Register of Controlled Trials (CENTRAL) (the Cochrane Library 2004, Issue 1), MEDLINE, and Embase up to February 2004 and reference lists of articles. We also contacted pharmaceutical companies as well as national and international experts. We updated searches in all databases in March 2009, January 2013, February 2014 and June 2016.
The Cochrane Highly Sensitive Search Strategy for identifying randomised studies in MEDLINE, sensitivity‐maximising version, Ovid format (Higgins 2008) was combined with the search terms in the Appendices to identify randomised controlled studies in MEDLINE. The MEDLINE search strategy was adapted for use in the other databases searched. The search strategies are documented in Appendix 1; Appendix 2 and Appendix 3. We did not confine our search to English language publications.
In addition, we searched the following databases of ongoing studies: http://www.controlled‐trials.com; http://www.clinicaltrials.nci.nih.gov; http://www.eortc.be; http://www.update‐software.com/National/nrr‐frame.html and http://www.CenterWatch.com.
Searching other resources
We handsearched reference lists from studies selected by electronic searching to identify further relevant studies. We also handsearched published abstracts from conference proceedings from the European Society for Medical Oncology from 1978 (published in the Annals of Oncology), the European Council of Clinical Oncology from 1981 (published in the European Journal of Cancer), as well as the American Society for Clinical Oncology from 1981. All searches were updated in June 2016.
Data collection and analysis
Selection of studies
Two independent review authors initially scanned the title, abstract section, and keywords of every record retrieved. We retrieved full‐text articles for further assessment if the information given suggested that the study included participants with histologically confirmed, inoperable adenocarcinoma of the stomach or gastroesophageal junction, used random allocation to the comparison groups and compared the following.
-
Best supportive care (BSC) versus chemotherapy plus BSC.
-
Combination versus single‐agent chemotherapy.
-
5‐FU/cisplatin/anthracycline‐containing combinations versus 5‐FU/cisplatin combinations (without anthracyclines).
-
5‐FU/cisplatin/anthracycline‐containing combinations versus 5‐FU/anthracycline combinations (without cisplatin).
-
Irinotecan versus non‐irinotecan‐containing regimens.
-
Docetaxel versus non‐docetaxel‐containing regimens.
-
Capecitabine versus 5‐FU‐containing regimens.
-
Oxaliplatin versus the same regimen including cisplatin.
-
Taxane‐platinum‐fluoropyrimidin combinations versus taxane‐platinum (without fluoropyrimidine).
-
S‐1 versus 5‐FU‐containing regimens.
If there was any doubt regarding these criteria from the information given in the title and abstract, we retrieved the full‐text article for clarification. If differences in opinion existed, they were resolved by discussion.
Data extraction and management
Two review authors independently extracted details of study population, interventions, and outcomes. We resolved differences in data extraction by consensus with a third review author, referring back to the original article. If data were missing in a published report, we contacted the primary author.
Data extraction included the following items.
-
General information: title, authors, source, contact address, country, published/unpublished, language and year of publication, sponsoring of study.
-
Study characteristics, including design, duration/follow up, and quality assessment criteria as specified above.
-
Participants: inclusion and exclusion criteria, sample size, baseline characteristics, similarity of groups at baseline, withdrawals, and losses to follow‐up.
-
Interventions: dose, route, timing of chemotherapy, and comparison intervention.
-
Outcomes: hazard ratios and their 95% confidence intervals or standard error, log rank Chi², log rank P values, number of events, number of participants per group, median, one‐, two‐ and three‐year survival rates and five‐year survival rates in participants with locally advanced, secondary resectable tumours.
Assessment of risk of bias in included studies
In this updated version of the review, we independently assessed the risk of bias of the included studies using the 'Risk of bias' assessment tool described in Chapter 8 of theCochrane Handbook for Systematic Reviews of Interventions (Higgins 2011). We compared the evaluations, and discussed and resolved any inconsistencies between the review authors' decisions.
We rated the following domains separately for each of the included studies as 'low risk of bias', 'high risk of bias', and 'unclear' when the risk of bias was uncertain or unknown:
-
generation of allocation sequence ('sequence generation');
-
concealment of allocation ('allocation concealment');
-
prevention of knowledge of the allocated interventions during the study ('blinding');
-
methods used to address incomplete outcome data;
-
selective outcome reporting;
-
other sources of bias that could put a study at high risk of bias, including whether a calculation of sample size was carried out including baseline comparability. We considered tumour stage (advanced versus metastatic disease) and activity index (Eastern Cooperative Oncology Group status 0 to 1 versus 2 to 3), as well as the number of organs involved in metastatic disease (one versus more than one) as the most important prognostic factors. We considered a difference of more than 15% between study arms as an important difference. For age, as a further important factor, we considered baseline differences of five years as important. We also assessed intention‐to‐treat (ITT) analysis. We considered ITT analysis as randomised analysis, with the analysis restricted to participants who received at least one cycle of chemotherapy, and for which survival data were available. Alternatively, we also considered studies including all participants as randomised in the analysis as ITT. In addition, we analysed the risk of bias and described this in the 'Risk of bias' tables.
These assessments are reported in the 'Risk of bias' table for each individual study in the 'Characteristics of included studies' section of the review, and in the 'Risk of bias in included studies' section of this review.
Measures of treatment effect
Data analysis
We estimated hazard ratios (HR) and 95% confidence intervals (CI) as relevant effect measures directly or indirectly from the given data (Altman 2001). For each individual study, we extracted HRs and their variances. If the figures were not given directly, methods of indirect determination were used. HRs can be estimated (under some assumptions) from log rank Chi², from log rank P values, from observed to expected event ratios and from ratios of median survival times or time point survival rates (Machin 1997; Parmar 1998; Tierney 2007). In several instances, medians and/or number of events had to be read from the graphs. If both medians and survival rates at fixed time points were given, the medians were preferred. If we had to pool several arms of a study, we approximated the common median by the weighted mean of the medians given for the various arms.
For instance, statistical measures were taken to avoid double‐counting the irinotecan‐treated population in Bouche 2004, which was a three‐arm study which compared 5‐fluorouracil versus 5‐fluorouracil plus cisplatin versus 5‐fluorouracil plus irinotecan. For Comparison 5, we estimated the hazard ratios for the irinotecan‐containing arm (N = 45) versus the non‐irinotecan‐containing arms (N = 89), which was not provided in the original report by Bouche 2004.
Unit of analysis issues
Participants were individually randomised into two or more treatment groups. The effect of the intervention was measured and analysed on the basis of single measurements for each outcome for each participant. For studies with more than one intervention arm, we combined groups to create a single pair‐wise comparison as follows: the single‐agent therapy arm with the pooled results of both combination chemotherapy arms; the combination‐therapy arm was compared with the pooled results of both single agent arms; or the pooled results of the sequential therapy arms were compared with the pooled results of the concurrent therapy arms.
Dealing with missing data
We attempted to contact investigators to obtain missing data.
Assessment of heterogeneity
We assessed the heterogeneity in each pair‐wise comparison by assessing the Higgins I² (Higgins 2003), the Chi² test with significance set at a P value less than 0.1, and by visual inspection.
Data synthesis
We used the fixed‐effect model for meta‐analysis, with overall survival as the primary outcome measure. Where heterogeneity levels were high (I² > 20% or P value < 0.1), we used a random‐effects model (see Differences between protocol and review). We used Review Manager software for data synthesis (RevMan). . Previously SAS was used for more sophisticated analysis. We recalculated (or at least approximated) all outcomes concerning overall survival by using hazard ratios.
Quality of Evidence (GRADE) and 'Summary of findings' tables
We used the GRADEprofiler (GRADEpro) software to assist with the preparation of the 'Summary of findings' tables. The 'Summary of findings' tables provide key information about the pooled estimate of the magnitude of the effect in relative terms, assumed and control risks, numbers of participants and studies addressing each important outcome, and the quality of evidence for the comparisons for each outcome.
We included the following outcomes in the 'Summary of findings' tables.
-
Overall survival
-
Tumour response
-
Progression‐free survival; and/or time‐to‐progression; and/or time‐to‐treatment failure
-
Treatment‐related death
-
Treatment discontinuation due to toxicity
We assessed the quality of evidence as 'High', 'Moderate', 'Low' or 'Very Low' using the Grades of Recommendation, Assessment, Development and Evaluation (GRADE) methodology, which evaluates the totality of included studies for their risk of bias (study limitations), consistency, imprecision, indirectness, and publication bias.
Subgroup analysis and investigation of heterogeneity
In seeking statistical heterogeneity between studies, we performed Cochrane's Q‐test (with a significance threshold of alpha = 0.1). Additionally, we calculated heterogeneity quantitatively (Thompson 2002). We considered the following factors as possible sources of heterogeneity:
-
differences in prognostic factors;
-
quality of studies;
-
second‐line therapy permitted versus no second‐line therapy;
-
Asian versus non‐Asian studies;
-
substitutive, additive, and other comparisons in comparisons 5 and 6.
Sensitivity analysis
We conducted a sensitivity analysis by repeating the primary analysis and investigated the influence of risk of bias, adequate allocation concealment, excluding those studies which were conducted in Asia and studies with second‐line therapies.
Results
Description of studies
Results of the search
We identified a total of 2925 records through electronic searches of CENTRAL, MEDLINE, Embase and databases of clinical trials. After removing duplicates, 2597 records remained. We excluded 2495 references which were clearly irrelevant through screening titles and reading abstracts. We retrieved 102 references for further assessment. We excluded 195 studies and are listed in the table Characteristics of excluded studies. Twenty‐six new studies were identified for inclusion. Please see Figure 1 for the flowchart of the systematic search performed in June 2016.

Study flow diagram: review update
Included studies
Three eligible studies with 184 participants were identified for analysis of comparison 1: chemotherapy versus best supportive care (BSC). The study by Scheithauer 1996 was published as an abstract only, but all relevant information was provided by the author. For more details of the included studies, please see Characteristics of included studies.
Approximately 50% of the study investigators provided further information. Data about survival and response rates were given in most publications. Information about second‐line therapy was either reported in the text or provided by the authors only in a limited number of studies.
Twenty‐three studies, which included 4447 participants, were included in the analysis of comparison 2, which is combination versus single‐agent chemotherapy. In studies that included more than one single or combination chemotherapy arm, different arms were combined in the analysis as specified below. Comparisons 3 and4 included 579 and 1147 participants in four and seven studies. Comparison 5 included 10 studies with a total of 2135 participants and comparison 6 includes at present overall survival data from eight studies including a total of 2001 participants. Comparisons 7 and 8 included 732 and 1105 participants from two and five studies, respectively. Two new comparisons (9) and (10) with 482 and 1793 participants from three and four randomised studies, respectively were added in the current update.
It should be noted that some studies may appear in more than one comparison if they meet relevant criteria for inclusion. For instance, Hironaka 2016; Koizumi 2014; Komatsu 2011; Narahara 2011; Ochenduszko 2015 were included in two comparisons; while Boku 2009 was included in three comparisons.
Participants
The median age of the participants in the population of studies included in the analysis of comparisons 1 and 2 was in the range of 56 to 67 years. The proportion of participants with metastatic disease was between 62% (Cullinan 1985) and 100% (Bouche 2004; Koizumi 2008; Yamamura 1998). When comparing the different arms of one study, a difference in the proportion of participants with advanced versus metastatic disease greater than 15% between study arms was identified in only one study (Popov 2002), with a larger number of metastatic participants in the combination chemotherapy arm (90% versus 73%). Performance status was well‐balanced in all studies with no differences greater than 15% between study arms. The percentage of participants with ECOG 2+3 was in the range of 0% to 48%. Thirteen studies, which included 3182 participants (Boku 2009; Hironaka 2016; Koizumi 2008; Koizumi 2014; Komatsu 2011; Lu 2014; Narahara 2011; Nishikawa 2012; Ohtsu 2003; Shirao 2013; Wang 2013; Wu 2015; Yamamura 1998), were conducted in Asia.
Regarding comparisons 3 and4, the median age of participants included in these 11 studies was between 58 and 65 years. Between 46% (Kikuchi 1990) and 90% (Cascinu 2011; Kim 2001) of participants had metastatic disease, the percentage of participants with ECOG 2+3 was between 6% (Cascinu 2011) and 88% (Kikuchi 1990). The percentage of participants with advanced versus metastatic disease was well‐balanced in all studies included in these two comparisons.
The participants in comparison 5 had a median age between 58 (Dank 2008) and 70 (Komatsu 2011) years in the different study arms, with the majority of participants having metastatic disease.
The median age of the participants in comparison 6 was between 55 (Roth 2007; Van Cutsem 2006) and 70 years (Al‐Batran 2013). The percentage of participants with metastatic disease was between 69% (Al‐Batran 2013; Ochenduszko 2015) and 98% (Thuss‐Patience 2005), with the largest study having 97% of participants with metastatic disease and a median age of 55 years (Van Cutsem 2006). Most participants in these studies had a performance status of 0 or 1.
Regarding comparisons 7 and8, the median age of participants included in these studies was between 55 (Ocvirk 2012) and 65 years (Yamada 2015). Between 62% (Kim 2014) and 100% (Li 2016) had metastatic disease and most participants had a performance status of 0 or 1. Only in Popov 2008 the percentage of participants with ECOG 2‐3 was 29%.
The median age of the participants included in comparisons 9 and 10 was between 54 (Ajani 2005; Huang 2013; Li 2015) and 76 years (Boku 2009), between 86% (Roth 2007) and 95% to 100% of participants (Ajani 2005; Ajani 2010; Chen 2015) had metastatic disease. Most participants in these studies had a performance status of 0 or 1.
Groups of participants were well‐balanced regarding the most important prognostic factors as specified above in all studies included into comparisons 3 to 8.
Interventions
Participants were individually randomised into two or more treatment groups. The effect of the intervention was measured and analysed on the basis of single measurements for each outcome for each participant. In 11 studies, more than two groups with different interventions were compared (Boku 2009; Bouche 2004; Cullinan 1985; Cullinan 1994; Hironaka 2016; Loehrer 1994; Lutz 2007; Nishikawa 2012; Ohtsu 2003; Roth 2007).
In the studies by Bouche 2004, Lutz 2007, Ohtsu 2003, and Hironaka 2016 the single‐agent therapy arm was compared with the pooled results of both combination chemotherapy arms. In Loehrer 1994, Cullinan 1994, and Boku 2009 , the combination‐therapy arm was compared with the pooled results of both single‐agent arms. In Nishikawa 2012, the pooled results of the sequential therapy arms were compared with the pooled results of the concurrent therapy arms. All these studies were included in the comparison of single‐agent versus combination chemotherapy.
Furthermore, the irinotecan‐containing combination chemotherapy was compared to the pooled results of the non‐irinotecan‐containing combination chemotherapies and included in comparison 5 in 10 studies (Boku 2009; Bouche 2004; Dank 2008; Komatsu 2011; Li 2016; Moehler 2005; Moehler 2010; Narahara 2011; Roy 2012; Sugimoto 2014), and the pooled results of the docetaxel‐containing chemotherapies were compared with the non‐docetaxel‐containing combination chemotherapy and included in comparison 6 in eight studies (Al‐Batran 2013; Koizumi 2014; Ochenduszko 2015; Ridwelski 2008; Roth 2007; Thuss‐Patience 2005; Van Cutsem 2006; Wang 2016).
All three studies included in the analysis of comparison 1 used combination therapy regimens in the chemotherapy arm (Murad 1993: FAMTX; Pyrhönen 1995: FEMTX; Scheithauer 1996: 5‐FU/LV/Epirubicin).
Regarding comparison 2, most studies used 5‐FU in the single‐agent arm. In six of 17 studies (Barone 1998; Colucci 1995; Cullinan 1985; Cullinan 1994; De Lisi 1986; Loehrer 1994), 5‐FU was given as a bolus in doses of approximately 500 mg/m² days one to five every four weeks. A continuous infusion regimen was used in two studies, with either 2600 mg/m² every two weeks (Popov 2002), 800 mg/m² per day (Ohtsu 2003) on days one to three every four weeks or a bolus of 400 mg/m² 5‐FU, followed by 600 mg/m² as a two‐hour continuous infusion on days one and two every two weeks (Bouche 2004). One study (Levi 1986), applied doxorubicin 60 mg/m² every four weeks in the single‐agent arm. In the study by Loehrer 1994, the results from two single‐agent arms (5‐FU bolus 500 mg/m² days one to five and epirubicin 90 mg/m² day one every four weeks) were combined in the analysis. In addition, in the studies by Bouche 2004, Lutz 2007, Nishikawa 2012, and Ohtsu 2003 , the results of two combination therapy arms (LV5FU2/cisplatin and LV5FU2/irinotecan, D‐FU/FA and HD‐FU/FA/cisplatin, 5‐FU/paclitaxel and S‐1/paclitaxel, 5‐FU/cisplatin, and tegafur/mitomycin C) were combined in the analysis. Nishikawa 2012 used 5‐FU in doses of 800 mg/m² in days one to five every four weeks in one group or daily S‐1 in doses of 80 mg/m² for four weeks and a two‐week rest in the single‐agent arm until progression. This therapy was followed by paclitaxel (80 mg/m² on days one, eight and 15 every four weeks). A similar regimen of S‐1 was used in Narahara 2011 and Komatsu 2011. Boku 2009 used the same 5‐FU regimen in one arm or lower doses of S‐1 (40 mg/m² for four weeks and a two‐week rest) in the single‐agent arm. Results of two arms were combined in the single‐agent arm in Boku 2009; Cullinan 1994 and Nishikawa 2012. Wang 2013 used S‐1 according to body‐surface area with 40 mg twice daily for participants with a body surface area greater than 1.25 and lower than 1.5 for two out of four weeks. Koizumi 2008 and Hironaka 2016 as well used the oral prodrug S‐1.
In six of 23 studies, combination chemotherapy arms did contain an anthracycline (epirubicin 60 mg/m² every three weeks or 90 mg/m² every four weeks or doxorubicin 40 mg/m² every four to seven weeks) in addition to 5‐FU. Non 5‐FU‐based combination chemotherapy regimens, which instead included etoposide, irinotecan and cisplatin, S‐1 and irinotecan, S‐1 and paclitaxel or an anthracycline and cisplatin were applied in six studies (Barone 1998; Boku 2009; Komatsu 2011; Narahara 2011; Popov 2002; Wang 2013).
In comparisons 3 and4, regimens containing 5‐FU, an anthracycline and cisplatin were mainly FAP (5‐FU bolus 300 mg/m² either days one, eight, 15, 22 or days one to five, adriamycin 25 to 40 mg/m² and cisplatin 60 to 100 mg/m² once every three to five weeks) (Cullinan 1994; GITSG 1988; Kikuchi 1990), and PELF (cisplatin 40 mg/m² days one and five, epirubicin 30 mg/m² days one and five, leucovorin 200 mg/m² and 5‐FU bolus 300 mg/m² days one to four every eight weeks) (Cocconi 1994) in studies published before 1995 (Kim 2001; Ross 2002; Webb 1997). used mostly ECF (epirubicin 50 mg/m² and cisplatin 60 mg/m² once every three weeks, with 5‐FU as a continuous intravenous infusion of 200 mg/m² for up to six months) or LdCF (pegylated liposomal doxorubicin 20 mg/m² and cisplatin 50 mg/m² once every two weeks, with 5‐FU 400 mg/m² bolus followed by 600 mg/m² as 22‐hour continuous infusion on days one and two every two weeks) in Cascinu 2011.
In comparison 5, irinotecan was given in the following studies to substitute either cisplatin (Bouche 2004; Dank 2008; Moehler 2010), etoposide (Moehler 2005) or 5‐FU (Roy 2012) or paclitaxel (Sugimoto 2014). In contrast, irinotecan was given in addition to the treatment in the other arm in studies by Bouche 2004; Komatsu 2011; and Narahara 2011; or as other comparisons (Li 2016). Irinotecan was given weekly at 80 mg/m² for six weeks every 50 days in combination with infusional 5‐FU 2000 mg/m² and FA 500 mg/m² (Dank 2008; Moehler 2005). Moehler 2010 used irinotecan 250 mg/m² on day one in combination with capecitabine 1000 mg/m² orally days one to 14 every 22 days and Roy 2012 used irinotecan 250 mg/m² on day one in combination with docetaxel 60 mg/m² as infusion on day one every 22 days. Bouche 2004 used irinotecan at 180 mg/m² in combination with infusional 5‐FU every two weeks. Komatsu 2011 and Narahara 2011 used doses of 75 mg/m² and 80 mg/m² on days one and 15 every four weeks or six weeks in combination with oral S‐1 (initial doses of 40 mg/m² to 60 mg/m² twice daily on days one to 14 every four weeks or 80 mg/m²/day on days one to 21 every six weeks). In subsequent cycles, doses were varied according to the most severe adverse events during the preceding cycle.
In comparison 6, docetaxel was given to substitute either epirubicin and cisplatin (Roth 2007; Thuss‐Patience 2005) or 5‐FU and leucovorin (Ridwelski 2008). On the other hand, it was given in addition to the treatment in the other study arm in the studies by Wang 2016, Koizumi 2014, Van Cutsem 2006 and Al‐Batran 2013. The largest studies included in comparison 6's meta‐analysis of overall survival used the three‐drug regimen DCF (docetaxel 75 mg/m² intravenously day one, cisplatin 75 mg/m² intravenously day one, 5‐FU 750 mg/m² as a 24‐hour infusion) on days one to five every three weeks (Van Cutsem 2006), and the two‐drug regimen of docetaxel 75 mg/m² intravenously day one, in combination with cisplatin 75 mg/m² intravenously on day one every three weeks (Ridwelski 2008). In Koizumi 2014, docetaxel (40mg/m² intravenously on day one) was given with S‐1 (tailored to body surface area; days one to 14) every 21 days. In Roth 2007, the DCF regimen was used as described previously. Sadighi 2006 and colleagues used a modification of DCF with reduced doses of docetaxel and cisplatin (both at 60 mg/m²) every three weeks. Thuss‐Patience 2005 applied docetaxel 75 mg/mg/m² intravenously on day one in combination with 5‐FU 200 mg/m² /day over 24 hours on days one to 21 every three weeks. Al‐Batran 2013 used docetaxel 50 mg/m² intravenously on day one in combination with oxaliplatin 85 mg/m² and leucovorin 200 mg/m² followed by 5‐FU 2600 mg/m² as a 24‐hour continuous infusion.
Five studies (Kang 2009; Li 2016; Ocvirk 2012; Ochenduszko 2015; Van Cutsem 2015) are eligible for comparison 7. In Kang 2009 and Ocvirk 2012, the oral 5‐FU prodrug capecitabine (1000 mg/m² or 825 mg/m² twice daily on days one to 14 of a 21‐day regimen) was compared with 5‐FU (both in combination with cisplatin). In comparison 8, oxaliplatin was given once at 85 mg/m² in two weeks and compared with cisplatin 50 mg/m² in Al Batran 2008 and Popov 2008. Both agents were combined with FU/ leucovorin in Al Batran 2008 and Popov 2008. In Kim 2014 a combination of weekly docetaxel (35mg/m²) on days one and eight every three weeks, in combination with either cisplatin (60 mg/m²) or oxaliplatin (120 mg/m²) on day one was administered. In Yamada 2015, S‐1 (twice daily for the first three weeks of a five‐week cycle) plus (cisplatin 60 mg/m² on day eight) was compared against S‐1 (twice daily for first two weeks of a three‐week cycle) plus oxaliplatin (100 mg/m² infused for two hours on day one). For comparison 9, three studies (Ajani 2005; Roth 2007; Van Cutsem 2015) are available. Fluorouracil 200 mg/m²/day was given as a 24‐hour continuous infusion in or in doses of 750 mg/m²/day on days one to five every three weeks in Roth 2007. It was combined with docetaxel and cisplatin in Ajani 2005 and Roth 2007, and docetaxel and oxaliplatin in Van Cutsem 2015.
In comparison 10, S‐1 50 mg/m² was given orally in two daily doses on days one to 21 of a four‐week cycle (Ajani 2010), or in a lower dosage of 40 mg/m² orally in two daily doses on days one to 28 of a six‐week cycle (Boku 2009) and compared with continuous infusions of 5‐FU in doses of 1000 mg/m²/24 hours as 120‐hour infusion (Ajani 2010) or 800 mg/m²/day on days one to five, respectively. Of note, S‐1 was combined with 75 mg/m² of cisplatin every three weeks, and 5‐FU with 100 mg/m² of cisplatin every three weeks in the study by Ajani 2010. Huang 2013 compared the combination of weekly paclitaxel (60 mg/m²) on days one eight, and 15 every four‐week cycle and S‐1 (80 mg/m² to 120 mg/m²), dependent on the body‐surface area for two out of four weeks, with the same regimen of paclitaxel, but with 5‐FU (500 mg/m², in combination with leucovorin 20 mg/m² on days one to five every four weeks).
Outcomes
Median survival and response rates were the outcomes most commonly described in the included studies. The newer studies reported progression‐free survival instead of time to progression. Toxicity was not always classified according to WHO or NCI‐CTC and was reported in different ways (per number of participants, per number of cycles and only the worst toxicity per participant). A comparison across studies was therefore not possible. For this reason, the numbers of participants who discontinued treatment due to toxicity as well as the numbers of treatment‐related deaths were analysed. Information about second‐line therapies and secondary resectability was unavailable for most studies. Details are listed in the Characteristics of included studies table.
Excluded studies
Please see Characteristics of excluded studies. Reasons for exclusion of references in the updated search are specified in Figure 1 according to the recommendations of the PRISMA statement (Moher 2009).
According to the protocol, we excluded studies in which cross‐over after failure was encouraged or planned. Information about second‐line therapy was generally unavailable in most first‐line studies. However, in some large recent studies full information about second‐line therapy was provided after contacting the first author and a limited number of participants did in fact cross over in the second‐line therapy. After discussion and balancing the loss of information when excluding these studies against the possible bias caused by a limited number of participants crossing over, we decided to include studies in which the number of participants who crossed over between study arms was less than 10% of the whole study population. Exclusion of these studies would have provoked a bias in favour of studies where less information was available.Two studies which have repeatedly been quoted in the literature are especially mentioned: Glimelius 1994 was excluded because of cross‐over, as the research ethics committee had requested that chemotherapy had to be provided to participants upon request in the BSC group, and 12 of 30 participants in the BSC group finally received chemotherapy. Kim 1993 was excluded since the allocation of participants was done by alternate allocation (information provided by author YSP). Several studies currently published as abstracts only were not included at this stage, because full information and final results were currently unavailable or were not provided after contacting the author or sponsor. They are classified as 'Studies awaiting classification'. We excluded studies using oral 5‐FU because of its varying bioavailability and unreliable effect. The landmark 'REAL‐2' study (Cunningham 2008), which evaluated the non‐inferiority of oxaliplatin as compared to cisplatin and of capecitabine as compared to 5‐FU, was not included in this meta‐analysis after discussion because it included participants with squamous cell cancer of the oesophagus (more than 10%), which were not eligible according to the inclusion criteria for this meta‐analysis. We sought separate data on participants with adenocarcinoma only, but they were not provided by the study investigator. The study by Sadighi 2006 could not be included in the meta‐analysis of overall survival because published data for calculation of the hazard ratio is not sufficient at present, but data on the other outcomes were included. The study by Park 2006 was not included in the comparison of docetaxel versus non‐docetaxel‐containing regimens because both study arms included a taxane. Thus, the analyses are essentially a comparison of docetaxel and paclitaxel. If further studies relevant for this comparison are published in the future, a separate comparison of paclitaxel versus docetaxel‐containing regimens will be included in the meta‐analysis.The studies Gubanski 2010 and Guimbaud 2014 were excluded because of systematic cross‐over between study arms.
Risk of bias in included studies
We summarised the overall risk of bias in Figure 2 and Figure 3.
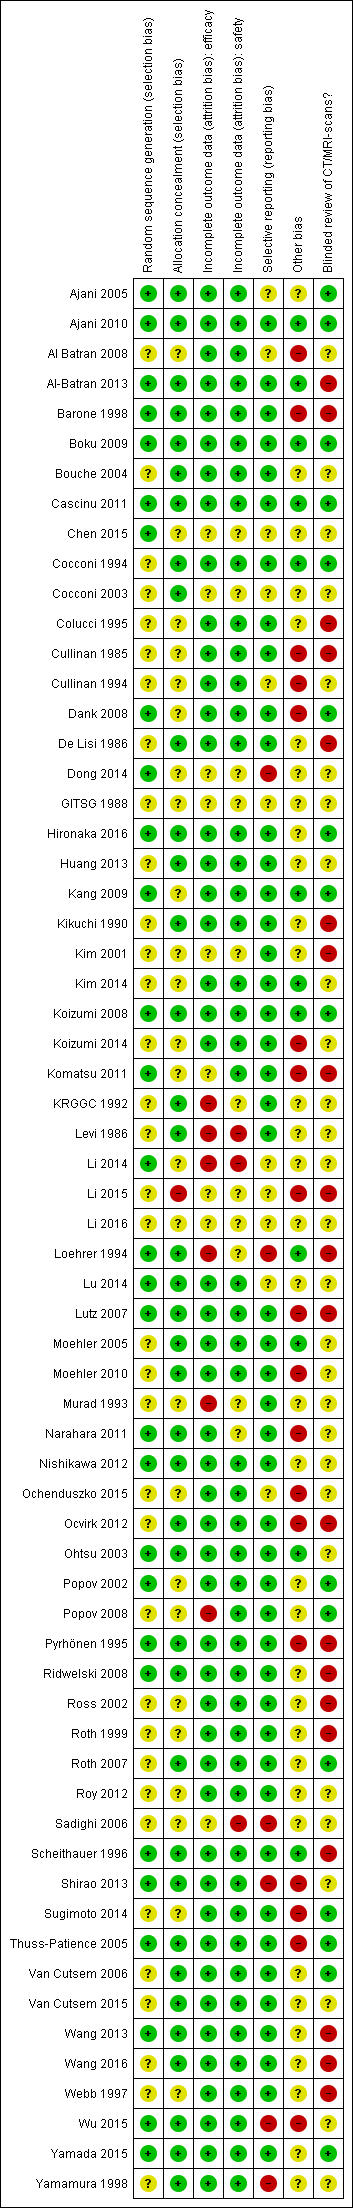
'Risk of bias' summary: review authors' judgements about each risk of bias item for each included study.
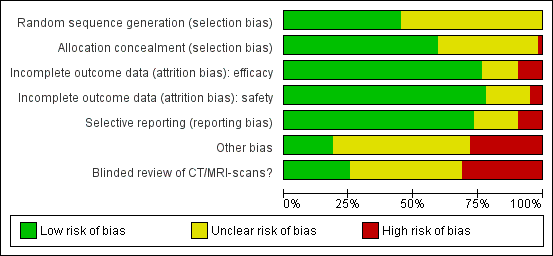
'Risk of bias' graph: review authors' judgements about each risk of bias item presented as percentages across all included studies.
Allocation
The risk of selection bias due to issues with random sequence generation was not stated in most instances (n = 35/64, 55%), while the remaining studies which described the allocation sequence generation approach used acceptable, unbiased methods (n = 29/64, 45%).
Blinding
Potential bias arising from allocation concealment was low in 38 studies (59%), unclear in 25 studies (39%), and high in one study (2%).
Incomplete outcome data
The risk of bias due to incomplete efficacy data was low in 49 studies (77%), unclear in nine9 studies (14%), and high in six studies (9%). On the other hand, incomplete safety concern was a low concern in 50 studies (78%), unclear in 11 studies (17%), and high in three studies (5%).
Selective reporting
The potential for selective reporting was deemed to be low in 47 studies (73%), unclear in 11 studies (17%), and high in six studies (9%).
Other potential sources of bias
The risk of bias due to lack of blinded or independent radiological review was a low concern in 16 studies (25%), unclear in 28 studies (44%), and high in 20 studies (31%). The potential for bias due to other causes was assessed to be low in 12 studies (19%), unclear in 34 studies (53%), and high in 18 studies (28%).
Effects of interventions
See: Summary of findings for the main comparison Chemotherapy versus best supportive care for advanced gastric cancer; Summary of findings 2 Combination versus single‐agent chemotherapy for advanced gastric cancer; Summary of findings 3 5‐FU/cisplatin/anthracycline combinations versus 5‐FU/cisplatin combinations (without anthracyclines) for advanced gastric cancer; Summary of findings 4 5‐FU/cisplatin/anthracycline combinations versus 5‐FU/anthracycline combinations (without cisplatin) for advanced gastric cancer; Summary of findings 5 Irinotecan versus non‐irinotecan‐containing regimens for advanced gastric cancer; Summary of findings 6 Docetaxel versus non‐docetaxel‐containing regimens for advanced gastric cancer; Summary of findings 7 Capecitabine versus 5‐FU‐containing regimens for advanced gastric cancer; Summary of findings 8 Oxaliplatin versus the same regimen including cisplatin for advanced gastric cancer; Summary of findings 9 Taxane‐platinum‐fluoropyrimidine combinations versus taxane‐platinum (without fluoropyrimidine) for advanced gastric cancer; Summary of findings 10 S‐1 versus 5‐FU‐containing regimens for advanced gastric cancer
(1) Chemotherapy versus best supportive care
Overall survival
A total of three studies (N = 184) reported overall survival (Murad 1993; Pyrhönen 1995; Scheithauer 1996). The overall hazard ratio (HR) of 0.37 (95% confidence interval (CI) 0.24 to 0.55, moderate‐quality evidence) (Analysis 1.1) in favour of the chemotherapy arms demonstrates a convincing benefit over best supportive care (BSC) alone, which can be interpreted as an improvement in median survival from 4.3 months (weighted average in BSC) to 11 months (with chemotherapy). Cochrane's Q test (P = 0.19) as well as the index of homogeneity according to Thompson (I² = 39.7) demonstrate a significant statistical heterogeneity among the results of these studies, based on the differences in the chemotherapy regimens studied. A sensitivity analysis including only studies with adequate allocation concealment (Pyrhönen 1995; Scheithauer 1996), does not change the overall HR of 0.37 (95% CI 0.19 to 0.70).
Secondary outcomes
Tumour response
Data were available for 88 participants in the chemotherapy arms of the three eligible studies. Response rates were between 33% (Pyrhönen 1995) and 50% (Murad 1993).
Time to progression
In the chemotherapy and BSC arms time to progression was 7.8 versus 2.7 (P = 0.0001) and 6.5 versus 2.0 (P = 0.0001) months in the studies by Murad 1993 and Scheithauer 1996 (N = 144). The overall HR was 0.31 (95% CI 0.22 to 0.43, moderate‐quality evidence) (Analysis 1.2).
Secondary resectability
Information about secondary resectable participants was not given in the text or provided by the authors in any of the three studies.
Toxicity
In the study by Murad 1993, WHO grade III/IV toxicities occurred in 22 of 128 cycles in 30 participants treated with chemotherapy, with one toxic death. Pyrhönen 1995 described WHO gastrointestinal grade III/IV toxicities in 13 of 20 participants. Haematological toxicities occurred in the same frequency. Scheithauer 1996 observed haematological grade III/IV toxicities in 12%, gastrointestinal grade III/IV toxicities in 21%, and other grade III/IV toxicities in 32.7% of 226 available cycles.
Quality of life
Quality of life was not analysed in any of the three included studies. Pyrhönen 1995 assessed the palliative measures and observed an increased use of analgesics in the control versus treated participants after two months.
(2) Combination versus single‐agent therapy
Overall survival
Twenty‐three studies including 4447 participants were summarised in this meta‐analysis (Barone 1998; Boku 2009; Bouche 2004; Colucci 1995; Cullinan 1985; Cullinan 1994; De Lisi 1986; Hironaka 2016; Koizumi 2008; Koizumi 2014; Komatsu 2011; Levi 1986; Loehrer 1994; Lu 2014; Lutz 2007; Narahara 2011; Nishikawa 2012; Ohtsu 2003; Popov 2002; Shirao 2013; Wang 2013; Wu 2015; Yamamura 1998). The overall HR in favour of combination chemotherapy (HR 0.84, 95% CI 0.79 to 0.89, moderate quality) provides evidence for a statistically significant, but modest survival benefit of combination versus single‐agent chemotherapy in the studied regimens (Analysis 2.1). Cochrane's Q test for heterogeneity showed non‐significant heterogeneity (I² = 0%, P = 0.48), indicating that results of the different studies were consistent in their findings. As the chemotherapy regimens in studies published before 2000 might not have the same efficacy as modern regimens, the median survival difference between single and combination chemotherapy was calculated separately for studies published before the year 2000 and thereafter. For studies published before 2000, the weighted median survival was approximately 7.3 with combination therapy and 6.4 months with single‐agent therapy. In studies published after 2000 (Boku 2009; Bouche 2004; Hironaka 2016; Koizumi 2008; Koizumi 2014; Komatsu 2011; Lu 2014; Lutz 2007; Narahara 2011; Nishikawa 2012; Ohtsu 2003; Popov 2002; Wang 2013, Wu 2015), median survival was 11.6 months with combination therapy, as compared to 10.5 months with single‐agent therapy.
To evaluate the influence of second‐line therapy, which was previously specified as a possible cause of heterogeneity, a second analysis was performed excluding the studies by Boku 2009, Koizumi 2008, Koizumi 2014, Narahara 2011, Ohtsu 2003, and Wang 2013 in which more than 50% of participants received a second‐line therapy. Exclusion of theses studies had no influence on heterogeneity (I² = 0% and P = 0.56) and the overall HR of 0.82 (95% CI 0.75 to 0.90) in favour of combination chemotherapy. Sensitivity analysis excluding those studies which were conducted in Asia (Boku 2009; Hironaka 2016; Koizumi 2008; Koizumi 2014 ; Komatsu 2011; Lu 2014; Narahara 2011; Nishikawa 2012; Ohtsu 2003; Shirao 2013; Wang 2013; Wu 2015; Yamamura 1998) resulted in a HR of 0.77 (95% CI 0.68 to 0.87) (I² = 0%, P = 0.57), with no appreciable change in heterogeneity as compared to the original analysis. When only those studies with adequate allocation concealment were included in the analysis (Barone 1998; Boku 2009; Bouche 2004; De Lisi 1986; Koizumi 2008; Levi 1986; Loehrer 1994; Lu 2014; Lutz 2007; Narahara 2011; Nishikawa 2012; Ohtsu 2003; Shirao 2013; Wang 2013; Wu 2015; Yamamura 1998), the resulting overall HR was 0.83 (95% CI 0.77 to 0.89) (I² = 24% and P = 0.19). For these reasons, the results of this comparison can be considered to be highly robust.
Secondary outcome measures
Tumour response
Data were available from 2833 participants in 18 eligible studies. The pooled objective response rate was 39% in the combination therapy arms versus 23% of the single‐agent arms. The corresponding odds ratio (OR 2.30, 95% CI 1.94 to 2.72, high‐quality evidence) confirms a statistically significant advantage in tumour response in favour of combination therapy (Analysis 2.2). Very low heterogeneity was observed across studies (I² = 0%, P = 0.60).
Time to progression
Data from four studies with 720 participants were available. The overall HR for time to progression for combination versus single‐agent chemotherapy was 0.69 (95% CI 0.55 to 0.87, moderate‐quality evidence) (Analysis 2.3). Results across studies were consistent, with moderate heterogeneity (I² = 23%, P = 0.27). Other studies (Boku 2009; Bouche 2004; Hironaka 2016; Koizumi 2014; Lutz 2007; Lu 2014; Wu 2015) reported progression‐free survival instead of time to progression or time‐to treatment failure (Komatsu 2011; Narahara 2011; Nishikawa 2012).
Secondary resectability
Only one study (Colucci 1995) reported on a single participant who became secondary resectable and was operated on with a pathologic complete remission.
Toxicity
Because of the different ways of reporting (per number of participants, per number of cycles or only the maximum toxicity per participant), grade I to IV toxicities can be compared only within, but not between studies. Overall, treatment‐associated toxicities were higher in the combination chemotherapy arms, but this was usually not statistically significant. In contrast, the rate of treatment‐associated deaths may be summarised across studies. Eighteen of 23 studies (N = 3876) in this comparison reported treatment‐related deaths (Analysis 2.4). The overall rate of toxic deaths in these studies was 1.1% versus 0.5% for combination versus single‐agent therapy (OR 1.64, 95% CI 0.83 to 3.24). Six studies observed no treatment‐related deaths (Hironaka 2016; Koizumi 2008; Komatsu 2011; Lu 2014; Wang 2013; Wu 2015).
Quality of life
This was assessed in only one of these studies (Bouche 2004). All participants in the single‐agent and both combination chemotherapy arms had a significant improvement in quality of life compared with pretreatment scores.
(3) 5‐FU/cisplatin/anthracycline combinations versus 5‐FU/cisplatin combinations (without anthracyclines)
Overall survival
This meta‐analysis was based on 579 participants in four randomised studies (Cascinu 2011; Kim 2001; KRGGC 1992; Ross 2002). The data from the largest study in this comparison (published by Ross 2002) which was included in this analysis were provided by the authors and include people with gastric and GE‐junction adenocarcinoma only (the original publication included people with squamous cell carcinoma of the oesophagus as well). The resulting HR for overall survival of 0.74 (95% CI 0.61 to 0.89, moderate‐quality evidence) demonstrates a statistically significant benefit with very low heterogeneity (I² = 0%, P = 0.63) in overall survival in favour of the three‐drug combination, with a weighted average survival of 9.9 and 8.6 months, respectively. Allocation concealment was adequate in all three studies included in this comparison and heterogeneity was non‐significant (I² = 0%; P = 0.63) (Analysis 3.1).
(4) 5‐FU/cisplatin/anthracycline combinations versus 5‐FU/anthracycline combinations (without cisplatin)
Summarising the results for the comparison of FU/cisplatin/anthracycline combinations versus FU/anthracycline (without cisplatin) results in a HR of 0.82 (95% CI 0.73 to 0.92, low‐quality evidence) in favour of the three‐drug regimen (Analysis 4.1). Combination chemotherapy arms only from the study by Cullinan 1994 were included in this comparison. This meta‐analysis, which included 1147 participants in seven studies (Cocconi 1994; Cocconi 2003; Cullinan 1994; GITSG 1988; Kikuchi 1990; Roth 1999; Webb 1997), once more confirms a overall survival benefit in favour of the three‐drug combination, which corresponds to a difference in weighted mean average survival of approximately two months. A sensitivity analysis according to the quality score has only little impact on the resulting HR (0.79, 95% CI 0.68 to 0.91). There was only moderate heterogeneity (I² = 28%, P = 0.21).
The two regimens containing FU, an anthracycline and cisplatin, which were evaluated in the largest number of participants are cisplatin, epirubicin, leucovorin, and FU administered as bolus (PELF; 184 participants) (Cocconi 1994; Cocconi 2003) and epirubicin, cisplatin, and protracted venous‐infusion FU (ECF; 327 participants) (Kim 2001; Ross 2002; Webb 1997). The rate of treatment‐related deaths was 3.3% for PELF versus 0.6% for ECF (OR 5.36, 95% CI 1.1 to 27.4; Fisher’s exact test, P = .02834), suggesting an increased toxicity of PELF. Quality of life was analysed in two studies evaluating ECF compared with FU, doxorubicin, and methotrexate (Webb 1997), as well as ECF compared with mitomycin, cisplatin, and FU (Ross 2002). Quality of life was superior in participants treated with ECF.
(5) Chemotherapy with irinotecan versus non‐irinotecan‐containing regimens
Overall survival
Ten studies (N = 2135) were summarised in this meta‐analysis (Boku 2009; Bouche 2004; Dank 2008; Komatsu 2011; Li 2016; Moehler 2005; Moehler 2010; Narahara 2011; Roy 2012; Sugimoto 2014). To avoid double‐counting the irinotecan‐treated population in the study by Bouche 2004, we approximated a within‐study hazard ratio of 0.72 (95% CI 0.30 to 1.72) for the study's irinotecan‐treated population (N = 45) and non‐irinotecan‐treated population (N = 89). Overall, the pooled hazard ratio of irinotecan‐containing regimens compared to non‐irinotecan containing regimens was 0.87 (95% CI 0.80 to 0.95, high‐quality evidence), with low heterogeneity (I² = 0%, P = 0.86) (Analysis 5.1), and corresponds to pooled median survival times of 11.3 and 9.7 months, with a small, but significant benefit for the irinotecan‐containing regimens. When only those studies with information about adequate allocation concealment are included in the analysis (Boku 2009; Bouche 2004; Moehler 2005; Moehler 2010; Narahara 2011; Roy 2012) the resulting overall HR was 0.84 (95% CI 0.76 to 0.93) (P = 0.84 and I² = 0%) when all studies were pooled. For these reasons, the results of this comparison can be considered as robust. Further sensitivity analyses were not performed due to the low number of studies.
Next, the HR for overall survival was separately investigated for studies with substitutive (i.e. studies in which another chemotherapy was substituted by irinotecan), additive (i.e. studies in which irinotecan was added to other chemotherapies), and other comparisons of irinotecan and non‐irinotecan‐containing regimens (Analysis 5.1). The summary of the six studies (826 participants) with substitutive comparisons (Bouche 2004; Dank 2008; Moehler 2005; Moehler 2010; Roy 2012; Sugimoto 2014) results in a HR of 0.87 (95% CI 0.75 to 1.00, high‐quality evidence), with low heterogeneity between study results (I² = 0%, P = 0.94).
The meta‐analysis of the three studies (Bouche 2004; Komatsu 2011; Narahara 2011), including a total of 500 participants, where irinotecan was given in addition to the treatment in the non‐irinotecan‐containing arm shows a non‐significant benefit for participants treated with irinotecan (HR 0.88, 95% CI 0.76 to 1.03, low‐quality evidence) and small heterogeneity between treatment effects of individual studies (I² = 6%, P = 0.34). This result corresponds to a pooled median survival duration of 11.9 months with compared to 10.9 months without irinotecan. Bouche 2004 and Narahara 2011 stated a higher benefit of four and two months, respectively. However, Komatsu 2011 showed a disadvantage of three months for participants treated with irinotecan and S‐1 compared to participants with S‐1 monotherapy.
The meta‐analysis of two studies (Boku 2009; Li 2016), which could neither be classified as substitutive nor additive, including a total of 809 participants, revealed a slight benefit for participants treated with irinotecan (HR 0.87, 95% CI 0.76 to 1.00, very low‐quality evidence). However, the pooled result needs to be interpreted with caution in light of the considerable clinical differences between studies included under 'Other Comparisons' as well as their significant statistical heterogeneity (I² = 65%, P = 0.04). For instance, Li 2016 allowed participants to switch to second‐line therapy after failure of first‐line. The study by Boku 2009 alone, which contributed the majority of participants (n = 704), showed a HR of 0.84, 95% CI 0.73 to 0.95 and a corresponding benefit in median survival of around one month in favour of participants treated with irinotecan.
Secondary outcome measures
Tumour response
Data were available from 1266 participants in 10 eligible studies (Analysis 5.2). In six studies (756 participants) with substitutive comparisons (Bouche 2004; Dank 2008; Moehler 2005; Moehler 2010; Roy 2012; Sugimoto 2014) response rates were 38% and 30% (OR 1.53, 95% CI 0.93 to 2.50, low‐quality evidence), with substantial heterogeneity (I² = 56%, P = 0.04). In three studies (345 participants) with additive comparisons, pooled response rates of 38% and 22% were observed (OR 2.18, 95% CI 1.25 to 3.80, low‐quality evidence), with moderate heterogeneity (I² = 19%, P = 0.29). In two studies (165 participants) of other comparisons, response rates were 53% and 38% (OR 1.87, 95% CI 0.89 to 3.91, very low‐quality evidence) with considerable heterogeneity (I² = 26%, P = 0.25).
Progression‐free survival
Most studies reported progression‐free survival instead of time to progression. Again, a within‐study hazard ratio was computed for the irinotecan‐treated population (N = 45) and non‐irinotecan‐treated population (N = 89) in Bouche 2004 to avoid counting the irinotecan‐treated population twice (HR = 0.59, 95% CI 0.50 to 0.68). Overall, the pooled hazard ratio of irinotecan‐containing regimens compared to non‐irinotecan‐containing regimens was 0.76 (95% CI 0.69 to 0.84, high‐quality evidence), with low heterogeneity (I² = 0%, P = 0.59) (Analysis 5.3).
Among five studies (N ‐ 741) with substitutive comparisons (Bouche 2004; Dank 2008; Moehler 2005; Moehler 2010; Sugimoto 2014), the hazard ratio for progression‐free survival was 0.85 (95% CI 0.72 to 1.00, moderate‐quality evidence) in favour of the participants treated with irinotecan (Analysis 5.3). The heterogeneity for this comparison was low (I² = 0%, P = 0.54).
The single study (N = 90) from the additive comparisons, from which data for progression‐free survival are available observed a large benefit (HR of 0.51, 95% CI 0.33 to 0.77, moderate‐quality evidence) with a median PFS of 6.9 and 3.2 months for participants treated with and without irinotecan (Bouche 2004). A smaller difference in TTP was reported by Komatsu 2011, with a median TTP of 4.8 and 3.8 months for participants treated with and without irinotecan. Two additional studies belonging to other comparisons (Boku 2009; Li 2016) with a total of 809 participants stated a pooled benefit for participants with irinotecan compared to control (HR 0.74, 95% CI 0.66 to 0.84, high‐quality evidence) with low heterogeneity (I² = 0%, P = 0.39). The study by Boku 2009 alone demonstrated a HR of 0.73 (95% CI 0.64 to 0.83) with median progression‐free survival of 4.8 months in the group treated with irinotecan and 4.2 and 2.9 months in the control groups without irinotecan.
Secondary resectability
Information about secondary resectable participants was not provided.
Toxicity
Rates of treatment‐related deaths and treatment discontinuation due to toxicity showed substantial heterogeneity between studies (P = 0.19, I² = 32%) and (P < 0.00001, I² = 87%), as well as a low event rate for treatment‐related deaths (0.8% versus 1.0%); hence, the significance of pooled results are unclear and will not be discussed in the text of this review (Analysis 5.4; Analysis 5.5). Three studies (Komatsu 2011; Roy 2012; Sugimoto 2014) observed no treatment‐related deaths.
Quality of life
Quality of life was assessed in the studies by Bouche 2004, Dank 2008, and Roy 2012. However, in the study by Bouche 2004, which used the EORTC‐QLQ C‐30 as an assessment tool, the absolute number of participants with follow‐up data in the different study arms was very small (between 21 and 29 participants at six months). As compared to treatment with 5‐FU/cisplatin, treatment with 5‐FU/irinotecan in this study was associated with higher global quality of life and functional scores, as well as lower symptom scores. Dank 2008 compared the time to 5% deterioration of the global health status, as measured by the EORTC QLQ‐C30 questionnaire in both treatment arms. In 288 assessable participants (86.5%), the median time to 5% deterioration of the global health status was 4.9 months (95% CI 3.7 to 7.0) in the irinotecan‐containing arm and 5.9 months (95% CI 4.8 to 7.7) in the platinum‐containing arm. In contrast, the results of the EQ‐5D instrument (data from 192 participants): time to definite worsening of Karnofsky performance status, appetite, weight loss, and pain‐free survival all favoured the irinotecan‐containing arm. Detailed quality‐of life results of this study have been published by Curran 2009. Roy 2012 assessed the clinical benefit in terms of times from baseline to definitive worsening of the Karnofsky performance status (KPS) by at least one category, definitive weight loss by at least 5% and worsening of appetite by at least one grade on a scale of 1 to 5 and added pain‐free survival. Median time to definitive deterioration of KPS (4.9 months; 95% CI 1.9 to 11.2 versus 2.6 months; 95% CI not reached) and median time to definitive 5% weight loss (not reached versus 7.6 months) were better without irinotecan. Median time to definitive worsening of appetite was 4.9 months (95% CI not reached) with no difference between groups. Median pain‐free survival was not reached in both groups.
(6) Chemotherapy with docetaxel versus non‐docetaxel‐containing regimens
Overall survival
Eight studies (N = 2001) were summarised in this meta‐analysis (Al‐Batran 2013; Koizumi 2014; Ochenduszko 2015; Ridwelski 2008; Roth 2007; Thuss‐Patience 2005; Van Cutsem 2006; Wang 2016). The resulting HR for overall survival was estimated separately for studies with substitutive (i.e. studies in which another chemotherapy was substituted by docetaxel), additive (i.e. studies in which docetaxel was added to other chemotherapies), and other comparisons (Analysis 6.1).
The summary of the three studies (479 participants) with substitutive comparisons (Ridwelski 2008; Roth 2007; Thuss‐Patience 2005) slightly favours the non‐docetaxel‐containing regimens (HR 1.05, 95% CI 0.87 to 1.27, moderate‐quality evidence), but does not reach statistical significance. The index of homogeneity according to Thompson (I² = 0%) shows a low statistical heterogeneity among the results of these studies (Analysis 6.1). Because necessary data for calculation of the HR in the studies by Sadighi 2006 were missing, this study could not be included in the meta‐analysis of this comparison. Differences in pooled median survival between the docetaxel‐containing regimens (9.2 months) and the non‐docetaxel‐containing regimens (9.4 months) are neither statistically significant nor clinically relevant. All publications describe an adequate allocation concealment and all studies were conducted in Europe.
The meta‐analysis of the four studies (N = 1466) (Al‐Batran 2013; Koizumi 2014; Van Cutsem 2006; Wang 2016), including a total of 1466 participants, where docetaxel was given in addition to the treatment in the non‐docetaxel‐containing arm favours the docetaxel‐containing regimens (HR 0.80, 95% CI 0.71 to 0.91, moderate‐quality evidence) with little heterogeneity between treatment effects of individual studies (I² = 0%, P = 0.82). This result corresponds to pooled median survival times of 12.3 and 10.6 months, with a small benefit for the docetaxel‐containing regimens. Al‐Batran 2013 was conducted in Germany, Koizumi 2014 in Japan and Korea, Wang 2016 in China, and the fourth study (Van Cutsem 2006) was an international study that recruited participants in America, Europe, and Asia. Due to the small number of studies in the primary analysis, we did not perform sensitivity analyses.
The single study belonging to other comparisons (Ochenduszko 2015) with 56 participants demonstrated a non‐statistically significant (P = 0.43) advantage of docetaxel‐containing regimens compared to control (HR 0.80, 95% CI 0.46 to 1.39, very low‐quality evidence). This study permitted second‐line therapy with irinotecan monotherapy.
Secondary outcome measures
Tumour response
Data were available from nine eligible studies of 1820 participants (Al‐Batran 2013; Dong 2014; Koizumi 2014; Ridwelski 2008; Roth 2007; Sadighi 2006; Thuss‐Patience 2005; Van Cutsem 2006; Wang 2016) (Analysis 6.2) (OR 1.37, 95% CI 1.03 to 1.83, moderate‐quality evidence).
In studies with substitutive comparisons (Ridwelski 2008; Roth 2007; Sadighi 2006; Thuss‐Patience 2005) response rates of 525 participants were 31% in both arms (OR 1.03, 95% CI 0.71 to 1.50, moderate‐quality evidence). However, in four studies with additive comparisons and 1235 participants (Al‐Batran 2013; Koizumi 2014; Van Cutsem 2006; Wang 2016), pooled response rates of 43% and 30% were observed (OR 1.83, 95% CI 1.45 to 2.32, high‐quality evidence). Heterogeneity between results of different studies was very low in both comparisons (I² = 0%, P = 0.98 and P = 0.69, respectively). Among other comparisons, the study by Dong 2014 with 60 participants showed a substantial survival advantage with docetaxel‐containing regimens (OR 0.33, 95% CI 0.12 to 0.96, very low‐quality evidence).
Time to progression and progression‐free survival
Data on time to progression were available for two studies (N = 360) (Ridwelski 2008; Thuss‐Patience 2005) (Analysis 6.3) and data for progression‐free survival were available for five studies (N = 1498) (Koizumi 2014; Ochenduszko 2015; Roth 2007; Van Cutsem 2006; Wang 2016) (Analysis 6.4).
In the case of time to progression, data based on 360 participants from two studies revealed a non‐significant difference between docetaxel and non‐docetaxel‐containing regimens (HR 1.06, 95% CI 0.85 to 1.32, very low‐quality evidence) (Analysis 6.3).
In the case of progression‐free survival, the pooled hazard ratio was 0.76 (95% CI 0.63 to 0.91, moderate‐quality evidence) in favour of docetaxel‐containing regimens based on 1498 participants in five studies, but a high level of heterogeneity was observed (I² = 52%, P = 0.08) (Analysis 6.4). When only additive comparisons were considered (Koizumi 2014; Van Cutsem 2006; Wang 2016) (N = 1323), the pooled hazard ratio was 0.70 (95% CI 0.61 to 0.81, high‐quality evidence), and a lower level of heterogeneity was observed (I² = 20%, P = 0.29).
Secondary resectability
This outcome was not reported in any of the studies.
Toxicity
Seven studies (N = 2113) reported rates of treatment‐related deaths, which were 1.4% in the docetaxel‐containing arms versus 1.2% in the non‐docetaxel‐containing arms (OR 1.10, 95% CI 0.55 to 2.20, moderate‐quality evidence, I² = 0%, P = 0.44) (Analysis 6.5). Treatment discontinuation due to toxicity was numerically less frequent for the participants treated with docetaxel (18.4% versus 21.1%, corresponding to an OR of 0.81 (95% CI 0.53 to 1.25, low‐quality evidence), and different results between the studies (I² = 35%, P = 0.19) (Analysis 6.6). In contrast, discontinuation of treatment due to withdrawal of consent was observed approximately twice as frequently in the participants treated with DCF as compared to CF (22% versus 12%) in the study by Van Cutsem 2006.
Quality of life
Quality of life was assessed by Sadighi 2006, Roth 2007, Van Cutsem 2006, and Al‐Batran 2013 with the EORTC‐QLQ C30. Furthermore, "clinical benefit", defined as the time to definitive decrease in performance status by > one category was analysed in the study by Van Cutsem 2006 and demonstrated a clinical benefit for participants treated with DCF (Ajani 2007).
Sadighi 2006 used the Iranian version of the EORTC‐QLQ C30. The report by Ajani 2007a demonstrated a better preservation of Quality of life in the participants treated with DCF. In Roth 2007, global health status improved in participants treated with ECF, but remained stable with both docetaxel regimens. Van Cutsem 2006 measured a longer time to 5% deterioration of the global health status in the docetaxel‐containing arm as compared to the non‐docetaxel‐containing arm (HR 1.44, 95% CI 1.08 to 1.93). Thuss‐Patience 2005 measured subjective symptom improvement rates. Al‐Batran 2013 (Kripp 2014) administered both EORTC QLQ‐C30 and the gastric module STO22, and found that despite the higher toxicity in elderly participants (aged 65 years or older) receiving FLOT, the intensified chemotherapy regimen did not affect quality of life parameters in the elderly.
(7) Chemotherapy with capecitabine versus 5‐FU‐containing regimens
Overall survival
The results for this comparison are based on 732 randomised participants in five studies (Kang 2009; Li 2016; Ocvirk 2012; Ochenduszko 2015; Van Cutsem 2015). The HR for overall survival of 0.94 (95% CI 0.79 to 1.11, moderate‐quality evidence) favours the oral regimen, but does not reach statistical significance (Analysis 7.1). The index of heterogeneity for this comparison was small (I² = 12%, P = 0.34). The corresponding pooled median survival are 10.8 and 10.9 months, respectively for the capecitabine and 5‐FU‐containing arms respectively. When the studies which permitted second‐line therapy were excluded as part of sensitivity analysis (Li 2016; Ochenduszko 2015), the pooled HR for overall survival remained stable at 0.93 (95% CI 0.77 to 1.14).
Secondary outcome measures
Tumour response
Data were available in 636 participants in four studies (Kang 2009; Li 2016; Ocvirk 2012; Van Cutsem 2015). The objective response rate was 38% in both arms, corresponding to an OR of 0.85 (95% CI 0.40 to 1.79, very low‐quality evidence) with a non‐significant advantage for the capecitabine‐containing regimen (Analysis 7.2).
Time to progression
Data from one study of 85 participants (Ocvirk 2012) showed a small benefit for participants treated with capecitabine (HR 0.72, 95% CI 0.47 to 1.12, very low‐quality evidence), with improved median time to progression times of 6.8 versus 5.5 months for the participants treated with and without capecitabine.
Kang 2009 provided the largest number of participants for the evaluation of progression‐free survival and showed a non‐significant advantage for the capecitabine‐containing arm (HR 0.80, 95% CI 0.62 to 1.03), corresponding to an improvement in median progression‐free survival time of 5.6 versus 5.0 months for the participants treated with and without capecitabine. In total, four studies (Kang 2009; Li 2016; Ochenduszko 2015; Van Cutsem 2015) were included in this comparison with a total of 647 participants, demonstrating an overall HR of progression‐free survival of 0.98 (95% CI 0.77 to 1.23, very low quality) for participants treated with vs without capecitabine (I²=23%, P=0.27) (Analysis 7.4). The exclusion of studies permitting second‐line chemotherapy (Li 2016; Ochenduszko 2015) did not alter the findings (HR 0.94, 95% CI 0.58 to 1.53).
Secondary resectability
This outcome was not reported in these studies.
Toxicity
Two studies (N = 481) reported deaths due to toxicity, where in the capecitabine‐containing arm was 5% in the capecitabine‐containing arm and 2% in the 5‐FU arm (Kang 2009; Van Cutsem 2015) (Analysis 7.5). The pooled OR for treatment related death is 1.88 (95% CI 0.23 to 15.15, very low‐quality evidence), with substantial heterogeneity (I² = 59%, P = 0.12). Treatment discontinuation due to toxicity was similar in both arms (18%) (Kang 2009) (Analysis 7.6).
Quality of life
Was not reported in these studies.
(8) Chemotherapy with oxaliplatin versus the same regimen including cisplatin
Overall survival
Data were available on 1105 participants in five studies (Al Batran 2008; Hironaka 2016; Kim 2014; Popov 2008; Yamada 2015). The HR for overall survival of 0.81 (95% CI 0.67 to 0.98, low‐quality evidence) show a small, advantage for the regimen with oxaliplatin (Analysis 8.1), with a moderate heterogeneity index (I² = 38%, P = 0.17). This survival benefit is also reflected in the pooled median overall survival time of 14.0 months versus 11.3 months, respectively.
Secondary outcome measures
Tumour response
Data were available on 1081 participants of the five studies (Al Batran 2008; Hironaka 2016; Kim 2014; Popov 2008; Yamada 2015). The response was 54% in the oxaliplatin‐based arms and 47% in the cisplatin‐based arms, with a statistically significant advantage for the oxaliplatin‐containing regimen (OR 1.38, 95% CI 1.08 to 1.76, moderate‐quality evidence), and low heterogeneity between studies (I² = 0%, P = 0.41) (Analysis 8.2).
Progression‐free survival
Progression‐free survival, rather than time to progression, was reported in the studies by Al Batran 2008, Hironaka 2016, Kim 2014, and Yamada 2015 (N = 1034). The pooled hazard ratio of oxaliplatin‐ versus cisplatin‐based regimens, was 0.88 (95% CI: 0.66 to 1.19) with a high level of heterogeneity between studies (I² = 59%, P = 0.06) (Analysis 8.3).
Secondary resectability
This outcome was not reported in these studies.
Toxicity
In Popov 2008, two participants (1.4%) experienced a toxic death in the cisplatin‐containing arms. These two participants suffered from febrile neutropenia, developed sepsis, and died of septic shock despite antimicrobial therapy. No participant died of toxicity in the oxaliplatin‐containing arm (Popov 2008). One treatment‐related death occurred in each arm in Kim 2014. Al Batran 2008 observed no treatment‐related deaths. Overall, the pooled occurrence of treatment‐related deaths (Al Batran 2008; Hironaka 2016; Kim 2014; Popov 2008; Yamada 2015) (N = 1132) in both arms were 0.9% and 2.0% in the oxaliplatin‐ and cisplatin‐containing arms, respectively (OR 0.47, 95% CI 0.17 to 1.30, low‐quality evidence), with a relatively stable effect across studies (I² = 0%, P = 0.74) (Analysis 8.4). Data on treatment discontinuation due to toxicity (Al Batran 2008; Hironaka 2016;Yamada 2015) (N = 970) were 8% and 10% in the oxaliplatin and cisplatin arms, respectively (OR 0.97, 95% CI 0.44 to 2.13, very low‐quality evidence), with substantial between‐study heterogeneity (I² = 60%, P = 0.08) (Analysis 8.5).
Quality of life
This was not reported in these studies.
(9) Taxane‐platinum‐fluoropyrimidine combinations versus taxane‐platinum (without fluoropyrimidine)
Overall survival
The results for this comparison are based on 482 randomised participants in three studies (Ajani 2005; Roth 2007; Van Cutsem 2015). The HR for overall survival of 0.86 (95% CI 0.71 to 1.06, very low‐quality evidence) favours the regimen with fluoropyrimidine (I² = 0%, P = 0.47), but does not reach statistical significance (Analysis 9.1). The corresponding pooled median survival times are 11.7 versus 10.0 months with a small benefit for participants treated with fluoropyrimidines. Allocation concealment was adequate in the studies included in this comparison.
Secondary outcome measures
Tumour response
Data were available all participants in the above mentioned three studies. The objective response rate was 38% in the 5‐FU‐containing regimen and 23% in the arm without 5‐FU. This corresponds to an OR of 2.08 (95% CI 1.37 to 3.15, low‐quality evidence) with an advantage for the 5‐FU‐containing regimen. Low heterogeneity (I² = 0%, P = 0.89) between studies was observed.
Time to progression
All three studies reported progression‐free survival instead of time to progression. Data from the included studies showed a benefit (HR 0.74 95% CI 0.59 to 0.93, moderate‐quality evidence) for the participants treated with 5‐FU (Analysis 9.3), and low heterogeneity between studies (I² = 0%, P = 0.83).
Secondary resectability
This outcome was not reported in these studies.
Toxicity numbers
In three studies (N = 482), treatment‐related deaths were 6.2% and 2.6% in the 5‐FU‐containing arms and non‐FU‐containing arms respectively (OR 1.95, 95% CI 0.73 to 5.17, very low‐quality evidence) (I² = 0%, P = 0.88) (Analysis 9.4). Treatment discontinuation due to toxicity was more frequent for the participants treated with 5‐FU (16.7% versus 10.5%), corresponding to an OR of 1.71 (95% CI 0.79 to 3.69, very low‐quality evidence) and results between studies were not different (I² = 0%, P = 0.93) (Analysis 9.5).
Quality of life
This was assessed in only one of these studies (Roth 2007). Treatment burden increased over time in both treatment arms.
(10) S‐1 versus 5‐FU‐containing regimens
Overall survival
This meta‐analysis was based on 1793 participants in four randomised studies (Ajani 2010; Boku 2009; Chen 2015; Li 2015). The resulting HR for overall survival of 0.91 (95% CI 0.83 to 1.00, high‐quality evidence) demonstrates a borderline statistically significant benefit with low heterogeneity (I² = 0%, P = 0.50) with overall survival in favour of S‐1 (Analysis 10.1). The corresponding pooled median survival times were 9.6 and 9.1 months with a clinically negligible benefit for participants treated with S‐1. Allocation concealment was adequate in Ajani 2010 and Boku 2009.
Secondary outcome measures
Tumour response
Data were available in 1753 participants in seven studies (Ajani 2010; Boku 2009; Chen 2015; Dong 2014; Huang 2013; Li 2015; Li 2014). The objective response rate was 32% with S‐1 and 26% in the 5‐FU arm. This corresponds to an OR of 1.73 (95% CI 1.01 to 2.94, very low‐quality evidence) (Analysis 10.2). However, considering the statistically significant heterogeneity (I² = 77%, P = 0.0002), the results of this comparison have to be evaluated cautiously.
Time to progression
Four studies (Ajani 2010; Boku 2009; Huang 2013; Li 2015) (N = 1942) reported progression‐free survival, with a small non‐significant benefit for participants treated with S‐1 (HR 0.85, 95% CI 0.70 to 1.04, low‐quality evidence) (Analysis 10.3) and with substantial heterogeneity (I² = 70%, P = 0.02).
Three studies (Ajani 2010; Boku 2009; Huang 2013) reported time to treatment failure (TTF) with a HR of 0.84 (95% CI 0.69 to 1.02) in favour of S‐1. With the inclusion of Li 2014 and Chen 2015, who reported the time to progression, into the meta‐analysis of TTF (Analysis 10.4), (N = 1818), the pooled HR was 0.88 (95% CI 0.76 to 1.01. low‐quality evidence), indicating a slight but statistically non‐significant benefit of S‐1.
Secondary resectability
This outcome was not reported in these studies.
Toxicity
Rates of treatment‐related deaths were less frequent in the S‐1‐containing arm (1.5%) compared to 2.7% in the 5‐FU‐containing arm (OR 0.56, 95% CI 0.30 to 1.06, moderate‐quality evidence) (I² = 0%, P = 0.52) (Analysis 10.5). Treatment discontinuation due to toxicity was slightly less frequent for the participants treated with S‐1 (11.1% versus 12.8%, corresponding to an OR of 0.85 (95% CI 0.63 to 1.13, high‐quality evidence) (I² = 11%, P = 0.32) (Analysis 10.6).
Quality of life
Health‐related quality of life was reported by Ajani 2010. There was an advantage of CS compared to CF in terms of the Physical Well‐Being (PWB; 51.7% versus 45.1%, P = 0.044) component of the FACT‐Ga, longer time to worsening of PWB scores (median duration; 4.5 versus 3.0 months, P = 0.014), and Chemotherapy Convenience and Chemotherapy Concerns scores.
Discussion
Summary of main results
Only randomised controlled studies were included in this meta‐analysis. An exhaustive search for unpublished or ongoing material was performed to minimise publication bias. Sixty studies, with a total of 11,698 participants, have been included in the meta‐analysis of overall survival. The meta‐analyses of comparisons 1 (three studies, 184 participants) and 2 (23 studies involving 4447 participants) provide evidence for significant benefits in overall survival for first‐line chemotherapy versus best supportive care (BSC), as well as a smaller benefit for combination versus single‐agent chemotherapy. Overall, regimens containing irinotecan demonstrated improved results for overall survival in the substitutive comparison (i.e. where another chemotherapy was substituted by irinotecan) of irinotecan versus non‐irinotecan‐containing regimens (six studies with 826 participants, HR 0.87, 95% CI 0.75 to 1.00, high‐quality evidence), but not in the additive comparison (i.e. where irinotecan was added to another chemotherapy; HR 0.88, 95% CI 0.76 to 1.03, three studies with 500 participants, low‐quality evidence). In contrast, the meta‐analysis of all irinotecan‐containing versus non‐irinotecan‐containing regimens demonstrates a small, but significant survival benefit in favour of the people treated with irinotecan. Of note, both treatment‐related deaths and treatment‐discontinuation due to toxicity were not increased for people treated with irinotecan.
Furthermore, regimens in which docetaxel was added to a two‐drug platinum‐fluoropyrimidine combination showed a significant survival benefit (four studies with 1466 participants (HR 0.80, 95% CI 0.71 to 0.91, moderate‐quality evidence). In contrast, substituting another chemotherapy (e.g. 5‐FU (Ridwelski 2008), epirubicin (Roth 2007), or both epirubicin and 5‐FU (Thuss‐Patience 2005)) by docetaxel provides no advantage ‐ either in survival, or in secondary outcomes (three studies involving 479 participants, HR 1.05; 0.87 to 1.27, moderate‐quality evidence). However, the addition of docetaxel to a two‐drug chemotherapy regimen in first‐line therapy slightly increases both the risk of treatment‐related deaths and treatment discontinuation due to toxicity. The comparison of regimens including capecitabine versus 5‐FU showed non‐significant advantages in terms of overall survival for the oral 5‐FU prodrug capecitabine (732 participants in five studies, 0.94, 95% CI 0.79 to 1.11, moderate‐quality evidence).
The comparison of regimens including oxaliplatin versus cisplatin (comparison 8), and S‐1 versus 5‐FU (comparison 10), however demonstrated the superior efficacy of oxaliplatin (1105 participants from five studies, HR 0.81, 95% CI 0.67 to 0.98, low‐quality evidence) and S‐1 (1793 participants in four studies, HR 0.91, 95% CI 0.83 to 1.00, high‐quality evidence), respectively, the latter being statistically non significant. However the magnitude of the benefit in individual populations is unclear due to differences in dosing and treatment schedules, and drug metabolism of S‐1 between Asian and Caucasian populations. Of note, the landmark REAL‐2 study could not be included in this analysis as it included up to 13% of people with oesophageal squamous cell carcinoma in the different study arms.
(1) First‐line chemotherapy versus best supportive care
Results for the comparison of first‐line chemotherapy versus best supportive care (BSC) convincingly demonstrate a benefit in median survival in favour of chemotherapy (HR 0.37, 95% CI 0.24 to 0.55, three studies, 184 participants, moderate‐quality evidence), corresponding to 11 versus 4.3 months weighted average survival. The validity of this result was limited by the small number of participants included in this analysis. In two of four studies addressing this question, either the randomisation (Murad 1993) or the study (Pyrhönen 1995) were terminated early. In another one (Glimelius 1997) the conduct of the study was not possible as planned because the research ethics committee requested the provision of chemotherapy upon request in the BSC group. Further studies addressing this comparison cannot be carried out as BSC cannot be considered to be an appropriate control arm for further studies. Exclusion of the studies by Murad and Pyrhönen, both of which have severe methodological limitations as described above, restricts the studies eligible for this analysis to the study by Scheithauer (Scheithauer 1996). This study, which included 103 participants, was the largest of all studies performed for this comparison and demonstrated a survival benefit of 10.2 versus 5.0 months in the chemotherapy versus BSC group (P = 0.0001), which is statistically significant and in line with the results of the other two studies, although not as large. Another study (Glimelius 1997), which was excluded from the analysis (see above) because of cross‐over, provided important insights about the quality of life of participants in the chemotherapy and BSC arms. The average quality‐adjusted survival was longer in the group of participants randomised to chemotherapy than in the BSC group (median six versus two months). In addition to the benefits in median survival and quality of life, between 10% and 24% of all participants in the chemotherapy groups in these three studies were alive after two years. In contrast, only one of 81 participants included in the BSC arms of these studies survived longer than 24 months. Two‐year survival rates in chemotherapy‐treated participants between 5% and 14% were confirmed by other authors (Ohkuwa 2000; Waters 1999), confirming the observation that a limited number of people do have a considerably greater survival benefit from chemotherapy. The reason for the difference in pooled median survival between chemotherapy arms in the studies that compared chemotherapy versus BSC (11.0 months) and the combination therapy arms in studies comparing single‐agent versus combination chemotherapy (7.0 months) remains unclear and cannot be explained by differences in prognostic factors. Considering the small number of participants included in the studies comparing chemotherapy versus BSC, as well as the methodological limitations in two of these three studies, an over‐estimation of the effect of chemotherapy in these studies is likely.
(2) Single agent versus combination chemotherapy
Regarding comparison 2, 16 of 23 relevant individual studies (N = 4447) did not demonstrate a benefit in terms of overall survival for the combination chemotherapy arms. In this context, the results of this meta‐analysis demonstrate a statistically significant and consistent benefit for combination versus single‐agent therapy in terms of overall survival (HR 0.84, 95% CI 0.79 to 0.89, moderate‐quality evidence). Furthermore, response rate and time to progression show advantages for the participants treated with combination chemotherapy. The pooled results of these studies represent a generalised estimate of the effectiveness of the combination chemotherapy regimens used in the last 25 years. Therefore, the benefit of a modern two‐drug combination, such as 5‐FU/irinotecan or 5‐FU/oxaliplatin over a single‐agent, usually fluoropyrimidine‐based chemotherapy regimen is likely to exceed this global result.
Although any potential survival benefit associated with combination chemotherapy is achieved at the price of increased toxicity, the toxicity of the above mentioned combinations of 5‐FU and irinotecan, and 5‐FU and oxaliplatin is well managed by oncologists today. Furthermore, given the known correlation between tumour response and quality of life (Sadighi 2006), and considering that the ability of a chemotherapy to maintain a person's health‐related quality of life is correlated to its efficacy (Al‐Batran 2010), in the absence of contraindications, modern two‐drug combination chemotherapy regimens as discussed above should clearly be the preferred option for first‐line treatment of people with advanced gastric cancer.
(3) 5‐FU/cisplatin/anthracycline combinations versus 5‐FU/cisplatin (without anthracyclines)
This comparison was based on 579 participants in four randomised studies and results in a HR of 0.74 (95% CI 0.61 to 0.89, moderate‐quality evidence) in favour of the three‐drug combination. This comparison is limited by a small number of studies and participants. The results of this comparison are predominantly attributable to the study by Ross 2002, which compared ECF versus MCF. The difference between the data included in this review and the final publication is due to the fact that the original publication included people with squamous cell cancer of the oesophagus, which do not correspond to the inclusion criteria of this review. Therefore, data from people with gastric adenocarcinoma only as provided by the authors were included in this review.
Whether these results are still relevant today is questionable for two reasons.
1) Since the publication of the REAL‐2 study (Cunningham 2008), which demonstrated a significant survival benefit for the combination of EOX (epirubicin, oxaliplatin, and capecitabine) as compared to ECF (epirubicin, cisplatin, and fluorouracil), cisplatin is frequently replaced by oxaliplatin and 5‐FU by capecitabine in clinical practice. The relative contribution of epirubicin to the efficacy of the three‐drug regimen of capecitabine, oxaliplatin, and epirubicin must be considered as unclear.
2) All studies included in this comparison were conducted at a time when active drugs for second‐line chemotherapy were not available. Thus, the validity of these results in 2017, after the publication of 3 randomised studies comparing second‐line therapy versus BSC (Ford 2014; Kang 2012; Thuss‐Patience 2011), which all three demonstrated as clinically meaningful, statistically significant, and consistent benefit in survival of about 1.5 months, as well as improvements in clinical symptoms Thuss‐Patience 2011 and quality of life Ford 2014, needs to be questioned.
In addition, a recently published, french randomised multicentre phase III study Guimbaud 2014, in which a total of 416 participants were included, is of special interest in this context. This study compared the combination of FOLFIRI, followed by ECX (epirubicin, cisplatin, and capecitabine) with the reverse sequence of the same regimens. It has not been included in this meta‐analysis as all participants eligible for second‐line chemotherapy were systematically crossed over. The results of this study showed similar results for PFS (5.3 versus 5.8 months) and OS (9.5 versus 9.7 months) for both treatment strategies, but a longer time‐to treatment‐failure for FOLFIRI. Furthermore, the tolerance of FOLFIRI (overall grade III+IV toxicities and haematological adverse events) was better. For these reasons it must be considered as questionable whether the benefit from adding epirubicin to a two‐drug regimen including capecitabine and oxaliplatin outweighs its additional toxicity, especially in sequential treatment strategies.
(4) 5‐FU/cisplatin/anthracycline‐combinations versus 5‐FU/anthracycline combinations (without cisplatin)
Comparison 4 was based on 1147 participants randomised in seven studies and resulted in a HR of 0.82 (95% CI 0.73 to 0.92; low‐quality evidence, Analysis 4.1) in favour of the three‐drug combination. A sensitivity analysis according to the quality score with inclusion of only those studies in which allocation concealment was adequate (Cocconi 1994; Cocconi 2003; Kikuchi 1990; Webb 1997) does not cause a relevant change of the resulting HR (0.82, 95% CI 0.73 to 0.92, low‐quality evidence). Heterogeneity was non‐significant in comparison 3 and 4 (P = 0.71 and 0.21; I² was 0% (95% CI 0% to 26.5%) and 28.5% (95% CI 0% to 69.2%).
This comparison, which included a greater number of participants and studies compared to comparison 3, and is thus much more robust, confirms a statistically significant advantage in overall survival for the addition of cisplatin to the combination of epirubicin and fluorouracil, achieved at the price of increased toxicity. Again, all studies included in this comparison were published more than 20 years ago, when second‐line therapy was unavailable. Therefore, as discussed above, the benefit of anthracyclines in this three‐drug combination today is unclear. In view of the evidence discussed above, combinations of 5‐FU/cisplatin and an anthracycline are no longer considered as a preferred option for the first‐line treatment of advanced gastric cancer today.
(5) Irinotecan versus non‐irinotecan‐containing regimens
Comparison 5 was based on 2135 participants randomised in 10 studies including six studies in substitutive comparisons, three studies in additive comparison, and two other comparisons. Two treatment arms without irinotecan (5‐FU as single‐agent and 5‐FU/cisplatin) were compared to FOLFIRI in Bouche 2004. Taking all studies into account, the pooled hazard ratio was 0.87 (95% CI 0.80 to 0.95, high‐quality evidence) in favour of irinotecan‐containing regimens. In subgroup analyses of overall survival, the pooled HR were 0.87 (95% CI 0.75 to 1.00, high‐quality evidence) for the substitutive comparison, HR 0.88 (95% CI 0.76 to 1.03, low‐quality evidence) for the additive comparison, and HR 0.87 (95% CI 0.76 to 1.00, very low‐quality evidence) for the other comparisons, Analysis 5.1.
Objective response rates of 38% versus 30% were observed in substitutive (OR 1.53, 95% CI 0.93 to 2.50, low‐quality evidence) and 38% versus 22% in additive comparisons (OR 2.18, 95% CI 1.25 to 3.80, low‐quality evidence). The pooled HR for progression‐free survival was 0.76 (95% CI 0.69 to 0.84, high‐quality evidence); and 0.85 (95% CI 0.72 to 1.00, moderate‐quality evidence) and 0.74 (95% CI 0.66 to 0.84, high‐quality evidence) for subgroup analysis of substitutive and other comparisons, respectively. Results for rates of treatment‐related deaths and treatment discontinuation due to toxicity showed high heterogeneity between studies.
In view of these results, 5‐FU/irinotecan‐based two‐drug combinations should be considered as a true and at least equally effective alternative to platinum‐based combinations in first‐line therapy. A further advantage of the irinotecan‐based combination is the different toxicity profile with no neurotoxicity (as compared to the platinum derivatives) and no significant renal toxicity. In addition, irinotecan‐based regimens can easily be administered in the outpatient setting and avoid the hyperhydration necessary for the treatment with cisplatin. Again, the above mentioned study Guimbaud 2014 clearly demonstrates not only the comparable results of treatment with FOLFIRI in first‐ versus second‐line, but as well the feasibility of second‐line chemotherapy in 40% to 50% of people and third‐line in about 20% of people in Europe.
(6) Docetaxel versus non‐docetaxel‐containing regimens
Comparison 6 was based on 2001 participants randomised in eight studies including three studies in substitutive comparisons, four studies in additive comparison, and one study in other comparisons. Results from one study (Sadighi 2006) are not included in this meta‐analysis at present because data for the calculation of the HR were not available. Overall, heterogeneity was not significant in the former two comparisons (I² = 0%, P = 0.99 and 0.82). Of special interest is the fact that studies, in which docetaxel was added to a two‐drug regimen of a platinum and a fluoropyrimidine (Al‐Batran 2013; Wang 2016;Van Cutsem 2006) or S‐1 as single‐agent (Koizumi 2014) demonstrate a significant benefit not only in terms of survival (HR 0.80; 0.71 to 0.91, moderate‐quality evidence), but also in terms of response rates where the OR was 1.83 (95% CI 1.45 to 2.32, high‐quality evidence) for the regimens with docetaxel. In contrast, when docetaxel is substituting another chemotherapy, such as 5‐FU, no OS benefit of the docetaxel‐containing chemotherapy regimen was observed (HR 1.05, 95% CI 0.87 to 1.27, moderate‐quality evidence). Thus, docetaxel‐containing two‐drug regimens are less efficient than docetaxel‐containing three‐drug regimens. This observation is confirmed by the recently published, randomised phase II study by Van Cutsem 2015, where overall survival was 14.59 months (95% CI:11.7 to 21.78) for participants treated with docetaxel, oxaliplatin, and 5‐FU, as compared to 11.3 (95% CI 8.08 to 14.03) months. However, survival was only a secondary endpoint of this study, and the study was not powered to detect survival differences. Of note, in the study by Van Cutsem 2006 32% and 41% of participants in both study arms were treated with further chemotherapy lines, while this figure was not given for the study by Al‐Batran 2013. The positive effect of the addition of docetaxel to the cisplatin/fluorouracil combination on survival as well as the time to 5% deterioration of global health status in the study by Van Cutsem 2006 was unfortunately achieved at the price of significant toxicity, especially haematological toxicity. For this reason, the clinical value of this regimen is regarded as controversial (Ilsen 2007). Of note, grade III to IV infection (related to treatment) was more frequent in elderly people (20% versus 9%), and infection was the main cause of treatment‐related deaths in both study arms.
Finally, the median age of 55 in the participants included in this study, which was well below the median age of the participants included in other studies (e.g. Al Batran 2008 or Cunningham 2008: 64 and 65 years), needs to be considered when applying these findings to people outside a clinical study. In contrast, the FLOT regimen (5‐FU, leucovorin, oxaliplatin, and docetaxel) was developed in an elderly population (median age 69 and 70 years in both treatment groups) (Al‐Batran 2013). The primary endpoint of this randomised phase II study, which compared FLOT with FLO (5‐FU, leucovorin and oxaliplatin) was the tolerability and feasibility, defined as per group differences in toxic effects. While the results of this study show ‐ as expected ‐ higher rates of neutropenia, leukopenia, alopecia, and diarrhoea for the participants treated with FLOT, there were similar rates of complicated neutropenia and serious adverse events in the two treatment arms. However, progression‐free and overall survival in people over 70 years was similar for treatment with FLOT and FLO. Thus, although FLOT has shown to be feasible in a population over 65 years old, according to a subgroup analysis of younger participants (n = 68) versus equal to or older than 70 years (n = 75) in this study, only in participants younger than 70 an improved survival was observed for the three‐drug combination (median survival 7.1 versus 10.6 months). However, these data are not more than hypothesis generating based on a subgroup analysis from a randomised phase II study. Nevertheless, although the same limitation is valid, another subgroup analysis from this study, which compared the benefit of FLOT to FLO in people with locally advanced versus metastatic disease raised another interesting hypothesis. According to this subgroup analysis, median survival of people with locally advanced disease (n = 44) treated with FLOT versus FLO is 24.2 versus 10.3 months, as compared to 7.3 versus 6.0 months in people with metastatic disease (n = 99). Thus, people with locally advanced disease might have a greater benefit from FLOT than people with metastatic disease.
(7) Regimens including capecitabine versus intravenous 5‐FU‐containing regimens
Comparison 7 was based on 732 randomised participants in five studies and resulted in a HR of 0.94 (95% CI 0.79 to 1.11; moderate‐quality evidence, Analysis 7.1). The finding of these studies are in line with the study by Cunningham 2008, which confirms the non‐inferiority of capecitabine as compared to 5‐FU although it was not included in this comparison because of differences in the participant population (inclusion of people with squamous cell cancer of the oesophagus). For this reason, people with gastric cancer without dysphagia, with adequate renal function and compliance may be treated with capecitabine (or S‐1 ‐ see Analysis 10.1) instead of 5‐FU.
(8) Regimens including oxaliplatin versus the same regimen including cisplatin
Overall survival results for comparison 8 are based on 1105 randomised participants in five studies. The HR for overall survival was 0.81 (95% CI 0.67 to 0.98, low‐quality evidence) showing a statistically significant survival advantage in favour of oxaliplatin‐containing regimens (Analysis 8.1). A higher rate of tumour response was also observed in oxaliplatin‐containing regimens (54%) compared to cisplatin‐containing regimens (47%) (OR 1.38, 95% CI 1.08 to 1.76, moderate‐quality evidence). Again, although data from the landmark REAL‐2 study (Cunningham 2008) were not included in this comparison for reasons specified above, they confirm the non‐inferiority of oxaliplatin as compared to cisplatin. It is worth noting that three of these included studies were conducted in Asia (Hironaka 2016; Kim 2014; Yamada 2015), potentially highlighting the applicability of these results to an Asian cohort.
Of special interest in this context is a subgroup analysis of the study by Al Batran 2008, which reports better results for elderly participants treated with oxaliplatin as compared to cisplatin. Therefore, especially when taking into account the higher response rates and lower risk of treatment‐related death, oxaliplatin should be preferred to cisplatin in the treatment of gastric cancer.
9) Taxane‐platinum‐fluoropyrimidine combinations versus taxane‐platinum (without fluoropyrimidine)
This comparison was based on 482 randomised participants in three studies and resulted in a HR for overall survival of 0.86 (95% CI 0.71 to 1.06; very low‐quality evidence, Analysis 9.1) in favour of the taxane regimen plus fluoropyrimidine, without reaching statistical significance. The potential drawback was the higher rate of treatment‐related deaths (6.2% versus 2.6%, OR 1.95; 95% CI 0.73 to 5.17) and treatment discontinuation due to toxicity (17% versus 11%, OR 1.71, 95% CI 0.79 to 3.69) in the regimens with fluoropyrimidines. Of note; these results are partially attributable to the docetaxel/oxaliplatin/capecitabine‐combination, which due to its clearly inferior therapeutic index as compared to the same combination with 5‐FU instead of capecitabine (Van Cutsem 2015) is not recommended. However, objective response rates (38% versus 23%, 2.08 (95% CI CI 1.37 to 3.15) and progression‐free survival (HR 0.74, 95% CI 0.59 to 0.93, moderate‐quality evidence) were improved in regimens with fluoropyrimidine. Treatment burden increased over time in both treatment arms. Thus, in conclusion, when a docetaxel‐containing three‐drug combination chemotherapy regimen is chosen as first‐line treatment, oxaliplatin should be preferred to cisplatin, and 5‐FU should be preferred to capecitabine.
(10) S‐1 versus 5‐FU‐containing regimens
This comparison was based on 1793 randomised participants in four studies and resulted in a HR for overall survival of 0.91 (95% CI 0.83 to 1.00; Analysis 10.1). In addition, a statistically significant advantage in tumour response (OR 1.73, 95% CI 1.01 to 2.94, very low‐quality evidence), a numerical benefit in progression‐ free‐survival (HR 0.85, 95% CI 0.70 to 1.04) and time‐to‐treatment failure (HR 0.88, 95% CI 0.76 to 1.01, both low‐quality evidence), less frequent treatment‐related deaths (1.5% versus 2.7%, OR 0.56, 95% CI 0.30 to 1.06), and treatment discontinuations due to toxicity (11.1% versus 12.8%, OR 0.85, 95% CI 0.63 to 1.13) were observed in the S‐1‐containing compared to the 5‐FU‐containing arms.
Overall completeness and applicability of evidence
In most of these studies, the participants were only in part representative of all people with gastric cancer because they were generally younger than the overall population of people with gastric cancer (Pye 2001). People with co‐morbidities, such as renal or cardiac disease, were excluded. For this reason, these findings are only applicable to people who fulfil the inclusion criteria of these studies and cannot be generalised to all people with gastric cancer. The number of studies representing Asian people with gastric cancer in this 2017 updated review has increased considerably, with now a total of 26 studies conducted at least in part in Asia (Boku 2009; Chen 2015; Dong 2014; Hironaka 2016; Huang 2013; Kang 2009; Kikuchi 1990; Kim 2001; Kim 2014; Koizumi 2008; Koizumi 2014; Komatsu 2011; KRGGC 1992; Li 2014; Li 2015; Li 2016; Lu 2014; Narahara 2011; Nishikawa 2012; Ohtsu 2003; Shirao 2013; Sugimoto 2014; Wang 2013; Wu 2015; Yamada 2015; Yamamura 1998). The largest number of Asian people was included in comparison 2. Asian people were clearly underrepresented in comparisons 3, 4, and 6. The example of S‐1, which is used in different doses in Caucasian (25 mg/m² twice daily) and Asian people (40 mg/m² twice daily) (Satoh 2014) confirms that chemotherapy regimens need to be tested in Asian and Caucasian populations separately, and that the balance between efficacy and toxicity of a given regimen might be different in different populations due in part to genetic differences (Syn 2015). Results from clinical studies are thus applicable only to those populations where they have been tested. Except for these limitations, the evidence cited above should be regarded as complete and applicable.
Quality of the evidence
This review included a total of 60 studies and 11,698 participants in the meta‐analysis for the primary outcome of overall survival. Seven of the 10 main comparisons for overall survival had low heterogeneity (I² < 20%), and even among comparisons with higher levels of inconsistency (I² > 20%), the amount of heterogeneity present was not statistically significant (P > 0.05). Hence, the pooled results can be considered to be relatively stable. The majority of studies had low risk of bias in terms of random sequence generation, blinding, incomplete efficacy or safety outcome data, and selective reporting. However, the risk of bias due to lack of independent or blinded radiological review and other sources of bias (see Risk of bias in included studies) are unclear or high in more than 50% of included studies; hence, these can be considered areas for improvement in future studies. The main reasons for downgrading of evidence in the 'Summary of findings' tables are due to lack of precision in pooled effect sizes, risk of bias (particularly, allocation bias), and statistical heterogeneity.
Potential biases in the review process
For this review, all reasonable effort has been made to reduce and address potential sources of bias, such as inclusion of studies not published in English, searches for unpublished and not fully published studies. Therefore, the likelihood that relevant studies have not been identified is considered as small. One factor with known impact on overall survival after first‐line chemotherapy is second‐line therapy, which is administered in up to 70% of some recent studies. However, as second‐line therapy is now a standard of care, it should not be considered as a source of bias.
Agreements and disagreements with other studies or reviews
Another meta‐analysis (Okines 2008), which summarised the results from two studies that used capecitabine instead of 5‐FU, confirmed a significant survival benefit for the people treated with capecitabine, thus lending further support to the use of capecitabine in people with gastric cancer.
We agree with the following key issues in the review by Garrido 2014: DCF is ‐ in terms of efficacy ‐ one of the most promising regimens in younger people with adequate general health. However, it is counterbalanced by significant toxicity, and other three‐drug regimens including docetaxel, 5‐FU, and oxaliplatin, such as FLOT or TEF (Van Cutsem 2015) are appropriate alternatives with better tolerability, and that either FOLFIRI or the combination of irinotecan and 5‐FU as described by Dank 2008 should also be considered among the most promising regimens on the basis of their significant impact on overall survival, the overall reduced toxicity and time to treatment failure as compared to three‐drug regimens (Guimbaud 2014), as well as the absence of cumulative toxicity. However, we would strongly advise not to use IFL (a combination of bolus 5‐FU and irinotecan) in view of the higher rate of treatment‐related deaths of this regimen in colorectal cancer (Hurwitz 2004). The conclusions of the review by Lordick 2014b "both doublet and triplet drug‐regimens can be used.....but careful consideration of the potential toxic complications, impairment of the person's quality of life, and the relative benefit should be undertaken". Lordick 2014a gives an excellent, more general overview of the current status and challenges in gastric cancer treatment. It addresses not only medical treatment (both chemotherapy and targeted therapies), but also the pathology and surgery. We agree with the main conclusions of the meta‐analysis published by the GASTRIC Group 2013 that the addition of experimental chemotherapeutic agents to pre‐existing control‐ or standard regimens have produced a modest improvement in overall survival and progression‐free survival, and that none of the regimens emerged as a clear standard. The meta‐analysis by Petrelli 2013 compared any two‐and three‐drug regimens that included CDDP with any regimen containing the same number of agents in which CDDP was replaced by oxaliplatin, CPT‐11 or a taxane, We agree with the observation that substitution of cisplatin by modern agents, such as oxaliplatin or irinotecan generally improves outcomes. We also agree with the analysis by (Chen 2013) that DCF has a better response‐rate than non‐taxane‐containing regimens, but disagree with their statement that chemotherapy‐related toxicity of DCF regimen is acceptable to some extent.

Study flow diagram: review update

'Risk of bias' summary: review authors' judgements about each risk of bias item for each included study.

'Risk of bias' graph: review authors' judgements about each risk of bias item presented as percentages across all included studies.

Comparison 1 Chemotherapy versus best supportive care, Outcome 1 Overall survival.

Comparison 1 Chemotherapy versus best supportive care, Outcome 2 Time to progression.

Comparison 2 Combination versus single‐agent chemotherapy, Outcome 1 Overall survival.

Comparison 2 Combination versus single‐agent chemotherapy, Outcome 2 Tumour response.
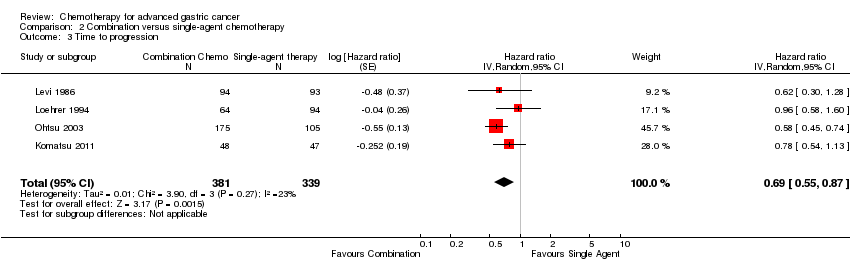
Comparison 2 Combination versus single‐agent chemotherapy, Outcome 3 Time to progression.

Comparison 2 Combination versus single‐agent chemotherapy, Outcome 4 Treatment‐related death.
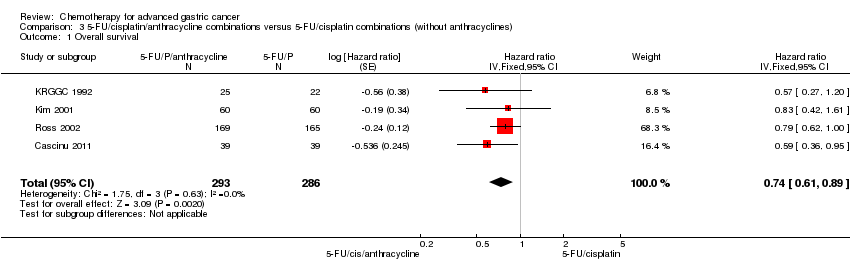
Comparison 3 5‐FU/cisplatin/anthracycline combinations versus 5‐FU/cisplatin combinations (without anthracyclines), Outcome 1 Overall survival.

Comparison 3 5‐FU/cisplatin/anthracycline combinations versus 5‐FU/cisplatin combinations (without anthracyclines), Outcome 2 Tumour response.

Comparison 3 5‐FU/cisplatin/anthracycline combinations versus 5‐FU/cisplatin combinations (without anthracyclines), Outcome 3 Time to progression.
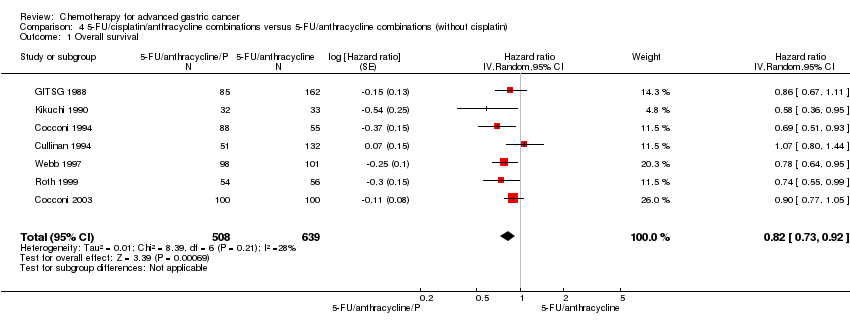
Comparison 4 5‐FU/cisplatin/anthracycline combinations versus 5‐FU/anthracycline combinations (without cisplatin), Outcome 1 Overall survival.

Comparison 5 Chemotherapy with irinotecan versus non‐irinotecan‐containing regimes, Outcome 1 Overall survival.

Comparison 5 Chemotherapy with irinotecan versus non‐irinotecan‐containing regimes, Outcome 2 Tumour response.

Comparison 5 Chemotherapy with irinotecan versus non‐irinotecan‐containing regimes, Outcome 3 Progression‐free survival.
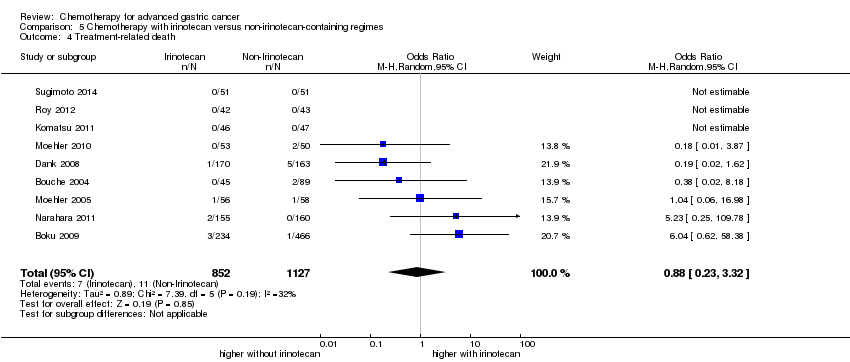
Comparison 5 Chemotherapy with irinotecan versus non‐irinotecan‐containing regimes, Outcome 4 Treatment‐related death.

Comparison 5 Chemotherapy with irinotecan versus non‐irinotecan‐containing regimes, Outcome 5 Treatment discontinuation due to toxicity.

Comparison 6 Chemotherapy with docetaxel versus non‐docetaxel‐containing regimes, Outcome 1 Overall survival.

Comparison 6 Chemotherapy with docetaxel versus non‐docetaxel‐containing regimes, Outcome 2 Tumour response.

Comparison 6 Chemotherapy with docetaxel versus non‐docetaxel‐containing regimes, Outcome 3 Time to progression.

Comparison 6 Chemotherapy with docetaxel versus non‐docetaxel‐containing regimes, Outcome 4 Progression‐free survival.

Comparison 6 Chemotherapy with docetaxel versus non‐docetaxel‐containing regimes, Outcome 5 Treatment‐related death.
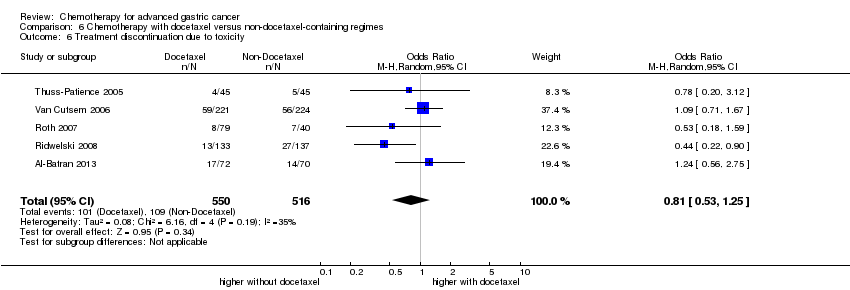
Comparison 6 Chemotherapy with docetaxel versus non‐docetaxel‐containing regimes, Outcome 6 Treatment discontinuation due to toxicity.

Comparison 7 Chemotherapy with capecitabine versus 5‐FU‐containing regimes, Outcome 1 Overall Survival.
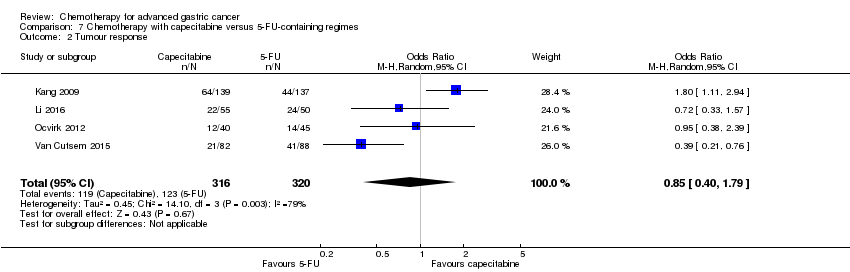
Comparison 7 Chemotherapy with capecitabine versus 5‐FU‐containing regimes, Outcome 2 Tumour response.

Comparison 7 Chemotherapy with capecitabine versus 5‐FU‐containing regimes, Outcome 3 Time to progression.

Comparison 7 Chemotherapy with capecitabine versus 5‐FU‐containing regimes, Outcome 4 Progression‐free survival.

Comparison 7 Chemotherapy with capecitabine versus 5‐FU‐containing regimes, Outcome 5 Treatment‐related death.

Comparison 7 Chemotherapy with capecitabine versus 5‐FU‐containing regimes, Outcome 6 Treatment discontinuation due to toxicity.
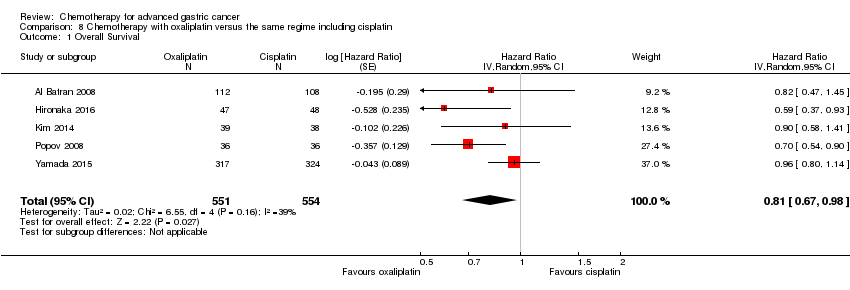
Comparison 8 Chemotherapy with oxaliplatin versus the same regime including cisplatin, Outcome 1 Overall Survival.
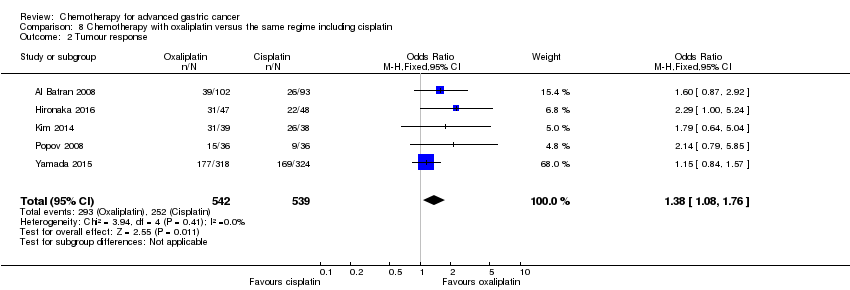
Comparison 8 Chemotherapy with oxaliplatin versus the same regime including cisplatin, Outcome 2 Tumour response.

Comparison 8 Chemotherapy with oxaliplatin versus the same regime including cisplatin, Outcome 3 Progression‐free survival.

Comparison 8 Chemotherapy with oxaliplatin versus the same regime including cisplatin, Outcome 4 Treatment‐related death.

Comparison 8 Chemotherapy with oxaliplatin versus the same regime including cisplatin, Outcome 5 Treatment discontinuation due to toxicity.

Comparison 9 Taxane‐platinum‐fluoropyrimidine combinations versus taxane‐platinum (without fluoropyrimidine), Outcome 1 Overall survival.

Comparison 9 Taxane‐platinum‐fluoropyrimidine combinations versus taxane‐platinum (without fluoropyrimidine), Outcome 2 Tumour response.
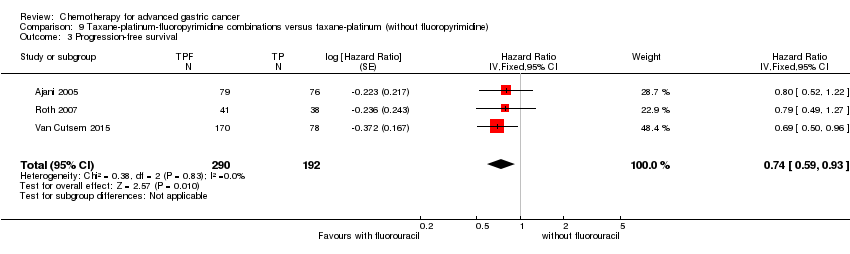
Comparison 9 Taxane‐platinum‐fluoropyrimidine combinations versus taxane‐platinum (without fluoropyrimidine), Outcome 3 Progression‐free survival.
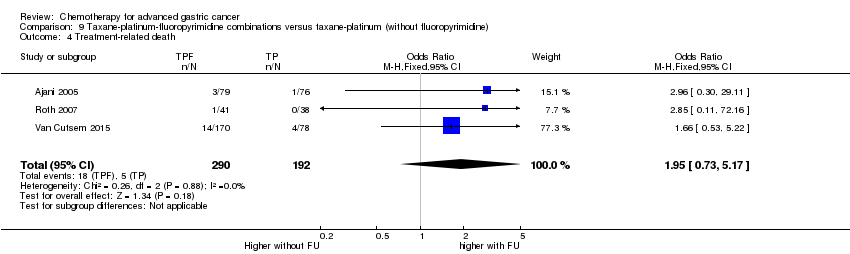
Comparison 9 Taxane‐platinum‐fluoropyrimidine combinations versus taxane‐platinum (without fluoropyrimidine), Outcome 4 Treatment‐related death.
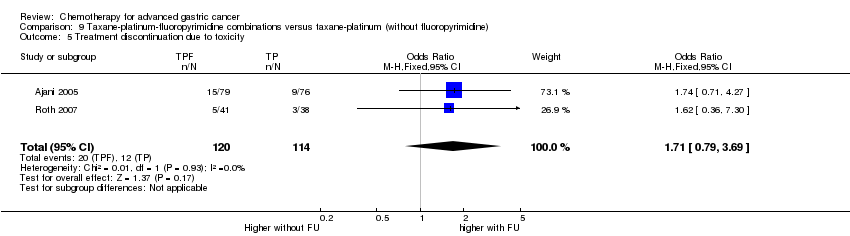
Comparison 9 Taxane‐platinum‐fluoropyrimidine combinations versus taxane‐platinum (without fluoropyrimidine), Outcome 5 Treatment discontinuation due to toxicity.

Comparison 10 S‐1 versus 5‐FU‐containing regimes, Outcome 1 Overall Survival.

Comparison 10 S‐1 versus 5‐FU‐containing regimes, Outcome 2 Tumour response.

Comparison 10 S‐1 versus 5‐FU‐containing regimes, Outcome 3 Progression‐free survival.

Comparison 10 S‐1 versus 5‐FU‐containing regimes, Outcome 4 Time‐to treatment failure.
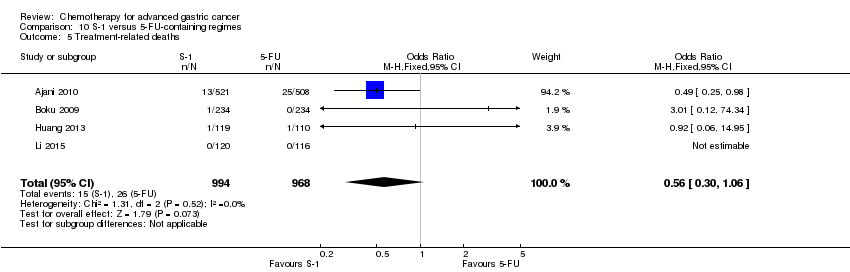
Comparison 10 S‐1 versus 5‐FU‐containing regimes, Outcome 5 Treatment‐related deaths.
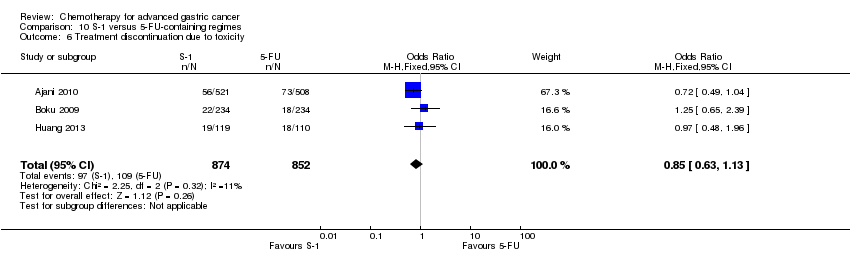
Comparison 10 S‐1 versus 5‐FU‐containing regimes, Outcome 6 Treatment discontinuation due to toxicity.
| Chemotherapy versus best supportive care for advanced gastric cancer | ||||||
| Patient or population: people with advanced gastric cancer Control: best supportive care alone | ||||||
| Outcomes | Illustrative comparative risks* (95% CI) | Relative effect | No of Participants | Quality of the evidence | Comments | |
| Assumed risk | Corresponding risk | |||||
| Best supportive care | Chemotherapy | |||||
| Overall survival | Study population | HR 0.37 | 184 | ⊕⊕⊕⊝ | Weighted average of median survival durations from included studies | |
| 4.3 months | 11.0 months | |||||
| Time to progression | Study population | HR 0.31 | 144 | ⊕⊕⊕⊝ | Weighted average of median survival durations from included studies | |
| 2.5 months | 7.4 months | |||||
| *For time‐to‐event outcomes, e.g. overall survival, the assumed and corresponding risks were obtained by calculating the weighted average of the median survival durations reported in included studies. For dichotomous outcomes, the assumed and corresponding risks (and their 95% confidence interval) are based on proportions of events in the control and intervention groups respectively. | ||||||
| GRADE Working Group grades of evidence | ||||||
| 1 Early termination of Pyrhönen 1995; downgraded by one level for risk of bias. Outcomes shown include those which were measured in the studies, or reported in a consistent fashion across included studies. Several critical outcomes (e.g. tumour response, treatment‐related death, and discontinuation due to toxicity) were not evaluated or reported in a consistent fashion in these studies, as they were mainly conducted before year 2000. | ||||||
| Combination versus single‐agent chemotherapy for advanced gastric cancer | ||||||
| Patient or population: people with advanced gastric cancer Control: single‐agent chemotherapy | ||||||
| Outcomes | Illustrative comparative risks* (95% CI) | Relative effect | No of Participants | Quality of the evidence | Comments | |
| Assumed risk | Corresponding risk | |||||
| Single‐agent chemotherapy | Combination | |||||
| Overall survival | Study population | HR 0.84 | 4447 | ⊕⊕⊕⊝ | Weighted average of median survival durations from included studies | |
|
|
| |||||
| Tumour response | Study population | OR 2.30 | 2833 | ⊕⊕⊕⊕ | ||
| 226 per 1000 | 402 per 1000 | |||||
| Moderate | ||||||
| 231 per 1000 | 409 per 1000 | |||||
| Time to progression | Study population | HR 0.69 | 720 | ⊕⊕⊕⊝ | Weighted average of median survival durations from included studies | |
| 2.8 months | 4.1 months | |||||
| Treatment‐related death | Study population | OR 1.64 | 3876 | ⊕⊕⊝⊝ | ||
| 5 per 1000 | 9 per 1000 | |||||
| Moderate | ||||||
| 0 per 1000 | 0 per 1000 | |||||
| *For time‐to‐event outcomes, e.g. overall survival, the assumed and corresponding risks were obtained by calculating the weighted average of the median survival durations reported in included studies. For dichotomous outcomes, the assumed and corresponding risks (and their 95% confidence interval) are based on proportions of events in the control and intervention groups respectively. | ||||||
| GRADE Working Group grades of evidence | ||||||
| 1 Downgraded by one level for risk of bias. | ||||||
| 5‐FU/cisplatin/anthracycline combinations versus 5‐FU/cisplatin combinations (without anthracyclines) for advanced gastric cancer | ||||||
| Patient or population: people with advanced gastric cancer Control: 5‐FU/cisplatin combinations (without anthracyclines) | ||||||
| Outcomes | Illustrative comparative risks* (95% CI) | Relative effect | No of Participants | Quality of the evidence | Comments | |
| Assumed risk | Corresponding risk | |||||
| 5‐FU/cisplatin combinations (without anthracyclines) | 5‐FU/cisplatin/anthracycline combinations | |||||
| Overall survival | Study population | HR 0.74 | 579 | ⊕⊕⊕⊝ | Weighted average of median survival durations from included studies | |
| 8.6 months | 9.9 months | |||||
| Tumour response | Study population | OR 2.86 | 78 | ⊕⊕⊝⊝ | ||
| 385 per 1000 | 641 per 1000 | |||||
| Moderate | ||||||
| 385 per 1000 | 642 per 1000 | |||||
| Time to progression | Study population | HR 0.62 | 78 | ⊕⊕⊝⊝ | Median survival durations from the only included study | |
| 7.9 months | 12.1 months | |||||
| *For time‐to‐event outcomes, e.g. overall survival, the assumed and corresponding risks were obtained by calculating the weighted average of the median survival durations reported in included studies. For dichotomous outcomes, the assumed and corresponding risks (and their 95% confidence interval) are based on proportions of events in the control and intervention groups respectively. | ||||||
| GRADE Working Group grades of evidence | ||||||
| 1 Downgraded by one level for risk of bias. Outcomes shown include those which were measured in the studies, or reported in a consistent fashion across included studies. Several critical outcomes (e.g. treatment‐related death and discontinuation due to toxicity) were not evaluated or reported in a consistent fashion in these studies, as they were mainly conducted before year 2000. | ||||||
| 5‐FU/cisplatin/anthracycline combinations versus 5‐FU/anthracycline combinations (without cisplatin) for advanced gastric cancer | ||||||
| Patient or population: people with advanced gastric cancer Control: 5‐FU/cisplatin combinations (without anthracyclines) | ||||||
| Outcomes | Illustrative comparative risks* (95% CI) | Relative effect | No of Participants | Quality of the evidence | Comments | |
| Assumed risk | Corresponding risk | |||||
| 5‐FU/anthracycline combinations (without cisplatin) | 5‐FU/cisplatin/anthracycline combinations | |||||
| Overall survival | Study population | HR 0.82 | 1147 | ⊕⊕⊝⊝ | Weighted average of median survival durations from included studies | |
| 6.2 months | 8.4 months | |||||
| *For time‐to‐event outcomes, e.g. overall survival, the assumed and corresponding risks were obtained by calculating the weighted average of the median survival durations reported in included studies. For dichotomous outcomes, the assumed and corresponding risks (and their 95% confidence interval) are based on proportions of events in the control and intervention groups respectively. | ||||||
| GRADE Working Group grades of evidence | ||||||
| 1 Downgraded by one level for risk of bias. Several critical outcomes (i.e. tumour response, progression‐free survival, treatment‐related death and discontinuation due to toxicity) were not evaluated or reported in a consistent fashion in these studies, most of which were conducted before year 2000. | ||||||
| Irinotecan versus non‐irinotecan‐containing regimens for advanced gastric cancer | ||||||
| Patient or population: people with advanced gastric cancer Control: non‐irinotecan‐containing regimens | ||||||
| Outcomes | Illustrative comparative risks* (95% CI) | Relative effect | No of Participants | Quality of the evidence | Comments | |
| Assumed risk | Corresponding risk | |||||
| Non‐irinotecan‐containing regimens | Chemotherapy with Irinotecan | |||||
| Overall survival | Study population | HR 0.87 | 2135 | ⊕⊕⊕⊝ | Weighted average of median survival durations from included studies | |
| 9.7 months | 11.3 months | |||||
| Overall survival ‐ Substitutive comparisons | Study population | HR 0.87 (0.75 to 1.00) | 826 | ⊕⊕⊕⊝ | Weighted average of median survival durations from included studies | |
| 9.1 months | 9.9 months | |||||
| Overall survival ‐ Additive comparisons | Study population | HR 0.88 | 500 | ⊕⊕⊝⊝ | Weighted average of median survival durations from included studies | |
| 10.9 months | 11.9 months | |||||
| Overall survival ‐ Other comparisons | Study population | HR 0.87 | 809 | ⊕⊝⊝⊝ | Weighted average of median survival durations from included studies | |
| 11.4 months | 12.6 months | |||||
| Tumour response | Study population | OR 1.72 (1.24 to 2.40) | 1266 | ⊕⊕⊝⊝ | ||
| 288 per 1000 | 410 per 1000 | |||||
| Moderate | ||||||
| 275 per 1000 | 395 per 1000 | |||||
| Tumour response ‐ Substitutive comparisons | Study population | OR 1.53 (0.93 to 2.50) | 756 | ⊕⊕⊝⊝ | ||
| 297 per 1000 | 393 per 1000 | |||||
| Moderate | ||||||
| 294 per 1000 | 389 per 1000 | |||||
| Tumour response ‐ Additive comparisons | Study population | OR 2.18 (1.25 to 3.80) | 345 | ⊕⊕⊝⊝ | ||
| 224 per 1000 | 386 per 1000 | |||||
| Moderate | ||||||
| 219 per 1000 | 379 per 1000 | |||||
| Tumour response ‐ Other comparisons | Study population | OR 1.87 | 165 | ⊕⊝⊝⊝ | ||
| 376 per 1000 | 530 per 1000 | |||||
| Moderate | ||||||
| 367 per 1000 | 520 per 1000 | |||||
| Progression‐free survival | Study population | HR 0.76 (0.69 to 0.84) | 1640 | ⊕⊕⊕⊕ | Weighted average of median survival durations from included studies | |
| 4.4 months | 5.9 months | |||||
| Progression‐free survival ‐ Substitutive comparison | Study population | HR 0.85 (0.72 to 1.00) | 741 | ⊕⊕⊕⊝ | Weighted average of median survival durations from included studies | |
| 4.2 months | 5.3 months | |||||
| Progression‐free survival ‐ Additive comparisons | Study population | HR 0.51 | 90 | ⊕⊕⊕⊝ | Median survival durations from the only included study | |
| 3.2 months | 6.9 months | |||||
| Progression‐free survival ‐ Other comparisons | Study population | HR 0.74 (0.66 to 0.84) | 809 | ⊕⊕⊕⊕ | Weighted average of median survival durations from included studies | |
| 5.4 months | 6.6 months | |||||
| Treatment‐related death | Study population | OR 0.88 (0.23 to 3.32) | 1979 | ⊕⊕⊝⊝ | ||
| 10 per 1000 | 9 per 1000 | |||||
| Moderate | ||||||
| 2 per 1000 | 2 per 1000 | |||||
| Treatment discontinuation due to toxicity | Study population | OR 1.00 (0.46 to 2.20) | 1979 | ⊕⊝⊝⊝ | ||
| 137 per 1000 | 137 per 1000 | |||||
| Moderate | ||||||
| 215 per 1000 | 215 per 1000 | |||||
| *For time‐to‐event outcomes, e.g. overall survival, the assumed and corresponding risks were obtained by calculating the weighted average of the median survival durations reported in included studies. For dichotomous outcomes, the assumed and corresponding risks (and their 95% confidence interval) are based on proportions of events in the control and intervention groups respectively. | ||||||
| GRADE Working Group grades of evidence | ||||||
| 1 Downgraded by one level for risk of bias. | ||||||
| Docetaxel versus non‐docetaxel‐containing regimens for advanced gastric cancer | ||||||
| Patient or population: people with advanced gastric cancer Control: non‐docetaxel‐containing regimens | ||||||
| Outcomes | Illustrative comparative risks* (95% CI) | Relative effect | No of Participants | Quality of the evidence | Comments | |
| Assumed risk | Corresponding risk | |||||
| Non‐docetaxel‐containing regimens | Chemotherapy with docetaxel | |||||
| Overall survival | Study population | HR 0.86 (0.78 to 0.95) | 2001 | ⊕⊕⊕⊕ | Weighted average of median survival durations from included studies | |
| 9.9 months | 11.2 months | |||||
| Overall survival ‐ Substitutive comparisons | Study population | HR 1.05 (0.87 to 1.27) | 479 | ⊕⊕⊕⊝ | Weighted average of median survival durations from included studies | |
| 9.4 months | 9.2 months | |||||
| Overall survival ‐ Additive comparisons | Study population | HR 0.80 (0.71 to 0.91) | 1466 | ⊕⊕⊕⊝ | Weighted average of median survival durations from included studies | |
| 10.6 months | 12.3 months | |||||
| Overall survival ‐ Other comparisons | Study population | HR 0.80 (0.46 to 1.39) | 56 | ⊕⊝⊝⊝ | Median survival durations from the only included study | |
| 9.5 months | 11.9 months | |||||
| Tumour response | Study population | OR 1.37 (1.03 to 1.83) | 1820 | ⊕⊕⊕⊝ | ||
| 311 per 1000 | 382 per 1000 | |||||
| Moderate | ||||||
| 310 per 1000 | 381 per 1000 | |||||
| Tumour response ‐ Substitutive comparison | Study population | OR 1.03 (0.71 to 1.50) | 525 | ⊕⊕⊕⊝ | ||
| 314 per 1000 | 320 per 1000 | |||||
| Moderate | ||||||
| 327 per 1000 | 334 per 1000 | |||||
| Tumour response ‐ Additive comparison | Study population | OR 1.83 (1.45 to 2.32) | 1235 | ⊕⊕⊕⊕ | ||
| 295 per 1000 | 434 per 1000 | |||||
| Moderate | ||||||
| 296 per 1000 | 435 per 1000 | |||||
| Tumour response ‐ Other comparison | Study population | OR 0.33 (0.12 to 0.96) | 60 | ⊕⊝⊝⊝ | ||
| 600 per 1000 | 331 per 1000 | |||||
| Moderate | ||||||
| 600 per 1000 | 331 per 1000 | |||||
| Time to progression | Study population | HR 1.06 (0.85 to 1.32) | 360 | ⊕⊝⊝⊝ | Weighted average of median survival durations from included studies | |
| 6.0 months | 5.9 months | |||||
| Progression‐free survival | Study population | HR 0.76 (0.63 to 0.91) | 1498 | ⊕⊕⊕⊝ | Weighted average of median survival durations from included studies | |
| 4.8 months | 6.0 months | |||||
| Progression‐free survival ‐ Substitutive comparisons | Study population | HR 1.15 (0.77 to 1.72) | 119 | ⊕⊝⊝⊝ | Median survival durations from the only included study | |
| 4.9 months | 4.6 months | |||||
| Progression‐free survival ‐ Additive comparison | Study population | HR 0.70 (0.61 to 0.81) | 1323 | ⊕⊕⊕⊕ | Weighted average of median survival durations from included studies | |
| 4.3 months | 6.0 months | |||||
| Progression‐free survival ‐ Other comparison | Study population | HR 0.94 (0.55 to 1.60) | 56 | ⊕⊝⊝⊝ | Median survival durations from the only included study | |
| 6.4 months | 6.8 months | |||||
| Treatment‐related death | Study population | OR 1.10 | 2113 | ⊕⊕⊕⊝ | ||
| 12 per 1000 | 14 per 1000 | |||||
| Moderate | ||||||
| 5 per 1000 | 5 per 1000 | |||||
| Treatment discontinuation due to toxicity | Study population | OR 0.81 (0.53 to 1.25) | 1066 | ⊕⊕⊝⊝ | ||
| 211 per 1000 | 178 per 1000 | |||||
| Moderate | ||||||
| 197 per 1000 | 166 per 1000 | |||||
| *For time‐to‐event outcomes, e.g. overall survival, the assumed and corresponding risks were obtained by calculating the weighted average of the median survival durations reported in included studies. For dichotomous outcomes, the assumed and corresponding risks (and their 95% confidence interval) are based on proportions of events in the control and intervention groups respectively. | ||||||
| GRADE Working Group grades of evidence | ||||||
| 1 Downgraded by one level for imprecision. | ||||||
| Capecitabine versus 5‐FU‐containing regimens for advanced gastric cancer | ||||||
| Patient or population: people with advanced gastric cancer Control: 5‐FU‐containing regimens | ||||||
| Outcomes | Illustrative comparative risks* (95% CI) | Relative effect | No of Participants | Quality of the evidence | Comments | |
| Assumed risk | Corresponding risk | |||||
| 5‐FU‐containing regimens | Capecitabine‐containing regimens | |||||
| Overall Survival | Study population | HR 0.94 (0.79 to 1.11) | 732 | ⊕⊕⊕⊝ | Weighted average of median survival durations from included studies | |
| 10.9 months | 10.8 months | |||||
| Tumour response | Study population | OR 0.85 (0.40 to 1.79) | 636 | ⊕⊝⊝⊝ | ||
| 384 per 1000 | 347 per 1000 | |||||
| Moderate | ||||||
| 394 per 1000 | 356 per 1000 | |||||
| Time to progression | Study population | HR 0.72 (0.47 to 1.12) | 85 | ⊕⊝⊝⊝ | Median survival durations from the only included study | |
| 5.5 months | 6.8 months | |||||
| Progression‐free survival | Study population | HR 0.98 (0.77 to 1.23) | 647 | ⊕⊝⊝⊝ | Weighted average of median survival durations from included studies | |
| 6.7 months | 6.5 months | |||||
| Treatment‐related death | Study population | OR 1.88 (0.23 to 15.15) | 481 | ⊕⊝⊝⊝ | ||
| 21 per 1000 | 38 per 1000 | |||||
| Moderate | ||||||
| 24 per 1000 | 44 per 1000 | |||||
| Treatment discontinuation due to toxicity | Study population | OR 0.99 (0.56 to 1.77) | 311 | ⊕⊕⊝⊝ | ||
| 181 per 1000 | 179 per 1000 | |||||
| Moderate | ||||||
| 181 per 1000 | 180 per 1000 | |||||
| *For time‐to‐event outcomes, e.g. overall survival, the assumed and corresponding risks were obtained by calculating the weighted average of the median survival durations reported in included studies. For dichotomous outcomes, the assumed and corresponding risks (and their 95% confidence interval) are based on proportions of events in the control and intervention groups respectively. | ||||||
| GRADE Working Group grades of evidence | ||||||
| 1 Downgraded by one level for risk of bias. | ||||||
| Oxaliplatin versus the same regimen including cisplatin for advanced gastric cancer | ||||||
| Patient or population: people with advanced gastric cancer Control: the same regimen including cisplatin | ||||||
| Outcomes | Illustrative comparative risks* (95% CI) | Relative effect | No of Participants | Quality of the evidence | Comments | |
| Assumed risk | Corresponding risk | |||||
| Cisplatin‐containing regimen | Oxaliplatin‐containing regimen | |||||
| Overall Survival | Study population | HR 0.81 (0.67 to 0.98) | 1105 | ⊕⊕⊝⊝ | Weighted average of median survival durations from included studies | |
| 11.3 months | 14.0 months | |||||
| Tumour response | Study population | OR 1.38 (1.08 to 1.76) | 1081 | ⊕⊕⊕⊝ | ||
| 468 per 1000 | 548 per 1000 | |||||
| Moderate | ||||||
| 458 per 1000 | 538 per 1000 | |||||
| Progression‐free survival | Study population | HR 0.88 (0.66 to 1.19) | 1034 | ⊕⊕⊝⊝ | Weighted average of median survival durations from included studies | |
| 4.9 months | 6.0 months | |||||
| Treatment‐related death | Study population | OR 0.47 (0.17 to 1.30) | 1132 | ⊕⊕⊝⊝ | ||
| 20 per 1000 | 9 per 1000 | |||||
| Moderate | ||||||
| 24 per 1000 | 11 per 1000 | |||||
| Treatment discontinuation due to toxicity | Study population | OR 0.97 (0.44 to 2.13) | 970 | ⊕⊝⊝⊝ | ||
| 95 per 1000 | 93 per 1000 | |||||
| Moderate | ||||||
| 102 per 1000 | 99 per 1000 | |||||
| *For time‐to‐event outcomes, e.g. overall survival, the assumed and corresponding risks were obtained by calculating the weighted average of the median survival durations reported in included studies. For dichotomous outcomes, the assumed and corresponding risks (and their 95% confidence interval) are based on proportions of events in the control and intervention groups respectively. | ||||||
| GRADE Working Group grades of evidence | ||||||
| 1 Downgraded by one level for risk of bias. | ||||||
| Taxane‐platinum‐fluoropyrimidine combinations versus taxane‐platinum (without fluoropyrimidine) for advanced gastric cancer | ||||||
| Patient or population: people with advanced gastric cancer Control: taxane‐platinum (without fluoropyrimidine) | ||||||
| Outcomes | Illustrative comparative risks* (95% CI) | Relative effect | No of Participants | Quality of the evidence | Comments | |
| Assumed risk | Corresponding risk | |||||
| Taxane‐platinum (without fluoropyrimidine) | Taxane‐platinum‐fluoropyrimidine combination | |||||
| Overall survival | Study population | OR 0.86 | 482 | ⊕⊝⊝⊝ | Weighted average of median survival durations from included studies | |
| 10.0 months | 11.7 months | |||||
| Tumour response | Study population | OR 2.08 | 482 | ⊕⊕⊝⊝ | ||
| 234 per 1000 | 389 per 1000 | |||||
| Moderate | ||||||
| 231 per 1000 | 385 per 1000 | |||||
| Progression‐free survival | Study population | OR 0.74 | 482 | ⊕⊕⊕⊝ | Weighted average of median survival durations from included studies | |
| 4.4 months | 5.7 months | |||||
| Treatment‐related death | Study population | OR 1.95 | 482 | ⊕⊝⊝⊝ | ||
| 26 per 1000 | 50 per 1000 | |||||
| Moderate | ||||||
| 13 per 1000 | 25 per 1000 | |||||
| Treatment discontinuation due to toxicity | Study population | OR 1.71 | 234 | ⊕⊝⊝⊝ | ||
| 105 per 1000 | 167 per 1000 | |||||
| Moderate | ||||||
| 99 per 1000 | 158 per 1000 | |||||
| *For time‐to‐event outcomes, e.g. overall survival, the assumed and corresponding risks were obtained by calculating the weighted average of the median survival durations reported in included studies. For dichotomous outcomes, the assumed and corresponding risks (and their 95% confidence interval) are based on proportions of events in the control and intervention groups respectively. | ||||||
| GRADE Working Group grades of evidence | ||||||
| 1 Downgraded by one level for risk of bias. | ||||||
| S‐1 versus 5‐FU‐containing regimens for advanced gastric cancer | ||||||
| Patient or population: people with advanced gastric cancer Control: 5‐FU‐containing regimens | ||||||
| Outcomes | Illustrative comparative risks* (95% CI) | Relative effect | No of Participants | Quality of the evidence | Comments | |
| Assumed risk | Corresponding risk | |||||
| 5‐FU‐containing regimens | S‐1 containing regimens | |||||
| Overall Survival | Study population | HR 0.91 | 1793 | ⊕⊕⊕⊕ | Weighted average of median survival durations from included studies | |
| 9.1 months | 9.6 months | |||||
| Tumour response | Study population | OR 1.73 | 1753 | ⊕⊝⊝⊝ | ||
| 256 per 1000 | 374 per 1000 | |||||
| Moderate | ||||||
| 320 per 1000 | 449 per 1000 | |||||
| Progression‐free survival | Study population | HR 0.85 | 1942 | ⊕⊕⊝⊝ | Weighted average of median survival durations from included studies | |
| 4.3 months | 5.0 months | |||||
| Time‐to treatment failure | Study population | HR 0.88 | 1818 | ⊕⊕⊝⊝ | Weighted average of median survival durations from included studies | |
| 3.1 months | 3.9 months | |||||
| Treatment‐related deaths | Study population | OR 0.56 | 1962 | ⊕⊕⊕⊝ | ||
| 27 per 1000 | 15 per 1000 | |||||
| Moderate | ||||||
| 5 per 1000 | 3 per 1000 | |||||
| Treatment discontinuation due to toxicity | Study population | OR 0.85 | 1726 | ⊕⊕⊕⊕ | ||
| 128 per 1000 | 111 per 1000 | |||||
| Moderate | ||||||
| 144 per 1000 | 125 per 1000 | |||||
| *For time‐to‐event outcomes, e.g. overall survival, the assumed and corresponding risks were obtained by calculating the weighted average of the median survival durations reported in included studies. For dichotomous outcomes, the assumed and corresponding risks (and their 95% confidence interval) are based on proportions of events in the control and intervention groups respectively. | ||||||
| GRADE Working Group grades of evidence | ||||||
| 1 Downgraded by two levels for severe statistical heterogeneity. | ||||||
| Outcome or subgroup title | No. of studies | No. of participants | Statistical method | Effect size |
| 1 Overall survival Show forest plot | 3 | 184 | Hazard ratio (Random, 95% CI) | 0.37 [0.24, 0.55] |
| 2 Time to progression Show forest plot | 2 | 144 | Hazard ratio (Fixed, 95% CI) | 0.31 [0.22, 0.43] |
| Outcome or subgroup title | No. of studies | No. of participants | Statistical method | Effect size |
| 1 Overall survival Show forest plot | 23 | 4447 | Hazard ratio (Fixed, 95% CI) | 0.84 [0.79, 0.89] |
| 2 Tumour response Show forest plot | 18 | 2833 | Odds Ratio (M‐H, Fixed, 95% CI) | 2.30 [1.94, 2.72] |
| 3 Time to progression Show forest plot | 4 | 720 | Hazard ratio (Random, 95% CI) | 0.69 [0.55, 0.87] |
| 4 Treatment‐related death Show forest plot | 18 | 3876 | Odds Ratio (M‐H, Fixed, 95% CI) | 1.64 [0.83, 3.24] |
| Outcome or subgroup title | No. of studies | No. of participants | Statistical method | Effect size |
| 1 Overall survival Show forest plot | 4 | 579 | Hazard ratio (Fixed, 95% CI) | 0.74 [0.61, 0.89] |
| 2 Tumour response Show forest plot | 1 | Odds Ratio (M‐H, Fixed, 95% CI) | Subtotals only | |
| 3 Time to progression Show forest plot | 1 | Hazard Ratio (Fixed, 95% CI) | Subtotals only | |
| Outcome or subgroup title | No. of studies | No. of participants | Statistical method | Effect size |
| 1 Overall survival Show forest plot | 7 | 1147 | Hazard ratio (Random, 95% CI) | 0.82 [0.73, 0.92] |
| Outcome or subgroup title | No. of studies | No. of participants | Statistical method | Effect size |
| 1 Overall survival Show forest plot | 10 | 2135 | Hazard Ratio (Fixed, 95% CI) | 0.87 [0.80, 0.95] |
| 1.1 Substitutive comparisons | 6 | 826 | Hazard Ratio (Fixed, 95% CI) | 0.87 [0.75, 1.00] |
| 1.2 Additive comparisons | 3 | 500 | Hazard Ratio (Fixed, 95% CI) | 0.88 [0.76, 1.03] |
| 1.3 Other comparisons | 2 | 809 | Hazard Ratio (Fixed, 95% CI) | 0.87 [0.76, 1.00] |
| 2 Tumour response Show forest plot | 10 | 1266 | Odds Ratio (M‐H, Random, 95% CI) | 1.72 [1.24, 2.40] |
| 2.1 Substitutive comparisons | 6 | 756 | Odds Ratio (M‐H, Random, 95% CI) | 1.53 [0.93, 2.50] |
| 2.2 Additive comparisons | 3 | 345 | Odds Ratio (M‐H, Random, 95% CI) | 2.18 [1.25, 3.80] |
| 2.3 Other Comparisons | 2 | 165 | Odds Ratio (M‐H, Random, 95% CI) | 1.87 [0.89, 3.91] |
| 3 Progression‐free survival Show forest plot | 7 | 1640 | Hazard Ratio (Fixed, 95% CI) | 0.76 [0.69, 0.84] |
| 3.1 Substitutive comparison | 5 | 741 | Hazard Ratio (Fixed, 95% CI) | 0.85 [0.72, 1.00] |
| 3.2 Additive comparisons | 1 | 90 | Hazard Ratio (Fixed, 95% CI) | 0.51 [0.33, 0.77] |
| 3.3 Other comparisons | 2 | 809 | Hazard Ratio (Fixed, 95% CI) | 0.74 [0.66, 0.84] |
| 4 Treatment‐related death Show forest plot | 9 | 1979 | Odds Ratio (M‐H, Random, 95% CI) | 0.88 [0.23, 3.32] |
| 5 Treatment discontinuation due to toxicity Show forest plot | 9 | 1979 | Odds Ratio (M‐H, Random, 95% CI) | 1.00 [0.46, 2.20] |
| Outcome or subgroup title | No. of studies | No. of participants | Statistical method | Effect size |
| 1 Overall survival Show forest plot | 8 | 2001 | Hazard Ratio (Fixed, 95% CI) | 0.86 [0.78, 0.95] |
| 1.1 Substitutive comparisons | 3 | 479 | Hazard Ratio (Fixed, 95% CI) | 1.05 [0.87, 1.27] |
| 1.2 Additive comparisons | 4 | 1466 | Hazard Ratio (Fixed, 95% CI) | 0.80 [0.71, 0.91] |
| 1.3 Other comparisons | 1 | 56 | Hazard Ratio (Fixed, 95% CI) | 0.80 [0.46, 1.39] |
| 2 Tumour response Show forest plot | 9 | 1820 | Odds Ratio (M‐H, Random, 95% CI) | 1.37 [1.03, 1.83] |
| 2.1 Substitutive comparison | 4 | 525 | Odds Ratio (M‐H, Random, 95% CI) | 1.03 [0.71, 1.50] |
| 2.2 Additive comparison | 4 | 1235 | Odds Ratio (M‐H, Random, 95% CI) | 1.83 [1.45, 2.32] |
| 2.3 Other comparisons | 1 | 60 | Odds Ratio (M‐H, Random, 95% CI) | 0.33 [0.12, 0.96] |
| 3 Time to progression Show forest plot | 2 | 360 | Hazard Ratio (Random, 95% CI) | 1.06 [0.85, 1.32] |
| 4 Progression‐free survival Show forest plot | 5 | 1498 | Hazard Ratio (Random, 95% CI) | 0.76 [0.63, 0.91] |
| 4.1 Substitutive comparisons | 1 | 119 | Hazard Ratio (Random, 95% CI) | 1.15 [0.77, 1.72] |
| 4.2 Additive comparison (PFS) | 3 | 1323 | Hazard Ratio (Random, 95% CI) | 0.70 [0.61, 0.81] |
| 4.3 Other comparisons | 1 | 56 | Hazard Ratio (Random, 95% CI) | 0.94 [0.55, 1.60] |
| 5 Treatment‐related death Show forest plot | 7 | 2113 | Odds Ratio (M‐H, Fixed, 95% CI) | 1.10 [0.55, 2.20] |
| 6 Treatment discontinuation due to toxicity Show forest plot | 5 | 1066 | Odds Ratio (M‐H, Random, 95% CI) | 0.81 [0.53, 1.25] |
| Outcome or subgroup title | No. of studies | No. of participants | Statistical method | Effect size |
| 1 Overall Survival Show forest plot | 5 | 732 | Hazard Ratio (Fixed, 95% CI) | 0.94 [0.79, 1.11] |
| 2 Tumour response Show forest plot | 4 | 636 | Odds Ratio (M‐H, Random, 95% CI) | 0.85 [0.40, 1.79] |
| 3 Time to progression Show forest plot | 1 | Hazard Ratio (Fixed, 95% CI) | Subtotals only | |
| 4 Progression‐free survival Show forest plot | 4 | 647 | Hazard Ratio (Random, 95% CI) | 0.98 [0.77, 1.23] |
| 5 Treatment‐related death Show forest plot | 2 | 481 | Odds Ratio (M‐H, Random, 95% CI) | 1.88 [0.23, 15.15] |
| 6 Treatment discontinuation due to toxicity Show forest plot | 1 | Odds Ratio (M‐H, Fixed, 95% CI) | Subtotals only | |
| Outcome or subgroup title | No. of studies | No. of participants | Statistical method | Effect size |
| 1 Overall Survival Show forest plot | 5 | 1105 | Hazard Ratio (Random, 95% CI) | 0.81 [0.67, 0.98] |
| 2 Tumour response Show forest plot | 5 | 1081 | Odds Ratio (M‐H, Fixed, 95% CI) | 1.38 [1.08, 1.76] |
| 3 Progression‐free survival Show forest plot | 4 | 1034 | Hazard Ratio (Random, 95% CI) | 0.88 [0.66, 1.19] |
| 4 Treatment‐related death Show forest plot | 5 | 1132 | Odds Ratio (M‐H, Fixed, 95% CI) | 0.47 [0.17, 1.30] |
| 5 Treatment discontinuation due to toxicity Show forest plot | 3 | 970 | Odds Ratio (M‐H, Random, 95% CI) | 0.97 [0.44, 2.13] |
| Outcome or subgroup title | No. of studies | No. of participants | Statistical method | Effect size |
| 1 Overall survival Show forest plot | 3 | 482 | Hazard Ratio (Fixed, 95% CI) | 0.86 [0.71, 1.06] |
| 2 Tumour response Show forest plot | 3 | 482 | Odds Ratio (M‐H, Fixed, 95% CI) | 2.08 [1.37, 3.15] |
| 3 Progression‐free survival Show forest plot | 3 | 482 | Hazard Ratio (Fixed, 95% CI) | 0.74 [0.59, 0.93] |
| 4 Treatment‐related death Show forest plot | 3 | 482 | Odds Ratio (M‐H, Fixed, 95% CI) | 1.95 [0.73, 5.17] |
| 5 Treatment discontinuation due to toxicity Show forest plot | 2 | 234 | Odds Ratio (M‐H, Fixed, 95% CI) | 1.71 [0.79, 3.69] |
| Outcome or subgroup title | No. of studies | No. of participants | Statistical method | Effect size |
| 1 Overall Survival Show forest plot | 4 | 1793 | Hazard Ratio (Fixed, 95% CI) | 0.91 [0.83, 1.00] |
| 2 Tumour response Show forest plot | 7 | 1753 | Odds Ratio (M‐H, Random, 95% CI) | 1.73 [1.01, 2.94] |
| 3 Progression‐free survival Show forest plot | 4 | 1942 | Hazard Ratio (Random, 95% CI) | 0.85 [0.70, 1.04] |
| 4 Time‐to treatment failure Show forest plot | 5 | 1818 | Hazard Ratio (Random, 95% CI) | 0.88 [0.76, 1.01] |
| 5 Treatment‐related deaths Show forest plot | 4 | 1962 | Odds Ratio (M‐H, Fixed, 95% CI) | 0.56 [0.30, 1.06] |
| 6 Treatment discontinuation due to toxicity Show forest plot | 3 | 1726 | Odds Ratio (M‐H, Fixed, 95% CI) | 0.85 [0.63, 1.13] |