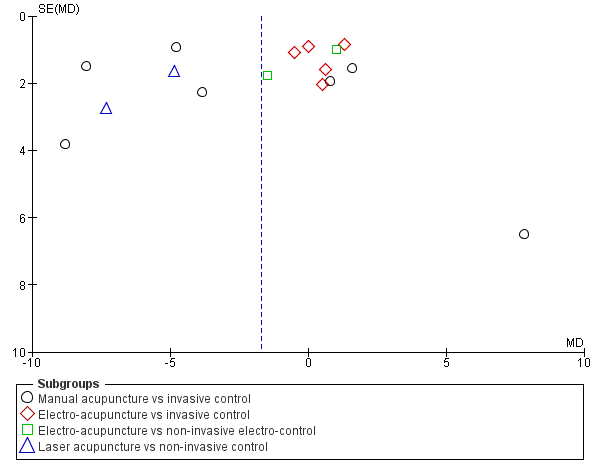
| 1 Severity of depression at the end of the intervention Show forest plot | 14 | 841 | Mean Difference (IV, Random, 95% CI) | ‐1.69 [‐3.33, ‐0.05] |
|
| 1.1 Manual acupuncture vs invasive control | 7 | 418 | Mean Difference (IV, Random, 95% CI) | ‐2.97 [‐6.26, 0.31] |
| 1.2 Electro‐acupuncture vs invasive control | 5 | 251 | Mean Difference (IV, Random, 95% CI) | 0.43 [‐0.54, 1.40] |
| 1.3 Electro‐acupuncture vs non‐invasive electro‐control | 2 | 99 | Mean Difference (IV, Random, 95% CI) | 0.17 [‐2.14, 2.48] |
| 1.4 Laser acupuncture vs non‐invasive control | 2 | 73 | Mean Difference (IV, Random, 95% CI) | ‐5.51 [‐8.30, ‐2.73] |
| 2 Adverse events Show forest plot | 5 | 300 | Risk Ratio (M‐H, Random, 95% CI) | 1.63 [0.93, 2.86] |
|
| 2.1 Manual acupuncture vs invasive control | 1 | 17 | Risk Ratio (M‐H, Random, 95% CI) | 2.5 [0.15, 40.37] |
| 2.2 Electro‐acupuncture vs invasive control | 4 | 244 | Risk Ratio (M‐H, Random, 95% CI) | 1.79 [0.99, 3.25] |
| 2.3 Electro‐acupuncture vs non‐invasive control | 1 | 39 | Risk Ratio (M‐H, Random, 95% CI) | 0.4 [0.05, 3.08] |
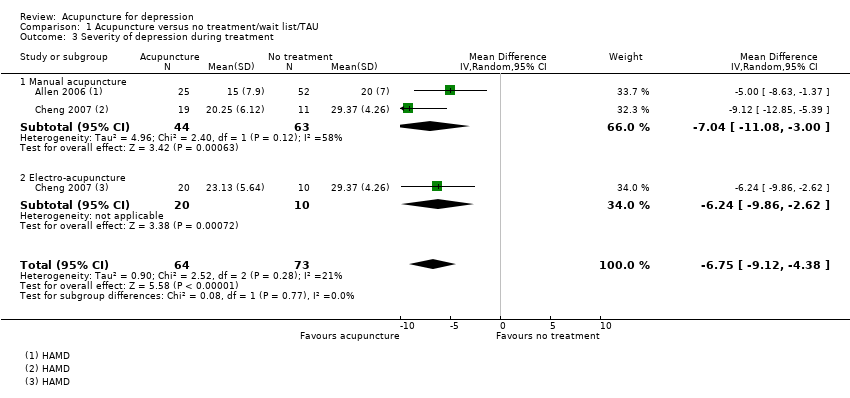
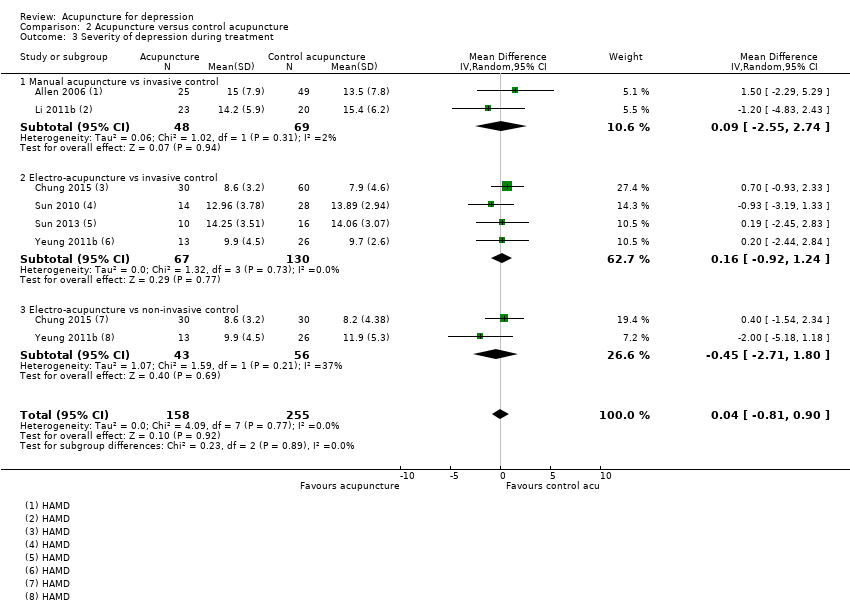
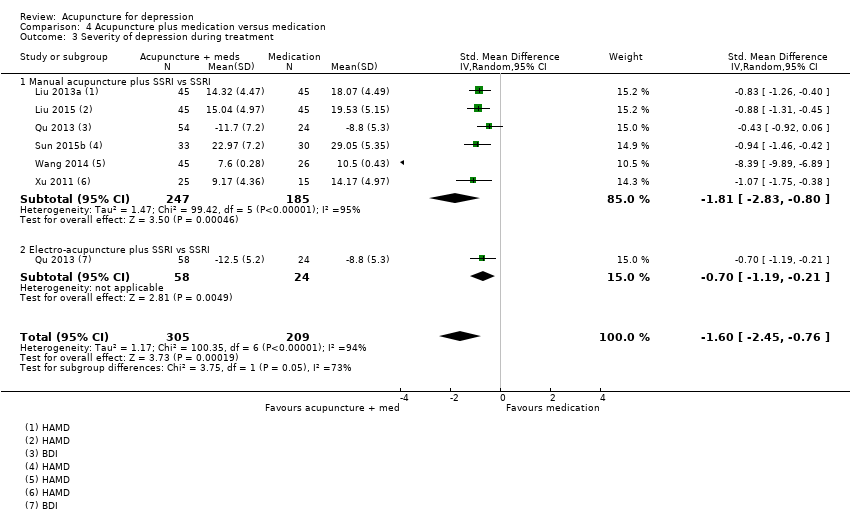
| 3 Severity of depression during treatment Show forest plot | 6 | 413 | Mean Difference (IV, Random, 95% CI) | 0.04 [‐0.81, 0.90] |
|
| 3.1 Manual acupuncture vs invasive control | 2 | 117 | Mean Difference (IV, Random, 95% CI) | 0.09 [‐2.55, 2.74] |
| 3.2 Electro‐acupuncture vs invasive control | 4 | 197 | Mean Difference (IV, Random, 95% CI) | 0.16 [‐0.92, 1.24] |
| 3.3 Electro‐acupuncture vs non‐invasive control | 2 | 99 | Mean Difference (IV, Random, 95% CI) | ‐0.45 [‐2.71, 1.80] |
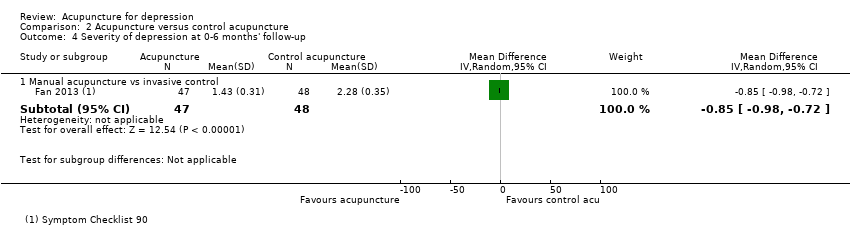
| 4 Severity of depression at 0‐6 months' follow‐up Show forest plot | 1 | | Mean Difference (IV, Random, 95% CI) | Subtotals only |
|
| 4.1 Manual acupuncture vs invasive control | 1 | 95 | Mean Difference (IV, Random, 95% CI) | ‐0.85 [‐0.98, ‐0.72] |
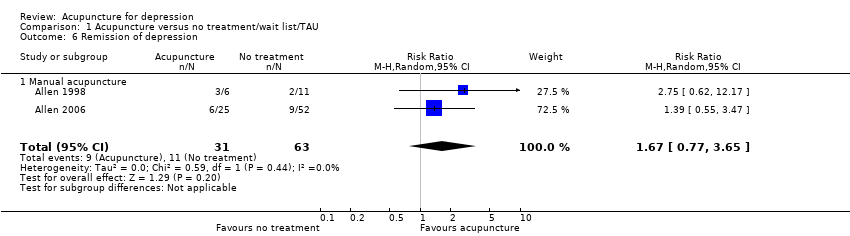
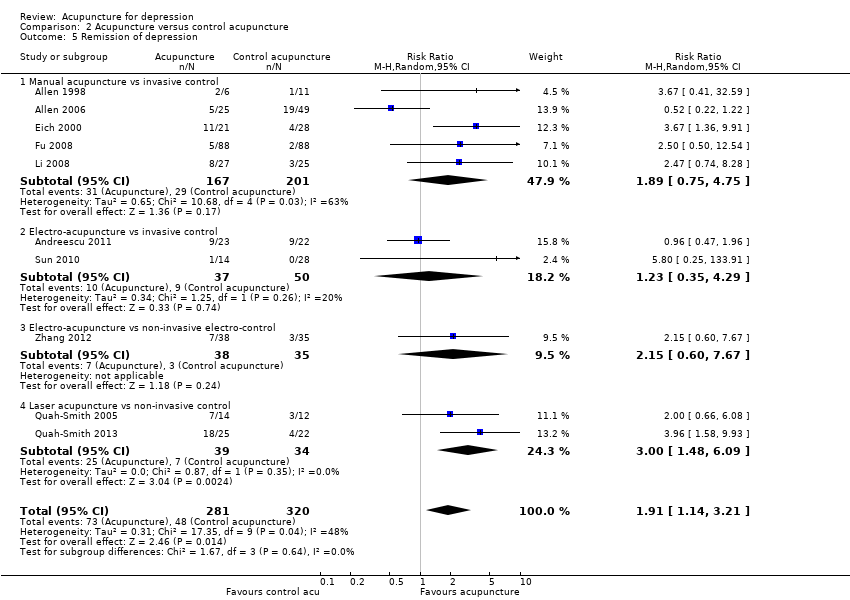
| 5 Remission of depression Show forest plot | 10 | 601 | Risk Ratio (M‐H, Random, 95% CI) | 1.91 [1.14, 3.21] |
|
| 5.1 Manual acupuncture vs invasive control | 5 | 368 | Risk Ratio (M‐H, Random, 95% CI) | 1.89 [0.75, 4.75] |
| 5.2 Electro‐acupuncture vs invasive control | 2 | 87 | Risk Ratio (M‐H, Random, 95% CI) | 1.23 [0.35, 4.29] |
| 5.3 Electro‐acupuncture vs non‐invasive electro‐control | 1 | 73 | Risk Ratio (M‐H, Random, 95% CI) | 2.15 [0.60, 7.67] |
| 5.4 Laser acupuncture vs non‐invasive control | 2 | 73 | Risk Ratio (M‐H, Random, 95% CI) | 3.00 [1.48, 6.09] |
| 6 Quality of life (emotional) during treatment Show forest plot | 1 | 150 | Mean Difference (IV, Random, 95% CI) | ‐1.98 [‐5.41, 1.45] |
|
| 6.1 Electro‐acupuncture vs invasive control | 1 | 90 | Mean Difference (IV, Random, 95% CI) | ‐2.09 [‐6.54, 2.36] |
| 6.2 Electro‐acupuncture vs non‐invasive control | 1 | 60 | Mean Difference (IV, Random, 95% CI) | ‐1.81 [‐7.18, 3.56] |
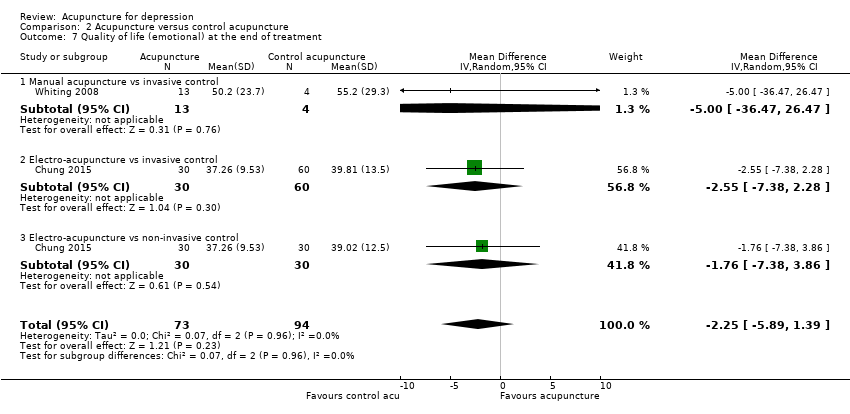
| 7 Quality of life (emotional) at the end of treatment Show forest plot | 2 | 167 | Mean Difference (IV, Random, 95% CI) | ‐2.25 [‐5.89, 1.39] |
|
| 7.1 Manual acupuncture vs invasive control | 1 | 17 | Mean Difference (IV, Random, 95% CI) | ‐5.0 [‐36.47, 26.47] |
| 7.2 Electro‐acupuncture vs invasive control | 1 | 90 | Mean Difference (IV, Random, 95% CI) | ‐2.55 [‐7.38, 2.28] |
| 7.3 Electro‐acupuncture vs non‐invasive control | 1 | 60 | Mean Difference (IV, Random, 95% CI) | ‐1.76 [‐7.38, 3.86] |
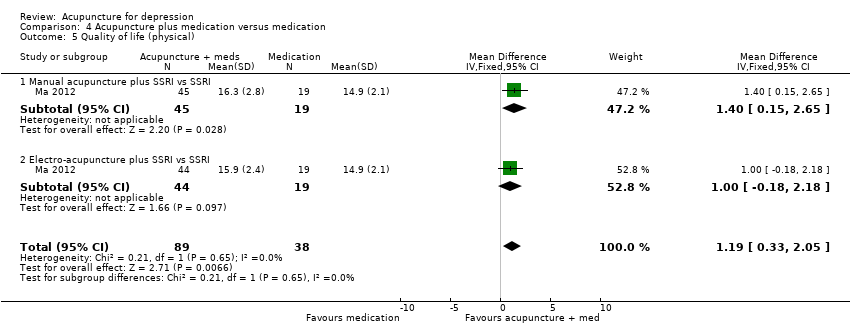
| 8 Quality of life (physical) during treatment Show forest plot | 1 | 150 | Mean Difference (IV, Random, 95% CI) | ‐0.99 [‐4.74, 2.77] |
|
| 8.1 Electro‐acupuncture vs invasive control | 1 | 90 | Mean Difference (IV, Random, 95% CI) | ‐2.62 [‐7.07, 1.83] |
| 8.2 Electro‐acupuncture vs non‐invasive control | 1 | 60 | Mean Difference (IV, Random, 95% CI) | 1.26 [‐4.12, 6.64] |
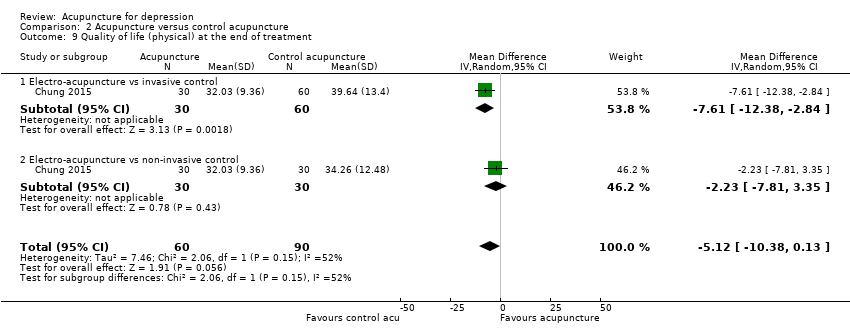
| 9 Quality of life (physical) at the end of treatment Show forest plot | 1 | 150 | Mean Difference (IV, Random, 95% CI) | ‐5.12 [‐10.38, 0.13] |
|
| 9.1 Electro‐acupuncture vs invasive control | 1 | 90 | Mean Difference (IV, Random, 95% CI) | ‐7.61 [‐12.38, ‐2.84] |
| 9.2 Electro‐acupuncture vs non‐invasive control | 1 | 60 | Mean Difference (IV, Random, 95% CI) | ‐2.23 [‐7.81, 3.35] |
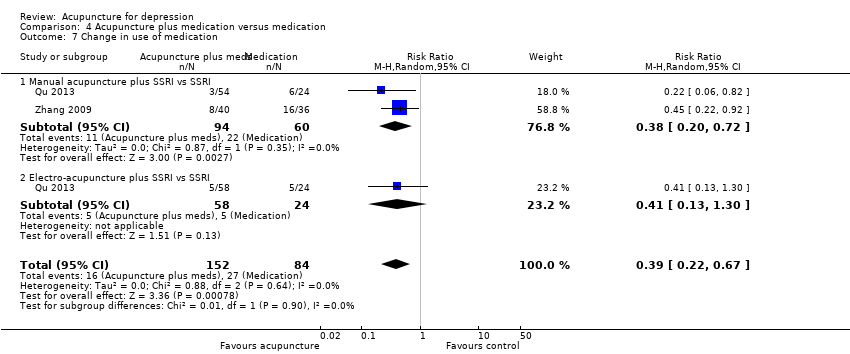
| 10 Change in medication Show forest plot | 1 | 70 | Mean Difference (IV, Random, 95% CI) | ‐0.39 [‐1.71, 0.93] |
|
| 10.1 Electro‐acupuncture vs non‐invasive control | 1 | 70 | Mean Difference (IV, Random, 95% CI) | ‐0.39 [‐1.71, 0.93] |
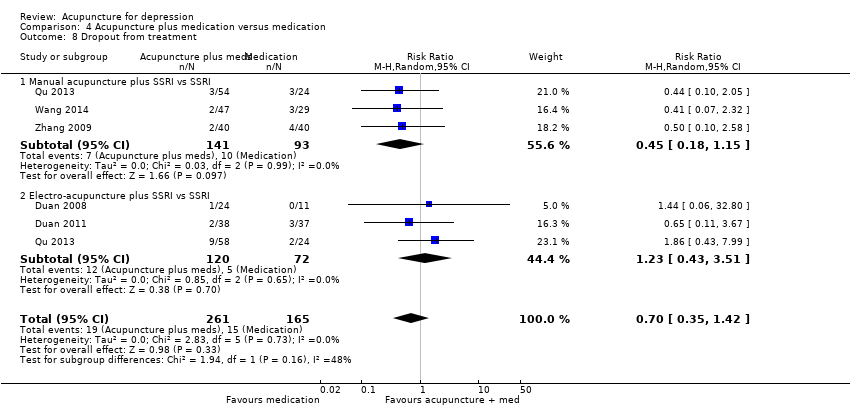
| 11 Dropout from treatment Show forest plot | 7 | 501 | Risk Ratio (M‐H, Random, 95% CI) | 1.04 [0.62, 1.75] |
|
| 11.1 Manual acupuncture vs invasive control | 1 | 60 | Risk Ratio (M‐H, Random, 95% CI) | 0.6 [0.16, 2.29] |
| 11.2 Electro‐acupuncture vs invasive control | 4 | 224 | Risk Ratio (M‐H, Random, 95% CI) | 1.01 [0.51, 2.02] |
| 11.3 Electro‐acupuncture vs non‐invasive control | 4 | 217 | Risk Ratio (M‐H, Random, 95% CI) | 1.48 [0.56, 3.91] |