針灸用於治療憂鬱症
Abstract
Background
Depression is recognised as a major public health problem that has a substantial impact on individuals and on society. People with depression may consider using complementary therapies such as acupuncture, and an increasing body of research has been undertaken to assess the effectiveness of acupuncture for treatment of individuals with depression. This is the second update of this review.
Objectives
To examine the effectiveness and adverse effects of acupuncture for treatment of individuals with depression.
To determine:
• Whether acupuncture is more effective than treatment as usual/no treatment/wait list control for treating and improving quality of life for individuals with depression.
• Whether acupuncture is more effective than control acupuncture for treating and improving quality of life for individuals with depression.
• Whether acupuncture is more effective than pharmacological therapies for treating and improving quality of life for individuals with depression.
• Whether acupuncture plus pharmacological therapy is more effective than pharmacological therapy alone for treating and improving quality of life for individuals with depression.
• Whether acupuncture is more effective than psychological therapies for treating and improving quality of life for individuals with depression.
• Adverse effects of acupuncture compared with treatment as usual/no treatment/wait list control, control acupuncture, pharmacological therapies, and psychological therapies for treatment of individuals with depression.
Search methods
We searched the following databases to June 2016: Cochrane Common Mental Disorders Group Controlled Trials Register (CCMD‐CTR), Korean Studies Information Service System (KISS), DBPIA (Korean article database website), Korea Institute of Science and Technology Information, Research Information Service System (RISS), Korea Med, Korean Medical Database (KM base), and Oriental Medicine Advanced Searching Integrated System (OASIS), as well as several Korean medical journals.
Selection criteria
Review criteria called for inclusion of all published and unpublished randomised controlled trials comparing acupuncture versus control acupuncture, no treatment, medication, other structured psychotherapies (cognitive‐behavioural therapy, psychotherapy, or counselling), or standard care. Modes of treatment included acupuncture, electro‐acupuncture, and laser acupuncture. Participants included adult men and women with depression diagnosed by Diagnostic and Statistical Manual of Mental Disorders Fourth Edition (DSM‐IV), Research Diagnostic Criteria (RDC), International Statistical Classification of Diseases and Related Health Problems (ICD), or Chinese Classification of Mental Disorders Third Edition Revised (CCMD‐3‐R). If necessary, we used trial authors' definitions of depressive disorder.
Data collection and analysis
We performed meta‐analyses using risk ratios (RRs) for dichotomous outcomes and standardised mean differences (SMDs) for continuous outcomes, with 95% confidence intervals (CIs). Primary outcomes were reduction in the severity of depression, measured by self‐rating scales or by clinician‐rated scales, and improvement in depression, defined as remission versus no remission. We assessed evidence quality using the GRADE method.
Main results
This review is an update of previous versions and includes 64 studies (7104 participants). Most studies were at high risk of performance bias, at high or unclear risk of detection bias, and at low or unclear risk of selection bias, attrition bias, reporting bias, and other bias.
Acupuncture versus no treatment/wait list/treatment as usual
We found low‐quality evidence suggesting that acupuncture (manual and electro‐) may moderately reduce the severity of depression by end of treatment (SMD ‐0.66, 95% CI ‐1.06 to ‐0.25, five trials, 488 participants). It is unclear whether data show differences between groups in the risk of adverse events (RR 0.89, 95% CI 0.35 to 2.24, one trial, 302 participants; low‐quality evidence).
Acupuncture versus control acupuncture (invasive, non‐invasive sham controls)
Acupuncture may be associated with a small reduction in the severity of depression of 1.69 points on the Hamilton Depression Rating Scale (HAMD) by end of treatment (95% CI ‐3.33 to ‐0.05, 14 trials, 841 participants; low‐quality evidence). It is unclear whether data show differences between groups in the risk of adverse events (RR 1.63, 95% CI 0.93 to 2.86, five trials, 300 participants; moderate‐quality evidence).
Acupuncture versus medication
We found very low‐quality evidence suggesting that acupuncture may confer small benefit in reducing the severity of depression by end of treatment (SMD ‐0.23, 95% CI ‐0.40 to ‐0.05, 31 trials, 3127 participants). Studies show substantial variation resulting from use of different classes of medications and different modes of acupuncture stimulation. Very low‐quality evidence suggests lower ratings of adverse events following acupuncture compared with medication alone, as measured by the Montgomery‐Asberg Depression Rating Scale (MADRS) (mean difference (MD) ‐4.32, 95% CI ‐7.41 to ‐1.23, three trials, 481 participants).
Acupuncture plus medication versus medication alone
We found very low‐quality evidence suggesting that acupuncture is highly beneficial in reducing the severity of depression by end of treatment (SMD ‐1.15, 95% CI ‐1.63 to ‐0.66, 11 trials, 775 participants). Studies show substantial variation resulting from use of different modes of acupuncture stimulation. It is unclear whether differences in adverse events are associated with different modes of acupuncture (SMD ‐1.32, 95% CI ‐2.86 to 0.23, three trials, 200 participants; very low‐quality evidence).
Acupuncture versus psychological therapy
It is unclear whether data show differences between acupuncture and psychological therapy in the severity of depression by end of treatment (SMD ‐0.5, 95% CI ‐1.33 to 0.33, two trials, 497 participants; low‐quality evidence). Low‐quality evidence suggests no differences between groups in rates of adverse events (RR 0.62, 95% CI 0.29 to 1.33, one trial, 452 participants).
Authors' conclusions
The reduction in severity of depression was less when acupuncture was compared with control acupuncture than when acupuncture was compared with no treatment control, although in both cases, results were rated as providing low‐quality evidence. The reduction in severity of depression with acupuncture given alone or in conjunction with medication versus medication alone is uncertain owing to the very low quality of evidence. The effect of acupuncture compared with psychological therapy is unclear. The risk of adverse events with acupuncture is also unclear, as most trials did not report adverse events adequately. Few studies included follow‐up periods or assessed important outcomes such as quality of life. High‐quality randomised controlled trials are urgently needed to examine the clinical efficacy and acceptability of acupuncture, as well as its effectiveness, compared with acupuncture controls, medication, or psychological therapies.
PICO
Plain language summary
針灸用於治療憂鬱症
本文獻回顧為何重要?
憂鬱症在我們的生活中是個很廣泛且容易遇到的問題。患有憂鬱症的病人會對原本感興趣的生活及日常活動失去興趣。有的憂鬱症病人會尋求輔助療法,而且比起藥物治療,有的病人更喜歡這樣的治療方式。針灸治療就是將細針扎入身體不同的部位,以達到改正人體能量的不平衡。
哪些人可能會對此本文獻回顧感興趣?
青少年和成人; 醫療從業人員,包括與憂鬱症患者合作或參與治療的一般從業人員; 衛生保健服務的提供者和專員將對這篇文獻回顧感興趣。
本篇文獻回顧旨在解答哪些問題?
此文獻回顧為先前Cochrane文獻回顧(2010年出版)之更新,目的是為回答下列問題:
• 針灸是否優於無治療或常規治療?
• 針灸是否優於假針灸 (一種看起來類似針灸的治療方法) ?
• 針灸是否優於藥物治療,例如抗憂鬱藥?
• 針灸合併抗憂鬱藥是否優於單獨使用抗憂鬱藥?
• 針灸是否優於心理治療?
• 針灸是否比其他治療憂鬱症的方法更安全?
本篇文獻回顧納入了哪些研究?
本篇文獻回顧納入了64個隨機對照試驗,共7104 名參與者,評估其憂鬱症狀的變化。
我們由文獻回顧的證據得到了什麼?
評讀作者評估收錄文獻的證據品質為非常低或低,因此下述之效果應謹慎作為參考。
與常規治療或無治療相比,針灸可能會中度地降低憂鬱症的嚴重程度。與假針灸相比, 針灸可能會輕微地降低憂鬱症的嚴重程度。而針對針灸相對於藥物及心理治療,由於證據品質非常低,因此效果並不明確。針灸發生不良事件的風險其實也不明確,因為大多數試驗並沒有報告不良事件。
下一步做什麼呢?
評讀作者建議應該要進行額外高品質的隨機對照試驗。這些試驗應使用適當的遮盲法(受試者不知道他正在接受何種治療),並且應納入生活品質的測量、評估治療的可接受性,及進行中長期的追蹤。
Authors' conclusions
Summary of findings
| Acupuncture compared with no treatment/wait list/treatment as usual for depression | ||||||
| Patient or population: clinical diagnosis of depression | ||||||
| Outcomes | Anticipated absolute effects* (95% CI) | Relative effect | No. of participants | Quality of the evidence | Comments | |
| Risk with no treatment/wait list/treatment as usual | Risk with acupuncture | |||||
| Severity of depression at the end of treatment | SMD 0.66 lower | ‐ | 488 | ⊕⊕⊝⊝ | As a rule of thumb, 0.2 SMD represents a small difference, 0.5 moderate, and 0.8 large. | |
| Adverse events | Study population | RR 0.89 | 302 | ⊕⊕⊝⊝ | ||
| 60 per 1000 | 53 per 1000 | |||||
| Quality of life (physical) | ‐ | ‐ | ‐ | ‐ | ‐ | Cannot estimate the effect of acupuncture as no studies reported on this outcome |
| Quality of life (emotional) | ‐ | ‐ | ‐ | ‐ | ‐ | Cannot estimate the effect of acupuncture as no studies reported on this outcome |
| *The risk in the intervention group (and its 95% confidence interval) is based on the assumed risk in the comparison group and the relative effect of the intervention (and its 95% CI). | ||||||
| GRADE Working Group grades of evidence. | ||||||
| aDowngraded one level owing to high risk of performance bias across most included studies. bDowngraded one level owing to substantial heterogeneity (I2 = 64%, Tau2 = 0.14, P = 0.02). cDowngraded one level owing to high risk of performance bias. dDowngraded one level owing to small sample size for detecting relatively rare events. | ||||||
| Acupuncture compared with control acupuncture for depression | ||||||
| Patient or population: clinical diagnosis of depression | ||||||
| Outcomes | Anticipated absolute effects* (95% CI) | Relative effect | No. of participants | Quality of the evidence | Comments | |
| Risk with control acupuncture | Risk with acupuncture | |||||
| Severity of depression at the end of the intervention as measured by the Hamilton Depression Rating Scale (HAMD) scored from 0 to 54 (lower score indicates less severe depression) | In the study population, average severity of depression at the end of treatment was 11.4 in clinician‐rated HAMD scores. | MD 1.69 lower | ‐ | 841 | ⊕⊕⊝⊝ | |
| Adverse events | Study population | RR 1.63 | 300 | ⊕⊕⊕⊝ | ||
| 162 per 1000 | 264 per 1000 | |||||
| Quality of life (physical) at the end of treatment (higher scores indicate greater quality of life) | Mean quality of life (physical) at the end of treatment was 37. | MD 5.12 lower | ‐ | 150 | ⊕⊕⊝⊝ | |
| Quality of life (emotional) at the end of treatment (higher scores indicate greater quality of life) | Mean quality of life (emotional) at the end of treatment was 44.6. | MD 2.25 lower | ‐ | 167 | ⊕⊕⊕⊝ | |
| *The risk in the intervention group (and its 95% confidence interval) is based on the assumed risk in the comparison group and the relative effect of the intervention (and its 95% CI). | ||||||
| GRADE Working Group grades of evidence. | ||||||
| aDowngraded one level owing to high risk of bias in performance bias in five of the included studies and high risk of bias in at least one domain in most studies. bDowngraded one level owing to substantial heterogeneity (I2 = 80%, Tau2 = 7.80, P < 0.001). cDowngraded one level owing to small sample size for relatively rare events. dDowngraded one level because only one small study contributed to this outcome. eDowngraded one level for imprecision due to small sample size. | ||||||
| Acupuncture compared with medication for depression | ||||||
| Patient or population: clinical diagnosis of depression | ||||||
| Outcomes | Anticipated absolute effects* (95% CI) | Relative effect | No. of participants | Quality of the evidence | Comments | |
| Risk with medication | Risk with acupuncture | |||||
| Severity of depression at the end of treatment | SMD 0.23 lower | ‐ | 3127 | ⊕⊝⊝⊝ | As a rule of thumb, 0.2 SMD represents a small difference, 0.5 moderate, and 0.8 large. | |
| Adverse events (measured with Asberg Antidepressant Side Effect Scale) | Mean number of adverse events was 6.2. | MD 4.32 lower | ‐ | 481 | ⊕⊝⊝⊝ | |
| Quality of life (physical) | ‐ | ‐ | No studies reported on this outcome. | ‐ | Cannot estimate the effect of acupuncture as no studies reported on this outcome | |
| Quality of life (emotional) | ‐ | ‐ | No studies reported on this outcome. | ‐ | Cannot estimate the effect of acupuncture as no studies reported on this outcome | |
| *The risk in the intervention group (and its 95% confidence interval) is based on the assumed risk in the comparison group and the relative effect of the intervention (and its 95% CI). | ||||||
| GRADE Working Group grades of evidence. | ||||||
| aDowngraded two levels owing to very serious risk of bias. Of 31 trials, 30 were at high risk of bias owing to lack of blinding of participants, and 12 were at high risk of bias owing to lack of blinding of outcome assessors. bDowngraded one level owing to substantial heterogeneity (I2 = 80%, Tau2 = 0.19, P < 0.0001). cDowngraded two levels owing to very serious risk of bias in all three studies. dDowngraded two levels owing to considerable heterogeneity (I2 = 97%, Tau2 = 7.22, P < 0.001). | ||||||
| Acupuncture plus medication compared with medication for depression | ||||||
| Patient or population: clinical diagnosis of depression | ||||||
| Outcomes | Anticipated absolute effects* (95% CI) | Relative effect | No. of participants | Quality of the evidence | Comments | |
| Risk with medication | Risk with acupuncture plus medication | |||||
| Severity of depression at the end of treatment | SMD 1.15 lower | ‐ | 813 | ⊕⊝⊝⊝ | As a rule of thumb, 0.2 SMD represents a small difference, 0.5 moderate, and 0.8 large. | |
| Adverse events (measured with Asberg Antidepressant Side Effect Scale and Toxic Exposure Surveillance System) | SMD 1.32 lower | ‐ | 200 | ⊕⊝⊝⊝ | As a rule of thumb, 0.2 SMD represents a small difference, 0.5 moderate, and 0.8 large. | |
| Quality of life (physical) at the end of treatment (higher scores indicate greater quality of life) | Quality of life (physical) score in the single included study was 14.9. | MD 1.19 higher | ‐ | 127 | ⊕⊝⊝⊝ | |
| Quality of life (emotional) at the end of treatment (higher scores indicate greater quality of life) | Mean quality of life (emotional) score was 17.2. | MD 0.25 higher | ‐ | 219 | ⊕⊝⊝⊝ | |
| *The risk in the intervention group (and its 95% confidence interval) is based on the assumed risk in the comparison group and the relative effect of the intervention (and its 95% CI). | ||||||
| GRADE Working Group grades of evidence. | ||||||
| aDowngraded two levels owing to very serious risk of bias. Of 11 trials, nine were at high risk of bias owing to lack of blinding of participants, and 6 were at high risk of bias owing to lack of blinding of outcome assessors. bDowngraded two levels owing to considerable heterogeneity (I2 = 89%, Tau2 = 0.70, P < 0.001). fDowngraded two levels owing to very serious risk of bias. | ||||||
| Acupuncture compared with psychological therapy for depression | ||||||
| Patient or population: clinical diagnosis of depression | ||||||
| Outcomes | Anticipated absolute effects* (95% CI) | Relative effect | No. of participants | Quality of the evidence | Comments | |
| Risk with psychological therapy | Risk with acupuncture | |||||
| Severity of depression at the end of treatment as measured by self‐rated depression scores (lower score indicates less severe depression) | SMD 0.5 lower | ‐ | 497 | ⊕⊕⊝⊝ | As a rule of thumb, 0.2 SMD represents a small difference, 0.5 moderate, and 0.8 large. | |
| Adverse events measured during study treatment | Study population | RR 0.62 | 453 | ⊕⊕⊝⊝ | ||
| 86 per 1000 | 53 per 1000 | |||||
| Quality of life (physical) | ‐ | ‐ | ‐ | No studies reported on this outcome. | ‐ | Cannot estimate the effect of acupuncture as no studies reported on this outcome |
| Quality of life (emotional) | ‐ | ‐ | ‐ | No studies reported on this outcome. | ‐ | Cannot estimate the effect of acupuncture as no studies reported on this outcome |
| *The risk in the intervention group (and its 95% confidence interval) is based on the assumed risk in the comparison group and the relative effect of the intervention (and its 95% CI). | ||||||
| GRADE Working Group grades of evidence. | ||||||
| aDowngraded one level for serious risk of bias; both included trials have high risk of performance bias. dDowngraded one level owing to high risk of performance bias. | ||||||
Background
Description of the condition
Clinical depression is characterised by behavioural, cognitive, and emotional features. Depressed patients often exhibit signs of dysphoric mood, loss of interest in normally enjoyable pursuits, self‐neglect and social withdrawal, poor appetite or overeating, insomnia or hypersomnia, fatigue or loss of energy, low self‐esteem, poor concentration or difficulty making decisions, and feelings of hopelessness.
Depression is recognised as a major public health problem that has a substantial impact on individuals and on society. Depressive disorders are common in the general population. In the United States, the lifetime prevalence of a major depressive disorder (MDD) has been reported at 16.2% (Kessler 2007). The World Health Organization has described depression as an "unseen burden" (Murray 1996). MDD is associated with a significant loss of workdays (Kessler 2007), as well as substantial role impairment in relation to household responsibilities, social life, and personal relationships (Kessler 2003). It has been demonstrated that those in the community who have depressive disorders experience reduced physical and mental functioning ‐ similar to those seen with chronic diseases such as diabetes (Hays 1995; Wells 1989). In addition, mood disorders have been shown to have a greater impact on quality of life when compared with conditions such as hypertension and cardiac disease (Spitzer 1995). Depression is associated with considerable financial costs for health services and for society. The economic burden in England is estimated to exceed £9 billion per annum, with approximately £370 million accounting for direct costs of treatment (Thomas 2003).
Description of the intervention
Major depression is a discrete episode of severe depression; when it is gone, the person is described as being in remission and feeling completely normal. Dysthymia is a pervasive 'low‐level' depression that lasts a long time ‐ frequently for a few years. Treatment approaches are the same for both conditions. Most depressed patients are treated in primary care and do not require hospitalisation. In primary care, depression is most often managed with antidepressants (Goldman 1999). A range of psychological interventions, including cognitive‐behavioural therapies, interpersonal therapy, psychotherapy, and counselling, are also available. Surveys have shown that Australians report a preference for self‐help and complementary therapies for depression (Jorm 1997;Jorm 2000), and depressed persons in the United States report greater use of complementary therapies (Kessler 2000).
Acupuncture has a long history of use in China, Japan, and Korea. Contemporary acupuncture practice is commonly undertaken as part of the medical hospital system in modern China (Robinson 2012), as part of traditional Korean medicine in South Korea (Woo 2014), and as a mix of hospital and private practice in the United Kingdom (Hopton 2012). Traditional Chinese Medicine theory describes a state of health maintained by a balance of energy within the body. Acupuncture involves insertion of fine needles into different parts of the body to correct the imbalance of energy within the body. Styles of acupuncture range from traditional/classical acupuncture to auricular acupuncture, to trigger point acupuncture, to single‐point acupuncture. Acupuncture is practised under several theoretical frameworks. Traditional Chinese Medicine (TCM) and Classical Acupuncture are based on theoretical concepts of Yin and Yang and the Five Elements and explain disease and physiological function. A westernised medical application of acupuncture involves use of trigger points, segmental points, and commonly used formula points. Medical acupuncture may involve application of acupuncture based on the principles of neurophysiology and anatomy, rather than on TCM principles and philosophy. Auricular therapy involves using the ear to make a diagnosis and subsequent needling to points on the ear. Electro‐acupuncture is defined as application of a small current through acupuncture needles. Laser acupuncture is a non‐penetrative form of acupuncture that uses low‐power laser light to stimulate acupuncture points. The rationale for treatment will determine the needling details (e.g. selection of points, number of needles used) and the method of stimulation (e.g. manual acupuncture, electro‐acupuncture, laser acupuncture). Different styles of acupuncture may differ in their effectiveness, but little research has been conducted to directly examine effects on clinical outcomes when these parameters are changed (Armour 2016; Lin 2016).
Acupuncture is not entirely free of adverse events. Two large prospective surveys have been undertaken in the United Kingdom (MacPherson 2004; White 2001). White 2001 reported an incidence of 684 adverse events per 10,000 consultations. Most were minor events such as bleeding, needling pain, or aggravation of symptoms, and investigators have reported a low rate of significant adverse events (14 per 10,000). MacPherson 2004 reported a rate of 107 adverse events per 1000 participants (95% confidence interval (CI) 100 to 115). Three participants reported a serious adverse event. Events most commonly reported were severe tiredness and exhaustion, pain at the site of needling, and headache. White 2004 summarised the range and incidence of adverse events associated with acupuncture. Twelve prospective studies undertaken in the UK, Germany, Singapore, Japan, and Sweden surveyed more than a million treatments and found that risk of a serious adverse event with acupuncture was estimated to be 0.05 per 10,000 treatments, and 0.55 per 10,000 individual patients. Data from these studies suggest that the risks associated with acupuncture are few ‐ a point reinforced by Vincent 2001, which concluded that acupuncture is safe in competent hands.
How the intervention might work
The cause of depression appears to be multi‐factorial, and biological and psychosocial factors are involved (Davidson 2002). Various interdependent biological components have been implicated in the onset and maintenance of MDD. Current models suggest that changes in the hypothalamic‐pituitary‐adrenal (HPA) axis, dysfunction among stress hormones, and disequilibrium in neurotransmitters such as noradrenaline, serotonin, and dopamine may be key factors (Hou 2016).
Several mechanisms may explain the therapeutic effects of acupuncture within the current model of depression. Strong evidence obtained over the past three decades indicates that effects of acupuncture are mediated by various neurotransmitters, predominantly the endogenous opioid mechanism (EOM), catecholamines, and serotonin, and that an estimated 20 to 30 other neuropeptides are affected (Leung 2014). Results from animal experiments suggest that, similar to antidepressant medications, acupuncture is capable of affecting neurotransmitter levels of serotonin and noradrenaline, along with the adenylate cyclase‐cyclic adenosine monophosphate‐protein kinase A (AC‐cAMP‐PKA) cascade within the central nervous system (Leung 2014). In addition, acupuncture has produced structural and functional magnetic resonance imaging (fMRI) changes (as described by Huang 2012) in the default mode network, anterior cingulate cortex, and amygdala‐hippocampal formation (Liu 2009). Dysfunction in these areas of the brain has been previously implicated in depressive disorders (Hamilton 2015). Manual acupuncture causes a broad range of central nervous system responses involving the amygdala, hippocampus, hypothalamus, cerebellum, and other limbic structures as seen on fMRI and electroencephalography (EEG) (Napadow 2005). Electro‐acupuncture is thought to deliver a greater 'dose' of acupuncture compared with manual acupuncture, as a result of the duration and intensity of stimulation, and to cause greater activation of endogenous opoid mechanisms (Mayor 2013). This may or may not lead to greater clinical effects in non‐pain‐related conditions (Langevin 2015;Mayor 2013). The mechanism of laser acupuncture remains unclear, but proposed models involve changes in gene expression mediated via changes in nitric oxide (Chung 2012).
Why it is important to do this review
An increasing body of research is focussed on assessing the effectiveness of acupuncture. In 2005, we published the first version of this systematic review and concluded that evidence was insufficient for determination of the efficacy of acupuncture. An update was published in 2010. Since that time, new trials have been published and we have gained comprehensive access to a large body of relevant literature from China.
Objectives
To examine the effectiveness and adverse effects of acupuncture for treatment of individuals with depression.
-
To determine whether acupuncture is more effective than treatment as usual/no treatment/wait list control for treating and improving quality of life for individuals with depression.
-
To determine whether acupuncture is more effective than control acupuncture for treating and improving quality of life for individuals with depression.
-
To determine whether acupuncture is more effective than pharmacological therapies for treating and improving quality of life for individuals with depression.
-
To determine whether acupuncture plus pharmacological therapy is more effective than pharmacological therapy alone for treating and improving quality of life for individuals with depression.
-
To determine whether acupuncture is more effective than psychological therapies for treating and improving quality of life for individuals with depression.
-
To determine adverse effects of acupuncture compared with treatment as usual/no treatment/wait list control, control acupuncture, pharmacological therapies, and psychological therapies for treatment of individuals with depression.
Methods
Criteria for considering studies for this review
Types of studies
We sought to include all relevant published and unpublished randomised controlled trials (RCTs). We excluded cross‐over trials owing to uncertainty regarding the period allowed for washout before acupuncture treatment. We included cluster‐randomised trials and excluded quasi‐randomised trials that used non‐random methods of treatment assignment such as date of admission (see Differences between protocol and review).
Types of participants
Characteristics
We included studies of people of either gender and of any ethnicity, aged 16 years or older, with clinically diagnosed depression as the primary condition or as a comorbidity.
Diagnosis
We included studies in which investigators diagnosed depression using one or more of the following criteria: depression defined by the Diagnostic and Statistical Manual of Mental Disorders (Third Edition (DSM‐III), Fourth Edition (DSM‐IV), or Fifth Edition (DSM‐5); APA 2015), or the Research Diagnostic Criteria (RDC; Spitzer 1977), or the International Statistical Classification of Diseases and Related Health Problems (ICD; WHO 1993), or the Chinese Classification of Mental Disorders (Second Edition (CCMD‐2) or Third Edition (CCMD‐3); Chinese Psychiatric Society 2001). If necessary, we used trial authors' definitions of depressive disorder. We included both major depression and dysthymia.
Comorbidities
As long as depression was the main focus of the trial, studies that involve participants with comorbid physical or common mental disorders were eligible for inclusion.
Treatment setting
All settings ‐ primary, secondary, tertiary, and community ‐ were eligible for inclusion.
Types of interventions
Experimental interventions
-
Manual acupuncture: involves stimulation of anatomical points on the body through penetration of the skin with thin, solid, metallic needles that are manipulated by the hands. Also included is auricular acupuncture ‐ insertion of needles into points located on the ear
-
Electro‐acupuncture: involves passing a pulsed current through the body through acupuncture needles
-
Laser acupuncture: use of a low‐level laser beam instead of an acupuncture needle to stimulate an acupuncture point
Comparator interventions
We included in this review five main categories of trial comparison groups. We excluded trials that did not include one of the following comparison groups. We classified the comparator group in each study as follows.
-
Wait list control/treatment as usual/no treatment.
-
Control acupuncture.
-
Invasive acupuncture control.
-
Sham acupuncture, which consists of insertion of a needle into a non‐acupuncture point.
-
Minimal acupuncture, in which needles are inserted into non‐acupuncture points but more superficially, without stimulation or manipulation, to avoid the needling sensation known as 'de qi'.
-
-
Non‐invasive acupuncture control: includes use of the placebo needle, which is a blunted needle that looks as if it is piercing the skin yet does not; two forms are available (Park 2002;Streitberger 1998).
-
Mock electro‐acupuncture: involves using a de‐commissioned acupuncture stimulation unit and fixing electrodes to the skin with the switch turned off.
-
Mock laser acupuncture.
-
-
Antidepressants ‐ organised into classes for the purposes of this review.
-
Selective serotonin reuptake inhibitors (SSRIs): zimelidine, fluoxetine, fluvoxamine, paroxetine, sertraline, citalopram, escitalopram.
-
Tetracyclic antidepressants (TCAs): amitriptyline, imipramine, trimipramine, doxepin, desipramine, protriptyline, nortriptyline, clomipramine, dothiepin, lofepramine.
-
Heterocyclic antidepressants: mianserin, trazodone, amoxapine, maprotiline.
-
Monoamine oxidase inhibitors (MAOIs): irreversible: phenelzine, tranylcypromine, izocarboxazid; reversible: brofaromine, moclobemide, tyrima.
-
Other antidepressants: noradrenaline reuptake inhibitors (NARIs): reboxetine, atomoxetine; norepinephrine‐dopamine reuptake inhibitors (NDRIs): amineptine, bupropion; serotonin‐norepinephrine reuptake inhibitors (SNRIs): trazodone; unclassified: agomelatine, vilazodone.
-
-
Combination therapy by which the same adjunct therapy was delivered to all study groups.
-
Acupuncture plus medication versus medication.
-
-
Psychological therapies.
-
Cognitive‐behavioural therapy (CBT).
-
Behavioural therapy (BT).
-
Psychotherapy.
-
Counselling.
-
Types of outcome measures
Primary outcomes
-
Reduction in the severity of depression, measured at the end of the intervention primarily as a continuous variable on self‐rating scales such as the Beck Depression Inventory (BDI) (Beck 1961), or on clinician‐rated scales, such as the Hamilton Depression Rating Scale (HAMD) ‐ as discussed in Hamilton 1960
-
Total numbers of adverse events
Secondary outcomes
-
Remission of depression as defined in trial reports and based on the HAMD or another clinician‐rated scale of depression severity and reported as a binary outcome
-
Quality of life indices (e.g. Short Form Health Survey (SF‐36); Ware 1994), with individual domains related to quality of life, for example, physical and emotional well‐being, reported
-
Change in use of medication or use of other support systems, measured as additional treatment provided, number of appointments attended, etc.
-
Dropouts from treatment, defined as failure to complete, including number of individuals leaving each study early and reasons for early dropout
Timing of outcome assessment
The primary time frame for reporting primary and secondary outcomes is at completion of the intervention. If a study reported several time points during the time frame (i.e. during treatment), we reported the last observation before treatment completion. We included all time frames and grouped them as follows.
-
During the treatment period.
-
At the conclusion of the treatment period.
-
Between zero and six months after conclusion of the treatment period (short term).
-
Between six and 12 months after conclusion of the treatment period (medium term).
-
Longer than 12 months after conclusion of the treatment period (long term).
Hierarchy of outcome measures
We treated equally five scales commonly used for assessment of depression: the Beck Depression Inventory (BDI; Beck 1961); the Hamilton Depression Rating Scale (HAMD; Hamilton 1960); the Patient Health Questionnaire (PHQ; Spitzer 1999); the Montgomery‐Asberg Depression Rating Scale (MADRS; Montgomery 1979); and the Clinical Global Impression‐Severity Scale (CGI‐S). We rated all other depression scales lower. If investigators used two or more of these scales, we applied the following hierarchy: (1) HAMD; (2) MADRS; (3) CGI‐S; (4) BDI; (5) PHQ; and (6) all other depression scales. Owing to the difficulty of participant blinding often seen in acupuncture trials, we gave preference to clinician‐rated scales when both clinician‐rated and self‐reported outcomes were provided.
If a study employed more than one quality of life measure, we applied the following hierarchy of scales: (1) World Health Organization Quality of Life (WHOQOL; WHO 1998); (2) Short Form Health Survey (SF‐36; Ware 1994); and (3) any other quality of life measures used.
We included both clinician‐rated and self‐reported outcomes in the same analysis; however, if investigators reported both, we used clinician‐rated scales in preference. If investigators presented no clinician‐rated outcomes, we used a self‐reported outcome. Each group did not include enough trials for these outcomes to be reported separately via subgroup analysis.
Search methods for identification of studies
Cochrane Specialised Registers: Cochrane Common Mental Disorders Clinical Trials Register (CCMD‐CTR)
The Cochrane Common Mental Disorders Group maintains a specialised register of randomised controlled trials ‐ the CCMD‐CTR. This register contains more than 39,000 reference records (reports of RCTs) on depression, anxiety, and other common mental disorders. A percentage of the reference records have been tagged to 12,500 individual, PICO‐coded study records (with coding based on the EU‐PSI (Evidence‐Based Treatment in Mental Health and Optimised Use of Databases) Coding Manual). Reports of RCTs for inclusion in the Register are collated from (weekly) generic searches of MEDLINE, Embase, and PsycINFO; quarterly searches of the Cochrane Central Register of Controlled Trials (CENTRAL); and review‐specific searches of additional databases. Reports of trials were also derived from international trial registries and drug companies; through handsearching of key journals; and via electronic searches of conference proceedings and other (non‐Cochrane) systematic reviews and meta‐analyses. Details of core CCMD search strategies can be found on the CCMD Group website.
Electronic searches
We searched the CCMD‐CTR (studies and references) (all years to 10 June 2016) using the following terms:
((acupunct* or acupress* or acupoints* or electroacupunct* or electro‐acupunct* or auriculotherap* or auriculoacupunct* or moxibust*) and (depress* or "affective disorder*" or "affective symptoms" or mood)):ti,ab,kw,ky,emt,mh,mc.
We did not systematically search Chinese language‐only databases for this version of the review; therefore trials meeting our selection criteria beyond those identified may exist. We identified a significant number of Chinese language trials through other search strategies (reported above), and a large number did not meet the inclusion criteria.
We searched the following eight electronic Korean medical databases using the same terms as above, without restricting language, from their respective inceptions up to June 2016: the Korean Studies Information Service System (KISS), Korean article database website (DBPIA), Korea Institute of Science and Technology Information, the Research Information Service System (RISS), Korea Med, the Korean Medical Database (KM Base), and the Oriental Medicine Advanced Searching Integrated System (OASIS). In addition, we searched the following Korean language journals: Journal of Korean Medicine, Korean Journal of Acupuncture, Journal of Pharmacopuncture, Journal of Acupuncture and Meridian Studies, Korean Journal of Joongpoong, Journal of Korean Acupuncture & Moxibustion Medicine Society, Journal of Korean Oriental Internal Medicine, Journal of Oriental Obstetrics and Gynecology, Journal of Society of Korean Medicine for Obesity Research, Journal of Oriental Neuropsychiatry, and Journal of Sasang Constitutional Medicine.
We applied no restrictions on publication date or status when conducting these searches.
We searched international trial registries via the World Health Organization trials portal (ICTRP), the Chinese clinical trial registry (www.chictr.org.cn), and the US National Library of Medicine database (ClinicalTrials.gov) to identify unpublished and ongoing studies.
Searching other resources
Grey literature
We searched sources of grey literature including dissertations and theses, clinical guidelines, and reports from regulatory agencies (when appropriate).
-
ProQuest Dissertations and Theses Database.
-
National Guideline Clearing House (http://guideline.gov).
-
OpenGrey (http://www.opengrey.eu/).
Handsearching
We handsearched relevant conference proceedings by referring to lists of publications in manuscripts.
Reference lists
We checked the reference lists of all included studies and relevant systematic reviews to identify additional studies missed by the original electronic searches (e.g. unpublished or in‐press citations). We conducted a cited reference search on the Web of Science.
Correspondence
We contacted trialists and subject experts to ask for information on unpublished or ongoing studies, or to request additional trial data.
Data collection and analysis
Selection of studies
Two review authors (of CS, MA, PH, HM, MS, L‐QW) reviewed all articles. Review authors independently screened titles and abstracts for potential inclusion of all studies identified as a result of the search and coded them as 'retrieve' (eligible or potentially eligible) or 'do not retrieve'. We retrieved full‐text study reports/publications, and two review authors (for all authors of the review) independently screened full‐texts, identified studies for inclusion, and identified and recorded reasons for exclusion of ineligible studies. We resolved disagreements through discussion or, if required, consulted a third review author (of PH, HM, CS). We identified and excluded duplicate records and collated multiple reports related to the same study, so that each study rather than each report is the unit of interest in the review. We recorded the selection process in sufficient detail to complete a PRISMA flow diagram.
Data extraction and management
Following assessment for inclusion, we assessed the methods used by each trial. All review authors independently extracted onto hard copy data sheets trial data on participants, methods, interventions, outcomes, and results. We sought missing data or clarification of study details from respective trial authors by mail or by email.
Main planned comparisons
-
Acupuncture versus wait list control/treatment as usual/no treatment
-
Acupuncture versus control acupuncture
-
Acupuncture versus pharmacological therapies
-
Acupuncture plus medication versus medication alone
-
Acupuncture versus psychological therapies (including counselling)
Assessment of risk of bias in included studies
Two or more review authors independently assessed risk of bias for each study using the criteria outlined in the Cochrane Handbook for Systematic Reviews of Interventions (Higgins 2011). We resolved disagreements by discussion or by consultation with a third party, when necessary. We assessed risk of bias according to the following domains.
-
Random sequence generation.
-
Allocation concealment.
-
Blinding of participants and personnel.
-
Blinding of outcome assessment.
-
Incomplete outcome data.
-
Selective outcome reporting.
-
Other bias.
We judged each potential source of bias as high, low, or unclear and provided a supporting quotation from the study report together with a justification for our judgement in the 'Risk of bias' table. We summarised risk of bias judgements across different studies for each of the domains listed. We considered blinding separately for different key outcomes when necessary (e.g. for unblinded outcome assessment). When information on risk of bias was related to unpublished data or correspondence with a trialist, we noted this in the 'Risk of bias' table.
When considering treatment effects, we took into account the risk of bias for studies that contributed to that outcome. For assessments of overall quality of the evidence for each outcome that included pooled data, we used the GRADE method to determine evidence quality, downgrading evidence from high quality by one level for serious (or two for very serious) issues with risk of bias, indirectness of evidence, serious inconsistency, imprecision of effect estimates, or potential publication bias.
Measures of treatment effect
We performed statistical analysis using Review Manager 5 (Revman 2014) software.
We undertook a statistical summary of the data and expressed dichotomous data as risk ratios (RRs) with corresponding 95% confidence intervals (95% CIs). We expressed continuous data as mean differences (MDs) with 95% CIs, or as standardised mean differences (SMDs) if outcomes were conceptually the same but were measured in different ways, for example, by using different instruments (e.g. BDI, HAMD).
Unit of analysis issues
Trials with multiple groups
We included trials with multiple groups and described them in the Characteristics of included studies table. For example, acupuncture might be compared with sham acupuncture, and with no acupuncture in another study group. If investigators included two acupuncture groups, we combined data from both treatment groups. For studies using a sham control and including no treatment control group, we evenly divided shared interventions between groups, as described in the Cochrane Handbook for Systematic Reviews of Interventions (Higgins 2011). When outcomes were repeated measures, we conducted analysis of outcomes at completion of the intervention.
Cluster‐randomised trials
We included cluster‐randomised trials in analyses along with individually randomised trials. We adjusted their[sample sizes or standard errors] using methods described in the Cochrane Handbook for Systematic Reviews of Interventions [Section 16.3.4 or 16.3.6] and provided an estimate of the intracluster correlation coefficient (ICC) derived from trial data (if possible), from a similar trial, or from a study of a similar population. If we used ICCs from other sources, we reported this and conducted sensitivity analyses to investigate effects of variation in the ICC. If we identified both cluster‐randomised and individually randomised trials, we planned to synthesise relevant information. We considered it reasonable to combine results from both types of trials if we noted little heterogeneity between study designs, and if we considered interaction between effects of the intervention and choice of the randomisation unit unlikely. We also acknowledged heterogeneity in the randomisation unit and performed a subgroup analysis to investigate effects of the randomisation unit.
Dealing with missing data
We contacted investigators or study sponsors to verify key study characteristics and to obtain missing numerical outcome data when possible (e.g. when we identified a study in abstract format only). We documented all correspondence with trialists and reported in the full report which trialists responded. When it was unclear whether an intention‐to‐treat (ITT) analysis was performed, we contacted trial authors to request confirmation. In most cases, we obtained extracted data directly from the study itself; these data may represent available case data only. If possible, we calculated data using methods that enable this (e.g. if standard deviations are missing, it may be possible to calculate these from confidence intervals, standard errors, t values, or the like, using methods outlined in Higgins 2011, Section(s) 7.7.3.2 and 7.7.3.3). We sought statistical advice on imputation and attempted this only if most trials in the meta‐analysis provided complete statistics (Higgins 2011).
Assessment of heterogeneity
We investigated heterogeneity between studies by using the I2 statistic (I2 greater than or equal to 50% was considered indicative of heterogeneity). We formally tested heterogeneity by examining the P value of the I2 statistic. When determining the importance of heterogeneity, we took into account the magnitude and direction of effects; and the strength of evidence for heterogeneity (the P value from the Chi2 test or the width of the confidence interval for the I2 statistic).
We interpreted the I2 statistic as follows.
-
10% to 40%: might not be important.
-
30% to 60%: may represent moderate heterogeneity.
-
50% to 90%: may represent substantial heterogeneity.
-
75% to 100%: considerable heterogeneity.
When we detected heterogeneity greater than 75%, we rechecked the data and if necessary contacted study authors to confirm the accuracy of data as reported in the journal article.
Assessment of reporting biases
Reporting biases arise when dissemination of research findings is influenced by the nature and direction of results (Higgins 2011). We investigated potential biases of publication using the funnel plot or another analytical method (Egger 1997). If we included 10 or more studies in the meta‐analysis, we investigated reporting biases (such as publication bias) by assessing funnel plot asymmetry visually. If asymmetry was suggested by visual assessment, we explored possible reasons by performing the tests proposed in the Cochrane Handbook for Systematic Reviews of Interventions (Higgins 2011).
Data synthesis
We used a random‐effects model to pool the results of all studies because this model is more conservative than a fixed‐effect model, and it incorporates both within‐study and between‐study variance. This change from the original protocol was due to the heterogeneity of studies.
If data were not reported in a form that would allow inclusion in the meta‐analysis, we reported the findings narratively.
Subgroup analysis and investigation of heterogeneity
Effects of acupuncture may be influenced by mode of stimulation and style of acupuncture administered. We planned to undertake prespecified subgroup analysis to examine effects of the mode of acupuncture stimulation used (i.e. manual, electro‐acupuncture, or laser); and different acupuncture styles applied (e.g. classical/traditional acupuncture vs single‐point therapy, auricular acupuncture). We also planned to conduct a subgroup analysis of different forms of acupuncture by using a classification of invasive and non‐invasive controls that may be influenced by bias derived from unblinding and physiological activity.
When we identified other psychological and pharmacological interventions, we planned to conduct subgroup analysis for the control groups (i.e. CBT vs BT or TCA vs SSRI). We planned to conduct other subgroup analyses to explore effects of treatment among people with different diagnoses (e.g. major depression, dysthymia) and people of different ages (< 65 years and ≥ 65 years).
We planned to conduct an a posteriori subgroup analysis to examine effects of the number of acupuncture treatment sessions provided (< 20 sessions and ≥ 20 sessions) and another analysis to examine outcomes of clinician‐rated versus self‐rated depression scales. We were unable to perform any of the subgroup analyses planned, as all subgroups included too few studies (fewer than five studies).
Sensitivity analysis
A priori, we planned to perform sensitivity analyses of results to look at the possible contribution of:
-
excluding trials that did not clearly report the randomisation process;
-
excluding trials with unclear concealment of random allocation; and
-
excluding trials reporting dropout greater than 20%.
We planned to perform an a posteriori sensitivity analysis to examine the contribution of overall trial quality by excluding trials rated as having overall high risk. We defined trials as having overall high risk if they had high risk of bias in any two or more domains. We defined trials as having overall low risk if they had low risk of bias for randomisation, allocation, and both performance and detection blinding.
'Summary of findings' tables
We prepared 'Summary of findings' tables using GRADEproGDT. These tables present the overall quality of the body of evidence for five comparisons reporting on primary review outcomes at completion of the intervention (severity of depression, adverse events), according to GRADE criteria (study limitations, consistency of effect, imprecision, indirectness, and publication bias). We justified, documented, and incorporated into reporting of results judgements about evidence quality (high, moderate, low) for each outcome.
Results
Description of studies
Results of the search
In total, we retrieved 559 articles through updated searches, and 559 remained after de‐duplication. Two review authors (CS, HM) read the titles and abstracts of all articles retrieved in English, one review author read those provided in Korean (MSL), and another review author read those written in Chinese (LQW). Another review author (PH) resolved discrepancies. We excluded 268 articles on the basis of title or abstract and retained 291 articles for inspection of the full‐text article for eligibility. We excluded a total of 227 studies after reading the full text; we have included in the Excluded studies section only studies reviewed on the basis of title or abstract that did not meet the review inclusion criteria. We included 34 new trials and excluded another 42 studies.
The previous version of this review included 30 trials and excluded 11 trials. See Characteristics of included studies, Characteristics of excluded studies, Characteristics of studies awaiting classification, and Characteristics of ongoing studies. This update includes 64 studies with 7104 participants and excludes 53 studies. See Figure 1.

Study flow diagram.
Included studies
Design
All trials used a parallel‐group design, 43 trials included two groups (acupuncture plus a control group), and 21 trials included three groups. We adjusted the unit of analysis for trials including multiple groups on the basis of the description of study methods provided.
Control groups varied between studies according to the research question. A total of 43 trials used medication alone, and four used control acupuncture combined with medication. Two trials used counselling, one trial usual care, and three trials a wait list. Control acupuncture groups included in four trials used sham inactive laser or electro‐acupuncture technique, four used the non‐invasive placebo sham needle, and three used both minimal and sham types of acupuncture.
Sample size
Sample sizes of studies included in this review ranged from 19 in Whiting 2008 to 755 in MacPherson 2013, with a median of 75 participants in each study.
Setting
A total of 51 studies were undertaken in China, three in the USA, three in Hong Kong, three in Germany, two in Australia, and two in the United Kingdom. Eleven studies recruited participants from both inpatient and outpatient hospital settings, 20 from inpatient settings, 16 from outpatient settings only, and six from the community via advertising or primary care settings; in 11 trials, the setting was unclear.
Participants
Trials recruited participants who met the diagnostic criteria for depression, or who had a clinical presentation of depression as defined by trial authors. Thirteen trials used the DSM (II, III, IV, or V), 33 used the CCMD (2 or 3), and eight used ICD Tenth Revision (ICD‐10) criteria. Ten trials recruited participants on the basis of a clinical presentation of depression. Two trials recruited participants only on the basis of BDI scores ≥ 12, and four used HAMD scores alone. Two trials used the Zung Self‐rating Depression Scale (SDS), one used the Clinical Interview Schedule Revised (CIS‐R; Whiting 2008), and one used Chinese Neuroscience Society diagnostic guidelines (He 2005). Inclusion criteria in addition to ICD‐10, DSM, or CCMD diagnosis were specified as HAMD score > 18 in 29 trials and HAMD score < 18 in five trials; remaining trials did not report a specific required HAMD score for entry.
Interventions
Trials delivered acupuncture that varied in terms of point selection, frequency of treatment, and total number of treatments administered. Most trials (46) used a standardised treatment protocol with a fixed selection of points administered at each acupuncture session. Selection of points varied and included acupuncture points located on arms, legs, abdomen, and head. Fourteen trials used a semi‐standardised treatment protocol consisting of a predefined set of acupuncture points used in combination with acupuncture points selected on the basis of diagnosis and identification of symptomatic patterns. Four trials administered individualised treatment for study participants on the basis of their diagnosis.
A total of 42 trials reported needling duration between 20 and 30 minutes. Needling duration was 30 to 60 minutes in 10 trials. Twelve trials provided no or unclear details.
Three trials provided fewer than 10 sessions, 19 trials between 12 and 18 sessions, and 38 trials between 21 and 60 sessions; four trials did not report the number of sessions. Included trials provided a median of 30 sessions.
One trial provided twice‐daily treatment (He 2007), and 12 trials reported daily treatment. Nineteen trials treated participants five or six days per week. Twenty‐six trials treated participants one to three times a week, and in six trials, treatment frequency was unclear. Some trials started with more frequent treatments before reducing frequency to weekly sessions.
Twenty‐five trials were of six weeks' duration, 17 were of six and a half to 12 weeks' duration, and 17 were of less than six weeks' duration. Duration of treatment was unclear in five trials.
Most trials (42) used manual acupuncture, 13 used electro‐acupuncture, seven used a combination of manual and electro‐acupuncture, and two used laser acupuncture.
Outcomes
Most trials assessed depression using HAMD as the primary outcome measure. Fifty‐four trials used HAMD as the primary outcome measure. Two trials used BDI as the primary outcome, two used CGI‐S, two used SDS, one used Symptom Checklist‐90 (SCL‐90), one used PHQ‐9, and two used a custom scale.
Excluded studies
We excluded 53 trials (see Characteristics of excluded studies). Fourteen studies did not meet the inclusion criteria for the control group (as specified in the methods) owing to a suboptimal dose of medication, lack of a suitable comparison group (as outlined under Types of interventions), or the fact that a non‐specified control group was used. Twenty trials provided data from participants who did not meet the diagnosis for depression. Three trials were duplicate publications in another language or used the same data set as included trials. One trial examined the effect of acupuncture on autonomic function in patients with depression or anxiety, and one trial examined the effect of acupuncture on menopausal symptoms in women with depression. Neither of these studies treated or evaluated the effect of acupuncture on depression. Three trials were quasi‐randomised; five used an intervention that was combined with another active intervention such as herbs; and six were identified as not randomised. We have presented further background information on these trials in the Characteristics of excluded studies section.
Ongoing studies
We identified 14 trials from clinical trial registries as ongoing (see Characteristics of ongoing studies).
Studies awaiting classification
We classified 17 trials as awaiting classification. Fourteen trials were awaiting confirmation of randomisation details, results of two studies were not available, the diagnosis was unclear in one study, and details of treatment required clarification in another trial (see Studies awaiting classification).
New studies found at this update
This update includes 34 new trials (Andreescu 2011;Bosch 2015;Chung 2015;Du 2005;Duan 2011;Fan 2013;Feng 2011;Fu 2006;He 2012;Huang 2013;Li 2008;Li 2011b;Lin 2012;Liu 2006;Liu 2013a; Liu 2015;Lv 2015;Ma 2011;Ma 2012;MacPherson 2013;Pei 2006;Qiao 2007;Qu 2013;Quah‐Smith 2013;Sun 2010;Sun 2013;Sun 2015b;Wang 2014;Wang 2015;Xiao 2014;Xu 2011;Yeung 2011b;Zhang 2005a;Zhang 2007a;Zhang 2009;Zhang 2012), for a total of 64 included trials. We excluded 42 trials since the last update (Arvidsdotter 2014; Bennett 1997; Bergmann 2014; Bin 2007; Carvalho 2013; Chang 2009; Chang 2010, Cocchi 1977; Deng 2013; Dormaemen 2011; Duan 2009;Fan 2015b;Guo 2009;He 2011; Hmwe 2015; Honda 2012; Hou 1996; Hu 2013; Huang 2003;Huo 2013; Khang 2002; Kim 2015; Li 2011; Liu 2013;Man 2014; Mischoulon 2012; Niu 2006; Shi 2014;Sun 2012; Tang 2003b; Tse 2010; Wang 2003; Wang 2006; Wang 2015; Wu 2010; Xie 2009; Xie 2012; Yeung 2011; Zhang 2004; Zhang 2004b; Zhao 2014; Zhou 2015), for a total of 53 excluded trials.
Risk of bias in included studies
See Figure 2 and Figure 3 for a graphical summary of risk of bias assessments performed by review authors for the 64 included studies, based on the seven risk of bias domains. Trial authors described three trials as having low risk of bias for all domains (Andreescu 2011;Chung 2015; Yeung 2011b). Four trials were at low risk of bias for five domains.

Methodological quality graph: review authors' judgements about each methodological quality item presented as percentages across all included studies.

Review authors' judgements about each 'risk of bias' domain for each included study.
Investigators described all trials as randomised.
Allocation
Using Cochrane criteria that rate the adequacy of random allocation concealment, we rated most trials as having low risk (75%; n = 48) and rated no trials as having high risk of bias.
A total of 22 trials used a randomisation sequence that was computer generated, 30 used random tables, two used lot drawing, and Quah‐Smith 2005 used coded beans.
A total of 18 trials assessed allocation concealment as being at low risk of bias; in most trials (46), this was unclear. Five trials performed central randomisation, and 11 trials reported using sealed opaque envelopes. Forty‐six trials did not report the method of allocation, or we assessed their risk as unclear.
Blinding
We assessed blinding as providing low risk of performance bias in 14 trials. Most trials involved comparisons of acupuncture versus medication and could not be blinded; this contributed to assessment of high risk. We assessed a total of 48 trials as having high risk for performance bias. For studies comparing acupuncture versus a sham or placebo acupuncture control, we sought evidence of verification of blinding of participants. We rated 10 trials as having low risk of detection bias. Most trials (35) did not report on blinding of the assessor/clinician or the analyst or used patient‐reported outcome measures.
Incomplete outcome data
We assessed most (37) trials as having low risk of bias for outcome reporting. Eight trials were at high risk owing to dropout or incomplete data ,and reporting bias was unclear in 19 trials. We rated trials as having high risk of bias if dropout rates were uneven between groups and the reason for dropout was related or suspected to be related to group allocation. We also rated trials as having high risk for bias if investigators reported a dropout rate > 20% and did not report how they dealt with this (e.g. ITT analysis, last observation carried forward).
Selective reporting
We rated risk of bias from selective reporting as unclear for most trials owing to no available study protocol. We rated two trials as having high risk of bias and found that Li 2007 did not report data on all included outcomes.
Other potential sources of bias
Risk of bias was unclear for most trials (31). We rated risk from other sources of bias as low for 29 trials. We assessed an imbalance at randomisation in eight trials (Allen 1998;Ding 2003;Fan 2005;Fu 2008;Luo 1988;Luo 1998;Whiting 2008;Xiujuan 1994). We rated trials at high risk of bias if we noted significant baseline imbalance between groups, and at unclear risk if trial authors did not report a baseline analysis.
Effects of interventions
See: Summary of findings for the main comparison Acupuncture compared with no treatment/wait list/treatment as usual for depression; Summary of findings 2 Acupuncture compared with control acupuncture for depression; Summary of findings 3 Acupuncture compared with medication for depression; Summary of findings 4 Acupuncture plus medication compared with medication for depression; Summary of findings 5 Acupuncture compared with psychological therapy for depression
Within each comparison, for each outcome, the overall treatment effect for acupuncture versus control is followed by the individual treatment effect for each mode of stimulation, presented as a series of subcomparisons. Primary endpoint data at the end of the intervention are presented. Data are presented for severity of depression during treatment, at the end of the intervention, and at follow‐up at zero to six months and at six to 12 months.
Comparison 1. Acupuncture versus no treatment/wait list/treatment as usual
Primary outcomes
1.1 Outcome: reduction in the severity of depression at the end of treatment

Forest plot of comparison: 1 Acupuncture versus no treatment/wait list/TAU, outcome: 1.1 Severity of depression at the end of treatment.
Overall six trials of acupuncture provided low‐quality evidence that acupuncture reduced the severity of depression at the end of treatment (SMD ‐0.66, 95% CI ‐1.06 to ‐0.25, six trials, 488 participants, I2 = 64%). We downgraded the evidence for this comparison by two levels owing to high risk of performance bias in most included trials and substantial heterogeneity.
We explored possible reasons for substantial heterogeneity by examining the contributions of clinician‐rated versus self‐rated outcome measures. We found that two trials used self‐rated outcomes. Bosch 2015 and MacPherson 2013 contributed to a significant proportion of this heterogeneity; therefore we analysed clinician‐rated versus self‐reported outcomes separately. The three trials using clinician‐rated outcomes provided evidence of a reduction in the severity of depression at the end of the trial (SMD ‐0.97, 95% CI ‐1.34 to ‐0.60, three trials, 144 participants, I2 = 5%), and the two trials using self‐reported outcomes provided no evidence of a reduction in the severity of depression at the end of the trial (SMD ‐0.23, 95% CI ‐0.73 to 0.27, two trials, 334 participants, I2 = 68%).
Evidence suggested a reduction in depression for manual acupuncture compared with control (SMD ‐0.56, 95% CI ‐0.98 to ‐0.15, five trials, 458 participants, I2 = 62%) and electro‐acupuncture (SMD ‐1.26, 95% ‐2.10 to ‐0.43, one trial, 30 participants).
1.2 Outcome: adverse events
One study reported this outcome. This trial of manual acupuncture found low‐quality evidence of no difference in adverse event rates between groups (RR 0.89, 95% 0.35 to 2.24, one trial, 302 participants). We downgraded the evidence for this comparison by two levels owing to high risk of performance bias and the fact that only one trial reported on these relatively rare events.
Secondary outcomes
1.3 Outcome: reduction in the severity of depression during treatment
Data show some evidence of reduction in the severity of depression during treatment (MD ‐6.75, 95% CI ‐9.12 to ‐4.38, two trials, 137 participants, I2 = 21%).
A trial of manual acupuncture found a reduction in the severity of depression (MD ‐7.04, 95% ‐11.08 to ‐3.00, two trials, 107 participants, I2 = 58%), as did a small trial of electro‐acupuncture (MD ‐6.24, 95% CI ‐9.12 to ‐4.38, one trial, 30 participants).
1.4 Outcome: reduction in the severity of depression zero to six months after treatment
Data show a reduction in depression from manual acupuncture at six months following completion of treatment (MD ‐1.90, 95% CI ‐3.01 to ‐0.79, one trial, 237 participants).
1.5 Outcome: reduction in the severity of depression six to 12 months after treatment
Researchers found no evidence of a reduction in depression from manual acupuncture at 12 months (MD ‐1.00, 95% CI ‐2.53 to 0.53, one trial, 235 participants).
1.6 Outcome: remission of depression
Two small trials found no evidence of a difference in remission of depression from manual acupuncture (RR 1.67, 95% CI 0.77 to 3.65, two trials, 94 participants, I2 = 0%) (Allen 1998; Allen 2006).
1.7 Outcome: change in medication
One trial found no evidence of a difference in medication change from manual acupuncture compared with control (RR 0.91, 95% CI 0.73 to 1.14, one trial, 302 participants) (MacPherson 2013).
1.8 Dropout from treatment
One trial found no difference in dropout at the end of manual acupuncture treatment compared with control (RR 1.00, 95% CI 0.21 to 4.88, one trial, 302 participants) (MacPherson 2013).
Comparison 2. Acupuncture versus control acupuncture
Comparisons are made between invasive and non‐invasive controls. Invasive controls included non‐channel points (Andreescu 2011; Fan 2005; Fu 2006; Li 2008; Li 2011b), needling acupuncture points unrelated to depression (Allen 1998; Allen 2006), minimal insertion just into the skin layer (Fan 2013), different acupuncture points (Sun 2010; Sun 2013), and minimal insertion on specific non‐depression points (Chung 2015; Whiting 2008; Yeung 2011b). Non‐invasive controls included placebo needles (Chung 2015; Fan 2013; Yeung 2011b), mock electro‐acupuncture (Andreescu 2011; Yeung 2011b), and mock laser acupuncture (Quah‐Smith 2005; Quah‐Smith 2013).
Primary outcomes
2.1 Severity of depression at the end of treatment

Forest plot of comparison: 2 Acupuncture versus control acupuncture, outcome: 2.1 Severity of depression at the end of the intervention.
Low‐quality evidence suggests a reduction in the severity of depression between acupuncture and control at the end of the trial; however, substantial heterogeneity can likely be explained by the mode of stimulation and activity from the control (MD ‐1.69, 95% CI ‐3.33 to ‐0.05, 14 trials, 841 participants, I2 = 80%). We downgraded evidence by one level in most studies for high risk of performance bias and high risk of bias in at least one other domain. We also downgraded evidence by one level on the basis of substantial heterogeneity.
2.1.1 Manual acupuncture versus invasive control
We found no evidence of a reduction in the severity of depression in the acupuncture group compared with an invasive control group (MD ‐2.97, 95% CI ‐6.26 to 0.31, seven trials, 418 participants, I2 = 81%). Clinical heterogeneity among types of invasive controls is likely a contributing factor. Fan 2013, using SCL‐90, found evidence suggesting that acupuncture reduced the severity of depression to a greater extent than the invasive control (MD ‐0.44, 95% CI ‐0.58 to ‐0.30, 95 participants).
2.1.2 Electro‐acupuncture versus invasive control
Trials provided no evidence of a difference between groups (MD 0.43, 95% ‐0.54 to 1.4, five trials, 251 participants, I2 = 0%).
2.1.3 Electro‐acupuncture versus non‐invasive control
Data show no evidence of a reduction in depression between groups (MD 0.17, 95% CI ‐2.14 to 2.48, two trials, 99 participants, I2 = 35%).
2.1.4 Laser acupuncture versus non‐invasive control
Researchers found evidence of reduced depression in the laser acupuncture group compared with the control group (MD ‐5.51, 95% CI ‐8.30 to ‐2.73, two trials, 73 participants, I2 = 0%).
2.2 Adverse events
Overall moderate‐quality evidence shows no difference in the rate of adverse events between acupuncture groups and control groups (RR 1.63, 95% 0.93 to 2.86, five trials, 300 participants, I2 = 10%). We downgraded this evidence by one level owing to the small sample size and the relatively rare nature of adverse events.
2.2.1 Manual acupuncture versus invasive control
One trial reported on this outcome (Whiting 2008), providing no evidence of a difference between groups (RR 2.50, 95% CI 0.15 to 40.37, one trial,17 participants). One additional trial reported on this outcome using continuous data suggesting increased risk of adverse events from acupuncture (MD 8.30, 95% CI 6.88 to 9.72, one trial, 43 participants) (Li 2011b).
2.2.2 Electro‐acupuncture versus invasive control
Investigators found no evidence of a difference between groups (RR 1.79, 95% CI 0.99 to 3.25, four trials, 245 participants, I2 = 16%).
2.2.3 Electro‐acupuncture versus non‐invasive control
One trial reported on this outcome and provided no evidence of differences between groups (RR 0.40, 95% CI 0.05 to 3.08, one trial, 39 participants) (Yeung 2011b).
2.2.4 Laser acupuncture versus non‐invasive control
Quah‐Smith 2013 reported no difference in the rate of adverse events between laser and sham laser acupuncture. Researchers collected adverse event data on dizziness, aches, transient fatigue, prolonged fatigue, vagueness, and nausea. On a 0 to 6 scale (6 indicating maximum intensity), mean scores were as follows: minimal transient fatigue in the laser group ‐ 0.67, and in the sham laser group, aches 0.11, transient fatigue 1.0, days of fatigue 0.71, and vagueness 0.52.
Secondary outcomes
2.3 Severity of depression during treatment
Data show no evidence of a difference between groups in the severity of depression during treatment (MD 0.04, 95% CI ‐0.81 to 0.90, six trials, 413 participants, I2 = 0%).
2.3.1 Manual acupuncture versus invasive control
We found no evidence of a difference between manual acupuncture and control (MD 0.09, 95% CI ‐2.55 to 2.74, two trials, 117 participants, I2 = 2%).
2.3.2 Electro‐acupuncture versus invasive control
Trials provided no evidence of a difference between electro‐acupuncture and control (MD 0.16, 95% CI ‐0.92 to 1.24, four trials, 197 participants, I2 = 0%).
2.3.3 Electro‐acupuncture versus non‐invasive control
Data show no evidence of a difference between electro‐acupuncture and control (MD ‐0.45, 95% CI ‐2.71 to 1.80, two trials, 99 participants, I2 = 37%).
2.4 Severity of depression at zero to six months' follow‐up
2.4.1 Manual acupuncture versus invasive control
One trial reported on this outcome (Fan 2013), providing evidence of benefit at six months (MD ‐0.85, 95% CI ‐0.98 to ‐0.72, one trial, 95 participants).
2.5 Remission of depression
Overall evidence showed a greater remission rate following acupuncture (RR 1.91, 95% 1.14 to 3.21, 10 trials, 601 participants, I2 = 48%).
2.5.1 Manual acupuncture versus invasive control
Data show no evidence of improvement in remission rates between groups (RR 1.89, 95% CI 0.75 to 4.75, five trials, 368 participants, I2 = 63%).
2.5.2 Electro‐acupuncture versus invasive control
Trials provided no evidence of improvement in remission rates between groups (RR 1.23, 95% 0.35 to 4.29, two trials, 87 participants, I2 = 20%).
2.5.3 Electro‐acupuncture versus non‐invasive control
We found no evidence of improvement in remission rates between groups (RR 2.15, 95% CI 0.60 to 7.67, one trial, 73 participants).
2.5.4 Laser acupuncture versus non‐invasive control
Evidence suggests greater remission from laser acupuncture compared with control (RR 3.00, 95% CI 1.48 to 6.09, two trials, 73 participants, I2 = 0%).
2.6 Quality of life (emotional) during treatment
One trial reported on this outcome (Chung 2015), providing no evidence of a difference between groups (MD ‐1.98, 95% CI ‐5.41 to 1.45, one trial, 150 participants).
2.6.1 Electro‐acupuncture versus invasive control
Investigators provided no evidence of a difference between groups (MD ‐2.09, 95% CI ‐6.54 to 2.36, one trial, 90 participants).
2.6.2 Electro‐acupuncture versus non‐invasive control
Data show no evidence of a difference between groups (MD ‐1.81, 95% CI ‐7.18 to 3.56, one trial, 60 participants).
2.7 Quality of life (emotional) at the end of treatment
Two trials reported on this outcome and provided moderate evidence of no difference in emotional quality of life between groups (MD ‐2.25, 95% CI ‐5.89 to 1.39, two trials, 167 participants, I2 = 0%). We downgraded the evidence for this comparison by one level owing to the small sample size.
2.7.1 Manual acupuncture versus invasive control
Researchers provided no evidence of a difference between groups (MD ‐5.0, 95% CI ‐36.47 to 26.47, one trial, 17 participants). One trial reported on changes from baseline between groups and described no difference between groups (acupuncture 6.2 (13.6) vs control 14.1 (17.5)) (Andreescu 2011).
2.7.2 Electro‐acupuncture versus invasive control
Data show no evidence of a difference between groups (MD ‐2.55, 95% CI ‐7.38 to 2.28, one trial, 90 participants).
2.7.3 Electro‐acupuncture versus non‐invasive control
We found no evidence of a difference between groups (MD ‐1.76, 95% CI ‐7.38 to 3.86, one trial, 60 participants).
2.8 Quality of life (physical) during treatment
One trial reported on this outcome and found no differences between groups (MD ‐0.99, 95% CI ‐4.74 to 2.77, 150 participants) (Chung 2015).
2.8.1 Electro‐acupuncture versus invasive control
Investigators provided no evidence of a difference between groups (MD ‐2.62, 95% CI ‐7.07 to 1.83, one trial, 90 participants).
2.8.2 Electro‐acupuncture versus non‐invasive control
Data show no evidence of a difference between groups (MD 1.26, 95% CI ‐4.12 to 6.64, one trial, 60 participants).
2.9 Quality of life (physical) at the end of treatment
One trial reported on this outcome (Chung 2015), revealing that at the end of treatment, low‐quality evidence suggested no differences between groups in quality of life (MD ‐5.12, 95% CI ‐10.30 to 0.13, one trial, 150 participants). We downgraded the evidence for this comparison by one level because only one small study contributed data for this outcome.
2.9.1 Electro‐acupuncture versus invasive control
Trialists provided evidence of improved quality of life for the control group (MD ‐7.61, 95% CI ‐12.38 to ‐2.38, one trial, 90 participants). One trial reported on changes from baseline between groups and described no differences between groups (acupuncture 0.5 (6.9) vs control ‐1.7 (8.0)) (Andreescu 2011).
2.9.2 Electro‐acupuncture versus non‐invasive control
Data show no evidence of a difference between groups (MD ‐2.23, 95% ‐7.81 to 3.35, one trial, 60 participants).
2.10 Change in medication
2.10.1 Electro‐acupuncture versus non‐invasive control
Investigators provided no evidence of a difference between groups (MD ‐0.39, 95% CI ‐1.71 to 0.93, one trial, 70 participants).
2.11 Dropout from treatment
We found no difference in dropout between groups (RR 1.04, 95% CI 0.62 to 1.75, seven trials, 501 participants, I2 = 0%).
2.11.1 Manual acupuncture versus invasive control
Researchers presented no evidence of a difference between groups (RR 0.60, 95% CI 0.16 to 2.29, one trial, 60 participants).
2.11.2 Electro‐acupuncture versus invasive control
Data show no evidence of a difference between groups (RR 1.01, 95% CI 0.51 to 2.02, four trials, 224 participants, I2 = 0%).
2.11.3 Electro‐acupuncture versus non‐invasive control
Investigators provided no evidence of a difference between groups (RR 1.48, 95% CI 0.56 to 3.91, four trials, 217 participants, I2 = 0%).
Comparison 3. Acupuncture versus medication
Primary outcomes
3.1 Severity of depression at the end of treatment
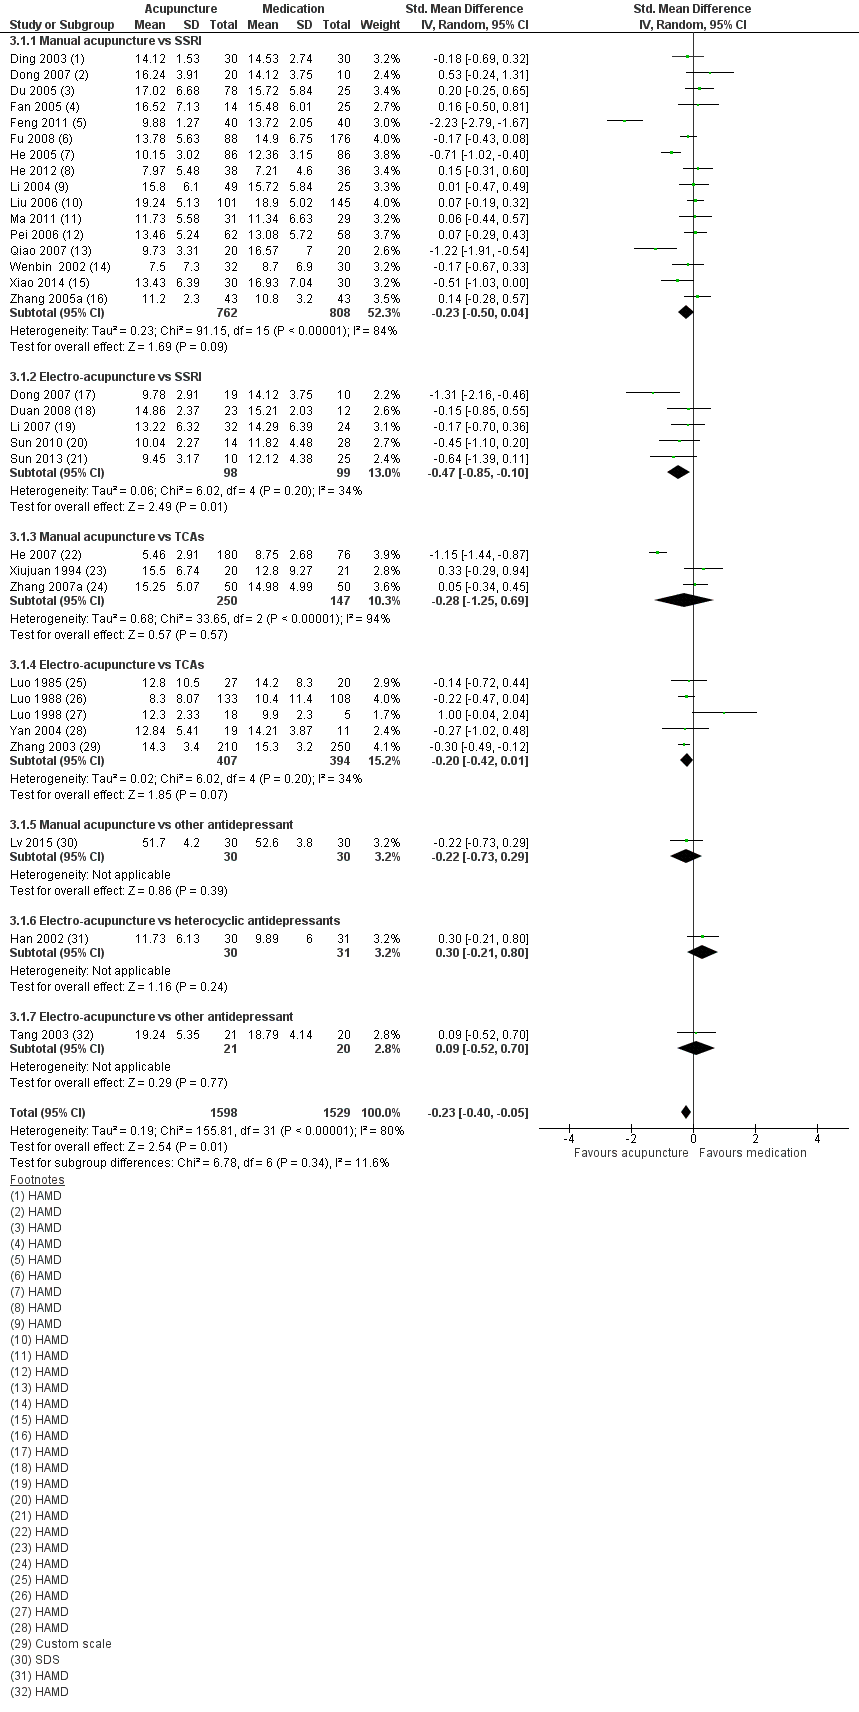
Forest plot of comparison: 3 Acupuncture versus medication, outcome: 3.1 Severity of depression at the end of treatment.
Overall very low‐quality evidence suggests small benefit from acupuncture compared with medication (SMD ‐0.23, 95% CI ‐0.40 to ‐0.05, 31 trials, 3127 participants, I2 = 80%). We explored possible reasons for substantial heterogeneity by examining the contribution of clinician‐rated versus self‐reported outcome measures. Only one study used a self‐reported outcome measure (Lv 2015). Removing this study from the analysis did not significantly reduce heterogeneity nor change the effect size (SMD ‐0.23, 95% CI ‐0.41 to ‐0.05, 30 trials, 3067 participants, I2 = 81%). We downgraded evidence for this comparison by two levels owing to very serious risk of bias, with 30 trials having high risk of bias owing to lack of blinding and 12 trials having high risk of bias owing to lack of blinding of outcome assessors. We also downgraded the evidence by one level because substantial heterogeneity was present.
3.1.1 Manual acupuncture versus SSRI
We found no evidence of benefit among groups (SMD ‐0.23, 95% CI ‐0.50 to 0.04, 16 trials, 1570 participants, I2 = 84%).
3.1.2 Electro‐acupuncture versus SSRI
Data show evidence of benefit from electro‐acupuncture compared with SSRI medication (SMD ‐0.47, 95% CI ‐0.85 to ‐0.10, five trials, 197 participants, I2 = 34%).
3.1.3 Manual acupuncture versus TCAs
Researchers provided no evidence of a reduction in the severity of depression between groups (SMD ‐0.28, 95% CI ‐1.25 to 0.69, three trials, 397 participants, I2 = 94%).
3.1.4 Electro‐acupuncture versus TCAs
Trials presented no evidence of a reduction in the severity of depression between groups (SMD ‐0.20, 95% CI ‐0.42 to 0.01, five trials, 801 participants, I2 = 34%).
3.1.5 Manual acupuncture versus other antidepressant
We found no evidence of a difference between groups (SMD ‐0.22, 95% CI ‐0.73 to 0.29, one trial, 60 participants).
3.1.6 Electro‐acupuncture versus heterocyclic antidepressants
Investigators provided no evidence of a difference between groups (SMD 0.30, 95% CI ‐0.21 to 0.80, one trial, 62 participants).
3.1.7 Electro‐acupuncture versus other antidepressant
We found no evidence of a difference between groups (SMD 0.09, 95% CI ‐0.52 to 0.70, one trial, 41 participants).
3.2 Adverse events
3.2.1 Manual acupuncture versus SSRI
All included studies used the Asberg side effect rating scale (SES). Data show very low‐quality evidence of an increase in adverse events reported by those taking SSRIs compared with manual acupuncture (MD ‐4.32, 95% CI ‐7.41 to ‐1.23, three trials, 481 participants, I2 = 97%). We downgraded the evidence by two levels owing to very serious risk of bias in all three studies, and by two levels owing to considerable heterogeneity.
Secondary outcomes
3.3 Severity of depression during treatment
Overall evidence suggests benefit from acupuncture during treatment regardless of mode of stimulation, and reduced depression compared with medication (MD ‐1.67, 95% CI ‐2.91 to ‐0.43, nine trials, 552 participants, I2 = 55%).
3.3.1 Manual acupuncture versus SSRIs
Investigators provided no evidence of a difference between groups (MD ‐1.38, 95% CI ‐3.2 to ‐0.45, five trials, 340 participants, I2 = 66%).
3.3.2 Electro‐acupuncture versus SSRIs
Data show evidence of a reduction in the severity of depression during treatment from electro‐acupuncture compared with SSRIs (MD ‐2.58, 95% CI ‐4.38 to ‐0.78, three trials, 112 participants, I2 = 29%).
3.3.3 Manual acupuncture versus TCAs
Researchers provided no evidence of a reduction in the severity of depression between groups (MD ‐0.80, 95% CI ‐3.65 to 2.05, one trial, 100 participants).
3.4 Severity of depression zero to six months after treatment
3.4.1 Manual acupuncture versus other antidepressant
We found evidence of benefit derived from manual acupuncture compared with other antidepressant (MD ‐5.60, 95% CI ‐7.60 to ‐3.60, one trial, 60 participants).
3.5 Remission of depression
Evidence suggests remission from acupuncture treatment when compared with medication only (RR 1.16, 95% CI 1.05 to 1.29, 27 trials, 2918 participants, I2 = 24%).
3.5.1 Manual acupuncture versus SSRI
Trialists reported no differences between groups (RR 1.16, 95% CI 0.98 to 1.37, 14 trials, 1332 participants, I2 = 11%).
3.5.2 Electro‐acupuncture versus SSRIs
Researchers described no differences between groups (RR 1.28, 95% CI 0.94 to 1.75, four trials, 188 participants, I2 =0 %).
3.5.3 Manual acupuncture versus TCAs
Investigators provided evidence of benefit in remission from manual acupuncture compared with TCAs (RR 1.32, 95% CI 1.03 to 1.69, four trials, 620 participants, I2 = 39%).
3.5.4 Electro‐acupuncture versus TCAs
Data show no evidence of differences between groups (RR 1.03, 95% CI 0.88 to 1.21, four trials, 778 participants, I2 = 25%).
3.6 Dropout from treatment
Overall no evidence suggests differences in dropout between groups (RR 0.87, 95% CI 0.20 to 3.71, five trials, 246 participants, I2 = 43%).
3.6.1 Manual acupuncture versus SSRIs
Data show no evidence of differences in dropout between groups (RR 0.27, 95% CI 0.03 to 2.47, two trials, 134 participants, I2 = 41%).
3.6.2 Electro‐acupuncture versus SSRIs
Researchers provided no evidence of differences in dropout between groups (RR 1.82, 95% CI 0.43 to 7.79, three trials, 112 participants, I2 = 3%).
Comparison 4. Acupuncture and medication versus medication
Primary outcomes
4.1 Severity of depression at the end of treatment
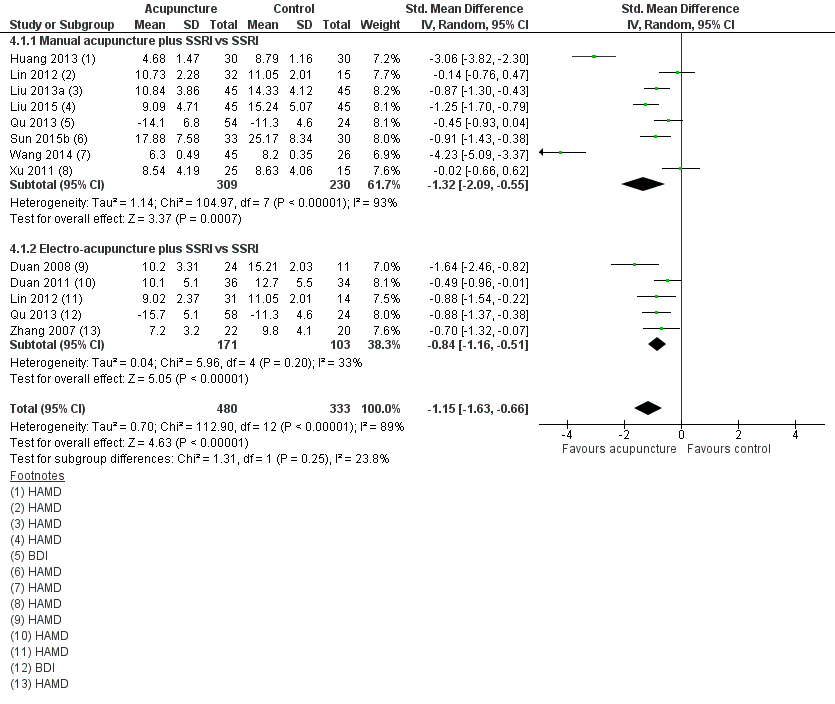
Forest plot of comparison: 4 Acupuncture plus medication vs medication, outcome: 4.1 Severity of depression at the end of treatment.
Overall very low‐quality evidence suggests benefit from acupuncture plus medication compared with medication alone (SMD ‐1.15, 95% CI ‐1.63 to ‐0.66, 12 trials, 813 participants, I2 = 89%).
We explored another possible contribution to the considerable heterogeneity by examining the contributions of clinician‐rated versus self‐reported outcome measures. One study used a self‐rated scale (Qu 2013). Removing this study from analysis did not reduce heterogeneity, which remained considerable (SMD ‐1.25, 95% CI ‐1.83 to ‐0.67, 11 trials, 653 participants, I2 = 91%). We downgraded the evidence for this comparison by two levels owing to the very serious risk of bias present in most trials, and by another two levels for considerable heterogeneity.
4.1.1 Manual acupuncture plus SSRI versus SSRI
We found evidence of a reduction in the severity of depression at the end of treatment from manual acupuncture plus SSRIs compared with SSRIs alone (SMD ‐1.32, 95% CI ‐2.09 to ‐0.55, eight trials, 539 participants, I2 = 93%). We conducted a sensitivity analysis owing to high heterogeneity, possibly resulting from the very small standard deviations reported in one study (Wang 2014). We contacted the trial authors, who confirmed that the standard deviations were accurate. Removal of Wang 2014 from analysis resulted in no change in the direction of benefit but altered the effect size. Heterogeneity remained substantial (SMD ‐0.93, 95% CI ‐1.52 to ‐0.35, seven trials, 468 participants, I2 = 88%).
4.1.2 Electro‐acupuncture plus SSRIs versus SSRIs
Investigators provided evidence of a large effect reduction in the severity of depression during treatment from electro‐acupuncture plus SSRI compared with SSRIs alone (SMD ‐0.84, 95% CI ‐1.16 to ‐0.51, five trials, 274 participants, I2 = 33%).
4.1.3 Manual acupuncture plus TCAs versus TCAs
Trials provided evidence of a reduction in the severity of depression during treatment from manual acupuncture plus TCAs compared with TCAs alone (SMD ‐3.06, 95% CI ‐3.82 to ‐2.30, one trial, 60 participants).
4.2 Adverse events
Two studies used the Asberg side effect scale (SES) (Huang 2013; Liu 2013a), and one study used the Toxic Exposure Surveillance System (TESS) (Duan 2008). We found very low‐quality evidence of no differences between groups in the numbers of adverse events recorded (SMD ‐1.32, 95% CI ‐2.86 to 0.23, three trials, 200 participants, I2 = 95%). We downgraded the evidence for this comparison by two levels owing to very serious risk of bias, and by another two levels owing to considerable heterogeneity.
4.2.1 Manual acupuncture plus SSRIs versus SSRis alone
We found no evidence of a difference between groups (SMD ‐0.37, 95% CI ‐1.20 to 0.47, two trials, 150 participants).
4.2.2 Electro‐acupuncture plus SSRIs versus SSRIs alone
Data provide evidence of a reduction in adverse events for electro‐acupuncture (SMD ‐3.39, 95% CI ‐4.27, to ‐2.50, one trial, 60 participants).
Secondary outcomes
4.3 Severity of depression during treatment
Overall evidence suggests a reduction in the severity of depression from acupuncture (SMD ‐1.60, 95% CI ‐2.45, to ‐0.76, six trials, 514 participants, I2 = 95%).
4.3.1 Manual acupuncture plus SSRIs versus SSRIs
Evidence suggests a reduction in the severity of depression during treatment from manual acupuncture plus SSRIs compared with SSRIs alone (SMD ‐1.81, 95% CI ‐2.83 to ‐0.80, six trials. 432 participants, I2 = 95%). We performed a sensitivity analysis owing to high heterogeneity, possibly resulting from the very small standard deviations presented in one study (Wang 2014). We contacted the trial authors, who confirmed that the standard deviations were accurate. Removal of Wang 2014 resulted in no change in the direction of benefit but altered effect size and heterogeneity (SMD ‐0.80, 95% CI ‐1.02 to ‐0.58, five trials, 361 participants, I2 = 0%).
4.3.2 Electro‐acupuncture plus SSRIs versus SSRIs
Overall data show evidence of a reduction in the severity of depression during treatment from electro‐acupuncture plus SSRIs compared with medication alone (SMD ‐0.70, 95% CI ‐1.19 to ‐0.21, one trial, 82 participants).
4.4 Remission of depression
Data show no evidence of a difference between groups (RR 1.21, 95% CI 0.85 to 1.73, nine trials, 618 participants, I2 = 61%).
4.4.1 Manual acupuncture plus SSRIs versus SSRIs
Data show no evidence of a difference between groups (RR 1.33, 95% CI 0.65 to 2.73, five trials, 299 participants, I2 = 76%).
4.4.2 Electro‐acupuncture plus SSRIs versus SSRIs
Researchers provided no evidence of a difference between groups (RR 1.17, 95% CI 0.75 to 1.80, four trials, 120 participants, I2 = 49%).
4.4.3 Manual acupuncture plus heterocyclic antidepressant versus heterocyclic antidepressant alone
Investigators provided evidence of an increase in remission in the acupuncture plus medication group (RR 4.36, 95% CI 0.53 to 36.12, one trial, 46 participants).
4.5 Quality of life (physical)
4.5.1 Manual acupuncture plus SSRIs versus SSRIs
Very low‐quality evidence suggests benefit from manual acupuncture in one small trial (MD 1.4, 95% CI 0.15 to 2.65, 64 participants). We downgraded the evidence for this comparison by one level because only one small study reported this outcome, and by two levels owing to very serious risk of bias.
4.5.2 Electro‐ acupuncture plus SSRIs versus SSRIs
Data show no differences between groups (MD 1.0, 95% CI ‐0.18 to 2.18, 63 participants).
4.6 Quality of life (emotional)
Very low‐quality evidence suggests no differences between groups (MD 0.25, 95% CI ‐0.9 to 1.4, two trials, 219 participants, I2 = 71%). We downgraded the evidence for this comparison by two levels owing to very serious risk of bias, and by one level because of substantial heterogeneity.
4.6.1 Manual acupuncture plus SSRIs versus SSRIs
We found no evidence of a difference between groups (MD 0.10, 95% CI ‐1.46 to 1.65, two trials, 111 participants, I2 = 66%).
4.6.2 Electro‐acupuncture plus SSRIs versus SSRIs
Investigators provided no evidence of a difference between groups (MD 0.35, 95% CI ‐2.0 to 2.7, two trials, 108 participants, I2 = 86%).
4.7 Change in medication
We found evidence of reduced risk of using medication in the acupuncture and SSRI group compared with the SSRI alone group (RR 0.39, 95% CI 0.22 to 0.67, three trials, 236 participants, I2 = 0%).
4.7.1 Manual acupuncture plus SSRIs versus SSRIs
Evidence suggests reduced medication use in the manual acupuncture plus medication group (RR 0.38, 95% CI 0.20 to 0.72, two trials, 154 participants, I2 = 0%).
4.7.2 Electro‐acupuncture plus SSRIs versus SSRIs
Data show no evidence of a difference between groups (RR 0.41, 95% CI 0.13 to 1.30, one trial, 82 participants).
4.8 Dropout from treatment
Trials provided no evidence of a difference between groups (RR 0.70, 95% 0.35 to 1.42, six trials, 426 participants, I2 = 0%).
4.8.1 Manual acupuncture plus SSRIs versus SSRIs
Investigators provided no evidence of a difference between groups (RR 0.45, 95% CI 0.18 to 1.15, three trials, 234 participants, I2 = 0%).
4.8.2 Electro‐ acupuncture plus SSRIs versus SSRIs
Data show no differences between groups (RR 1.23, 95% CI 0.43 to 3.51, three trials, 192 participants, I2 = 0%).
Comparison 5. Acupuncture versus psychological treatment
Two trials reported on this outcome (MacPherson 2013;Wang 2015). Owing to significant differences in the psychological treatment delivered in these two trials, we did not combine them in the meta‐analysis. MacPherson 2013 used counselling, as delivered by a member of the British Association for Counselling and Psychotherapy, and Wang 2015 delivered an educational intervention with some participants receiving psychological guidance, but investigators did not specify the number or duration of sessions nor the content of these sessions.
Primary outcomes
5.1 Severity of depression at the end of treatment
5.1.1 Manual acupuncture
MacPherson 2013 found no evidence of a difference when comparing acupuncture with counselling alone (MD ‐0.80, 95% CI ‐1.92 to 0.32, one trial, 453 participants). Wang 2015 found evidence of benefit of acupuncture compared with the educational and psychological control (MD ‐6.49, 95% CI ‐10.33 to ‐2.65, one trial, 44 participants). Overall the quality of evidence for this comparison was low. We downgraded the evidence for this comparison by one level because both trials had high risk of performance bias, and by one level because results show substantial heterogeneity. However results for both studies show the same direction of effect.
5.2 Adverse events
5.2.1 Manual acupuncture
Trials provided low‐quality evidence suggesting no differences between groups (RR 0.62, 95% CI 0.29 to 1.33, one trial, 453 participants). We downgraded the evidence for this comparison by one level for risk of bias due to performance bias, and by one level because only one study contributed to this outcome.
Secondary outcomes
5.3 Severity of depression at zero to six months' follow‐up
5.3.1 Manual acupuncture
Data show no differences between groups (MD 0.50, 95% ‐0.51 to 1.51, one trial, 453 participants).
5.4 Severity of depression at six to 12 months
5.4.1 Manual acupuncture
Trialists found no differences between groups (MD 0.60, 95% CI ‐0.80 to 2.00, one trial, 453 participants).
5.5 Remission of depression
(Analysis 5.5)
5.5.1 Manual acupuncture
Data show no evidence of differences between groups (RR 1.50, 95% CI 0.81 to 2.79, one trial, 25 participants).
5.6 Change in use of medication
5.6.1 Manual acupuncture
Researchers provided no evidence of a difference between groups (RR 0.82, 95% CI 0.61 to 1.1, 453 participants).
5.7 Dropout
5.7.1 Manual acupuncture
Evidence shows greater dropout from psychological treatment than from acupuncture (RR 0.27, 95% CI 0.08 to 0.90, one trial, 453 participants).
Comments on heterogeneity
Overall, the acupuncture trials were clinically highly heterogeneous and used a diverse range of acupuncture dosages. Electro‐acupuncture treatment duration ranged from three to six weeks, and treatment was administered two days per week to daily in treatment sessions lasting from 30 to 60 minutes, with a total course of treatment ranging from nine to 42 sessions. Ten trials used a standard point prescription, and four were semistandardised, allowing some variation based on diagnosis. Manual acupuncture trials were equally diverse, treatment duration ranged from two to 12 weeks, and acupuncture was administered from once a week to twice daily in treatment sessions lasting from 20 to 60 minutes, with a total course of treatment lasting 12 to 60 sessions. Twenty‐six trials used a standardised point prescription and eight used a semistandardised prescription; only three trials provided individualised treatment. Control acupuncture was also highly heterogeneous, with controls ranging from non‐channel points, to points unrelated to depression, minimal insertion, placebo needles, mock electro‐acupuncture, and mock laser acupuncture. Medication comparisons were less heterogeneous, with most trials describing administration of fluoxetine as the SSRI medication; however, investigators occasionally used other SSRIs such as paroxetine.
Sensitivity analysis
We proposed to undertake a sensitivity analysis of results to look at possible contributions of differences in risk of bias to robustness of the results, for example, by excluding trials with unclear concealment of random allocation; or excluding trials with greater than 20% dropout. Overall, we could not perform a sensitivity analysis for most comparisons because of lack of studies (fewer than five) in each group. When acupuncture was compared with medication, data show no significant change in the severity of depression when we removed studies unclearly describing randomisation (SMD ‐0.25, 95% CI ‐0.46 to ‐0.03, 21 trials, 1853 participants, I2 = 78%). Only two trials reported dropout greater than 20% (Allen 2006; Whiting 2008), and we could not perform a sensitivity analysis. We planned an a posteriori sensitivity analysis to examine the effects of studies undertaken in China; however, removal of these studies left one or two trials remaining in each comparison and therefore would not provide any additional useful information. We had also planned an a posteriori analysis on the effect of risk of bias (high‐risk vs low‐risk studies); however we identified insufficient trials with low risk of bias in each comparison to obtain any useful information.
Subgroup analyses
We planned several subgroup analyses to explore differences in effects of treatment among people with different diagnoses (e.g. major depression, dysthymia) and of different ages (< 65 years and ≥ 65 years) between psychological therapies and pharmacological interventions, effects of clinician‐rated versus self‐reported scales for depression, and effects of differing numbers of treatment sessions (< 20 and ≥ 20 sessions). We undertook none of these analyses because of paucity of data resulting in fewer than five studies in each subgroup.
Reporting bias
We inspected funnel plots for asymmetry in either of the primary outcome measures when 10 or more trials were included in the meta‐analysis (see Figure 8; Figure 9; Figure 10). We found no evidence of major asymmetry suggesting publication bias, especially in the light of true heterogeneity resulting from significantly different study interventions.

Funnel plot of comparison: 2 Acupuncture versus control acupuncture, outcome: 2.1 Severity of depression at the end of the intervention.

Funnel plot of comparison: 3 Acupuncture versus medication, outcome: 3.1 Severity of depression at the end of treatment.

Funnel plot of comparison: 4 Acupuncture plus medication vs medication, outcome: 4.1 Severity of depression at the end of treatment.
Discussion
Summary of main results
We included in the meta‐analysis 63 trials with 7060 participants. Data show wide diversity among acupuncture interventions and comparators used to evaluate acupuncture for treatment of individuals with depression.
Acupuncture compared with no treatment/wait list/treatment as usual
For our primary outcome of severity of depression, we found low‐quality evidence from five trials of reduced severity of depression at the end of acupuncture treatment compared with no treatment/wait list/treatment as usual. Researchers found reduced severity of depression that was significant during treatment for acupuncture compared with no treatment/wait list/treatment as usual, and one trial reported that benefit was sustained at six months. We found no evidence of differences in adverse events between acupuncture and usual care and treatment as usual.
Acupuncture compared with control acupuncture
Fourteen trials examined the efficacy of acupuncture compared with an acupuncture control and found reduced severity of depression at the end of the acupuncture intervention (low‐quality evidence). Investigators found no difference in depression severity during treatment when acupuncture was compared with control acupuncture, and no evidence of a difference in adverse events between acupuncture and control acupuncture. Data show evidence of benefit from acupuncture, with increasing remission rates when compared with control acupuncture.
Acupuncture compared with medication alone
Acupuncture alone compared with medication alone reduced depression both during and at the end of treatment (very low‐quality evidence). We found evidence of greater side effects from medication than were noted with acupuncture. However, this outcome was not widely reported. Acupuncture compared with medication alone increased remission rates for depression.
Acupuncture plus medication compared with medication alone
Acupuncture plus medication compared with medication alone reduced depression both during and at the end of treatment (very low‐quality evidence). We found evidence of greater side effects from medication alone than were reported with a combination of acupuncture plus medication. However, this outcome was not widely reported. Data provide evidence of reduced use of medication and improved aspects of quality of life in the acupuncture plus medication groups, although only a small number of studies reported on these outcomes.
Acupuncture compared with psychological therapy
Researchers have provided no evidence of a difference in the severity of depression between acupuncture and a counselling intervention (low‐quality evidence). Psychological treatment was followed by a greater dropout rate than was reported with acupuncture, but data show no evidence of an effect on other outcomes. The effect of acupuncture on secondary outcomes, which included remission of symptoms, dropout, reduced use of medication, and quality of life, is limited in that fewer studies reported on these outcomes.
For both primary and secondary outcomes, evidence was of moderate to very low quality as assessed by the GRADE approach, and trial results were heterogeneous. Many comparisons are characterised as having significant clinical and substantial or considerable statistical heterogeneity. This relates to dosing characteristics of the intervention and the heterogeneity of controls, including dosages of medication and degree of physiological activity of acupuncture controls. Within comparisons, we presented data by mode of acupuncture stimulation (manual acupuncture, electro‐acupuncture, and laser acupuncture). The direction of effects within comparisons was similar, possibly suggesting that specific treatment effects may be similar. Although comparisons between acupuncture and different controls are not consistent in their findings, most comparisons suggest a beneficial effect from acupuncture, although the potential for bias exists. Owing to small numbers of identified studies, we have been unable to identify treatment dose parameters that may moderate and influence treatment outcomes.
We have highlighted additional sources of bias throughout the review, but participants' expectations and their often unblinded status may play a role. For trials that reported no blinding, the expectation of effects may be greater and the placebo effect larger. For trials of depression with a known placebo effect in mild to moderate depression, the larger placebo effects that might be expected from acupuncture may lead to methodological challenges and increased awareness of the need to design studies that may detect a beneficial treatment effect of true acupuncture. Overall we found no evidence of differences in depression severity when clinicians rather than participants rated depression, except in a comparison for which participants were unblinded to treatment between acupuncture and no treatment/wait list/usual care. The influence of lack of blinding and expectations may contribute to these findings. Fewer studies examined the role of acupuncture compared with a control such as a sham procedure or device. Placebo‐controlled trials included in this review show an overall small benefit derived from acupuncture compared with this control; however, heterogeneity is high and different controls may differ in terms of how inert or credible they are, or whether they produce a placebo effect. Addressing these differences is a priority suggested for future studies.
Overall completeness and applicability of evidence
Many styles of acupuncture may be provided, including individualised Traditional Chinese Medicine and approaches using standardised or semistandardised acupuncture points, as were used in most of the trials included in this review. This systematic review has documented wide variation in modes of stimulation, duration of needling, numbers of points used, depth of needling, and trial duration. Many studies administered suboptimal treatment doses of acupuncture. We also noted diversity in the clinical settings from which participants were recruited, and in trial inclusion and exclusion criteria. Most included trials were reported from China, and others were reported from Australia, Germany, United Kingdom, and United States. Trials from China recruited participants largely from an inpatient or mixed inpatient‐outpatient setting, and most of the studies conducted outside of China recruited participants from primary healthcare and community settings. It is unclear how treatment protocols used in this research may be generalisable to acupuncture as it is usually practised. We found insufficient reporting of the rationale for acupuncture used in the research setting. Variation may reflect the context in which acupuncture is practised. However, one pragmatic trial delivered a treatment intervention with high external validity and evidence of generalisability (MacPherson 2013).
Meta‐analyses of clinical trials of antidepressant medication, in particular the new‐generation antidepressants, show that treatment effects were clinically significant only with extremely depressed patients (Kirsch 2008), and suggest that the pattern of treatment response may be attributed to a decrease in response to placebo rather than to an increase in response to medication. A recent systematic review and meta‐analysis confirmed that the placebo response in major depressive disorder is large, regardless of the intervention provided (Brunoni 2009). Acupuncture has been described as a complex intervention, and some of the incidental components of the effects of treatment may contribute to the placebo effect. We discuss this further in the section describing Quality of the evidence.
It should also be noted that none of the primary studies of comparisons between acupuncture and medication have reported that the purpose of the research was to examine equivalence or non‐inferiority, nor superiority. Many trials did not report on outcomes other than depression and did not consistently report adverse events; among these studies, we found that long‐term follow up was scarce.
Many Chinese studies were poorly reported, and despite many attempts, we were unable to obtain complete details of study design features relevant to risk of bias assessment. Reporting on the primary outcome of severity of depression was high, although inclusion and reporting of other outcome measures was low. Follow‐up data after trial completion were rarely provided. It is important that future trials include medium‐ and long‐term follow‐up, given the burden of disease and costs to the individual and society arising from depression. Given the placebo effect associated with depression and its treatment arising from attention, it is important that future trials include follow‐up and provide data from follow‐up periods.
Trials involving comparisons with medication have provided no data on compliance; therefore it is unclear whether outcomes of these study groups could have been affected by suboptimal doses of medication. In some cases, trials used medications currently removed from the market in some countries owing to safety issues and queries about lack of efficacy (Lv 2015;Tang 2003).
Quality of the evidence
Overall the quality of evidence for most comparisons was very low to moderate, limiting our confidence in trial findings. We rated few trials as having low risk of bias, and for most trials, we assigned a rating of high risk of bias in at least one domain.
We rated 75% of trials as having low risk of bias related to sequence generation, although we assessed most trials as having unclear risk of bias in terms of allocation concealment.
High risk of bias was most frequently related to the domains of blinding. However for many comparisons, performance and detection bias is likely to be high because blinding of participants to the interventions provided was not feasible. This caused review authors to downgrade evidence by at least one level for most comparisons, and by two levels when both blinding domains were rated as high risk in at least a third of included studies. For several comparisons, we included only one clinical trial, causing a downgrade for lack of precision.
We rated more than half of trials as having low risk of bias for the domain of attrition bias. We assessed less than half of trials as having low risk of selective bias, and we were able to access published protocols for only a few trials. Adherence to treatment was not well reported, and only a few trials assessed the integrity of blinding among acupuncture controls.
Many comparisons showed substantial (I2 > 50%) heterogeneity, and several had I2 > 90%. Although some of the heterogeneity can be explained by heterogeneity among the interventions themselves, as well as among controls, this finding was often significant enough to result in downgrading of the level of evidence. We were unable to examine the effect of study quality through a sensitivity analysis because we found too few studies that were at low risk of bias. The quality of reporting remains poor in many trials.
The quality of evidence as assessed via GRADE was very low to low for severity of depression, and very low to moderate for adverse events (see summary of findings Table for the main comparison; summary of findings Table 2; summary of findings Table 4; and summary of findings Table 5).
Potential biases in the review process
We excluded cross‐over trials from this review owing to lack of clarity regarding the appropriate period of washout for acupuncture trials. We did not systematically search Chinese language‐only databases for this version of the review; therefore trials meeting our selection criteria beyond those identified may exist. We attempted to minimise publication bias, but such bias remains a possibility because we did not identify for inclusion any trials from China showing a negative treatment effect. We excluded quasi‐randomised controlled trials for this review update (these trials were included in previous versions) because the body of published trials has increased.
An author of the previous version of this review was an author of an included trial. Other review authors extracted data from and assessed the quality of this trial.
Agreements and disagreements with other studies or reviews
We utilised an extensive search strategy, and we identified and included a greater number of trials (64) for our updated review than were identified for five other systematic reviews, which included between seven and 35 trials. Our review update represents a comprehensive assessment of current evidence and is the largest review to date. Five other systematic reviews have examined acupuncture for treatment of individuals with depression (Chan 2015; Leo 2007; Mukaino 2005; Wang 2008;Zhang 2010). Our findings reflect a broader range of comparisons than were included in the Wang 2008 and Leo 2007 reviews, which combined all modes of acupuncture stimulation in their meta‐analyses and excluded all comparisons with medication. Our updated findings differ significantly from those of Mukaino 2005, which included seven trials and found no differences between acupuncture and a wait‐list comparison, between acupuncture and sham acupuncture, or between electro‐acupuncture and antidepressant medication. This difference is likely explained by the larger body of randomised controlled trials reported over time and by differences among trials meeting the inclusion criteria for our review.
One systematic review ‐ Zhang 2010 ‐ found that acupuncture was superior to antidepressant medication for patients who had experienced post‐stroke depression. We did not examine this specific comparison in our review. However, when review authors in Zhang 2010 compared acupuncture plus medication versus medication alone or acupuncture monotherapy versus medication alone, they found no benefit for individuals with major depressive disorder in comparisons with selective serotonin reuptake inhibitor (SSRI) medications. Our review includes 11 studies that became available after publication of Zhang 2010 and provides updated evidence.
Our findings are very similar to those of the most recent review ‐ Chan 2015 ‐ which included a meta‐analysis of trials comparing acupuncture plus medication versus medication alone. This meta‐analysis indicated that acupuncture combined with SSRI medication was superior to SSRI medication alone.
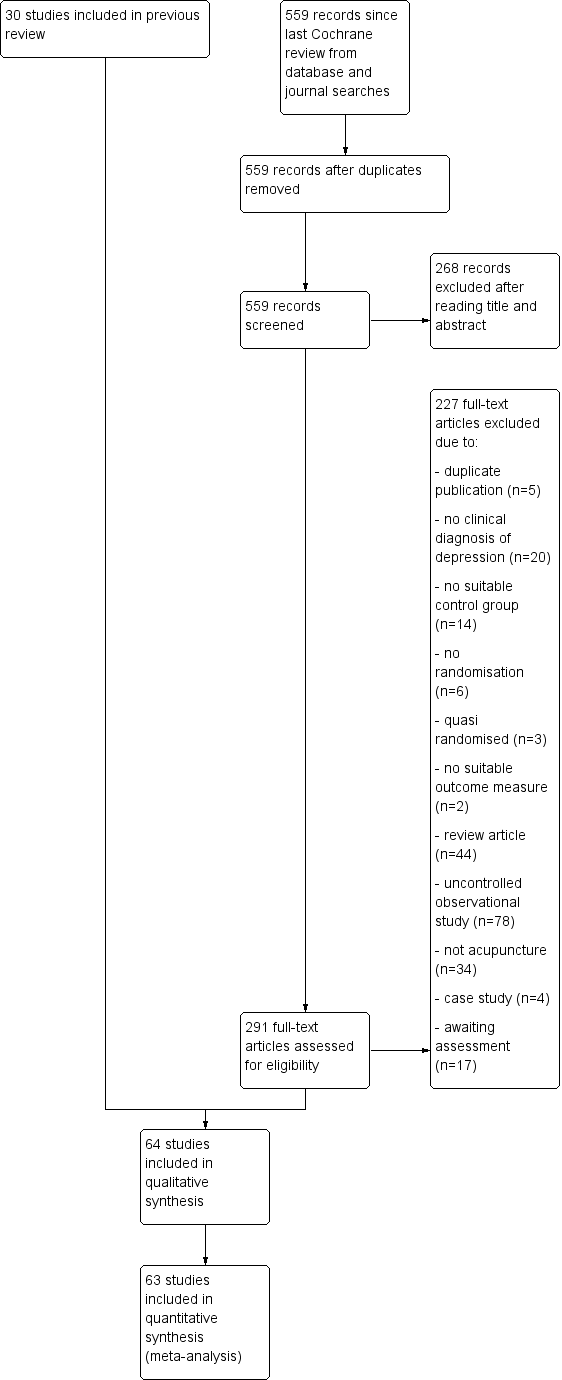
Study flow diagram.

Methodological quality graph: review authors' judgements about each methodological quality item presented as percentages across all included studies.
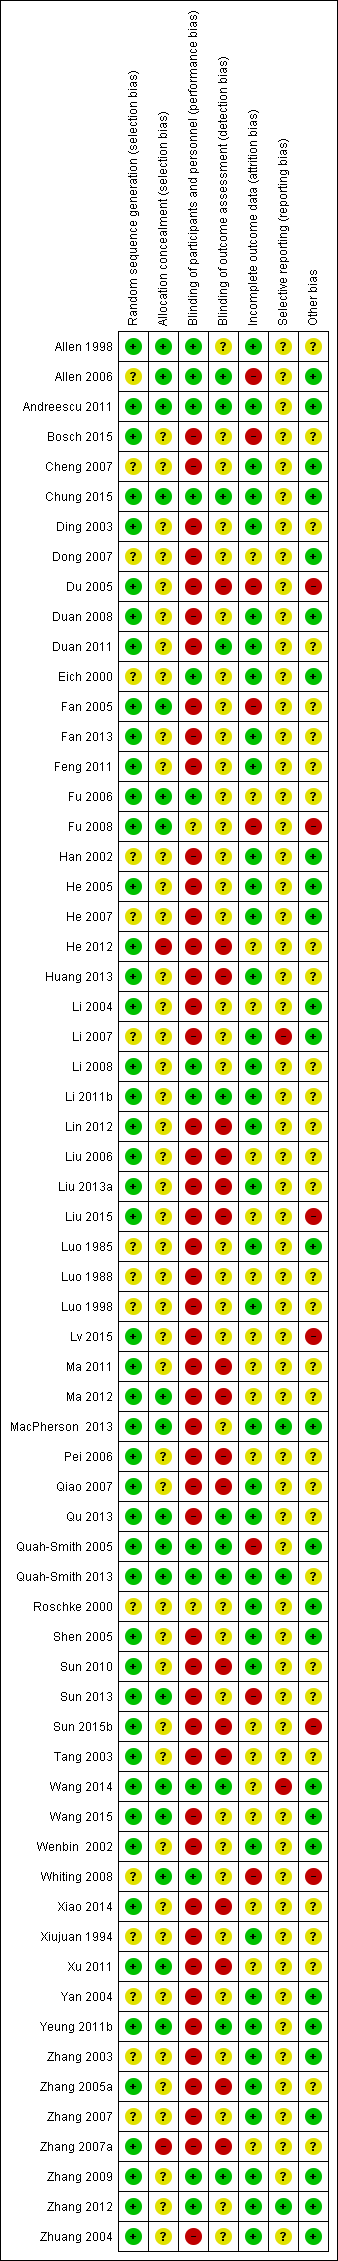
Review authors' judgements about each 'risk of bias' domain for each included study.

Forest plot of comparison: 1 Acupuncture versus no treatment/wait list/TAU, outcome: 1.1 Severity of depression at the end of treatment.

Forest plot of comparison: 2 Acupuncture versus control acupuncture, outcome: 2.1 Severity of depression at the end of the intervention.

Forest plot of comparison: 3 Acupuncture versus medication, outcome: 3.1 Severity of depression at the end of treatment.

Forest plot of comparison: 4 Acupuncture plus medication vs medication, outcome: 4.1 Severity of depression at the end of treatment.
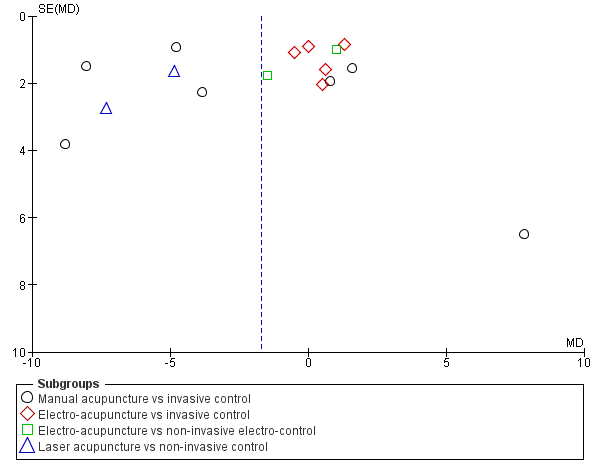
Funnel plot of comparison: 2 Acupuncture versus control acupuncture, outcome: 2.1 Severity of depression at the end of the intervention.

Funnel plot of comparison: 3 Acupuncture versus medication, outcome: 3.1 Severity of depression at the end of treatment.
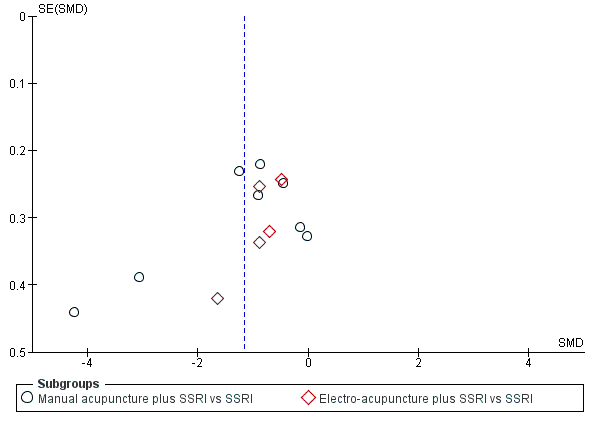
Funnel plot of comparison: 4 Acupuncture plus medication vs medication, outcome: 4.1 Severity of depression at the end of treatment.

Comparison 1 Acupuncture versus no treatment/wait list/TAU, Outcome 1 Severity of depression at the end of treatment.

Comparison 1 Acupuncture versus no treatment/wait list/TAU, Outcome 2 Adverse events.
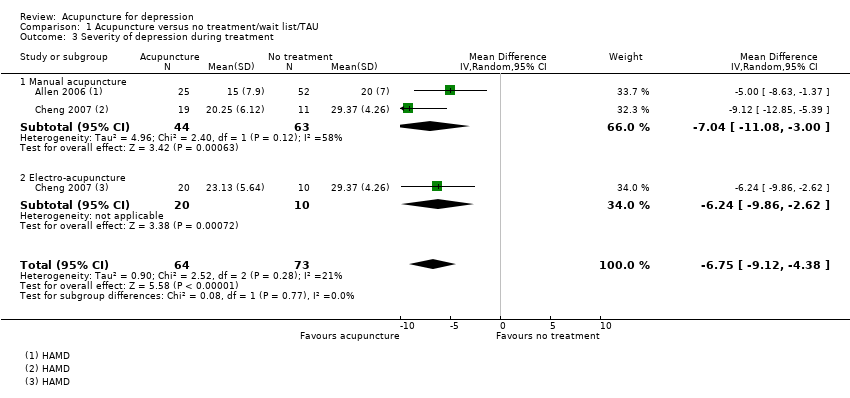
Comparison 1 Acupuncture versus no treatment/wait list/TAU, Outcome 3 Severity of depression during treatment.

Comparison 1 Acupuncture versus no treatment/wait list/TAU, Outcome 4 Severity of depression 0‐6 months after treatment.
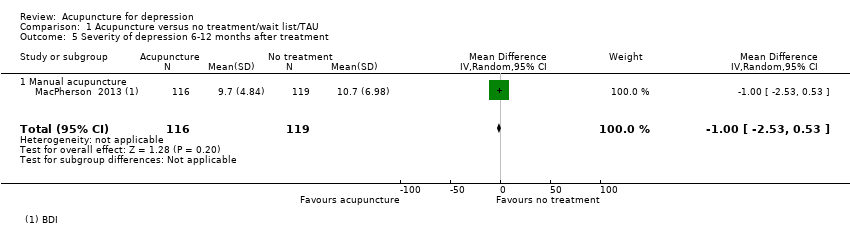
Comparison 1 Acupuncture versus no treatment/wait list/TAU, Outcome 5 Severity of depression 6‐12 months after treatment.
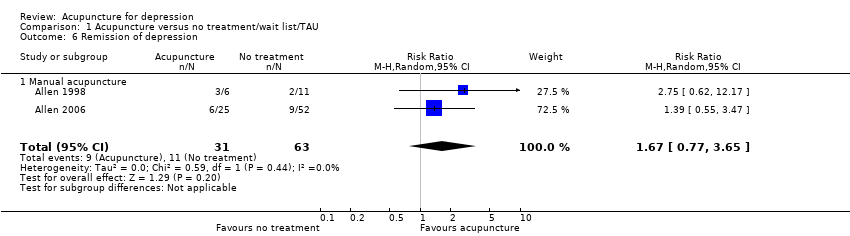
Comparison 1 Acupuncture versus no treatment/wait list/TAU, Outcome 6 Remission of depression.
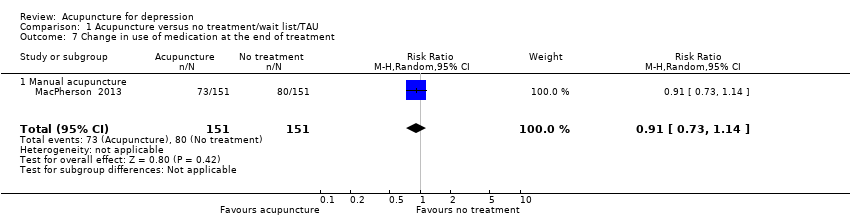
Comparison 1 Acupuncture versus no treatment/wait list/TAU, Outcome 7 Change in use of medication at the end of treatment.

Comparison 1 Acupuncture versus no treatment/wait list/TAU, Outcome 8 Dropout from treatment.

Comparison 2 Acupuncture versus control acupuncture, Outcome 1 Severity of depression at the end of the intervention.

Comparison 2 Acupuncture versus control acupuncture, Outcome 2 Adverse events.
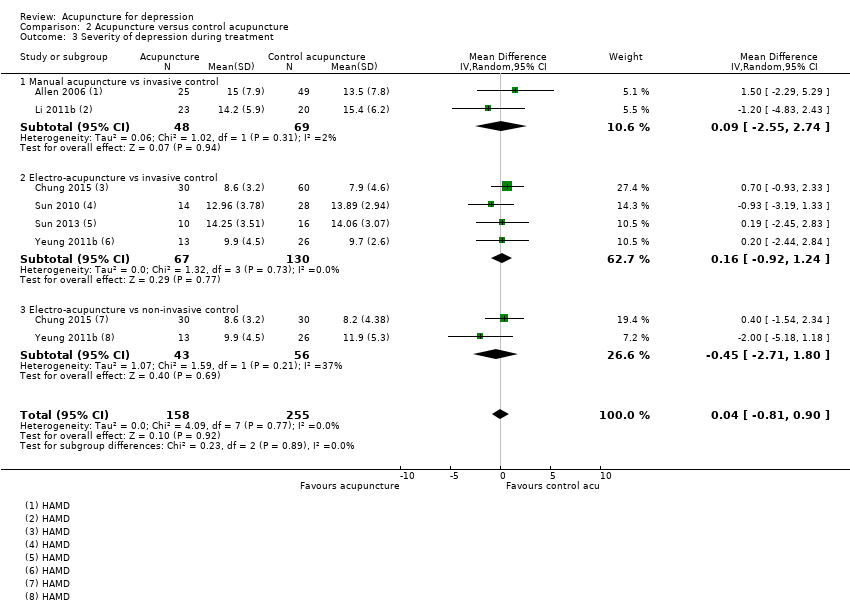
Comparison 2 Acupuncture versus control acupuncture, Outcome 3 Severity of depression during treatment.
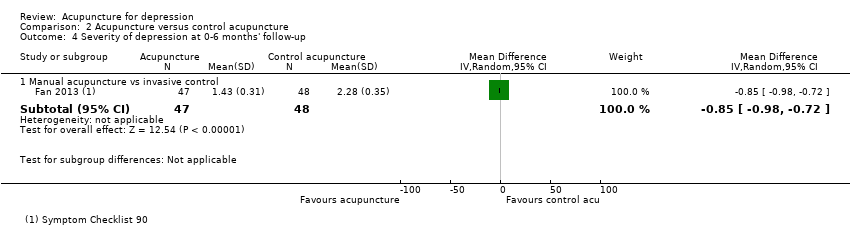
Comparison 2 Acupuncture versus control acupuncture, Outcome 4 Severity of depression at 0‐6 months' follow‐up.
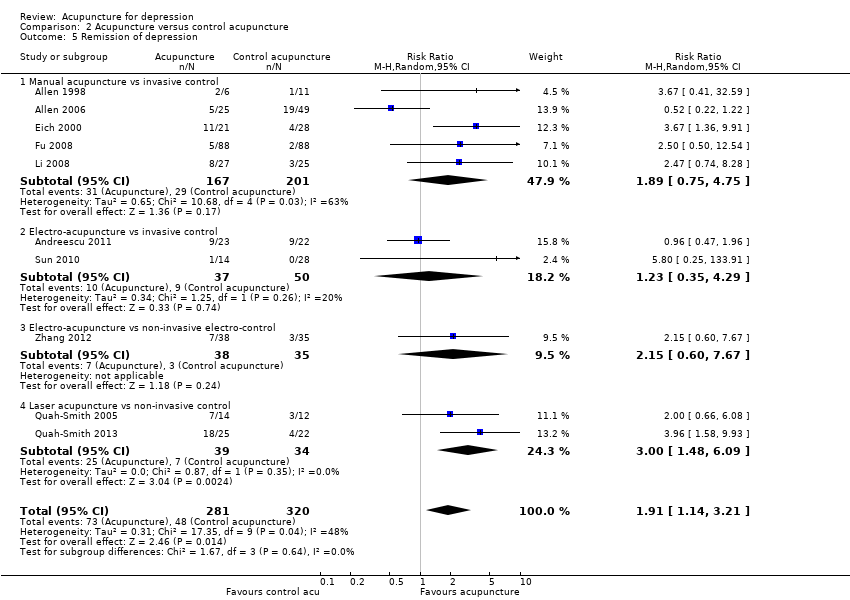
Comparison 2 Acupuncture versus control acupuncture, Outcome 5 Remission of depression.

Comparison 2 Acupuncture versus control acupuncture, Outcome 6 Quality of life (emotional) during treatment.
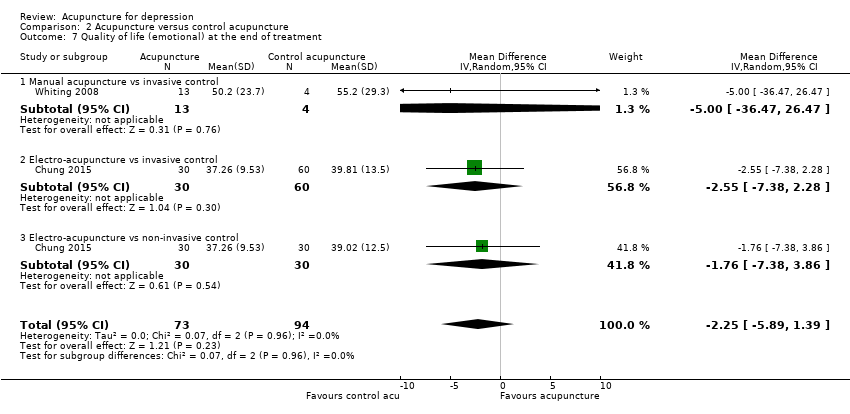
Comparison 2 Acupuncture versus control acupuncture, Outcome 7 Quality of life (emotional) at the end of treatment.

Comparison 2 Acupuncture versus control acupuncture, Outcome 8 Quality of life (physical) during treatment.
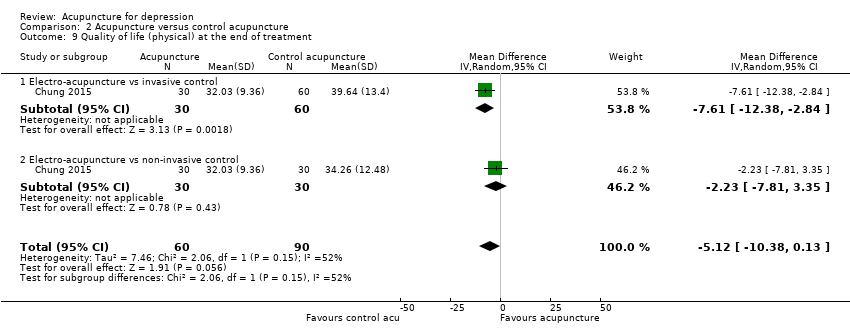
Comparison 2 Acupuncture versus control acupuncture, Outcome 9 Quality of life (physical) at the end of treatment.

Comparison 2 Acupuncture versus control acupuncture, Outcome 10 Change in medication.

Comparison 2 Acupuncture versus control acupuncture, Outcome 11 Dropout from treatment.
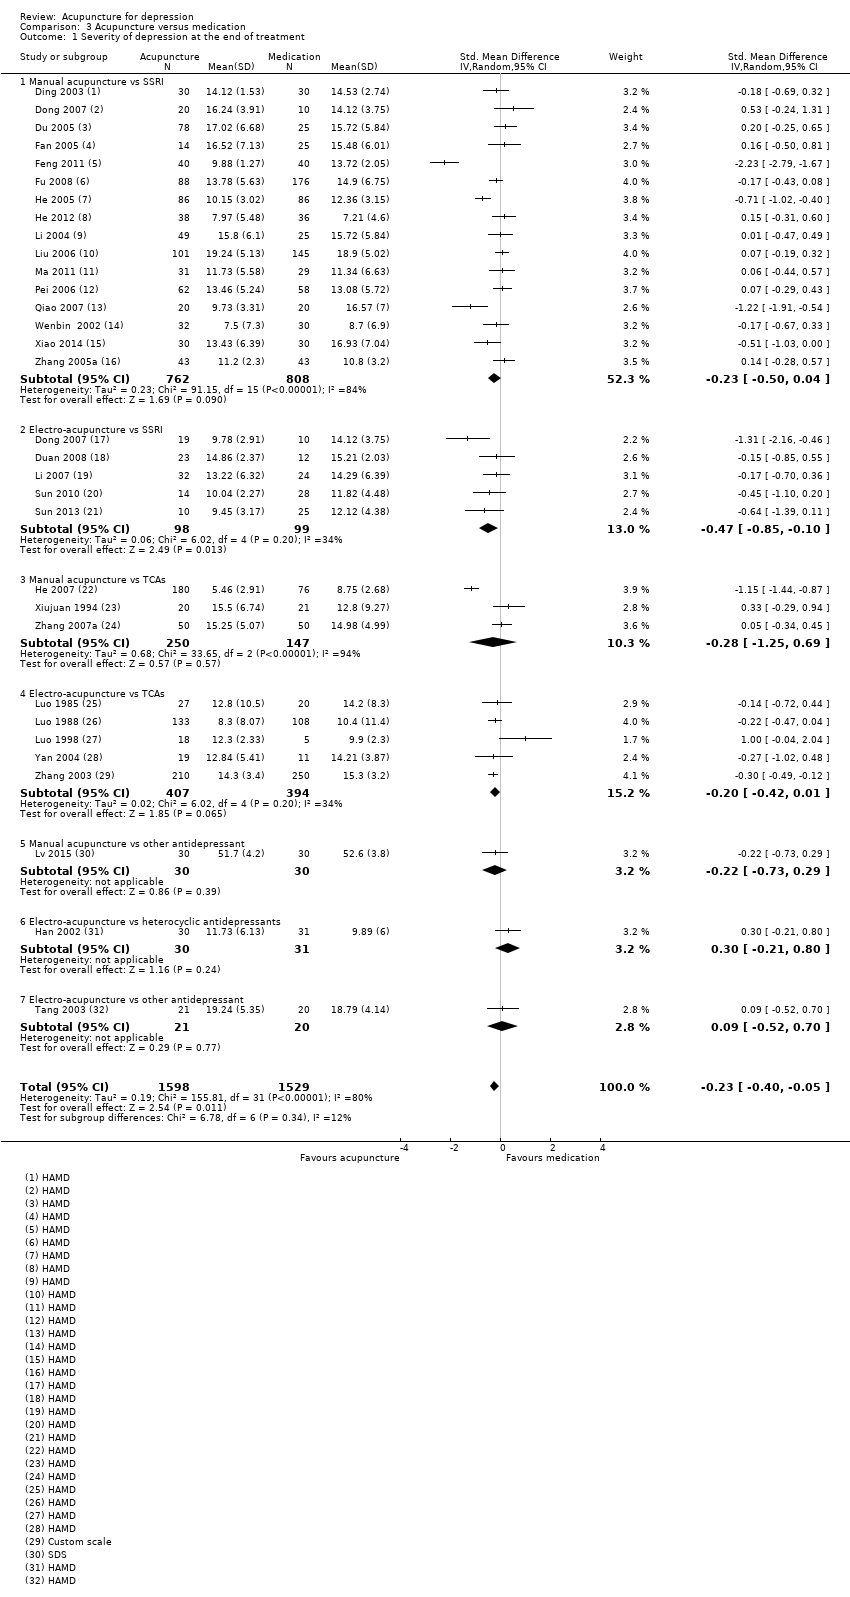
Comparison 3 Acupuncture versus medication, Outcome 1 Severity of depression at the end of treatment.

Comparison 3 Acupuncture versus medication, Outcome 2 Adverse events.

Comparison 3 Acupuncture versus medication, Outcome 3 Severity of depression during treatment.

Comparison 3 Acupuncture versus medication, Outcome 4 Severity of depression 0‐6 months after treatment.

Comparison 3 Acupuncture versus medication, Outcome 5 Remission of depression.
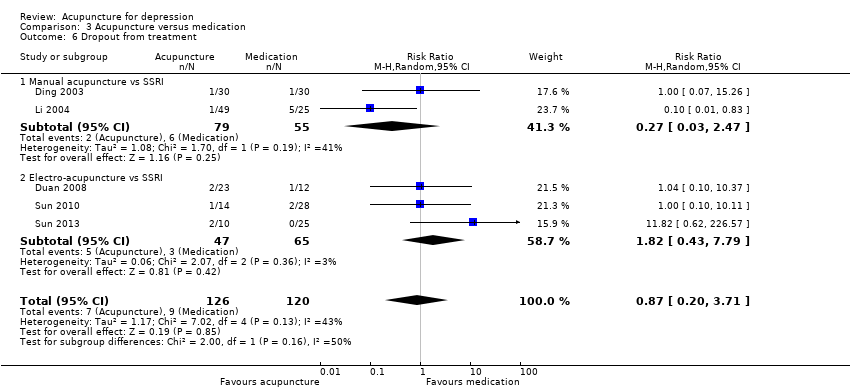
Comparison 3 Acupuncture versus medication, Outcome 6 Dropout from treatment.

Comparison 4 Acupuncture plus medication versus medication, Outcome 1 Severity of depression at the end of treatment.
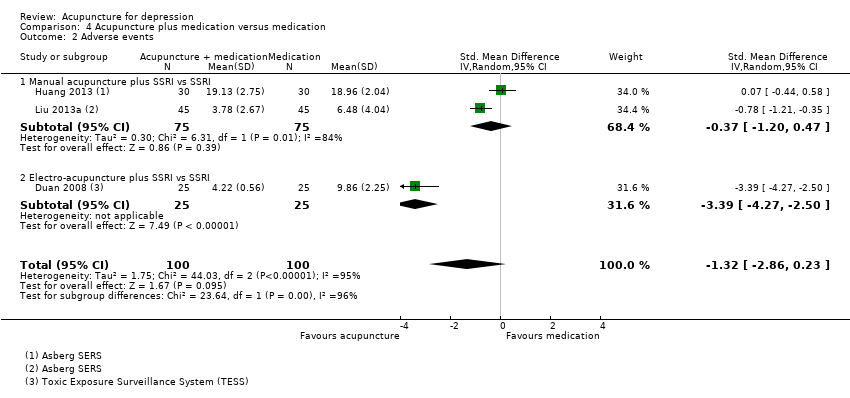
Comparison 4 Acupuncture plus medication versus medication, Outcome 2 Adverse events.
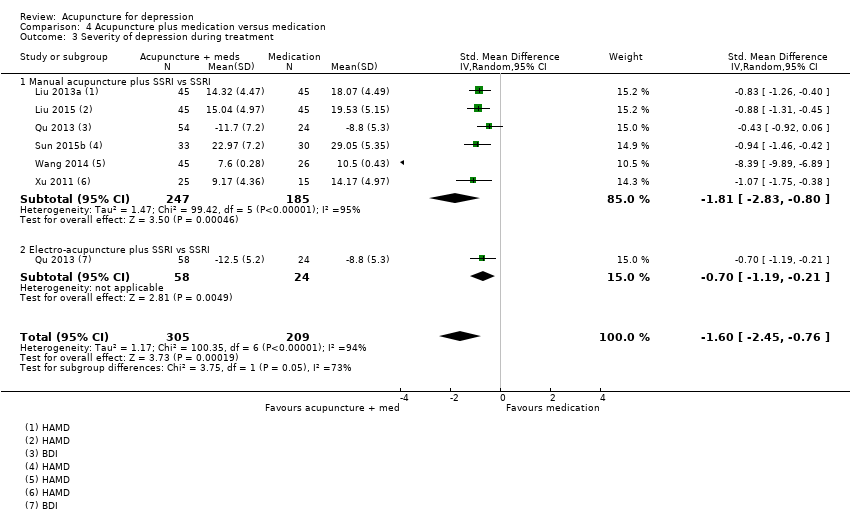
Comparison 4 Acupuncture plus medication versus medication, Outcome 3 Severity of depression during treatment.

Comparison 4 Acupuncture plus medication versus medication, Outcome 4 Remission of depression.
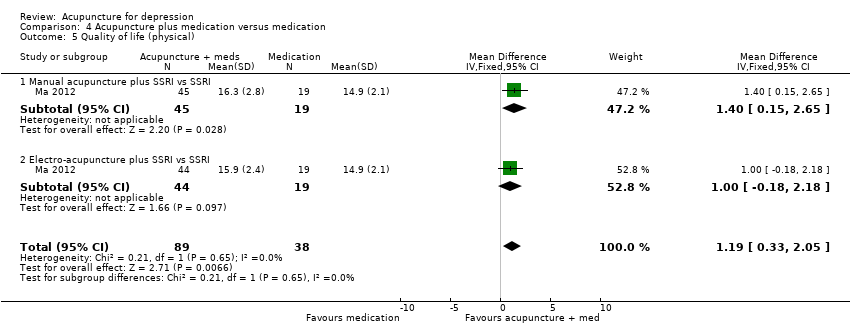
Comparison 4 Acupuncture plus medication versus medication, Outcome 5 Quality of life (physical).

Comparison 4 Acupuncture plus medication versus medication, Outcome 6 Quality of life (emotional).
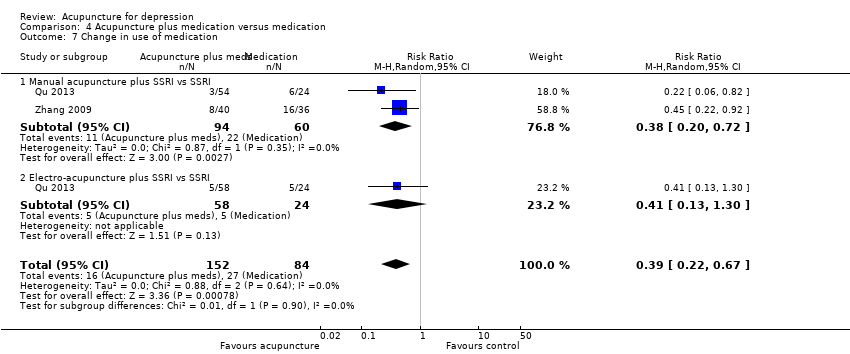
Comparison 4 Acupuncture plus medication versus medication, Outcome 7 Change in use of medication.
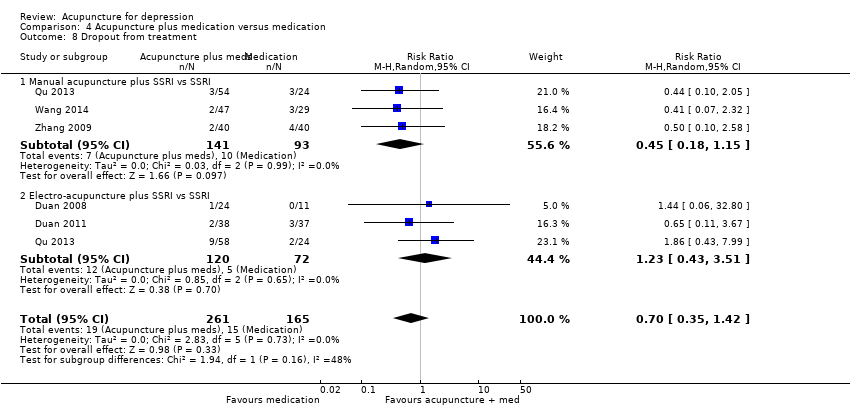
Comparison 4 Acupuncture plus medication versus medication, Outcome 8 Dropout from treatment.

Comparison 5 Acupuncture versus psychological therapy, Outcome 1 Severity of depression at the end of treatment.

Comparison 5 Acupuncture versus psychological therapy, Outcome 2 Adverse events.

Comparison 5 Acupuncture versus psychological therapy, Outcome 3 Severity of depression 0‐6 months after treatment.

Comparison 5 Acupuncture versus psychological therapy, Outcome 4 Severity of depression 6‐12 months.

Comparison 5 Acupuncture versus psychological therapy, Outcome 6 Change in use of medication.

Comparison 5 Acupuncture versus psychological therapy, Outcome 7 Dropout from treatment.
| Acupuncture compared with no treatment/wait list/treatment as usual for depression | ||||||
| Patient or population: clinical diagnosis of depression | ||||||
| Outcomes | Anticipated absolute effects* (95% CI) | Relative effect | No. of participants | Quality of the evidence | Comments | |
| Risk with no treatment/wait list/treatment as usual | Risk with acupuncture | |||||
| Severity of depression at the end of treatment | SMD 0.66 lower | ‐ | 488 | ⊕⊕⊝⊝ | As a rule of thumb, 0.2 SMD represents a small difference, 0.5 moderate, and 0.8 large. | |
| Adverse events | Study population | RR 0.89 | 302 | ⊕⊕⊝⊝ | ||
| 60 per 1000 | 53 per 1000 | |||||
| Quality of life (physical) | ‐ | ‐ | ‐ | ‐ | ‐ | Cannot estimate the effect of acupuncture as no studies reported on this outcome |
| Quality of life (emotional) | ‐ | ‐ | ‐ | ‐ | ‐ | Cannot estimate the effect of acupuncture as no studies reported on this outcome |
| *The risk in the intervention group (and its 95% confidence interval) is based on the assumed risk in the comparison group and the relative effect of the intervention (and its 95% CI). | ||||||
| GRADE Working Group grades of evidence. | ||||||
| aDowngraded one level owing to high risk of performance bias across most included studies. bDowngraded one level owing to substantial heterogeneity (I2 = 64%, Tau2 = 0.14, P = 0.02). cDowngraded one level owing to high risk of performance bias. dDowngraded one level owing to small sample size for detecting relatively rare events. | ||||||
| Acupuncture compared with control acupuncture for depression | ||||||
| Patient or population: clinical diagnosis of depression | ||||||
| Outcomes | Anticipated absolute effects* (95% CI) | Relative effect | No. of participants | Quality of the evidence | Comments | |
| Risk with control acupuncture | Risk with acupuncture | |||||
| Severity of depression at the end of the intervention as measured by the Hamilton Depression Rating Scale (HAMD) scored from 0 to 54 (lower score indicates less severe depression) | In the study population, average severity of depression at the end of treatment was 11.4 in clinician‐rated HAMD scores. | MD 1.69 lower | ‐ | 841 | ⊕⊕⊝⊝ | |
| Adverse events | Study population | RR 1.63 | 300 | ⊕⊕⊕⊝ | ||
| 162 per 1000 | 264 per 1000 | |||||
| Quality of life (physical) at the end of treatment (higher scores indicate greater quality of life) | Mean quality of life (physical) at the end of treatment was 37. | MD 5.12 lower | ‐ | 150 | ⊕⊕⊝⊝ | |
| Quality of life (emotional) at the end of treatment (higher scores indicate greater quality of life) | Mean quality of life (emotional) at the end of treatment was 44.6. | MD 2.25 lower | ‐ | 167 | ⊕⊕⊕⊝ | |
| *The risk in the intervention group (and its 95% confidence interval) is based on the assumed risk in the comparison group and the relative effect of the intervention (and its 95% CI). | ||||||
| GRADE Working Group grades of evidence. | ||||||
| aDowngraded one level owing to high risk of bias in performance bias in five of the included studies and high risk of bias in at least one domain in most studies. bDowngraded one level owing to substantial heterogeneity (I2 = 80%, Tau2 = 7.80, P < 0.001). cDowngraded one level owing to small sample size for relatively rare events. dDowngraded one level because only one small study contributed to this outcome. eDowngraded one level for imprecision due to small sample size. | ||||||
| Acupuncture compared with medication for depression | ||||||
| Patient or population: clinical diagnosis of depression | ||||||
| Outcomes | Anticipated absolute effects* (95% CI) | Relative effect | No. of participants | Quality of the evidence | Comments | |
| Risk with medication | Risk with acupuncture | |||||
| Severity of depression at the end of treatment | SMD 0.23 lower | ‐ | 3127 | ⊕⊝⊝⊝ | As a rule of thumb, 0.2 SMD represents a small difference, 0.5 moderate, and 0.8 large. | |
| Adverse events (measured with Asberg Antidepressant Side Effect Scale) | Mean number of adverse events was 6.2. | MD 4.32 lower | ‐ | 481 | ⊕⊝⊝⊝ | |
| Quality of life (physical) | ‐ | ‐ | No studies reported on this outcome. | ‐ | Cannot estimate the effect of acupuncture as no studies reported on this outcome | |
| Quality of life (emotional) | ‐ | ‐ | No studies reported on this outcome. | ‐ | Cannot estimate the effect of acupuncture as no studies reported on this outcome | |
| *The risk in the intervention group (and its 95% confidence interval) is based on the assumed risk in the comparison group and the relative effect of the intervention (and its 95% CI). | ||||||
| GRADE Working Group grades of evidence. | ||||||
| aDowngraded two levels owing to very serious risk of bias. Of 31 trials, 30 were at high risk of bias owing to lack of blinding of participants, and 12 were at high risk of bias owing to lack of blinding of outcome assessors. bDowngraded one level owing to substantial heterogeneity (I2 = 80%, Tau2 = 0.19, P < 0.0001). cDowngraded two levels owing to very serious risk of bias in all three studies. dDowngraded two levels owing to considerable heterogeneity (I2 = 97%, Tau2 = 7.22, P < 0.001). | ||||||
| Acupuncture plus medication compared with medication for depression | ||||||
| Patient or population: clinical diagnosis of depression | ||||||
| Outcomes | Anticipated absolute effects* (95% CI) | Relative effect | No. of participants | Quality of the evidence | Comments | |
| Risk with medication | Risk with acupuncture plus medication | |||||
| Severity of depression at the end of treatment | SMD 1.15 lower | ‐ | 813 | ⊕⊝⊝⊝ | As a rule of thumb, 0.2 SMD represents a small difference, 0.5 moderate, and 0.8 large. | |
| Adverse events (measured with Asberg Antidepressant Side Effect Scale and Toxic Exposure Surveillance System) | SMD 1.32 lower | ‐ | 200 | ⊕⊝⊝⊝ | As a rule of thumb, 0.2 SMD represents a small difference, 0.5 moderate, and 0.8 large. | |
| Quality of life (physical) at the end of treatment (higher scores indicate greater quality of life) | Quality of life (physical) score in the single included study was 14.9. | MD 1.19 higher | ‐ | 127 | ⊕⊝⊝⊝ | |
| Quality of life (emotional) at the end of treatment (higher scores indicate greater quality of life) | Mean quality of life (emotional) score was 17.2. | MD 0.25 higher | ‐ | 219 | ⊕⊝⊝⊝ | |
| *The risk in the intervention group (and its 95% confidence interval) is based on the assumed risk in the comparison group and the relative effect of the intervention (and its 95% CI). | ||||||
| GRADE Working Group grades of evidence. | ||||||
| aDowngraded two levels owing to very serious risk of bias. Of 11 trials, nine were at high risk of bias owing to lack of blinding of participants, and 6 were at high risk of bias owing to lack of blinding of outcome assessors. bDowngraded two levels owing to considerable heterogeneity (I2 = 89%, Tau2 = 0.70, P < 0.001). fDowngraded two levels owing to very serious risk of bias. | ||||||
| Acupuncture compared with psychological therapy for depression | ||||||
| Patient or population: clinical diagnosis of depression | ||||||
| Outcomes | Anticipated absolute effects* (95% CI) | Relative effect | No. of participants | Quality of the evidence | Comments | |
| Risk with psychological therapy | Risk with acupuncture | |||||
| Severity of depression at the end of treatment as measured by self‐rated depression scores (lower score indicates less severe depression) | SMD 0.5 lower | ‐ | 497 | ⊕⊕⊝⊝ | As a rule of thumb, 0.2 SMD represents a small difference, 0.5 moderate, and 0.8 large. | |
| Adverse events measured during study treatment | Study population | RR 0.62 | 453 | ⊕⊕⊝⊝ | ||
| 86 per 1000 | 53 per 1000 | |||||
| Quality of life (physical) | ‐ | ‐ | ‐ | No studies reported on this outcome. | ‐ | Cannot estimate the effect of acupuncture as no studies reported on this outcome |
| Quality of life (emotional) | ‐ | ‐ | ‐ | No studies reported on this outcome. | ‐ | Cannot estimate the effect of acupuncture as no studies reported on this outcome |
| *The risk in the intervention group (and its 95% confidence interval) is based on the assumed risk in the comparison group and the relative effect of the intervention (and its 95% CI). | ||||||
| GRADE Working Group grades of evidence. | ||||||
| aDowngraded one level for serious risk of bias; both included trials have high risk of performance bias. dDowngraded one level owing to high risk of performance bias. | ||||||
| Outcome or subgroup title | No. of studies | No. of participants | Statistical method | Effect size |
| 1 Severity of depression at the end of treatment Show forest plot | 5 | 488 | Std. Mean Difference (IV, Random, 95% CI) | ‐0.66 [‐1.06, ‐0.25] |
| 1.1 Manual acupuncture | 5 | 458 | Std. Mean Difference (IV, Random, 95% CI) | ‐0.56 [‐0.98, ‐0.15] |
| 1.2 Electro‐acupuncture | 1 | 30 | Std. Mean Difference (IV, Random, 95% CI) | ‐1.26 [‐2.10, ‐0.43] |
| 2 Adverse events Show forest plot | 1 | 302 | Risk Ratio (M‐H, Random, 95% CI) | 0.89 [0.35, 2.24] |
| 2.1 Manual acupuncture | 1 | 302 | Risk Ratio (M‐H, Random, 95% CI) | 0.89 [0.35, 2.24] |
| 3 Severity of depression during treatment Show forest plot | 2 | 137 | Mean Difference (IV, Random, 95% CI) | ‐6.75 [‐9.12, ‐4.38] |
| 3.1 Manual acupuncture | 2 | 107 | Mean Difference (IV, Random, 95% CI) | ‐7.04 [‐11.08, ‐3.00] |
| 3.2 Electro‐acupuncture | 1 | 30 | Mean Difference (IV, Random, 95% CI) | ‐6.24 [‐9.86, ‐2.62] |
| 4 Severity of depression 0‐6 months after treatment Show forest plot | 1 | 237 | Mean Difference (IV, Random, 95% CI) | ‐1.90 [‐3.01, ‐0.79] |
| 4.1 Manual acupuncture | 1 | 237 | Mean Difference (IV, Random, 95% CI) | ‐1.90 [‐3.01, ‐0.79] |
| 5 Severity of depression 6‐12 months after treatment Show forest plot | 1 | 235 | Mean Difference (IV, Random, 95% CI) | ‐1.0 [‐2.53, 0.53] |
| 5.1 Manual acupuncture | 1 | 235 | Mean Difference (IV, Random, 95% CI) | ‐1.0 [‐2.53, 0.53] |
| 6 Remission of depression Show forest plot | 2 | 94 | Risk Ratio (M‐H, Random, 95% CI) | 1.67 [0.77, 3.65] |
| 6.1 Manual acupuncture | 2 | 94 | Risk Ratio (M‐H, Random, 95% CI) | 1.67 [0.77, 3.65] |
| 7 Change in use of medication at the end of treatment Show forest plot | 1 | 302 | Risk Ratio (M‐H, Random, 95% CI) | 0.91 [0.73, 1.14] |
| 7.1 Manual acupuncture | 1 | 302 | Risk Ratio (M‐H, Random, 95% CI) | 0.91 [0.73, 1.14] |
| 8 Dropout from treatment Show forest plot | 1 | 302 | Risk Ratio (M‐H, Random, 95% CI) | 1.0 [0.21, 4.88] |
| 8.1 Manual acupuncture | 1 | 302 | Risk Ratio (M‐H, Random, 95% CI) | 1.0 [0.21, 4.88] |
| Outcome or subgroup title | No. of studies | No. of participants | Statistical method | Effect size |
| 1 Severity of depression at the end of the intervention Show forest plot | 14 | 841 | Mean Difference (IV, Random, 95% CI) | ‐1.69 [‐3.33, ‐0.05] |
| 1.1 Manual acupuncture vs invasive control | 7 | 418 | Mean Difference (IV, Random, 95% CI) | ‐2.97 [‐6.26, 0.31] |
| 1.2 Electro‐acupuncture vs invasive control | 5 | 251 | Mean Difference (IV, Random, 95% CI) | 0.43 [‐0.54, 1.40] |
| 1.3 Electro‐acupuncture vs non‐invasive electro‐control | 2 | 99 | Mean Difference (IV, Random, 95% CI) | 0.17 [‐2.14, 2.48] |
| 1.4 Laser acupuncture vs non‐invasive control | 2 | 73 | Mean Difference (IV, Random, 95% CI) | ‐5.51 [‐8.30, ‐2.73] |
| 2 Adverse events Show forest plot | 5 | 300 | Risk Ratio (M‐H, Random, 95% CI) | 1.63 [0.93, 2.86] |
| 2.1 Manual acupuncture vs invasive control | 1 | 17 | Risk Ratio (M‐H, Random, 95% CI) | 2.5 [0.15, 40.37] |
| 2.2 Electro‐acupuncture vs invasive control | 4 | 244 | Risk Ratio (M‐H, Random, 95% CI) | 1.79 [0.99, 3.25] |
| 2.3 Electro‐acupuncture vs non‐invasive control | 1 | 39 | Risk Ratio (M‐H, Random, 95% CI) | 0.4 [0.05, 3.08] |
| 3 Severity of depression during treatment Show forest plot | 6 | 413 | Mean Difference (IV, Random, 95% CI) | 0.04 [‐0.81, 0.90] |
| 3.1 Manual acupuncture vs invasive control | 2 | 117 | Mean Difference (IV, Random, 95% CI) | 0.09 [‐2.55, 2.74] |
| 3.2 Electro‐acupuncture vs invasive control | 4 | 197 | Mean Difference (IV, Random, 95% CI) | 0.16 [‐0.92, 1.24] |
| 3.3 Electro‐acupuncture vs non‐invasive control | 2 | 99 | Mean Difference (IV, Random, 95% CI) | ‐0.45 [‐2.71, 1.80] |
| 4 Severity of depression at 0‐6 months' follow‐up Show forest plot | 1 | Mean Difference (IV, Random, 95% CI) | Subtotals only | |
| 4.1 Manual acupuncture vs invasive control | 1 | 95 | Mean Difference (IV, Random, 95% CI) | ‐0.85 [‐0.98, ‐0.72] |
| 5 Remission of depression Show forest plot | 10 | 601 | Risk Ratio (M‐H, Random, 95% CI) | 1.91 [1.14, 3.21] |
| 5.1 Manual acupuncture vs invasive control | 5 | 368 | Risk Ratio (M‐H, Random, 95% CI) | 1.89 [0.75, 4.75] |
| 5.2 Electro‐acupuncture vs invasive control | 2 | 87 | Risk Ratio (M‐H, Random, 95% CI) | 1.23 [0.35, 4.29] |
| 5.3 Electro‐acupuncture vs non‐invasive electro‐control | 1 | 73 | Risk Ratio (M‐H, Random, 95% CI) | 2.15 [0.60, 7.67] |
| 5.4 Laser acupuncture vs non‐invasive control | 2 | 73 | Risk Ratio (M‐H, Random, 95% CI) | 3.00 [1.48, 6.09] |
| 6 Quality of life (emotional) during treatment Show forest plot | 1 | 150 | Mean Difference (IV, Random, 95% CI) | ‐1.98 [‐5.41, 1.45] |
| 6.1 Electro‐acupuncture vs invasive control | 1 | 90 | Mean Difference (IV, Random, 95% CI) | ‐2.09 [‐6.54, 2.36] |
| 6.2 Electro‐acupuncture vs non‐invasive control | 1 | 60 | Mean Difference (IV, Random, 95% CI) | ‐1.81 [‐7.18, 3.56] |
| 7 Quality of life (emotional) at the end of treatment Show forest plot | 2 | 167 | Mean Difference (IV, Random, 95% CI) | ‐2.25 [‐5.89, 1.39] |
| 7.1 Manual acupuncture vs invasive control | 1 | 17 | Mean Difference (IV, Random, 95% CI) | ‐5.0 [‐36.47, 26.47] |
| 7.2 Electro‐acupuncture vs invasive control | 1 | 90 | Mean Difference (IV, Random, 95% CI) | ‐2.55 [‐7.38, 2.28] |
| 7.3 Electro‐acupuncture vs non‐invasive control | 1 | 60 | Mean Difference (IV, Random, 95% CI) | ‐1.76 [‐7.38, 3.86] |
| 8 Quality of life (physical) during treatment Show forest plot | 1 | 150 | Mean Difference (IV, Random, 95% CI) | ‐0.99 [‐4.74, 2.77] |
| 8.1 Electro‐acupuncture vs invasive control | 1 | 90 | Mean Difference (IV, Random, 95% CI) | ‐2.62 [‐7.07, 1.83] |
| 8.2 Electro‐acupuncture vs non‐invasive control | 1 | 60 | Mean Difference (IV, Random, 95% CI) | 1.26 [‐4.12, 6.64] |
| 9 Quality of life (physical) at the end of treatment Show forest plot | 1 | 150 | Mean Difference (IV, Random, 95% CI) | ‐5.12 [‐10.38, 0.13] |
| 9.1 Electro‐acupuncture vs invasive control | 1 | 90 | Mean Difference (IV, Random, 95% CI) | ‐7.61 [‐12.38, ‐2.84] |
| 9.2 Electro‐acupuncture vs non‐invasive control | 1 | 60 | Mean Difference (IV, Random, 95% CI) | ‐2.23 [‐7.81, 3.35] |
| 10 Change in medication Show forest plot | 1 | 70 | Mean Difference (IV, Random, 95% CI) | ‐0.39 [‐1.71, 0.93] |
| 10.1 Electro‐acupuncture vs non‐invasive control | 1 | 70 | Mean Difference (IV, Random, 95% CI) | ‐0.39 [‐1.71, 0.93] |
| 11 Dropout from treatment Show forest plot | 7 | 501 | Risk Ratio (M‐H, Random, 95% CI) | 1.04 [0.62, 1.75] |
| 11.1 Manual acupuncture vs invasive control | 1 | 60 | Risk Ratio (M‐H, Random, 95% CI) | 0.6 [0.16, 2.29] |
| 11.2 Electro‐acupuncture vs invasive control | 4 | 224 | Risk Ratio (M‐H, Random, 95% CI) | 1.01 [0.51, 2.02] |
| 11.3 Electro‐acupuncture vs non‐invasive control | 4 | 217 | Risk Ratio (M‐H, Random, 95% CI) | 1.48 [0.56, 3.91] |
| Outcome or subgroup title | No. of studies | No. of participants | Statistical method | Effect size |
| 1 Severity of depression at the end of treatment Show forest plot | 31 | 3127 | Std. Mean Difference (IV, Random, 95% CI) | ‐0.23 [‐0.40, ‐0.05] |
| 1.1 Manual acupuncture vs SSRI | 16 | 1570 | Std. Mean Difference (IV, Random, 95% CI) | ‐0.23 [‐0.50, 0.04] |
| 1.2 Electro‐acupuncture vs SSRI | 5 | 197 | Std. Mean Difference (IV, Random, 95% CI) | ‐0.47 [‐0.85, ‐0.10] |
| 1.3 Manual acupuncture vs TCAs | 3 | 397 | Std. Mean Difference (IV, Random, 95% CI) | ‐0.28 [‐1.25, 0.69] |
| 1.4 Electro‐acupuncture vs TCAs | 5 | 801 | Std. Mean Difference (IV, Random, 95% CI) | ‐0.20 [‐0.42, 0.01] |
| 1.5 Manual acupuncture vs other antidepressant | 1 | 60 | Std. Mean Difference (IV, Random, 95% CI) | ‐0.22 [‐0.73, 0.29] |
| 1.6 Electro‐acupuncture vs heterocyclic antidepressants | 1 | 61 | Std. Mean Difference (IV, Random, 95% CI) | 0.30 [‐0.21, 0.80] |
| 1.7 Electro‐acupuncture vs other antidepressant | 1 | 41 | Std. Mean Difference (IV, Random, 95% CI) | 0.09 [‐0.52, 0.70] |
| 2 Adverse events Show forest plot | 3 | 481 | Mean Difference (IV, Random, 95% CI) | ‐4.32 [‐7.41, ‐1.23] |
| 2.1 Manual acupuncture vs SSRI | 3 | 481 | Mean Difference (IV, Random, 95% CI) | ‐4.32 [‐7.41, ‐1.23] |
| 3 Severity of depression during treatment Show forest plot | 9 | 552 | Mean Difference (IV, Random, 95% CI) | ‐1.67 [‐2.91, ‐0.43] |
| 3.1 Manual acupuncture vs SSRI | 5 | 340 | Mean Difference (IV, Random, 95% CI) | ‐1.38 [‐3.20, 0.45] |
| 3.2 Electro‐acupuncture vs SSRI | 3 | 112 | Mean Difference (IV, Random, 95% CI) | ‐2.58 [‐4.38, ‐0.78] |
| 3.3 Manual acupuncture vs TCAs | 1 | 100 | Mean Difference (IV, Random, 95% CI) | ‐0.80 [‐3.65, 2.05] |
| 4 Severity of depression 0‐6 months after treatment Show forest plot | 1 | 60 | Mean Difference (IV, Random, 95% CI) | ‐5.60 [‐7.60, ‐3.60] |
| 4.1 Manual acupuncture vs other antidepressant medication | 1 | 60 | Mean Difference (IV, Random, 95% CI) | ‐5.60 [‐7.60, ‐3.60] |
| 5 Remission of depression Show forest plot | 25 | 2918 | Risk Ratio (M‐H, Random, 95% CI) | 1.16 [1.05, 1.29] |
| 5.1 Manual acupuncture vs SSRI | 14 | 1332 | Risk Ratio (M‐H, Random, 95% CI) | 1.16 [0.98, 1.37] |
| 5.2 Electro‐acupuncture vs SSRI | 4 | 188 | Risk Ratio (M‐H, Random, 95% CI) | 1.28 [0.94, 1.75] |
| 5.3 Manual acupuncture vs TCAs | 4 | 620 | Risk Ratio (M‐H, Random, 95% CI) | 1.32 [1.03, 1.69] |
| 5.4 Electro‐acupuncture vs TCAs | 4 | 778 | Risk Ratio (M‐H, Random, 95% CI) | 1.03 [0.88, 1.21] |
| 6 Dropout from treatment Show forest plot | 5 | 246 | Risk Ratio (M‐H, Random, 95% CI) | 0.87 [0.20, 3.71] |
| 6.1 Manual acupuncture vs SSRI | 2 | 134 | Risk Ratio (M‐H, Random, 95% CI) | 0.27 [0.03, 2.47] |
| 6.2 Electro‐acupuncture vs SSRI | 3 | 112 | Risk Ratio (M‐H, Random, 95% CI) | 1.82 [0.43, 7.79] |
| Outcome or subgroup title | No. of studies | No. of participants | Statistical method | Effect size |
| 1 Severity of depression at the end of treatment Show forest plot | 11 | 813 | Std. Mean Difference (IV, Random, 95% CI) | ‐1.15 [‐1.63, ‐0.66] |
| 1.1 Manual acupuncture plus SSRI vs SSRI | 8 | 539 | Std. Mean Difference (IV, Random, 95% CI) | ‐1.32 [‐2.09, ‐0.55] |
| 1.2 Electro‐acupuncture plus SSRI vs SSRI | 5 | 274 | Std. Mean Difference (IV, Random, 95% CI) | ‐0.84 [‐1.16, ‐0.51] |
| 2 Adverse events Show forest plot | 3 | 200 | Std. Mean Difference (IV, Random, 95% CI) | ‐1.32 [‐2.86, 0.23] |
| 2.1 Manual acupuncture plus SSRI vs SSRI | 2 | 150 | Std. Mean Difference (IV, Random, 95% CI) | ‐0.37 [‐1.20, 0.47] |
| 2.2 Electro‐acupuncture plus SSRI vs SSRI | 1 | 50 | Std. Mean Difference (IV, Random, 95% CI) | ‐3.39 [‐4.27, ‐2.50] |
| 3 Severity of depression during treatment Show forest plot | 6 | 514 | Std. Mean Difference (IV, Random, 95% CI) | ‐1.60 [‐2.45, ‐0.76] |
| 3.1 Manual acupuncture plus SSRI vs SSRI | 6 | 432 | Std. Mean Difference (IV, Random, 95% CI) | ‐1.81 [‐2.83, ‐0.80] |
| 3.2 Electro‐acupuncture plus SSRI vs SSRI | 1 | 82 | Std. Mean Difference (IV, Random, 95% CI) | ‐0.70 [‐1.19, ‐0.21] |
| 4 Remission of depression Show forest plot | 9 | 618 | Risk Ratio (M‐H, Random, 95% CI) | 1.21 [0.85, 1.73] |
| 4.1 Manual acupuncture plus SSRI vs SSRI | 5 | 299 | Risk Ratio (M‐H, Random, 95% CI) | 1.33 [0.65, 2.73] |
| 4.2 Electro‐acupuncture plus SSRI vs SSRI | 5 | 273 | Risk Ratio (M‐H, Random, 95% CI) | 1.17 [0.75, 1.80] |
| 4.3 Manual acupuncture plus heterocyclic antidepressant vs medication alone | 1 | 46 | Risk Ratio (M‐H, Random, 95% CI) | 4.36 [0.53, 36.12] |
| 5 Quality of life (physical) Show forest plot | 1 | 127 | Mean Difference (IV, Fixed, 95% CI) | 1.19 [0.33, 2.05] |
| 5.1 Manual acupuncture plus SSRI vs SSRI | 1 | 64 | Mean Difference (IV, Fixed, 95% CI) | 1.40 [0.15, 2.65] |
| 5.2 Electro‐acupuncture plus SSRI vs SSRI | 1 | 63 | Mean Difference (IV, Fixed, 95% CI) | 1.0 [‐0.18, 2.18] |
| 6 Quality of life (emotional) Show forest plot | 2 | 219 | Mean Difference (IV, Random, 95% CI) | 0.25 [‐0.90, 1.40] |
| 6.1 Manual acupuncture plus SSRI vs SSRI | 2 | 111 | Mean Difference (IV, Random, 95% CI) | 0.10 [‐1.46, 1.65] |
| 6.2 Electro‐acupuncture plus SSRI vs SSRI | 2 | 108 | Mean Difference (IV, Random, 95% CI) | 0.35 [‐2.00, 2.70] |
| 7 Change in use of medication Show forest plot | 2 | 236 | Risk Ratio (M‐H, Random, 95% CI) | 0.39 [0.22, 0.67] |
| 7.1 Manual acupuncture plus SSRI vs SSRI | 2 | 154 | Risk Ratio (M‐H, Random, 95% CI) | 0.38 [0.20, 0.72] |
| 7.2 Electro‐acupuncture plus SSRI vs SSRI | 1 | 82 | Risk Ratio (M‐H, Random, 95% CI) | 0.41 [0.13, 1.30] |
| 8 Dropout from treatment Show forest plot | 5 | 426 | Risk Ratio (M‐H, Random, 95% CI) | 0.70 [0.35, 1.42] |
| 8.1 Manual acupuncture plus SSRI vs SSRI | 3 | 234 | Risk Ratio (M‐H, Random, 95% CI) | 0.45 [0.18, 1.15] |
| 8.2 Electro‐acupuncture plus SSRI vs SSRI | 3 | 192 | Risk Ratio (M‐H, Random, 95% CI) | 1.23 [0.43, 3.51] |
| Outcome or subgroup title | No. of studies | No. of participants | Statistical method | Effect size |
| 1 Severity of depression at the end of treatment Show forest plot | 2 | 497 | Std. Mean Difference (IV, Random, 95% CI) | ‐0.50 [‐1.33, 0.33] |
| 1.1 Manual acupuncture | 2 | 497 | Std. Mean Difference (IV, Random, 95% CI) | ‐0.50 [‐1.33, 0.33] |
| 2 Adverse events Show forest plot | 1 | 453 | Risk Ratio (M‐H, Random, 95% CI) | 0.62 [0.29, 1.33] |
| 2.1 Manual acupuncture | 1 | 453 | Risk Ratio (M‐H, Random, 95% CI) | 0.62 [0.29, 1.33] |
| 3 Severity of depression 0‐6 months after treatment Show forest plot | 1 | 453 | Mean Difference (IV, Random, 95% CI) | 0.5 [‐0.51, 1.51] |
| 3.1 Manual acupuncture | 1 | 453 | Mean Difference (IV, Random, 95% CI) | 0.5 [‐0.51, 1.51] |
| 4 Severity of depression 6‐12 months Show forest plot | 1 | 453 | Mean Difference (IV, Random, 95% CI) | 0.60 [‐0.80, 2.00] |
| 4.1 Manual acupuncture | 1 | 453 | Mean Difference (IV, Random, 95% CI) | 0.60 [‐0.80, 2.00] |
| 5 Remission of depression | 0 | Risk Ratio (M‐H, Random, 95% CI) | Subtotals only | |
| 5.1 Manual acupuncture | 0 | 0 | Risk Ratio (M‐H, Random, 95% CI) | 0.0 [0.0, 0.0] |
| 6 Change in use of medication Show forest plot | 1 | 453 | Risk Ratio (M‐H, Random, 95% CI) | 0.82 [0.61, 1.10] |
| 6.1 Manual acupuncture | 1 | 453 | Risk Ratio (M‐H, Random, 95% CI) | 0.82 [0.61, 1.10] |
| 7 Dropout from treatment Show forest plot | 1 | 453 | Risk Ratio (M‐H, Random, 95% CI) | 0.27 [0.08, 0.90] |
| 7.1 Manual acupuncture | 1 | 453 | Risk Ratio (M‐H, Random, 95% CI) | 0.27 [0.08, 0.90] |