Učinak kombiniranih kontraceptiva na tjelesnu težinu
Referencias
References to studies included in this review
References to studies excluded from this review
References to ongoing studies
Additional references
References to other published versions of this review
Characteristics of studies
Characteristics of included studies [ordered by study ID]
| Methods | Study location not described. | |
| Participants | Healthy women age 21 to 32 years with regular menses. Excluded recent hormonal contraceptive use; recent use of certain drugs. | |
| Interventions | Levonorgestrel 50‐75‐150 µg and EE 30‐40‐30 µg versus levonorgestrel 50‐75‐150 µg and EE 30‐40‐30 µg. | |
| Outcomes | Adverse events, hormonal measurements. | |
| Notes | ||
| Risk of bias | ||
| Bias | Authors' judgement | Support for judgement |
| Random sequence generation (selection bias) | Low risk | Computer‐generated randomization scheme. |
| Allocation concealment (selection bias) | Unclear risk | No information |
| Blinding (performance bias and detection bias) | Unclear risk | No information |
| Incomplete outcome data (attrition bias) | Unclear risk | Three women discontinued early. Primary reasons for discontinuation described and did not include weight gain. |
| Methods | One site in Indonesia. | |
| Participants | Inclusion and exclusion criteria not described. | |
| Interventions | Gestodene 50‐70‐100 µg and EE 30‐40‐30 µg (N=13) versus desogestrel 150 µg and EE 30 µg (N=17). | |
| Outcomes | Lipoprotein, liver function, blood coagulation, adverse events, body weight, blood pressure. | |
| Notes | ||
| Risk of bias | ||
| Bias | Authors' judgement | Support for judgement |
| Random sequence generation (selection bias) | Low risk | Computer‐generated randomization scheme. |
| Allocation concealment (selection bias) | Unclear risk | No information |
| Blinding (performance bias and detection bias) | Low risk | "Double‐blinded" but did not report who was blinded. |
| Incomplete outcome data (attrition bias) | Low risk | Three women discontinued early or were lost to follow up. Primary reasons for discontinuation not described. |
| Methods | Multicenter trial in Germany. | |
| Participants | Healthy, sexually‐active women age 16 to 45 years with regular menses. | |
| Interventions | Gestodene 75 µg and EE 30 µg (N=209) versus desogestrel 150 µg and EE 30 µg (N=201) versus norgestimate 250 µg and EE 35 µg (N=195). | |
| Outcomes | Contraceptive efficacy, cycle control, body weight, blood pressure, adverse events. | |
| Notes | ||
| Risk of bias | ||
| Bias | Authors' judgement | Support for judgement |
| Random sequence generation (selection bias) | Unclear risk | No information |
| Allocation concealment (selection bias) | Unclear risk | No information |
| Blinding (performance bias and detection bias) | Unclear risk | No information |
| Incomplete outcome data (attrition bias) | Low risk | 29 women in the gestodene, 29 women in the desogestrel and 18 women in the norgestimate group discontinued early or were lost to follow up. Primary reasons for discontinuation described and did not include weight gain. |
| Methods | One site. | |
| Participants | Women age 18 to 35 years with regular menses. | |
| Interventions | Gestodene 75 µg and EE 20 µg (N=32) versus gestodene 75 µg and EE 30 µg (N=32). | |
| Outcomes | Lipid levels, hormone levels, efficacy, cycle control, safety. | |
| Notes | ||
| Risk of bias | ||
| Bias | Authors' judgement | Support for judgement |
| Random sequence generation (selection bias) | Unclear risk | No information |
| Allocation concealment (selection bias) | Unclear risk | No information |
| Blinding (performance bias and detection bias) | High risk | Unblinded |
| Incomplete outcome data (attrition bias) | Unclear risk | 1 woman in EE 20 µg and 5 in EE 30 µg group withdrew before starting treatment. 4 in EE 20 µg and 1 in EE 30 µg group discontinued early due to adverse events. Primary reasons for discontinuation not described. |
| Methods | 100 sites in USA and 10 in Canada. | |
| Participants | Sexually active, healthy women aged 18 to 45 years at risk for pregnancy with regular menstrual cycles, blood pressure <140/90. | |
| Interventions | Norethindrone acetate (NETA) 1.0 mg plus EE 20 µg, with 75 mg ferrous fumarate on days 22‐28 (N=853 for 6 cycles, 318 for 13 cycles) versus norgestimate (NGM) 180‐215‐250 µg plus EE 25 µg (N=1236 for 6 cycles, 487 for 13 cycles). | |
| Outcomes | Weight change was primary outcome; contraceptive efficacy, cycle control, and safety were in earlier report (Hampton 2001). | |
| Notes | ||
| Risk of bias | ||
| Bias | Authors' judgement | Support for judgement |
| Random sequence generation (selection bias) | Unclear risk | Allocated with block sizes of 11 |
| Allocation concealment (selection bias) | Unclear risk | No information |
| Blinding (performance bias and detection bias) | Low risk | Blinded (participants and at least the assessors at cycle 3). |
| Incomplete outcome data (attrition bias) | High risk | Lost to follow up reportedly 6.5% in NGM/EE group and 5.8% in NETA/EE group. Noncompleters were 21% of 6‐cycle groups; 42% to 40% of 13‐cycle groups, respectively. |
| Methods | Three sites in Sweden. | |
| Participants | Healthy women age 18 to 39 years at risk of pregnancy. | |
| Interventions | Prolonged regimen (desogestrel 150 µg and EE 30 µg; nine pill weeks and one pill‐free week; N=198) versus standard regimen (desogestrel 96 µg and EE 30 µg; three pill weeks and one pill‐free week; N=96). | |
| Outcomes | Lipoprotein, liver function, blood coagulation, adverse events, body weight, blood pressure. | |
| Notes | ||
| Risk of bias | ||
| Bias | Authors' judgement | Support for judgement |
| Random sequence generation (selection bias) | Unclear risk | No information |
| Allocation concealment (selection bias) | Unclear risk | Allocated with sealed envelopes. |
| Blinding (performance bias and detection bias) | Unclear risk | No information |
| Incomplete outcome data (attrition bias) | High risk | 83 women in the prolonged regimen and 32 women in the standard regimen group discontinued early. |
| Methods | Unspecified location. | |
| Participants | Healthy women age 18 to 38 years with regular menses. | |
| Interventions | Norgestimate 250 µg and EE 35 µg (N=25) versus gestodene 75 µg and EE 30 µg (N=25) versus desogestrel 150 µg and EE 30 µg (N=25) versus desogestrel 150 µg and EE 20 µg (N=25). | |
| Outcomes | ||
| Notes | ||
| Risk of bias | ||
| Bias | Authors' judgement | Support for judgement |
| Random sequence generation (selection bias) | Unclear risk | No information |
| Allocation concealment (selection bias) | Unclear risk | No information |
| Blinding (performance bias and detection bias) | High risk | Unblinded |
| Incomplete outcome data (attrition bias) | Unclear risk | 2 women who became pregnant during pretreatment cycle were excluded and replaced. Primary reasons for discontinuation described; 1 women in the norgestimate group cited weight change. |
| Methods | 32 sites in USA, Canada and Australia. | |
| Participants | Healthy women age 14 or more years with regular menses and moderate facial acne. | |
| Interventions | Levonorgestrel 100 µg and EE 20 µg (N=359) versus placebo (N=362). | |
| Outcomes | Lipoprotein, liver function, blood coagulation, adverse events, body weight, blood pressure. | |
| Notes | ||
| Risk of bias | ||
| Bias | Authors' judgement | Support for judgement |
| Random sequence generation (selection bias) | Low risk | Computer‐generated randomization scheme with block size of four stratified by study site. |
| Allocation concealment (selection bias) | Unclear risk | No information |
| Blinding (performance bias and detection bias) | Low risk | "Double‐blinded" but did not report who was blinded. |
| Incomplete outcome data (attrition bias) | High risk | 22 women in the levonorgestrel and 15 women in the placebo group withdrew before starting treatment. |
| Methods | Location not described. | |
| Participants | Inclusion and exclusion criteria not described. | |
| Interventions | Levonorgestrel 250 µg and EE 50 µg (N=73) versus levonorgestrel 150 µg and EE 30 µg (N=77). | |
| Outcomes | Cycle control, side effects, discontinuation. | |
| Notes | ||
| Risk of bias | ||
| Bias | Authors' judgement | Support for judgement |
| Random sequence generation (selection bias) | Unclear risk | No information |
| Allocation concealment (selection bias) | Unclear risk | No information |
| Blinding (performance bias and detection bias) | Low risk | "Double‐blinded" but did not report who was blinded. |
| Incomplete outcome data (attrition bias) | High risk | 20 women in the higher dose pill and 21 women in the lower dose pill group discontinued early or were lost to follow up. |
| Methods | 10 sites in Germany. | |
| Participants | Healthy, sexually active women age 18 to 39 years. | |
| Interventions | Gestodene 75 µg and EE 20 µg (N=428) versus gestodene 75 µg and EE 30 µg (N=221). | |
| Outcomes | Contraceptive reliability, cycle control, tolerance (including body weight). | |
| Notes | ||
| Risk of bias | ||
| Bias | Authors' judgement | Support for judgement |
| Random sequence generation (selection bias) | Unclear risk | No information |
| Allocation concealment (selection bias) | Unclear risk | No information |
| Blinding (performance bias and detection bias) | Low risk | "Double‐blinded" but did not report who was blinded. |
| Incomplete outcome data (attrition bias) | High risk | 93 women in the EE 20 µg and 40 women in the EE 30 µg group discontinued early. Primary reasons for discontinuation included weight gain but no data reported. |
| Methods | 123 sites in France, Austria, the UK, The Netherlands, Switzerland and Italy. | |
| Participants | Healthy women age 18 to 35 years with regular menses. | |
| Interventions | Gestodene 75 µg and EE 20 µg (N=786) versus desogestrel 150 µg and EE 20 µg (N=777). | |
| Outcomes | Contraceptive efficacy, cycle control, adverse events. | |
| Notes | ||
| Risk of bias | ||
| Bias | Authors' judgement | Support for judgement |
| Random sequence generation (selection bias) | Unclear risk | No information |
| Allocation concealment (selection bias) | Unclear risk | No information |
| Blinding (performance bias and detection bias) | High risk | Unblinded |
| Incomplete outcome data (attrition bias) | High risk | 228 women in the gestodene and 221 women in the desogestrel group discontinued early or were lost to follow up. Primary reasons for discontinuation described and did not include weight gain. |
| Methods | 67 sites in Austria, Belgium, France, Italy, Switzerland, and the UK. | |
| Participants | Healthy women age 18 to 35 years. | |
| Interventions | Prolonged regimen (gestodene 75 µg and EE 20 µg; 23 pill and 5 placebo days) versus standard regimen (desogestrel 150 µg and EE 20 µg; 21 pill and 7 placebo days). | |
| Outcomes | Contraceptive efficacy, cycle control, discontinuation, adverse events, blood pressure, weight. | |
| Notes | ||
| Risk of bias | ||
| Bias | Authors' judgement | Support for judgement |
| Random sequence generation (selection bias) | Unclear risk | No information |
| Allocation concealment (selection bias) | Unclear risk | No information |
| Blinding (performance bias and detection bias) | High risk | Unblinded |
| Incomplete outcome data (attrition bias) | High risk | 42 women withdrew before starting treatment. |
| Methods | 30 sites in Germany. | |
| Participants | Healthy, normal weight women age 18 to 35 years. | |
| Interventions | Levonorgestrel 100 µg and EE 20 µg (N=380) versus norethisterone 500 µg and EE 20 µg (N=255) versus levonorgestrel 150 µg and EE 30 µg (N=125; study standard). | |
| Outcomes | Cycle control, contraceptive efficacy, discontinuations, blood pressure, adverse events, weight. | |
| Notes | ||
| Risk of bias | ||
| Bias | Authors' judgement | Support for judgement |
| Random sequence generation (selection bias) | Low risk | Computer‐generated randomization scheme. |
| Allocation concealment (selection bias) | Unclear risk | No information |
| Blinding (performance bias and detection bias) | High risk | Unblinded |
| Incomplete outcome data (attrition bias) | High risk | 73 women in the levonorgestrel/EE 20 µg, 74 women in the norethisterone, and 13 women in the levonorgestrel/EE 30 µg group discontinued early or were lost to follow up. Primary reasons for discontinuation not described. |
| Methods | One site in France. | |
| Participants | Healthy, non‐obese women age 19 to 27 years with regular menses and normal lipid values. | |
| Interventions | Desogestrel 150 µg and EE 20 µg (N=20) versus levonorgestrel 50‐75‐125 µg and EE 30‐40‐30 µg (N=17). | |
| Outcomes | Lipoprotein levels, body mass index, blood pressure. | |
| Notes | ||
| Risk of bias | ||
| Bias | Authors' judgement | Support for judgement |
| Random sequence generation (selection bias) | Unclear risk | No information |
| Allocation concealment (selection bias) | Unclear risk | No information |
| Blinding (performance bias and detection bias) | Unclear risk | No information |
| Incomplete outcome data (attrition bias) | Unclear risk | Early discontinuation and loss to follow up not reported. |
| Methods | One site in Italy. | |
| Participants | Women age 18 to 43 years. | |
| Interventions | Desogestrel 150 µg and EE 20 µg versus gestodene 75 µg and EE 30 µg. | |
| Outcomes | Weight, body composition changes. | |
| Notes | ||
| Risk of bias | ||
| Bias | Authors' judgement | Support for judgement |
| Random sequence generation (selection bias) | Unclear risk | No information |
| Allocation concealment (selection bias) | Unclear risk | No information |
| Blinding (performance bias and detection bias) | High risk | Unblinded |
| Incomplete outcome data (attrition bias) | High risk | 19 women discontinued early. Adverse events cited as primary reason for discontinuation were not described in detail. |
| Methods | One site in USA. | |
| Participants | Women willing to use vaginal contraceptive foam or cream. | |
| Interventions | EE 100 µg with last five of the 20 pills also containing dimethisterone 25 mg (N=79) versus mestranol 100 µg and ethynodiol diacetate 1 mg (N=78) versus mestranol 50 mg and norethindrone 1 mg (N=81) versus chlormadinone acetate 500 µg daily (N=84) versus placebo (N=76). | |
| Outcomes | Nausea, vomiting, abdominal discomfort, mastalgia, headache, nervousness, depression, body weight, blood pressure. | |
| Notes | ||
| Risk of bias | ||
| Bias | Authors' judgement | Support for judgement |
| Random sequence generation (selection bias) | Unclear risk | No information |
| Allocation concealment (selection bias) | Unclear risk | No information |
| Blinding (performance bias and detection bias) | Low risk | Double‐blinded; participants and investigators blinded. |
| Incomplete outcome data (attrition bias) | Unclear risk | Early discontinuation and loss to follow up not reported. |
| Methods | 25 centers in 4 countries (Italy, UK, Czech Republic, and Belgium). | |
| Participants | Healthy women aged 18 to 35 years, except for smokers over 30 years. | |
| Interventions | Drospirenone 3 mg and EE 20 µg (N=222) versus desogestrel 150 µg and EE 20 µg (N=223). | |
| Outcomes | Mean body weight change (no methods reported), bleeding patterns, and contraceptive efficacy. | |
| Notes | Full analysis defined as having at least one dose of study medication and one study observation rather than intent‐to‐treat. | |
| Risk of bias | ||
| Bias | Authors' judgement | Support for judgement |
| Random sequence generation (selection bias) | Low risk | Randomization via "computer‐generated randomization schedule". |
| Allocation concealment (selection bias) | Unclear risk | No information |
| Blinding (performance bias and detection bias) | High risk | Open‐label |
| Incomplete outcome data (attrition bias) | Low risk | Lost to follow up: 2.3% drospirenone group and 3.6% desogestrel group. |
| Methods | 8 sites in Brazil. | |
| Participants | Healthy, reproductive‐age women with regular menses and at risk for pregnancy. | |
| Interventions | Desogestrel 150 µg and EE 30 µg (N=316) versus gestodene 75 µg and EE 30 µg (N=279). | |
| Outcomes | Contraceptive efficacy, cycle control, skin conditions, blood pressure, body weight, adverse events. | |
| Notes | ||
| Risk of bias | ||
| Bias | Authors' judgement | Support for judgement |
| Random sequence generation (selection bias) | Unclear risk | No information |
| Allocation concealment (selection bias) | Unclear risk | No information |
| Blinding (performance bias and detection bias) | High risk | Unblinded |
| Incomplete outcome data (attrition bias) | Low risk | 34 women in the desogestrel and 44 women in the gestodene group discontinued early. 19 of these early discontinuations occurred before initiating treatment. Primary reasons for discontinuation described; four women in the gestodene group cited weight gain. |
| Methods | Public health centers in Iran. | |
| Participants | 342 women seeking contraception at public health centers. Inclusion criteria: married, age 17 to 40 years, regular menstruation, no signs or symptoms similar to adverse effects of pills before using them, no prior OCP use. Exclusion criteria: contraindication to pills, systemic disorders or drug use, breastfeeding, delivered < 3 weeks previously; use of injectable contraceptive in past 6 months or implant in past 3 months; abnormal Pap smear, abnormal blood cholesterol and triglycerides, and being illiterate. | |
| Interventions | Levonorgestrel 150 µg and EE 30 µg versus levonorgestrel 50‐75‐125 µg and EE 30‐40‐30 µg | |
| Outcomes | Weight change (weight measured monthly by investigator), side effects, satisfaction | |
| Notes | ||
| Risk of bias | ||
| Bias | Authors' judgement | Support for judgement |
| Random sequence generation (selection bias) | Low risk | Randomization method not clear in report; blocks of 4 mentioned. Correspondence with researcher indicated use of Random Allocation Software with "simple block randomization." |
| Allocation concealment (selection bias) | Low risk | "Sealed, sequentially distributed envelopes" with letters A, B, C, D (2 letters assigned to each treatment group). Participant chose an envelope, which investigator opened. |
| Blinding (performance bias and detection bias) | Low risk | Blinding not mentioned in report, but investigator communicated that the outcome assessors were blinded to group assignment. |
| Incomplete outcome data (attrition bias) | Low risk | Loss to follow up: monophasic 6% (10/171); triphasic 9% (16/171). |
| Methods | 131 sites. | |
| Participants | Normal‐weight women age 18 to 50 years at risk of pregnancy with regular menses. | |
| Interventions | Triphasics: desogestrel 100‐125‐150 µg and EE 25 µg versus norethindrone 500‐750‐1000 µg and EE 35 µg. | |
| Outcomes | Contraceptive efficacy, cycle control, adverse events, biochemical changes, weight and body mass index, blood pressure. | |
| Notes | ||
| Risk of bias | ||
| Bias | Authors' judgement | Support for judgement |
| Random sequence generation (selection bias) | Low risk | Computer‐generated randomization scheme stratified by study site. |
| Allocation concealment (selection bias) | Unclear risk | No information |
| Blinding (performance bias and detection bias) | High risk | Unblinded |
| Incomplete outcome data (attrition bias) | Unclear risk | 1040 women discontinued early. Adverse events cited as primary reason for discontinuation were not described in detail. |
| Methods | 66 sites in Denmark, Italy, New Zealand and the United Kingdom. | |
| Participants | Healthy women over age 30 years. | |
| Interventions | Gestodene 75 µg and EE 30 µg (N=505) versus desogestrel 150 µg and EE 20 µg (N=501). | |
| Outcomes | Contraceptive efficacy, cycle control, body weight, blood pressure, discontinuation. | |
| Notes | ||
| Risk of bias | ||
| Bias | Authors' judgement | Support for judgement |
| Random sequence generation (selection bias) | Low risk | Randomization by pre‐distributed schedules. |
| Allocation concealment (selection bias) | Unclear risk | No information |
| Blinding (performance bias and detection bias) | High risk | Unblinded |
| Incomplete outcome data (attrition bias) | Low risk | 52 women in the gestodene and 49 women in the desogestrel group discontinued early. |
| Methods | Study location not described. | |
| Participants | Healthy women age 21 to 35 years with normal lipid levels and regular menses. | |
| Interventions | Desogestrel 50‐100‐150 µg and EE 35‐30‐30 µg (N=33) versus levonorgestrel 50‐75‐125 µg and EE 30‐40‐30 µg (N=34). | |
| Outcomes | Plasma lipids, glucose, insulin, hemostasis, sex hormone binding globulin. | |
| Notes | ||
| Risk of bias | ||
| Bias | Authors' judgement | Support for judgement |
| Random sequence generation (selection bias) | Unclear risk | No information |
| Allocation concealment (selection bias) | Unclear risk | No information |
| Blinding (performance bias and detection bias) | Unclear risk | No information |
| Incomplete outcome data (attrition bias) | Unclear risk | Early discontinuation and loss to follow up not reported. |
| Methods | One site in India. | |
| Participants | Healthy women with proven fertility. | |
| Interventions | Lynestrenol 2 mg and EE 40 µg (N=150) versus lynestrenol 1 mg and EE 40 µg (N=150). | |
| Outcomes | Contraceptive efficacy, cycle control, nausea, weight, headache, dysmenorrhea. | |
| Notes | ||
| Risk of bias | ||
| Bias | Authors' judgement | Support for judgement |
| Random sequence generation (selection bias) | Unclear risk | No information |
| Allocation concealment (selection bias) | Unclear risk | No information |
| Blinding (performance bias and detection bias) | High risk | Unblinded |
| Incomplete outcome data (attrition bias) | High risk | 30 women in the lynestrenol 2 mg and 33 women in the lynestrenol 1 mg group discontinued early. Discontinuations due to side effects not described. |
| Methods | Six sites in Thailand. | |
| Participants | Healthy women of fertile age with regular menses. | |
| Interventions | Desogestrel 150 µg and EE 30 µg (N=394) versus gestodene 75 µg and EE 30 µg (N=389). | |
| Outcomes | Contraceptive efficacy, cycle control, side effects. | |
| Notes | ||
| Risk of bias | ||
| Bias | Authors' judgement | Support for judgement |
| Random sequence generation (selection bias) | Unclear risk | Randomization by random number table. |
| Allocation concealment (selection bias) | Unclear risk | No information |
| Blinding (performance bias and detection bias) | Low risk | Unblinded |
| Incomplete outcome data (attrition bias) | Low risk | 23 women in the desogestrel and 31 women in the gestodene group discontinued early. Adverse events cited as primary reason for discontinuation not described in detail. |
| Methods | Multicenter trial in Austria, Germany, The Netherlands and the UK. | |
| Participants | Inclusion and exclusion criteria not described. | |
| Interventions | Desogestrel 150 µg and EE 30 µg (N=277) versus triphasic: levonorgestrel 50‐75‐125 µg and EE 30‐40‐30 µg (N=278). | |
| Outcomes | Contraceptive efficacy, cycle control, body weight, blood pressure, side effects. | |
| Notes | ||
| Risk of bias | ||
| Bias | Authors' judgement | Support for judgement |
| Random sequence generation (selection bias) | Unclear risk | No information |
| Allocation concealment (selection bias) | Unclear risk | No information |
| Blinding (performance bias and detection bias) | Unclear risk | No information |
| Incomplete outcome data (attrition bias) | Low risk | 86 women discontinued early or were lost to follow up. |
| Methods | Study location not described. | |
| Participants | Healthy normal‐weight women with regular menses. | |
| Interventions | Levonorgestrel 150 µg and EE 30 µg (N=10) versus desogestrel 150 µg and EE 30 µg (N=10). | |
| Outcomes | Body weight, blood pressure, plasma renin activity. | |
| Notes | ||
| Risk of bias | ||
| Bias | Authors' judgement | Support for judgement |
| Random sequence generation (selection bias) | Unclear risk | No information |
| Allocation concealment (selection bias) | Unclear risk | No information |
| Blinding (performance bias and detection bias) | Unclear risk | No information |
| Incomplete outcome data (attrition bias) | Low risk | One woman in the levonorgestrel and two women in the desogestrel group discontinued early. Primary reasons for discontinuation described and did not include weight gain. |
| Methods | 31 sites in the United Kingdom. | |
| Participants | Women age 16 to 35 years. | |
| Interventions | Gestodene 75 µg and EE 30 µg (N=229) versus levonorgestrel 150 µg and EE 30 µg (N=227). | |
| Outcomes | Cycle control, body weight, blood pressure, other side effects, withdrawals. | |
| Notes | ||
| Risk of bias | ||
| Bias | Authors' judgement | Support for judgement |
| Random sequence generation (selection bias) | Unclear risk | No information |
| Allocation concealment (selection bias) | Unclear risk | No information |
| Blinding (performance bias and detection bias) | Low risk | "Double‐blinded" but did not report who was blinded. |
| Incomplete outcome data (attrition bias) | Low risk | 24 women in the gestodene and 30 women in the levonorgestrel group discontinued early. Primary reasons for discontinuation not described in detail. |
| Methods | Four sites in USA. | |
| Participants | Women age 18 to 45 years who could speak and read English and who did not intend to become pregnant within one year. | |
| Interventions | Standard regimen (28‐day cycle with 21 active pills; N=44) versus prolonged regimen (49‐day cycle with 42 active pills; N=46). Both groups used same oral contraceptive (levonorgestrel 300 µg and EE 30 µg). | |
| Outcomes | Cycle control, body weight, blood pressure, other side effects, withdrawals. | |
| Notes | ||
| Risk of bias | ||
| Bias | Authors' judgement | Support for judgement |
| Random sequence generation (selection bias) | Low risk | Randomized using random number table and permuted blocks of six. |
| Allocation concealment (selection bias) | Low risk | Allocation concealed with sequentially numbered, opaque envelopes. |
| Blinding (performance bias and detection bias) | High risk | Unblinded |
| Incomplete outcome data (attrition bias) | High risk | 2 women in each group withdrew before starting treatment. |
| Methods | Open‐label, randomized trial in 10 European countries from May 2002 to April 2004. | |
| Participants | 1017 women, at least 18 years old, seeking contraception. Exclusion criteria: contraindication for hormonal contraception, abortion or breastfeeding in past 2 months, injectable hormonal contraceptive use in past 6 months, abnormal cervical smear during screening, and use in past 2 months of drugs that interfere with metabolism of hormonal contraceptives. | |
| Interventions | Vaginal ring releasing etonogestrel 120 µg + EE 15 µg daily versus COC containing drospirenone 3 mg + EE 30 µg; 13 treatment cycles. | |
| Outcomes | Body weight (methods reported for standardized measurements) and body composition; contraceptive efficacy, compliance, acceptability, tolerability (adverse events), continuation in earlier report (Ahrendt 2006) | |
| Notes | ||
| Risk of bias | ||
| Bias | Authors' judgement | Support for judgement |
| Random sequence generation (selection bias) | Low risk | Randomization conducted via an interactive voice response system. |
| Allocation concealment (selection bias) | Low risk | Interactive voice response system. |
| Blinding (performance bias and detection bias) | High risk | Open‐label |
| Incomplete outcome data (attrition bias) | Unclear risk | Loss after randomization and before treatment: 1017 ‐ 983 = 34. |
| Methods | 11 countries in Europe and South America. 13 treatment cycles. | |
| Participants | 1030 "healthy" women, 18 or more years old. | |
| Interventions | Vaginal ring releasing 120 µg etonogestrel and 15 µg ethinylestradiol daily (N=512) versus OC with 150 µg levonorgestrel and 30 µg ethinylestradiol (N=518). | |
| Outcomes | Contraceptive efficacy, compliance, weight change (≥7% or ≤7%). | |
| Notes | ||
| Risk of bias | ||
| Bias | Authors' judgement | Support for judgement |
| Random sequence generation (selection bias) | Low risk | Randomized with interactive voice response system, which gave treatment group and medication number. |
| Allocation concealment (selection bias) | Low risk | Interactive voice response system |
| Blinding (performance bias and detection bias) | High risk | Open‐label |
| Incomplete outcome data (attrition bias) | High risk | 1090 were randomized, but only 1079 began treatment. |
| Methods | Study location not described. | |
| Participants | Women age 18 to 34 years. | |
| Interventions | Drospirenone 3 mg and EE 30 µg (N=20) versus drospirenone 3 mg and EE 20 µg (N=20) versus drospirenone 3 mg and EE 15 µg (N=20) versus levonorgestrel 150 µg and EE 30 µg (N=20; control group). | |
| Outcomes | Renin‐aldosterone system, well‐being, cycle control, body weight, blood pressure, glucose tolerance, lipid metabolism. | |
| Notes | ||
| Risk of bias | ||
| Bias | Authors' judgement | Support for judgement |
| Random sequence generation (selection bias) | Unclear risk | No information |
| Allocation concealment (selection bias) | Unclear risk | No information |
| Blinding (performance bias and detection bias) | Low risk | Triple‐blinded; participant, investigator and outcome assessor blinded. |
| Incomplete outcome data (attrition bias) | Unclear risk | Early discontinuation and loss to follow up not reported. |
| Methods | Study 2: Study 3: | |
| Participants | Study 2 and 3: | |
| Interventions | Study 2: Study 3: | |
| Outcomes | Study 2 and 3: | |
| Notes | ||
| Risk of bias | ||
| Bias | Authors' judgement | Support for judgement |
| Random sequence generation (selection bias) | Unclear risk | No information |
| Allocation concealment (selection bias) | Unclear risk | No information |
| Blinding (performance bias and detection bias) | Unclear risk | Study 2, no information; study 3, unblinded. |
| Incomplete outcome data (attrition bias) | Unclear risk | Early discontinuation and loss to follow up not reported. |
| Methods | Five sites in USA. | |
| Participants | 150 female runners. Inclusion criteria: 18 to 26 years old, run at least 40 miles per week during peak training times, and compete in running races. | |
| Interventions | Norgestrel 300 µg and EE 30 µg (N=69) versus no intervention (N=81). | |
| Outcomes | Bone mass, stress fractures, weight and body composition. | |
| Notes | Crossover from assigned protocol > 25% in each group; researchers conducted primary analysis by assigned group and secondary analysis by treatment received. | |
| Risk of bias | ||
| Bias | Authors' judgement | Support for judgement |
| Random sequence generation (selection bias) | Unclear risk | Randomization done by investigator not involved in study, using random‐number table. Stratified by clinical site. |
| Allocation concealment (selection bias) | Unclear risk | No information |
| Blinding (performance bias and detection bias) | High risk | Unblinded participants and prescribing physicians; assessors not informed of treatment assignment. |
| Incomplete outcome data (attrition bias) | Low risk | Loss to follow up: 17% overall; treatment 22% (15/69); control 14% (11/81). |
| Methods | Six sites in Germany and Belgium. | |
| Participants | Women age 18 to 35 years (18 to 30 years for smokers) with regular menses. | |
| Interventions | Drospirenone 2 mg and EE 30 µg (N=26) versus drospirenone 3 mg and EE 30 µg (N=26). | |
| Outcomes | Hormonal and peripheral measurements, cycle control, safety. | |
| Notes | ||
| Risk of bias | ||
| Bias | Authors' judgement | Support for judgement |
| Random sequence generation (selection bias) | Low risk | Computer‐generated randomization scheme. |
| Allocation concealment (selection bias) | Unclear risk | No information |
| Blinding (performance bias and detection bias) | High risk | Unblinded |
| Incomplete outcome data (attrition bias) | Unclear risk | No one in the drospirenone 2 mg and one woman in the drospirenone 3 mg group discontinued early. The primary reasons for discontinuation described and did not include weight gain. |
| Methods | 15 sites in China. | |
| Participants | Healthy women age 18 to 35 years with regular menses and proven fertility. | |
| Interventions | Norethisterone enanthate 50 mg and estradiol valerate 5 mg (N=1960) versus medroxyprogesterone acetate 25 mg and estradiol cypionate 5 mg (N=1955). | |
| Outcomes | Contraceptive efficacy, discontinuation, weight, blood pressure, side effects. | |
| Notes | ||
| Risk of bias | ||
| Bias | Authors' judgement | Support for judgement |
| Random sequence generation (selection bias) | Unclear risk | Randomization using random numbers table. |
| Allocation concealment (selection bias) | Unclear risk | No information |
| Blinding (performance bias and detection bias) | Unclear risk | No information |
| Incomplete outcome data (attrition bias) | High risk | 353 women in the norethisterone enanthate and 498 women in the medroxyprogesterone acetate group discontinued early. Primary reasons for discontinuation described; 10 women in the norethisterone enanthate and 14 women in the medroxyprogesterone acetate group cited weight gain. |
| Methods | 52 sites in Paris, France. | |
| Participants | Healthy, normal‐weight women age 18 to 45 years (18 to 35 years for smokers) with regular menses and normal plasma lipid and carbohydrate levels. | |
| Interventions | Desogestrel 150 µg and EE 20 µg (N=515) versus gestodene 75 µg and EE 20 µg (N=511). | |
| Outcomes | Contraceptive efficacy, cycle control, premenstrual syndrome, adverse events, weight, blood pressure. | |
| Notes | ||
| Risk of bias | ||
| Bias | Authors' judgement | Support for judgement |
| Random sequence generation (selection bias) | Unclear risk | Randomized in blocks of four. |
| Allocation concealment (selection bias) | Unclear risk | No information |
| Blinding (performance bias and detection bias) | Low risk | Unblinded |
| Incomplete outcome data (attrition bias) | Unclear risk | Six women in the desogestrel and four women in the gestodene group withdrew before starting treatment. |
| Methods | Study location not described. | |
| Participants | Inclusion and exclusion criteria not described. | |
| Interventions | Contraceptive skin patch releasing norelgestromin 150 µg and EE 20 µg daily (N=92) versus placebo (N=44). | |
| Outcomes | Body weight. | |
| Notes | ||
| Risk of bias | ||
| Bias | Authors' judgement | Support for judgement |
| Random sequence generation (selection bias) | Unclear risk | No information |
| Allocation concealment (selection bias) | Unclear risk | No information |
| Blinding (performance bias and detection bias) | Low risk | "Double‐blinded" but did not report who was blinded. |
| Incomplete outcome data (attrition bias) | Unclear risk | Early discontinuation and loss to follow up not reported. Unclear if the number of participants with weight outcomes was the number of women randomized. |
| Methods | One site in the USA. | |
| Participants | Inclusion and exclusion criteria not described. | |
| Interventions | Ethynodiol diacetate 1.0 mg and mestranol 100 µg (N=24) versus 15 pills of mestranol 100 mg, 8 pills of mestranol 100 mg and chlormadinone acetate 1.5 mg and 5 placebo pills (N=33). | |
| Outcomes | Blood pressure. | |
| Notes | ||
| Risk of bias | ||
| Bias | Authors' judgement | Support for judgement |
| Random sequence generation (selection bias) | Unclear risk | No information |
| Allocation concealment (selection bias) | Unclear risk | No information |
| Blinding (performance bias and detection bias) | Unclear risk | No information |
| Incomplete outcome data (attrition bias) | Unclear risk | Early discontinuation and loss to follow up not reported. |
| Methods | Two sites in UK and Austria. | |
| Participants | Healthy, non‐obese women age 19 to 35 years with demonstrable ovulatory pretreatment cycle. | |
| Interventions | Standard regimen (21 pill days and 7 pill‐free days; N=30) versus prolonged regimen (23 pill days and 5 pill‐free days; N=30). Both groups used the same oral contraceptive (gestodene 75 µg and EE 20 µg). | |
| Outcomes | Follicular development, endogenous hormone levels, cycle control, adverse effects. | |
| Notes | ||
| Risk of bias | ||
| Bias | Authors' judgement | Support for judgement |
| Random sequence generation (selection bias) | Unclear risk | Randomization list using blocks of ten and four. |
| Allocation concealment (selection bias) | Unclear risk | No information |
| Blinding (performance bias and detection bias) | Low risk | "Double‐blinded" but did not report who was blinded. |
| Incomplete outcome data (attrition bias) | Low risk | One woman in the standard regimen and no women in the prolonged regimen group discontinued early. Primary reasons for discontinuation described and did not include weight change. |
| Methods | 9 clinical research sites. | |
| Participants | 239 healthy, regularly menstruating women, aged 18 to 45 years. | |
| Interventions | Patch delivered daily 150 µg norelgestromin and 20 µg ethinyl E2. | |
| Outcomes | Total bleeding or spotting days plus headaches and overall assessment; weight change. | |
| Notes | Four subjects had no information after randomization (3 extended and 1 cyclic). | |
| Risk of bias | ||
| Bias | Authors' judgement | Support for judgement |
| Random sequence generation (selection bias) | Low risk | Computer‐generated randomization done by pharmaceutical sponsor; permuted blocks of 6. Assigned 2:1. |
| Allocation concealment (selection bias) | Unclear risk | No information |
| Blinding (performance bias and detection bias) | Unclear risk | No information |
| Incomplete outcome data (attrition bias) | Low risk | Lost to follow up: 2% in extended group and 4% in cyclic regimen. |
| Methods | One site in Poland. | |
| Participants | Healthy, non‐obese, sexually active women age 19 to 40 years with regular menses. | |
| Interventions | Gestodene 75 µg and EE 30 µg versus desogestrel 150 µg and EE 20 µg. | |
| Outcomes | Follicle growth, discontinuation. | |
| Notes | ||
| Risk of bias | ||
| Bias | Authors' judgement | Support for judgement |
| Random sequence generation (selection bias) | Unclear risk | No information |
| Allocation concealment (selection bias) | Unclear risk | No information |
| Blinding (performance bias and detection bias) | Unclear risk | No information |
| Incomplete outcome data (attrition bias) | Unclear risk | 84 women withdrew before starting treatment. |
| Methods | One site in the Netherlands. | |
| Participants | Healthy women age 20 to 35 years with regular menses. | |
| Interventions | Triphasics: levonorgestrel 50‐75‐125 µg and EE 30‐40‐30 µg (N=15) versus desogestrel 50‐100‐150 µg and EE 35‐30‐30 µg (N=16). | |
| Outcomes | Follicle growth, hormone levels. | |
| Notes | ||
| Risk of bias | ||
| Bias | Authors' judgement | Support for judgement |
| Random sequence generation (selection bias) | Unclear risk | No information |
| Allocation concealment (selection bias) | Unclear risk | No information |
| Blinding (performance bias and detection bias) | High risk | Unblinded |
| Incomplete outcome data (attrition bias) | Unclear risk | Early discontinuation and loss to follow up not reported. |
| Methods | Three sites in Australia and USA. | |
| Participants | Women age 18 to 35 years with regular menses. | |
| Interventions | Contraceptive vaginal ring releasing norethindrone acetate 1 mg and EE 15 µg (N=37) versus norethindrone acetate 1 mg and EE 20 µg (N=24). | |
| Outcomes | Serum hormone levels, side effects, weight. | |
| Notes | ||
| Risk of bias | ||
| Bias | Authors' judgement | Support for judgement |
| Random sequence generation (selection bias) | Unclear risk | No information |
| Allocation concealment (selection bias) | Unclear risk | No information |
| Blinding (performance bias and detection bias) | Unclear risk | No information |
| Incomplete outcome data (attrition bias) | Unclear risk | Nine women discontinued early or were excluded for protocol violations. Primary reasons for discontinuation described and weight gain not cited. |
| Methods | Study location not described. | |
| Participants | Healthy women age 18 to 36 years with regular menses. | |
| Interventions | Gestodene 50‐70‐100 µg and EE 30‐40‐30 µg versus norgestimate 250 µg and EE 35 µg. | |
| Outcomes | Serum hormone levels, side effects. | |
| Notes | ||
| Risk of bias | ||
| Bias | Authors' judgement | Support for judgement |
| Random sequence generation (selection bias) | Unclear risk | No information |
| Allocation concealment (selection bias) | Unclear risk | No information |
| Blinding (performance bias and detection bias) | Unclear risk | No information |
| Incomplete outcome data (attrition bias) | Low risk | Six women discontinued early. Primary reasons for discontinuation described and weight gain not cited. |
| Methods | Two sites in Germany. | |
| Participants | Women age 18 to 35 years with regular menses. | |
| Interventions | Dienogest 2 mg and EE 30 µg versus dienogest 2 mg and EE 20 µg versus dienogest 2 mg, estradiol valerate 2 mg and EE 10 µg versus levonorgestrel 100 µg and EE 20 µg. | |
| Outcomes | Lipid metabolism. | |
| Notes | ||
| Risk of bias | ||
| Bias | Authors' judgement | Support for judgement |
| Random sequence generation (selection bias) | Unclear risk | No information |
| Allocation concealment (selection bias) | Unclear risk | No information |
| Blinding (performance bias and detection bias) | Low risk | "Double‐blinded" but did not report who was blinded. |
| Incomplete outcome data (attrition bias) | Low risk | 110 women screened and 100 randomized. |
| Methods | Ten sites in Norway and Finland. | |
| Participants | Healthy, normal‐weight women age 18 to 30 years. | |
| Interventions | Norethisterone 500‐1000 µg and EE 35 µg (N=100) versus levonorgestrel 50‐75‐125 µg and EE 30‐40 µg (N=96). | |
| Outcomes | Serum lipids, discontinuation, side effects, weight. | |
| Notes | ||
| Risk of bias | ||
| Bias | Authors' judgement | Support for judgement |
| Random sequence generation (selection bias) | Low risk | Computer‐generated randomization scheme. |
| Allocation concealment (selection bias) | Unclear risk | No information |
| Blinding (performance bias and detection bias) | Low risk | "Single‐blinded" but did not report who was blinded. |
| Incomplete outcome data (attrition bias) | High risk | 17 women in the norethisterone and seven in the levonorgestrel group discontinued early. Primary reasons for discontinuation described; four women in the norethisterone and one woman in the levonorgestrel group cited weight gain. |
| Methods | One site. | |
| Participants | Healthy women age 18 to 30 years. | |
| Interventions | Gestodene 75 µg and EE 30 µg (N=20) versus gestodene 75 µg and EE 20 µg (N=20). | |
| Outcomes | Hemostatic measurements. | |
| Notes | ||
| Risk of bias | ||
| Bias | Authors' judgement | Support for judgement |
| Random sequence generation (selection bias) | Unclear risk | No information |
| Allocation concealment (selection bias) | Unclear risk | No information |
| Blinding (performance bias and detection bias) | High risk | Unblinded |
| Incomplete outcome data (attrition bias) | Low risk | Two women in both groups discontinued early. Primary reasons for discontinuation described and weight change not cited. |
| Methods | One site. | |
| Participants | Inclusion and exclusion criteria not described. | |
| Interventions | Norethisterone acetate 1 mg and EE 50 µg versus levonorgestrel 250 µg and EE 50 µg versus dl‐norgestrel 500 µg and EE 50 µg. | |
| Outcomes | Psychological tests, blood pressure, weight. | |
| Notes | ||
| Risk of bias | ||
| Bias | Authors' judgement | Support for judgement |
| Random sequence generation (selection bias) | Unclear risk | No information |
| Allocation concealment (selection bias) | Unclear risk | No information |
| Blinding (performance bias and detection bias) | Unclear risk | No information |
| Incomplete outcome data (attrition bias) | Unclear risk | Early discontinuation and loss to follow up not reported. |
COC = combination oral contraceptive
DMPA = depot‐medroxyprogesterone acetate
EE = ethinyl estradiol
OC = oral contraceptive
Characteristics of excluded studies [ordered by study ID]
| Study | Reason for exclusion |
| No weight change data presented. Researchers presented the numbers that reported an increase in weight as adverse events. Weight was reportedly measured at screening and final assessment. | |
| Participants chose DMPA or OC, then DMPA group was randomly assigned to estrogen supplement or placebo supplement. | |
| No change data presented. Researchers presented weights at baseline and maximum weight gain. | |
| No change data presented. Researchers compared body mass index within group at pre‐treatment and post‐treatment. | |
| Single‐arm study | |
| Weight change was shown in figure without actual numbers. Abstract provided means without variance. Researchers reported that BMI was also measured but no data were provided. | |
| No information on sampling variation for mean weight changes. | |
| Researchers reported no significant change in weight. No weight data provided for calculating. | |
| No weight change data presented. Investigators reported mean weight (and SD) at baseline and end of study. | |
| Study duration was only one cycle. | |
| No weight change data presented. Researchers compared weights for groups at baseline and at exit. | |
| No weight change data presented. Researchers reported weights for regimens at baseline and at exit. | |
| No weight change data presented. Investigators reported an increase in weight as adverse event. | |
| Mean change in body mass index was reported, but no variance was provided. | |
| Trial of OCs as treatment for dysmenorrhea. | |
| Insufficient change data presented. Reported maximum weight gain per group rather than mean. | |
| No Ns given for analysis. Unable to obtain further information from investigator. | |
| Weight data provided for baseline only. Questionnaire asked about perception of weight change (scored 0 to 4). | |
| Weight data only provided for baseline. | |
| No change data presented. Researchers compared weights for groups at baseline and at exit. | |
| No change data presented. Researchers presented weights per group at baseline and at end of study. Sample sizes differed for baseline and end of study data. | |
| No change data presented. Researchers presented weights per group at admission and at end of study. No sample sizes provided per group. | |
| Researchers reported there was no significant change in weight. Data were not provided. | |
| Weight change not quantified, but reported as gained, lost or no change. | |
| Body mass index was used for stratifying; outcomes did not include weight or BMI change. | |
| No weight change data; investigators reported slight differences in weight increase between the groups. Data were not provided. Adverse events included percent reporting weight gain. | |
| Researchers reported there was no significant change in weight. Data were not provided. | |
| Researchers reported there was no significant change in BMI. Means were shown but not change data. |
Characteristics of ongoing studies [ordered by study ID]
| Trial name or title | Comparison of body weight change during contraception with Belara and Yasmin |
| Methods | Family Planning Unit, Mahidol University, Bangkok, Thailand RCT; blinding of subject, caregiver, investigator, outcome assessor |
| Participants | 100 women, 19 to 45 years old Inclusion criteria: reproductive age; BMI < 28.5 kg/m2; regular menstruation; no pelvic organ disorder; wants contraception with oral contraceptive pills. |
| Interventions | 2 mg chlormadinone acetate and 30 µg ethinyl estradiol versus 3 mg drospirenone and 30 µg ethinyl estradiol Duration: 6 cycles |
| Outcomes | Body weight change at 3 and 6 months of use |
| Starting date | Study start June 2012; estimated completion July 2014 |
| Contact information | no information |
| Notes |
Data and analyses
| Outcome or subgroup title | No. of studies | No. of participants | Statistical method | Effect size |
| 1 Gained >2.3 kg (cycle 4) Show forest plot | 1 | 113 | Peto Odds Ratio (Peto, Fixed, 95% CI) | 1.02 [0.46, 2.26] |
| Analysis 1.1  Comparison 1 Dimethisterone 25 mg and ethinyl estradiol (EE) 100 µg versus placebo, Outcome 1 Gained >2.3 kg (cycle 4). | ||||
| Outcome or subgroup title | No. of studies | No. of participants | Statistical method | Effect size |
| 1 Gained >2.3 kg (cycle 4) Show forest plot | 1 | 112 | Peto Odds Ratio (Peto, Fixed, 95% CI) | 0.57 [0.24, 1.33] |
| Analysis 2.1  Comparison 2 Ethynodiol diacetate 1 mg and mestranol 100 µg versus placebo, Outcome 1 Gained >2.3 kg (cycle 4). | ||||
| Outcome or subgroup title | No. of studies | No. of participants | Statistical method | Effect size |
| 1 Mean weight change in kg (cycle 6) Show forest plot | 1 | 473 | Mean Difference (IV, Fixed, 95% CI) | 0.30 [‐0.23, 0.83] |
| Analysis 3.1 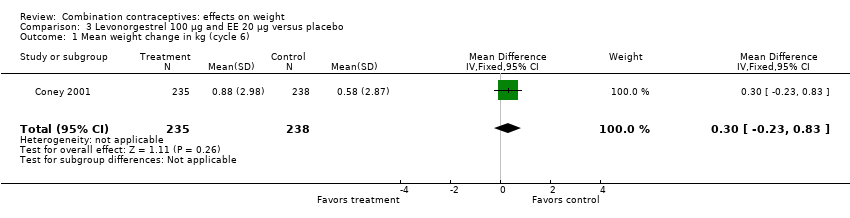 Comparison 3 Levonorgestrel 100 µg and EE 20 µg versus placebo, Outcome 1 Mean weight change in kg (cycle 6). | ||||
| Outcome or subgroup title | No. of studies | No. of participants | Statistical method | Effect size |
| 1 Mean weight change in kg per year Show forest plot | 1 | 150 | Mean Difference (IV, Fixed, 95% CI) | ‐0.54 [‐1.39, 0.31] |
| Analysis 4.1 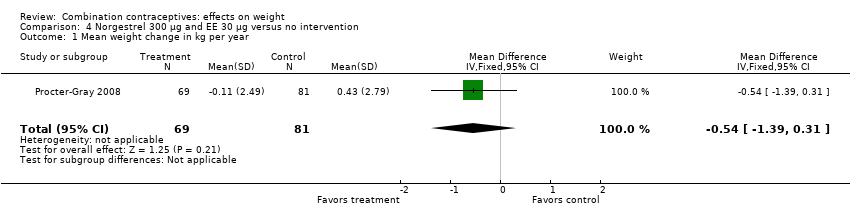 Comparison 4 Norgestrel 300 µg and EE 30 µg versus no intervention, Outcome 1 Mean weight change in kg per year. | ||||
| Outcome or subgroup title | No. of studies | No. of participants | Statistical method | Effect size |
| 1 Gained >2.3 kg (cycle 4) Show forest plot | 1 | 123 | Peto Odds Ratio (Peto, Fixed, 95% CI) | 0.50 [0.22, 1.17] |
| Analysis 5.1 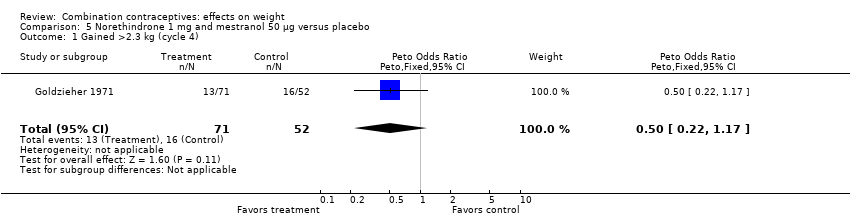 Comparison 5 Norethindrone 1 mg and mestranol 50 µg versus placebo, Outcome 1 Gained >2.3 kg (cycle 4). | ||||
| Outcome or subgroup title | No. of studies | No. of participants | Statistical method | Effect size |
| 1 Gained >5% baseline weight (cycle 9) Show forest plot | 1 | 136 | Peto Odds Ratio (Peto, Fixed, 95% CI) | 0.95 [0.30, 2.98] |
| Analysis 6.1  Comparison 6 Skin patch norelgestromin 150 µg and EE 20 µg versus placebo, Outcome 1 Gained >5% baseline weight (cycle 9). | ||||
| 2 Lost >5% baseline weight (cycle 9) Show forest plot | 1 | 136 | Peto Odds Ratio (Peto, Fixed, 95% CI) | 0.27 [0.04, 1.82] |
| Analysis 6.2 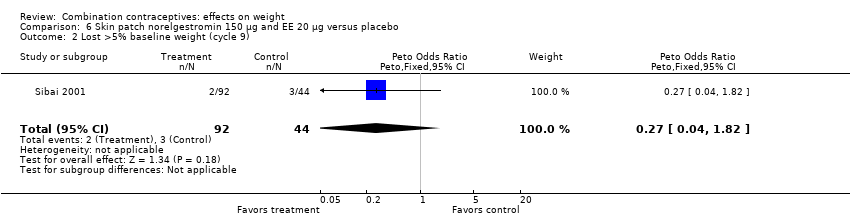 Comparison 6 Skin patch norelgestromin 150 µg and EE 20 µg versus placebo, Outcome 2 Lost >5% baseline weight (cycle 9). | ||||
| Outcome or subgroup title | No. of studies | No. of participants | Statistical method | Effect size |
| 1 Mean weight change (112 days or cycle 4) Show forest plot | 1 | 191 | Mean Difference (IV, Fixed, 95% CI) | ‐0.12 [‐0.79, 0.55] |
| Analysis 7.1  Comparison 7 Skin patch norelgestromin 150 µg and EE 20 µg: extended versus cyclic regimen, Outcome 1 Mean weight change (112 days or cycle 4). | ||||
| Outcome or subgroup title | No. of studies | No. of participants | Statistical method | Effect size |
| 1 Mean body mass percentage change (cycle 6) Show forest plot | 1 | 45 | Mean Difference (IV, Fixed, 95% CI) | 0.10 [‐1.54, 1.74] |
| Analysis 8.1  Comparison 8 Desogestrel 150 µg and EE 20 µg versus desogestrel 150 µg and EE 30 µg, Outcome 1 Mean body mass percentage change (cycle 6). | ||||
| Outcome or subgroup title | No. of studies | No. of participants | Statistical method | Effect size |
| 1 Gained >2 kg (cycle 6) Show forest plot | 1 | 801 | Peto Odds Ratio (Peto, Fixed, 95% CI) | 0.84 [0.58, 1.22] |
| Analysis 9.1  Comparison 9 Desogestrel 150 µg and EE 20 µg versus gestodene 75 µg and EE 20 µg, Outcome 1 Gained >2 kg (cycle 6). | ||||
| 2 Lost >2 kg (cycle 6) Show forest plot | 1 | 801 | Peto Odds Ratio (Peto, Fixed, 95% CI) | 1.65 [1.13, 2.41] |
| Analysis 9.2  Comparison 9 Desogestrel 150 µg and EE 20 µg versus gestodene 75 µg and EE 20 µg, Outcome 2 Lost >2 kg (cycle 6). | ||||
| 3 Gained >2 kg (cycle 12) Show forest plot | 1 | 1476 | Peto Odds Ratio (Peto, Fixed, 95% CI) | 1.13 [0.85, 1.49] |
| Analysis 9.3  Comparison 9 Desogestrel 150 µg and EE 20 µg versus gestodene 75 µg and EE 20 µg, Outcome 3 Gained >2 kg (cycle 12). | ||||
| 4 Lost >2 kg (cycle 12) Show forest plot | 1 | 1476 | Peto Odds Ratio (Peto, Fixed, 95% CI) | 0.95 [0.68, 1.33] |
| Analysis 9.4  Comparison 9 Desogestrel 150 µg and EE 20 µg versus gestodene 75 µg and EE 20 µg, Outcome 4 Lost >2 kg (cycle 12). | ||||
| Outcome or subgroup title | No. of studies | No. of participants | Statistical method | Effect size |
| 1 Mean body mass percentage change (cycle 6) Show forest plot | 1 | 42 | Mean Difference (IV, Fixed, 95% CI) | 0.60 [‐1.45, 2.65] |
| Analysis 10.1  Comparison 10 Desogestrel 150 µg and EE 20 µg versus norgestimate 250 µg and EE 35 µg, Outcome 1 Mean body mass percentage change (cycle 6). | ||||
| Outcome or subgroup title | No. of studies | No. of participants | Statistical method | Effect size |
| 1 Gained >2 kg (cycle 6) Show forest plot | 1 | 469 | Peto Odds Ratio (Peto, Fixed, 95% CI) | 3.29 [1.84, 5.88] |
| Analysis 11.1  Comparison 11 Desogestrel 150 µg and EE 30 µg versus levonorgestrel 50‐75‐125 µg and EE 30‐40‐30 µg, Outcome 1 Gained >2 kg (cycle 6). | ||||
| Outcome or subgroup title | No. of studies | No. of participants | Statistical method | Effect size |
| 1 Gained >2 kg (cycle 7) Show forest plot | 1 | 890 | Peto Odds Ratio (Peto, Fixed, 95% CI) | 1.20 [0.86, 1.68] |
| Analysis 12.1  Comparison 12 Standard desogestrel and EE regimen versus prolonged gestodene and EE regimen, Outcome 1 Gained >2 kg (cycle 7). | ||||
| Outcome or subgroup title | No. of studies | No. of participants | Statistical method | Effect size |
| 1 Mean weight change in kg (cycle 12) Show forest plot | 1 | 196 | Mean Difference (IV, Fixed, 95% CI) | 0.57 [‐0.42, 1.56] |
| Analysis 13.1  Comparison 13 Prolonged desogestrel and EE regimen versus standard desogestrel and EE regimen, Outcome 1 Mean weight change in kg (cycle 12). | ||||
| Outcome or subgroup title | No. of studies | No. of participants | Statistical method | Effect size |
| 1 Gained >5% baseline weight (cycle 3) Show forest plot | 1 | 49 | Peto Odds Ratio (Peto, Fixed, 95% CI) | 1.20 [0.32, 4.51] |
| Analysis 14.1  Comparison 14 Dienogest 2 mg, EE 10 µg and estradiol valerate 2 mg versus levonorgestrel 100 µg and EE 20 µg, Outcome 1 Gained >5% baseline weight (cycle 3). | ||||
| 2 Lost >5% baseline weight (cycle 3) Show forest plot | 1 | 49 | Peto Odds Ratio (Peto, Fixed, 95% CI) | 7.10 [0.14, 358.08] |
| Analysis 14.2  Comparison 14 Dienogest 2 mg, EE 10 µg and estradiol valerate 2 mg versus levonorgestrel 100 µg and EE 20 µg, Outcome 2 Lost >5% baseline weight (cycle 3). | ||||
| Outcome or subgroup title | No. of studies | No. of participants | Statistical method | Effect size |
| 1 Gained >5% baseline weight (cycle 3) Show forest plot | 1 | 49 | Peto Odds Ratio (Peto, Fixed, 95% CI) | 0.95 [0.24, 3.76] |
| Analysis 15.1  Comparison 15 Dienogest 2 mg and EE 20 µg versus levonorgestrel 100 µg and EE 20 µg, Outcome 1 Gained >5% baseline weight (cycle 3). | ||||
| 2 Lost >5% baseline weight (cycle 3) Show forest plot | 1 | 49 | Peto Odds Ratio (Peto, Fixed, 95% CI) | 7.40 [0.45, 121.93] |
| Analysis 15.2 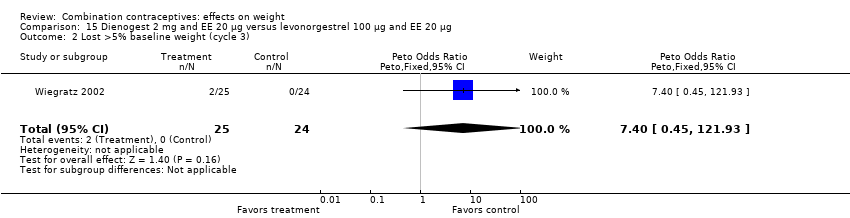 Comparison 15 Dienogest 2 mg and EE 20 µg versus levonorgestrel 100 µg and EE 20 µg, Outcome 2 Lost >5% baseline weight (cycle 3). | ||||
| Outcome or subgroup title | No. of studies | No. of participants | Statistical method | Effect size |
| 1 Gained >5% baseline weight (cycle 3) Show forest plot | 1 | 48 | Peto Odds Ratio (Peto, Fixed, 95% CI) | 0.77 [0.18, 3.21] |
| Analysis 16.1  Comparison 16 Dienogest 2 mg and EE 30 µg versus levonorgestrel 100 µg and EE 20 µg, Outcome 1 Gained >5% baseline weight (cycle 3). | ||||
| 2 Lost >5% baseline weight (cycle 3) Show forest plot | 1 | 48 | Peto Odds Ratio (Peto, Fixed, 95% CI) | 7.39 [0.15, 372.38] |
| Analysis 16.2 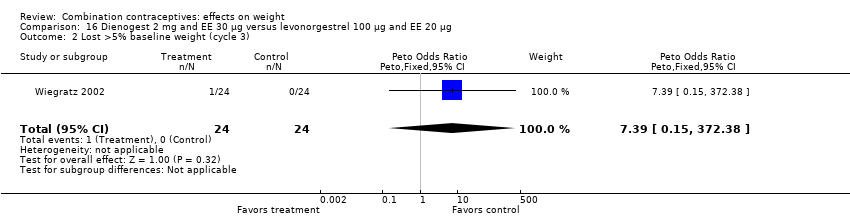 Comparison 16 Dienogest 2 mg and EE 30 µg versus levonorgestrel 100 µg and EE 20 µg, Outcome 2 Lost >5% baseline weight (cycle 3). | ||||
| Outcome or subgroup title | No. of studies | No. of participants | Statistical method | Effect size |
| 1 Mean weight change in kg (cycle 3) Show forest plot | 1 | 21 | Mean Difference (IV, Fixed, 95% CI) | 0.22 [‐1.30, 1.74] |
| Analysis 17.1 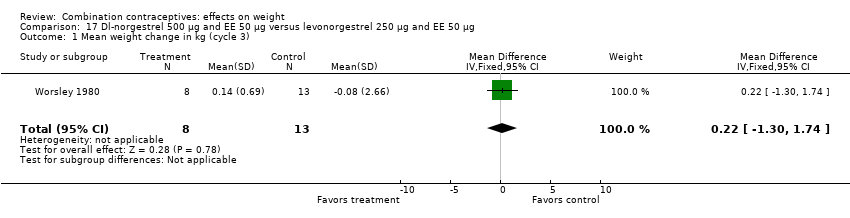 Comparison 17 Dl‐norgestrel 500 µg and EE 50 µg versus levonorgestrel 250 µg and EE 50 µg, Outcome 1 Mean weight change in kg (cycle 3). | ||||
| Outcome or subgroup title | No. of studies | No. of participants | Statistical method | Effect size |
| 1 Mean weight change in kg (cycle 3) Show forest plot | 1 | 16 | Mean Difference (IV, Fixed, 95% CI) | 1.14 [‐0.54, 2.82] |
| Analysis 18.1 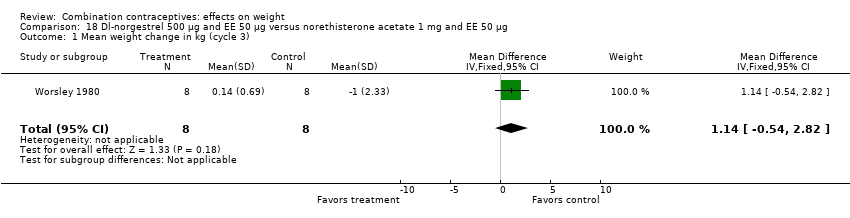 Comparison 18 Dl‐norgestrel 500 µg and EE 50 µg versus norethisterone acetate 1 mg and EE 50 µg, Outcome 1 Mean weight change in kg (cycle 3). | ||||
| Outcome or subgroup title | No. of studies | No. of participants | Statistical method | Effect size |
| 1 Gained >2 kg (cycle 3) Show forest plot | 2 | 112 | Peto Odds Ratio (Peto, Fixed, 95% CI) | 0.14 [0.00, 6.82] |
| Analysis 19.1 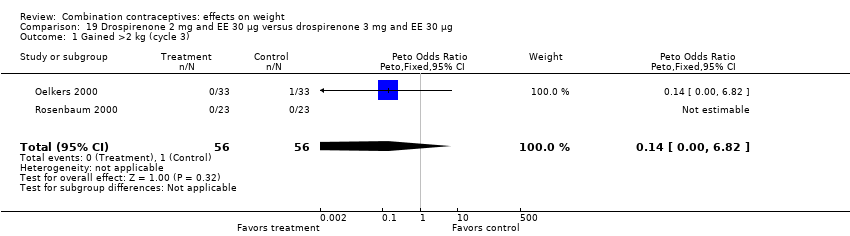 Comparison 19 Drospirenone 2 mg and EE 30 µg versus drospirenone 3 mg and EE 30 µg, Outcome 1 Gained >2 kg (cycle 3). | ||||
| 2 Lost >2 kg (cycle 3) Show forest plot | 1 | 66 | Peto Odds Ratio (Peto, Fixed, 95% CI) | 1.99 [0.20, 19.82] |
| Analysis 19.2 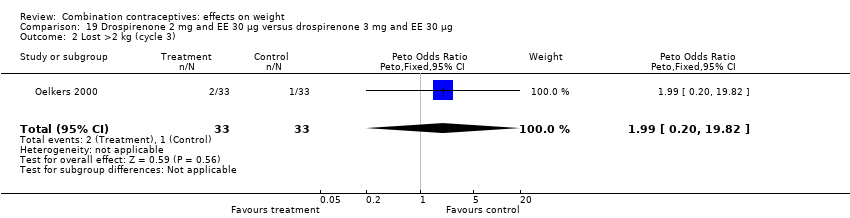 Comparison 19 Drospirenone 2 mg and EE 30 µg versus drospirenone 3 mg and EE 30 µg, Outcome 2 Lost >2 kg (cycle 3). | ||||
| Outcome or subgroup title | No. of studies | No. of participants | Statistical method | Effect size |
| 1 Gained >2 kg (cycle 6) Show forest plot | 1 | 40 | Peto Odds Ratio (Peto, Fixed, 95% CI) | 0.50 [0.05, 5.06] |
| Analysis 20.1  Comparison 20 Drospirenone 3 mg and EE 15 µg versus levonorgestrel 150 µg and EE 30 µg, Outcome 1 Gained >2 kg (cycle 6). | ||||
| 2 Lost >2 kg (cycle 6) Show forest plot | 1 | 40 | Peto Odds Ratio (Peto, Fixed, 95% CI) | 9.92 [1.79, 55.04] |
| Analysis 20.2  Comparison 20 Drospirenone 3 mg and EE 15 µg versus levonorgestrel 150 µg and EE 30 µg, Outcome 2 Lost >2 kg (cycle 6). | ||||
| Outcome or subgroup title | No. of studies | No. of participants | Statistical method | Effect size |
| 1 Gained >2 kg (cycle 6) Show forest plot | 1 | 40 | Peto Odds Ratio (Peto, Fixed, 95% CI) | 0.13 [0.01, 2.13] |
| Analysis 21.1  Comparison 21 Drospirenone 3 mg and EE 20 µg versus levonorgestrel 150 µg and EE 30 µg, Outcome 1 Gained >2 kg (cycle 6). | ||||
| 2 Lost >2 kg (cycle 6) Show forest plot | 1 | 40 | Peto Odds Ratio (Peto, Fixed, 95% CI) | 7.39 [0.15, 372.38] |
| Analysis 21.2 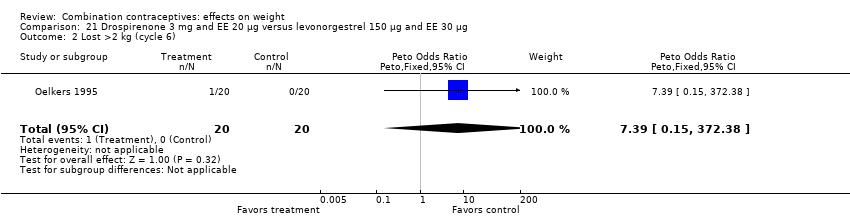 Comparison 21 Drospirenone 3 mg and EE 20 µg versus levonorgestrel 150 µg and EE 30 µg, Outcome 2 Lost >2 kg (cycle 6). | ||||
| Outcome or subgroup title | No. of studies | No. of participants | Statistical method | Effect size |
| 1 Gained >2 kg (cycle 13) Show forest plot | 1 | 56 | Peto Odds Ratio (Peto, Fixed, 95% CI) | 0.86 [0.29, 2.56] |
| Analysis 22.1  Comparison 22 Drospirenone 3 mg and EE 30 µg versus desogestrel 150 µg and EE 30 µg, Outcome 1 Gained >2 kg (cycle 13). | ||||
| 2 Lost >2 kg (cycle 13) Show forest plot | 1 | 56 | Peto Odds Ratio (Peto, Fixed, 95% CI) | 1.38 [0.29, 6.62] |
| Analysis 22.2 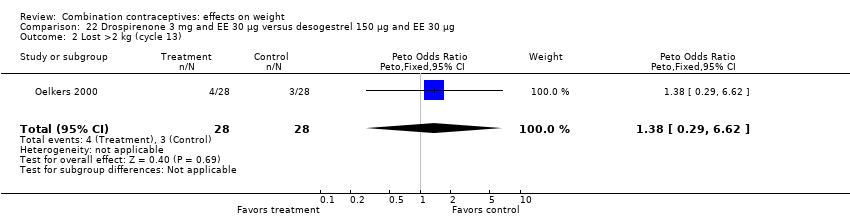 Comparison 22 Drospirenone 3 mg and EE 30 µg versus desogestrel 150 µg and EE 30 µg, Outcome 2 Lost >2 kg (cycle 13). | ||||
| Outcome or subgroup title | No. of studies | No. of participants | Statistical method | Effect size |
| 1 Mean weight change in kg (cycle 7) Show forest plot | 1 | 441 | Mean Difference (IV, Fixed, 95% CI) | ‐0.67 [‐1.16, ‐0.18] |
| Analysis 23.1  Comparison 23 Drospirenone 3 mg and EE 20 μg versus desogestrel 150 μg and EE 20 μg, Outcome 1 Mean weight change in kg (cycle 7). | ||||
| Outcome or subgroup title | No. of studies | No. of participants | Statistical method | Effect size |
| 1 Gained >2 kg (cycle 6) Show forest plot | 1 | 40 | Peto Odds Ratio (Peto, Fixed, 95% CI) | 0.13 [0.01, 2.13] |
| Analysis 24.1  Comparison 24 Drospirenone 3 mg and EE 30 µg versus levonorgestrel 150 µg and EE 30 µg, Outcome 1 Gained >2 kg (cycle 6). | ||||
| 2 Lost >2 kg (cycle 6) Show forest plot | 1 | 40 | Peto Odds Ratio (Peto, Fixed, 95% CI) | 7.39 [0.15, 372.38] |
| Analysis 24.2 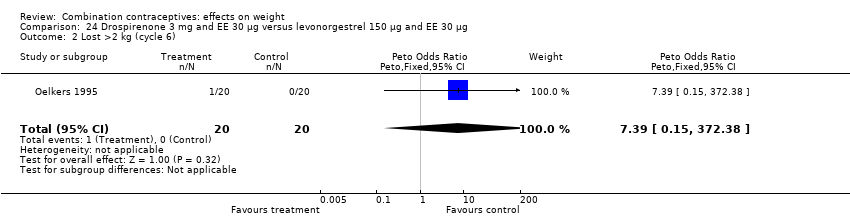 Comparison 24 Drospirenone 3 mg and EE 30 µg versus levonorgestrel 150 µg and EE 30 µg, Outcome 2 Lost >2 kg (cycle 6). | ||||
| Outcome or subgroup title | No. of studies | No. of participants | Statistical method | Effect size |
| 1 Mean weight change in kg (cycle 6) Show forest plot | 1 | 57 | Mean Difference (IV, Fixed, 95% CI) | 0.30 [‐1.43, 2.03] |
| Analysis 25.1 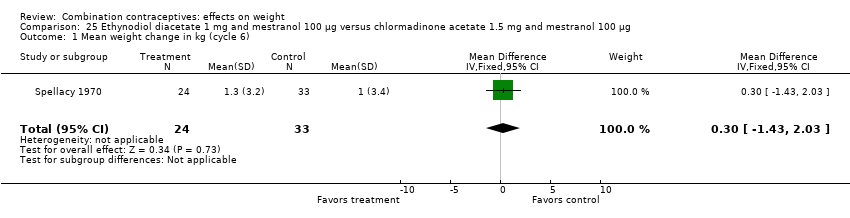 Comparison 25 Ethynodiol diacetate 1 mg and mestranol 100 µg versus chlormadinone acetate 1.5 mg and mestranol 100 µg, Outcome 1 Mean weight change in kg (cycle 6). | ||||
| Outcome or subgroup title | No. of studies | No. of participants | Statistical method | Effect size |
| 1 Gained >2 kg (cycle 6) Show forest plot | 1 | 39 | Peto Odds Ratio (Peto, Fixed, 95% CI) | 1.05 [0.06, 17.51] |
| Analysis 26.1  Comparison 26 Gestodene 75 µg and EE 20 µg versus gestodene 75 µg and EE 30 µg, Outcome 1 Gained >2 kg (cycle 6). | ||||
| 2 Lost >2 kg (cycle 6) Show forest plot | 1 | 39 | Peto Odds Ratio (Peto, Fixed, 95% CI) | 7.79 [0.15, 393.02] |
| Analysis 26.2  Comparison 26 Gestodene 75 µg and EE 20 µg versus gestodene 75 µg and EE 30 µg, Outcome 2 Lost >2 kg (cycle 6). | ||||
| 3 Gained >2 kg (cycle 12) Show forest plot | 1 | 452 | Peto Odds Ratio (Peto, Fixed, 95% CI) | 1.06 [0.63, 1.81] |
| Analysis 26.3  Comparison 26 Gestodene 75 µg and EE 20 µg versus gestodene 75 µg and EE 30 µg, Outcome 3 Gained >2 kg (cycle 12). | ||||
| 4 Lost >2 kg (cycle 12) Show forest plot | 1 | 452 | Peto Odds Ratio (Peto, Fixed, 95% CI) | 1.13 [0.63, 2.03] |
| Analysis 26.4  Comparison 26 Gestodene 75 µg and EE 20 µg versus gestodene 75 µg and EE 30 µg, Outcome 4 Lost >2 kg (cycle 12). | ||||
| 5 Gained >2 kg (cycle 13) Show forest plot | 1 | 40 | Peto Odds Ratio (Peto, Fixed, 95% CI) | 0.71 [0.14, 3.57] |
| Analysis 26.5 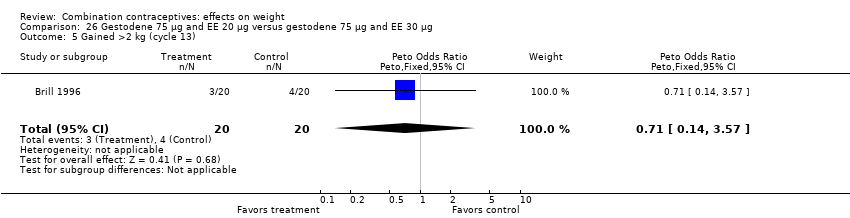 Comparison 26 Gestodene 75 µg and EE 20 µg versus gestodene 75 µg and EE 30 µg, Outcome 5 Gained >2 kg (cycle 13). | ||||
| 6 Lost >2 kg (cycle 13) Show forest plot | 1 | 40 | Peto Odds Ratio (Peto, Fixed, 95% CI) | 0.14 [0.00, 6.82] |
| Analysis 26.6  Comparison 26 Gestodene 75 µg and EE 20 µg versus gestodene 75 µg and EE 30 µg, Outcome 6 Lost >2 kg (cycle 13). | ||||
| Outcome or subgroup title | No. of studies | No. of participants | Statistical method | Effect size |
| 1 Mean body mass percentage change (cycle 6) Show forest plot | 1 | 43 | Mean Difference (IV, Fixed, 95% CI) | 0.7 [‐1.32, 2.72] |
| Analysis 27.1  Comparison 27 Gestodene 75 µg and EE 30 µg versus desogestrel 150 µg and EE 20 µg, Outcome 1 Mean body mass percentage change (cycle 6). | ||||
| 2 Mean weight change in kg (cycle 6) Show forest plot | 1 | 805 | Mean Difference (IV, Fixed, 95% CI) | 0.20 [0.00, 0.40] |
| Analysis 27.2  Comparison 27 Gestodene 75 µg and EE 30 µg versus desogestrel 150 µg and EE 20 µg, Outcome 2 Mean weight change in kg (cycle 6). | ||||
| 3 Mean weight change in kg (cycle 12) Show forest plot | 2 | 462 | Mean Difference (IV, Fixed, 95% CI) | 0.01 [‐0.50, 0.51] |
| Analysis 27.3 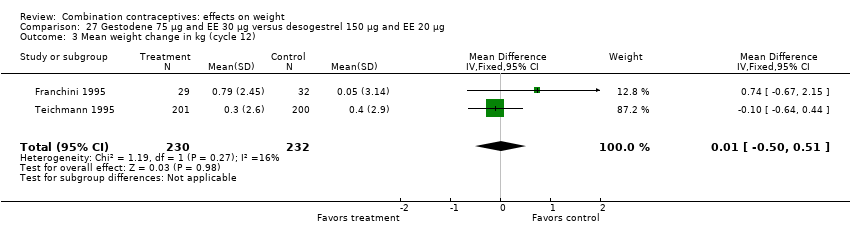 Comparison 27 Gestodene 75 µg and EE 30 µg versus desogestrel 150 µg and EE 20 µg, Outcome 3 Mean weight change in kg (cycle 12). | ||||
| Outcome or subgroup title | No. of studies | No. of participants | Statistical method | Effect size |
| 1 Gained >2 kg (cycle 6) Show forest plot | 3 | 1524 | Peto Odds Ratio (Peto, Fixed, 95% CI) | 1.18 [0.87, 1.60] |
| Analysis 28.1 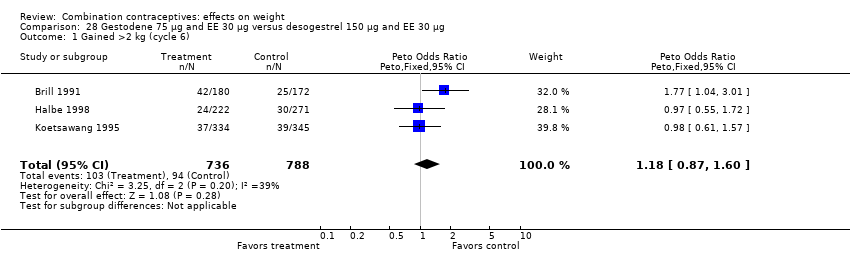 Comparison 28 Gestodene 75 µg and EE 30 µg versus desogestrel 150 µg and EE 30 µg, Outcome 1 Gained >2 kg (cycle 6). | ||||
| 2 Lost >2 kg ( cycle 6) Show forest plot | 2 | 1172 | Peto Odds Ratio (Peto, Fixed, 95% CI) | 1.34 [0.90, 2.00] |
| Analysis 28.2 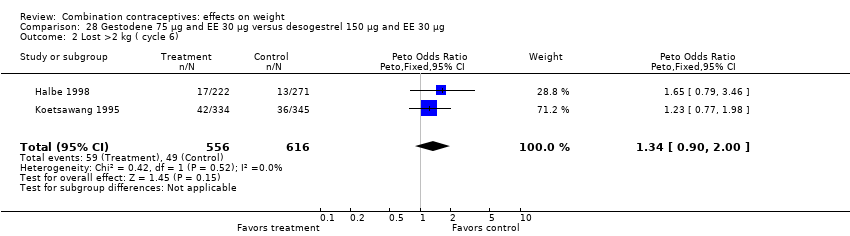 Comparison 28 Gestodene 75 µg and EE 30 µg versus desogestrel 150 µg and EE 30 µg, Outcome 2 Lost >2 kg ( cycle 6). | ||||
| 3 Mean body mass percentage change (cycle 6) Show forest plot | 1 | 46 | Mean Difference (IV, Fixed, 95% CI) | 0.8 [‐1.18, 2.78] |
| Analysis 28.3 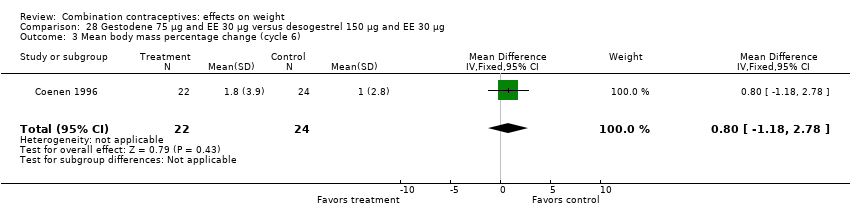 Comparison 28 Gestodene 75 µg and EE 30 µg versus desogestrel 150 µg and EE 30 µg, Outcome 3 Mean body mass percentage change (cycle 6). | ||||
| Outcome or subgroup title | No. of studies | No. of participants | Statistical method | Effect size |
| 1 Gained >2 kg (cycle 6) Show forest plot | 1 | 357 | Peto Odds Ratio (Peto, Fixed, 95% CI) | 1.54 [0.92, 2.60] |
| Analysis 29.1  Comparison 29 Gestodene 75 µg and EE 30 µg versus norgestimate 250 µg and EE 35 µg, Outcome 1 Gained >2 kg (cycle 6). | ||||
| 2 Mean body mass percentage change (cycle 6) Show forest plot | 1 | 43 | Mean Difference (IV, Fixed, 95% CI) | 1.3 [‐1.03, 3.63] |
| Analysis 29.2  Comparison 29 Gestodene 75 µg and EE 30 µg versus norgestimate 250 µg and EE 35 µg, Outcome 2 Mean body mass percentage change (cycle 6). | ||||
| Outcome or subgroup title | No. of studies | No. of participants | Statistical method | Effect size |
| 1 Mean weight change in kg (cycle 12) Show forest plot | 1 | 30 | Mean Difference (IV, Fixed, 95% CI) | 1.25 [‐1.22, 3.72] |
| Analysis 30.1  Comparison 30 Gestodene 50‐70‐100 µg and EE 30‐40‐30 µg versus desogestrel 150 µg and EE 30 µg, Outcome 1 Mean weight change in kg (cycle 12). | ||||
| Outcome or subgroup title | No. of studies | No. of participants | Statistical method | Effect size |
| 1 Mean weight change in kg (cycle 12) Show forest plot | 1 | 47 | Mean Difference (IV, Fixed, 95% CI) | ‐0.25 [‐1.09, 0.59] |
| Analysis 31.1  Comparison 31 Gestodene 50‐70‐100 µg and EE 30‐40‐30 µg versus norgestimate 250 µg and EE 35 µg, Outcome 1 Mean weight change in kg (cycle 12). | ||||
| Outcome or subgroup title | No. of studies | No. of participants | Statistical method | Effect size |
| 1 Mean weight change in kg (cycle 3) Show forest plot | 1 | 58 | Mean Difference (IV, Fixed, 95% CI) | 0.0 [‐1.23, 1.23] |
| Analysis 32.1 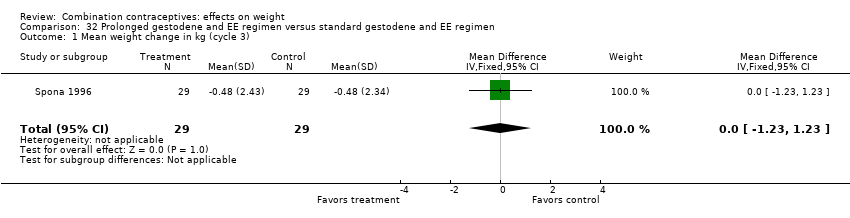 Comparison 32 Prolonged gestodene and EE regimen versus standard gestodene and EE regimen, Outcome 1 Mean weight change in kg (cycle 3). | ||||
| Outcome or subgroup title | No. of studies | No. of participants | Statistical method | Effect size |
| 1 Gained >2 kg (cycle 6) Show forest plot | 1 | 418 | Peto Odds Ratio (Peto, Fixed, 95% CI) | 1.26 [0.74, 2.15] |
| Analysis 33.1 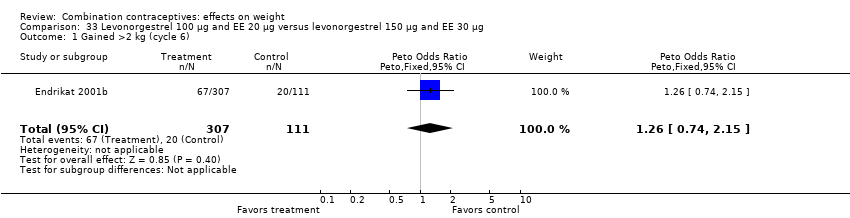 Comparison 33 Levonorgestrel 100 µg and EE 20 µg versus levonorgestrel 150 µg and EE 30 µg, Outcome 1 Gained >2 kg (cycle 6). | ||||
| 2 Lost >2 kg (cycle 6) Show forest plot | 1 | 418 | Peto Odds Ratio (Peto, Fixed, 95% CI) | 1.31 [0.70, 2.44] |
| Analysis 33.2  Comparison 33 Levonorgestrel 100 µg and EE 20 µg versus levonorgestrel 150 µg and EE 30 µg, Outcome 2 Lost >2 kg (cycle 6). | ||||
| Outcome or subgroup title | No. of studies | No. of participants | Statistical method | Effect size |
| 1 Gained >2.5 kg (cycle 24) Show forest plot | 1 | 17 | Peto Odds Ratio (Peto, Fixed, 95% CI) | 8.66 [0.77, 97.74] |
| Analysis 34.1  Comparison 34 Levonorgestrel 150 µg and EE 30 µg versus desogestrel 150 µg and EE 30 µg, Outcome 1 Gained >2.5 kg (cycle 24). | ||||
| 2 Lost >2.5 kg (cycle 24) Show forest plot | 1 | 17 | Peto Odds Ratio (Peto, Fixed, 95% CI) | 1.88 [0.17, 21.18] |
| Analysis 34.2  Comparison 34 Levonorgestrel 150 µg and EE 30 µg versus desogestrel 150 µg and EE 30 µg, Outcome 2 Lost >2.5 kg (cycle 24). | ||||
| Outcome or subgroup title | No. of studies | No. of participants | Statistical method | Effect size |
| 1 Mean weight change in kg (cycle 6) Show forest plot | 1 | 369 | Mean Difference (IV, Fixed, 95% CI) | 0.7 [0.14, 1.26] |
| Analysis 35.1  Comparison 35 Levonorgestrel 150 µg and EE 30 µg versus gestodene 75 µg and EE 30 µg, Outcome 1 Mean weight change in kg (cycle 6). | ||||
| Outcome or subgroup title | No. of studies | No. of participants | Statistical method | Effect size |
| 1 Gained >2.7 kg (cycle 6) Show forest plot | 1 | 109 | Peto Odds Ratio (Peto, Fixed, 95% CI) | 1.92 [0.74, 4.96] |
| Analysis 36.1 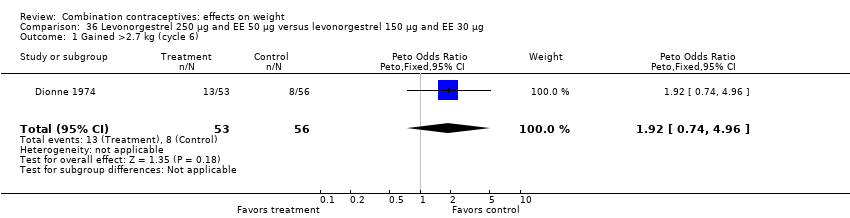 Comparison 36 Levonorgestrel 250 µg and EE 50 µg versus levonorgestrel 150 µg and EE 30 µg, Outcome 1 Gained >2.7 kg (cycle 6). | ||||
| Outcome or subgroup title | No. of studies | No. of participants | Statistical method | Effect size |
| 1 Mean weight change in kg (cycle 6) Show forest plot | 1 | 314 | Mean Difference (IV, Fixed, 95% CI) | ‐0.02 [‐0.06, 0.03] |
| Analysis 37.1  Comparison 37 Levonorgestrel 50‐75‐125 µg and EE 30‐40‐30 µg versus levonorgestrel 150 µg and EE 30 µg, Outcome 1 Mean weight change in kg (cycle 6). | ||||
| Outcome or subgroup title | No. of studies | No. of participants | Statistical method | Effect size |
| 1 Mean BMI change (cycle 6) Show forest plot | 1 | 57 | Mean Difference (IV, Fixed, 95% CI) | 0.35 [‐0.13, 0.83] |
| Analysis 38.1 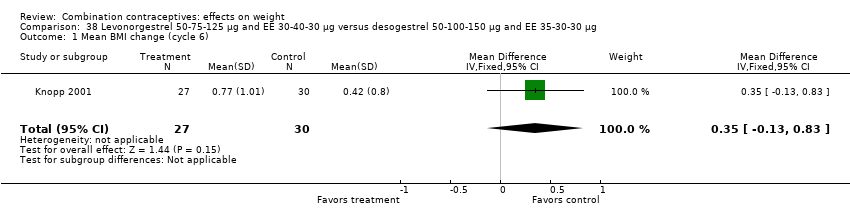 Comparison 38 Levonorgestrel 50‐75‐125 µg and EE 30‐40‐30 µg versus desogestrel 50‐100‐150 µg and EE 35‐30‐30 µg, Outcome 1 Mean BMI change (cycle 6). | ||||
| 2 Mean weight change in kg (cycle 6) Show forest plot | 1 | 31 | Mean Difference (IV, Fixed, 95% CI) | 1.30 [‐0.32, 2.92] |
| Analysis 38.2  Comparison 38 Levonorgestrel 50‐75‐125 µg and EE 30‐40‐30 µg versus desogestrel 50‐100‐150 µg and EE 35‐30‐30 µg, Outcome 2 Mean weight change in kg (cycle 6). | ||||
| Outcome or subgroup title | No. of studies | No. of participants | Statistical method | Effect size |
| 1 Mean weight change in kg (cycle 3) Show forest plot | 1 | 33 | Mean Difference (IV, Fixed, 95% CI) | 0.78 [‐0.28, 1.84] |
| Analysis 39.1  Comparison 39 Levonorgestrel 50‐75‐125 µg and EE 30‐40‐30 µg versus desogestrel 150 µg and EE 20 µg, Outcome 1 Mean weight change in kg (cycle 3). | ||||
| Outcome or subgroup title | No. of studies | No. of participants | Statistical method | Effect size |
| 1 Mean weight change in kg (cycle 3) Show forest plot | 1 | 21 | Mean Difference (IV, Fixed, 95% CI) | 0.92 [‐1.25, 3.09] |
| Analysis 40.1 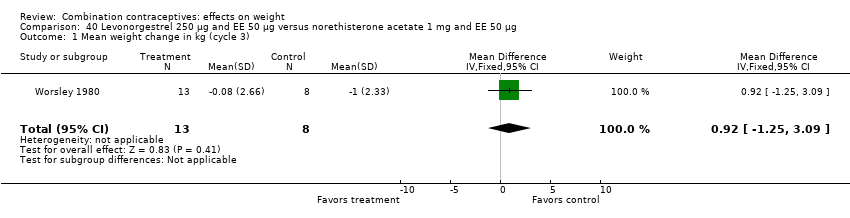 Comparison 40 Levonorgestrel 250 µg and EE 50 µg versus norethisterone acetate 1 mg and EE 50 µg, Outcome 1 Mean weight change in kg (cycle 3). | ||||
| Outcome or subgroup title | No. of studies | No. of participants | Statistical method | Effect size |
| 1 Mean weight change in kg (cycle 3) Show forest plot | 1 | 28 | Mean Difference (IV, Fixed, 95% CI) | 0.09 [‐1.15, 1.33] |
| Analysis 41.1  Comparison 41 Levonorgestrel and EE 6‐6‐9 day regimen versus levonorgestrel 6‐5‐10 day regimen, Outcome 1 Mean weight change in kg (cycle 3). | ||||
| Outcome or subgroup title | No. of studies | No. of participants | Statistical method | Effect size |
| 1 Gained >2.5 kg (cycle 12) Show forest plot | 1 | 228 | Peto Odds Ratio (Peto, Fixed, 95% CI) | 1.75 [0.98, 3.11] |
| Analysis 42.1  Comparison 42 Lynestrenol 2 mg and EE 40 µg versus lynestrenol 1 mg and EE 40 µg, Outcome 1 Gained >2.5 kg (cycle 12). | ||||
| 2 Lost >2.5 kg (cycle 12) Show forest plot | 1 | 228 | Peto Odds Ratio (Peto, Fixed, 95% CI) | 0.66 [0.25, 1.77] |
| Analysis 42.2  Comparison 42 Lynestrenol 2 mg and EE 40 µg versus lynestrenol 1 mg and EE 40 µg, Outcome 2 Lost >2.5 kg (cycle 12). | ||||
| Outcome or subgroup title | No. of studies | No. of participants | Statistical method | Effect size |
| 1 Mean weight change in kg (cycle 6) Show forest plot | 1 | 144 | Mean Difference (IV, Fixed, 95% CI) | 0.10 [‐0.70, 0.90] |
| Analysis 43.1  Comparison 43 Norethisterone 500‐1000 µg and EE 35 µg versus levonorgestrel 50‐75‐125 µg and EE 30‐40 µg, Outcome 1 Mean weight change in kg (cycle 6). | ||||
| Outcome or subgroup title | No. of studies | No. of participants | Statistical method | Effect size |
| 1 Gained >2 kg (cycle 6) Show forest plot | 1 | 349 | Peto Odds Ratio (Peto, Fixed, 95% CI) | 1.15 [0.65, 2.06] |
| Analysis 44.1 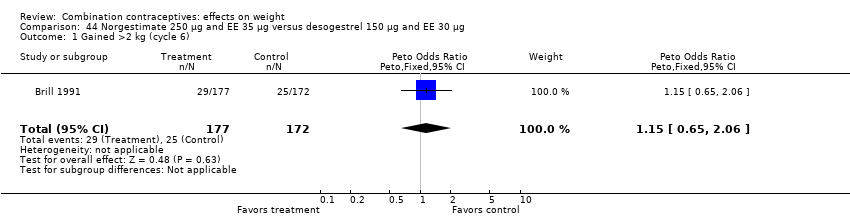 Comparison 44 Norgestimate 250 µg and EE 35 µg versus desogestrel 150 µg and EE 30 µg, Outcome 1 Gained >2 kg (cycle 6). | ||||
| 2 Mean body mass percentage change (cycle 6) Show forest plot | 1 | 45 | Mean Difference (IV, Fixed, 95% CI) | ‐0.5 [‐2.51, 1.51] |
| Analysis 44.2  Comparison 44 Norgestimate 250 µg and EE 35 µg versus desogestrel 150 µg and EE 30 µg, Outcome 2 Mean body mass percentage change (cycle 6). | ||||
| Outcome or subgroup title | No. of studies | No. of participants | Statistical method | Effect size |
| 1 Gained >2 kg (cycle 6) Show forest plot | 1 | 292 | Peto Odds Ratio (Peto, Fixed, 95% CI) | 1.09 [0.60, 1.99] |
| Analysis 45.1 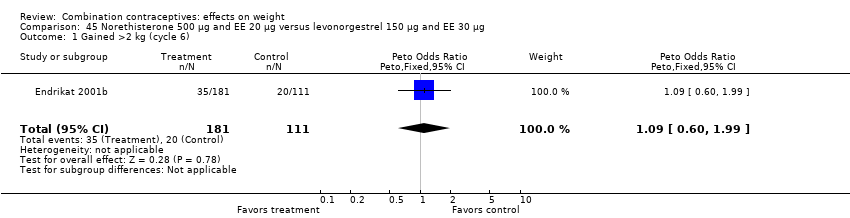 Comparison 45 Norethisterone 500 µg and EE 20 µg versus levonorgestrel 150 µg and EE 30 µg, Outcome 1 Gained >2 kg (cycle 6). | ||||
| 2 Lost >2 kg (cycle 6) Show forest plot | 1 | 292 | Peto Odds Ratio (Peto, Fixed, 95% CI) | 1.69 [0.89, 3.20] |
| Analysis 45.2  Comparison 45 Norethisterone 500 µg and EE 20 µg versus levonorgestrel 150 µg and EE 30 µg, Outcome 2 Lost >2 kg (cycle 6). | ||||
| Outcome or subgroup title | No. of studies | No. of participants | Statistical method | Effect size |
| 1 Mean weight change in kg (cycle 6) Show forest plot | 1 | 5328 | Mean Difference (IV, Fixed, 95% CI) | 0.26 [0.12, 0.40] |
| Analysis 46.1  Comparison 46 Norethindrone 500‐750‐1000 µg and EE 35 µg versus desogestrel 100‐125‐150 µg and EE 25 µg, Outcome 1 Mean weight change in kg (cycle 6). | ||||
| Outcome or subgroup title | No. of studies | No. of participants | Statistical method | Effect size |
| 1 Weight gain >=5% (cycle 6) Show forest plot | 1 | 2157 | Peto Odds Ratio (Peto, Fixed, 95% CI) | 1.15 [0.91, 1.45] |
| Analysis 47.1  Comparison 47 Norgestimate 180‐215‐250 µg and EE 25 µg versus norethindrone acetate 1 mg and EE 20 µg, Outcome 1 Weight gain >=5% (cycle 6). | ||||
| 2 Weight gain >=5% (cycle 13) Show forest plot | 1 | 453 | Peto Odds Ratio (Peto, Fixed, 95% CI) | 1.09 [0.69, 1.74] |
| Analysis 47.2  Comparison 47 Norgestimate 180‐215‐250 µg and EE 25 µg versus norethindrone acetate 1 mg and EE 20 µg, Outcome 2 Weight gain >=5% (cycle 13). | ||||
| 3 Weight loss >=5% (cycle 6) Show forest plot | 1 | 2157 | Peto Odds Ratio (Peto, Fixed, 95% CI) | 0.99 [0.72, 1.37] |
| Analysis 47.3 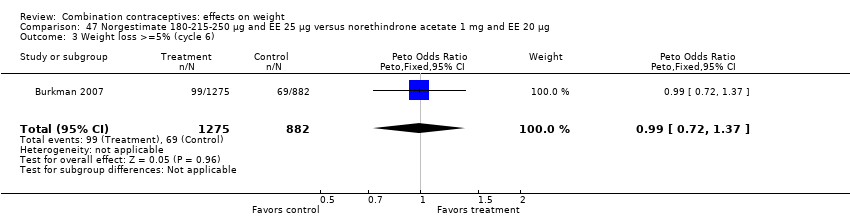 Comparison 47 Norgestimate 180‐215‐250 µg and EE 25 µg versus norethindrone acetate 1 mg and EE 20 µg, Outcome 3 Weight loss >=5% (cycle 6). | ||||
| 4 Weight loss >=5% (cycle 13) Show forest plot | 1 | 453 | Peto Odds Ratio (Peto, Fixed, 95% CI) | 1.32 [0.74, 2.34] |
| Analysis 47.4 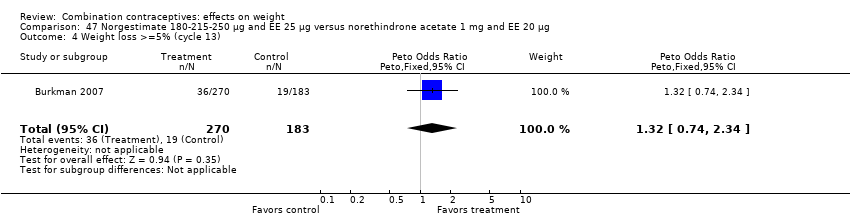 Comparison 47 Norgestimate 180‐215‐250 µg and EE 25 µg versus norethindrone acetate 1 mg and EE 20 µg, Outcome 4 Weight loss >=5% (cycle 13). | ||||
| Outcome or subgroup title | No. of studies | No. of participants | Statistical method | Effect size |
| 1 Mean weight change in kg (cycle 12) Show forest plot | 1 | 43 | Mean Difference (IV, Fixed, 95% CI) | 1.8 [‐0.73, 4.33] |
| Analysis 48.1  Comparison 48 Standard norgestrel and EE regimen versus prolonged norgestrel and EE regimen, Outcome 1 Mean weight change in kg (cycle 12). | ||||
| Outcome or subgroup title | No. of studies | No. of participants | Statistical method | Effect size |
| 1 Mean weight change in kg (cycle 12) Show forest plot | 1 | 3029 | Mean Difference (IV, Fixed, 95% CI) | 0.13 [‐0.04, 0.30] |
| Analysis 49.1  Comparison 49 Injectable medroxyprogesterone acetate 25 mg and EC 5 mg versus norethisterone enanthate 50 mg and EV 5 mg, Outcome 1 Mean weight change in kg (cycle 12). | ||||
| Outcome or subgroup title | No. of studies | No. of participants | Statistical method | Effect size |
| 1 Gain >2 kg (cycle 4) Show forest plot | 1 | 51 | Peto Odds Ratio (Peto, Fixed, 95% CI) | 0.69 [0.13, 3.58] |
| Analysis 50.1  Comparison 50 Vaginal ring with norethindrone acetate 1 mg and EE 15 µg versus norethindrone acetate 1 mg and EE 20 µg, Outcome 1 Gain >2 kg (cycle 4). | ||||
| 2 Lost >2 kg (cycle 4) Show forest plot | 1 | 51 | Peto Odds Ratio (Peto, Fixed, 95% CI) | 1.69 [0.35, 8.07] |
| Analysis 50.2 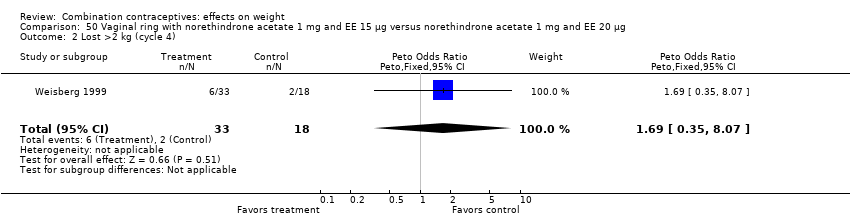 Comparison 50 Vaginal ring with norethindrone acetate 1 mg and EE 15 µg versus norethindrone acetate 1 mg and EE 20 µg, Outcome 2 Lost >2 kg (cycle 4). | ||||
| Outcome or subgroup title | No. of studies | No. of participants | Statistical method | Effect size |
| 1 Gain >=7% body weight (cycle 13) Show forest plot | 1 | 1030 | Peto Odds Ratio (Peto, Fixed, 95% CI) | 0.84 [0.55, 1.28] |
| Analysis 51.1  Comparison 51 Vaginal ring etonogestrel 120 µg and EE 15 µg versus levonorgestrel 150 µg and EE 30 µg, Outcome 1 Gain >=7% body weight (cycle 13). | ||||
| 2 Lost >=7% body weight (cycle 13) Show forest plot | 1 | 1030 | Peto Odds Ratio (Peto, Fixed, 95% CI) | 1.39 [0.83, 2.32] |
| Analysis 51.2  Comparison 51 Vaginal ring etonogestrel 120 µg and EE 15 µg versus levonorgestrel 150 µg and EE 30 µg, Outcome 2 Lost >=7% body weight (cycle 13). | ||||
| Outcome or subgroup title | No. of studies | No. of participants | Statistical method | Effect size |
| 1 Mean weight change in kg (cycle 13 or last assessment) Show forest plot | 1 | 937 | Mean Difference (IV, Fixed, 95% CI) | 0.4 [0.03, 0.77] |
| Analysis 52.1 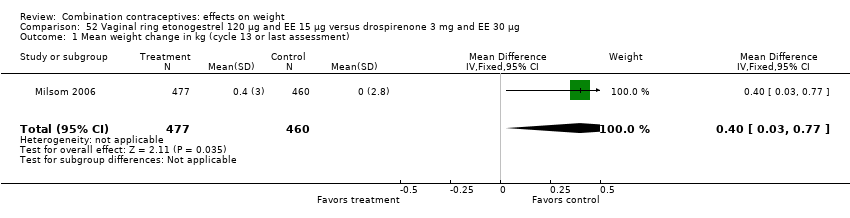 Comparison 52 Vaginal ring etonogestrel 120 µg and EE 15 µg versus drospirenone 3 mg and EE 30 µg, Outcome 1 Mean weight change in kg (cycle 13 or last assessment). | ||||
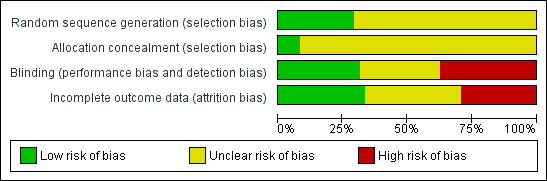
Risk of bias graph: review authors' judgements about each risk of bias item presented as percentages across all included studies.

Risk of bias summary: review authors' judgements about each risk of bias item for each included study.
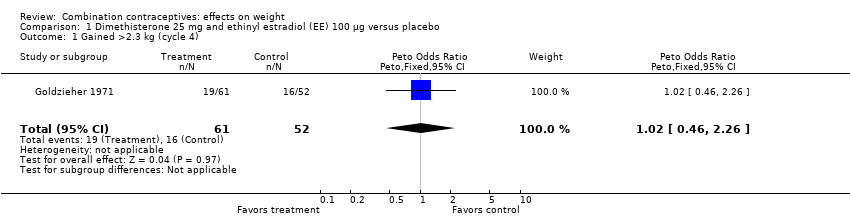
Comparison 1 Dimethisterone 25 mg and ethinyl estradiol (EE) 100 µg versus placebo, Outcome 1 Gained >2.3 kg (cycle 4).
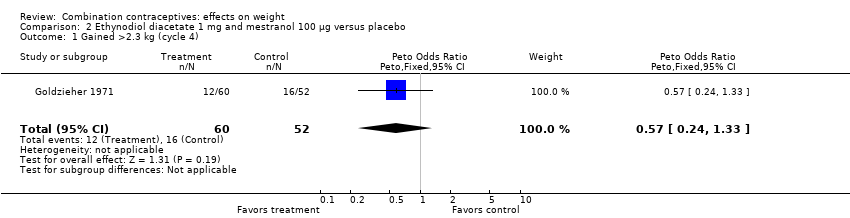
Comparison 2 Ethynodiol diacetate 1 mg and mestranol 100 µg versus placebo, Outcome 1 Gained >2.3 kg (cycle 4).

Comparison 3 Levonorgestrel 100 µg and EE 20 µg versus placebo, Outcome 1 Mean weight change in kg (cycle 6).

Comparison 4 Norgestrel 300 µg and EE 30 µg versus no intervention, Outcome 1 Mean weight change in kg per year.

Comparison 5 Norethindrone 1 mg and mestranol 50 µg versus placebo, Outcome 1 Gained >2.3 kg (cycle 4).
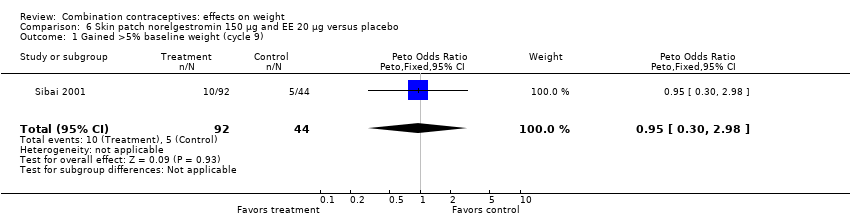
Comparison 6 Skin patch norelgestromin 150 µg and EE 20 µg versus placebo, Outcome 1 Gained >5% baseline weight (cycle 9).

Comparison 6 Skin patch norelgestromin 150 µg and EE 20 µg versus placebo, Outcome 2 Lost >5% baseline weight (cycle 9).
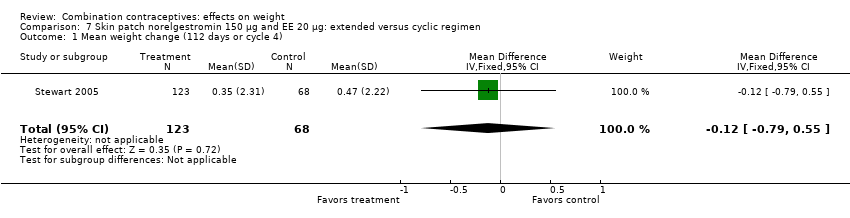
Comparison 7 Skin patch norelgestromin 150 µg and EE 20 µg: extended versus cyclic regimen, Outcome 1 Mean weight change (112 days or cycle 4).

Comparison 8 Desogestrel 150 µg and EE 20 µg versus desogestrel 150 µg and EE 30 µg, Outcome 1 Mean body mass percentage change (cycle 6).

Comparison 9 Desogestrel 150 µg and EE 20 µg versus gestodene 75 µg and EE 20 µg, Outcome 1 Gained >2 kg (cycle 6).

Comparison 9 Desogestrel 150 µg and EE 20 µg versus gestodene 75 µg and EE 20 µg, Outcome 2 Lost >2 kg (cycle 6).

Comparison 9 Desogestrel 150 µg and EE 20 µg versus gestodene 75 µg and EE 20 µg, Outcome 3 Gained >2 kg (cycle 12).
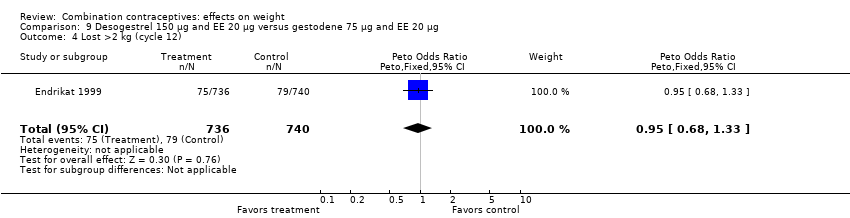
Comparison 9 Desogestrel 150 µg and EE 20 µg versus gestodene 75 µg and EE 20 µg, Outcome 4 Lost >2 kg (cycle 12).

Comparison 10 Desogestrel 150 µg and EE 20 µg versus norgestimate 250 µg and EE 35 µg, Outcome 1 Mean body mass percentage change (cycle 6).
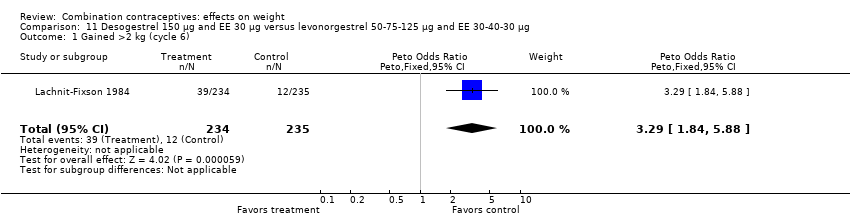
Comparison 11 Desogestrel 150 µg and EE 30 µg versus levonorgestrel 50‐75‐125 µg and EE 30‐40‐30 µg, Outcome 1 Gained >2 kg (cycle 6).

Comparison 12 Standard desogestrel and EE regimen versus prolonged gestodene and EE regimen, Outcome 1 Gained >2 kg (cycle 7).

Comparison 13 Prolonged desogestrel and EE regimen versus standard desogestrel and EE regimen, Outcome 1 Mean weight change in kg (cycle 12).

Comparison 14 Dienogest 2 mg, EE 10 µg and estradiol valerate 2 mg versus levonorgestrel 100 µg and EE 20 µg, Outcome 1 Gained >5% baseline weight (cycle 3).
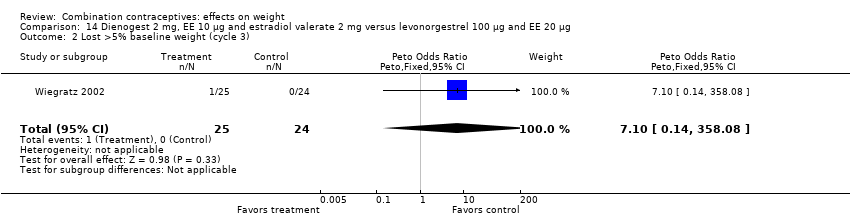
Comparison 14 Dienogest 2 mg, EE 10 µg and estradiol valerate 2 mg versus levonorgestrel 100 µg and EE 20 µg, Outcome 2 Lost >5% baseline weight (cycle 3).
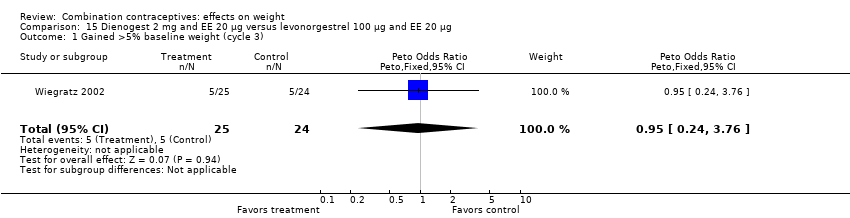
Comparison 15 Dienogest 2 mg and EE 20 µg versus levonorgestrel 100 µg and EE 20 µg, Outcome 1 Gained >5% baseline weight (cycle 3).

Comparison 15 Dienogest 2 mg and EE 20 µg versus levonorgestrel 100 µg and EE 20 µg, Outcome 2 Lost >5% baseline weight (cycle 3).

Comparison 16 Dienogest 2 mg and EE 30 µg versus levonorgestrel 100 µg and EE 20 µg, Outcome 1 Gained >5% baseline weight (cycle 3).

Comparison 16 Dienogest 2 mg and EE 30 µg versus levonorgestrel 100 µg and EE 20 µg, Outcome 2 Lost >5% baseline weight (cycle 3).

Comparison 17 Dl‐norgestrel 500 µg and EE 50 µg versus levonorgestrel 250 µg and EE 50 µg, Outcome 1 Mean weight change in kg (cycle 3).

Comparison 18 Dl‐norgestrel 500 µg and EE 50 µg versus norethisterone acetate 1 mg and EE 50 µg, Outcome 1 Mean weight change in kg (cycle 3).

Comparison 19 Drospirenone 2 mg and EE 30 µg versus drospirenone 3 mg and EE 30 µg, Outcome 1 Gained >2 kg (cycle 3).

Comparison 19 Drospirenone 2 mg and EE 30 µg versus drospirenone 3 mg and EE 30 µg, Outcome 2 Lost >2 kg (cycle 3).

Comparison 20 Drospirenone 3 mg and EE 15 µg versus levonorgestrel 150 µg and EE 30 µg, Outcome 1 Gained >2 kg (cycle 6).
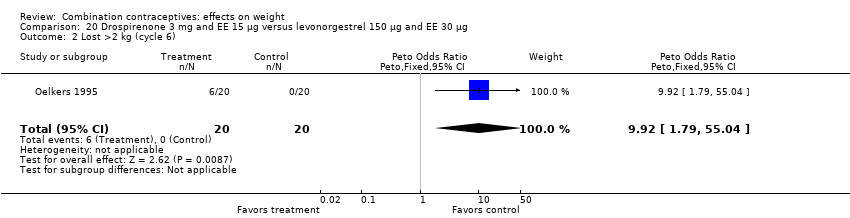
Comparison 20 Drospirenone 3 mg and EE 15 µg versus levonorgestrel 150 µg and EE 30 µg, Outcome 2 Lost >2 kg (cycle 6).

Comparison 21 Drospirenone 3 mg and EE 20 µg versus levonorgestrel 150 µg and EE 30 µg, Outcome 1 Gained >2 kg (cycle 6).

Comparison 21 Drospirenone 3 mg and EE 20 µg versus levonorgestrel 150 µg and EE 30 µg, Outcome 2 Lost >2 kg (cycle 6).

Comparison 22 Drospirenone 3 mg and EE 30 µg versus desogestrel 150 µg and EE 30 µg, Outcome 1 Gained >2 kg (cycle 13).

Comparison 22 Drospirenone 3 mg and EE 30 µg versus desogestrel 150 µg and EE 30 µg, Outcome 2 Lost >2 kg (cycle 13).

Comparison 23 Drospirenone 3 mg and EE 20 μg versus desogestrel 150 μg and EE 20 μg, Outcome 1 Mean weight change in kg (cycle 7).
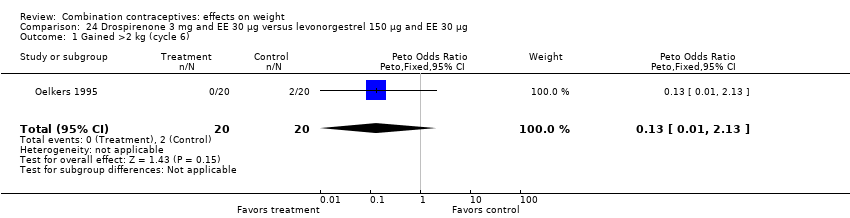
Comparison 24 Drospirenone 3 mg and EE 30 µg versus levonorgestrel 150 µg and EE 30 µg, Outcome 1 Gained >2 kg (cycle 6).

Comparison 24 Drospirenone 3 mg and EE 30 µg versus levonorgestrel 150 µg and EE 30 µg, Outcome 2 Lost >2 kg (cycle 6).

Comparison 25 Ethynodiol diacetate 1 mg and mestranol 100 µg versus chlormadinone acetate 1.5 mg and mestranol 100 µg, Outcome 1 Mean weight change in kg (cycle 6).
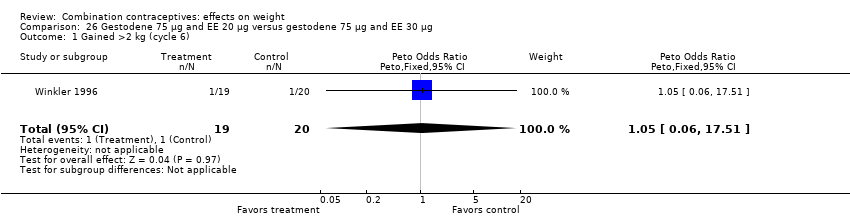
Comparison 26 Gestodene 75 µg and EE 20 µg versus gestodene 75 µg and EE 30 µg, Outcome 1 Gained >2 kg (cycle 6).

Comparison 26 Gestodene 75 µg and EE 20 µg versus gestodene 75 µg and EE 30 µg, Outcome 2 Lost >2 kg (cycle 6).
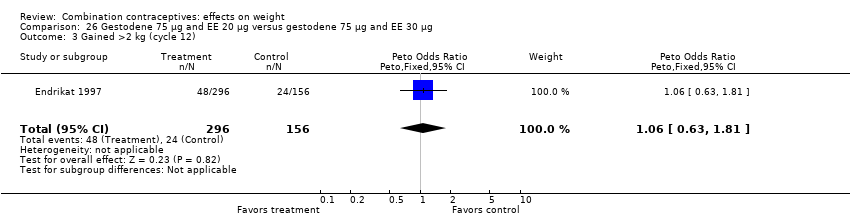
Comparison 26 Gestodene 75 µg and EE 20 µg versus gestodene 75 µg and EE 30 µg, Outcome 3 Gained >2 kg (cycle 12).
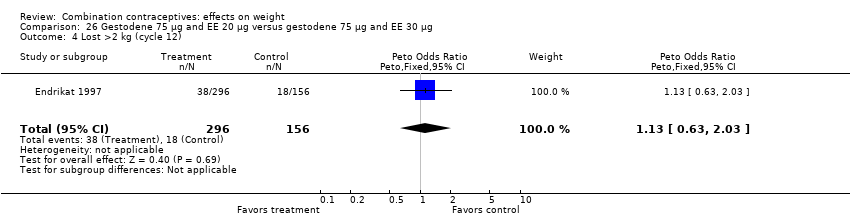
Comparison 26 Gestodene 75 µg and EE 20 µg versus gestodene 75 µg and EE 30 µg, Outcome 4 Lost >2 kg (cycle 12).

Comparison 26 Gestodene 75 µg and EE 20 µg versus gestodene 75 µg and EE 30 µg, Outcome 5 Gained >2 kg (cycle 13).
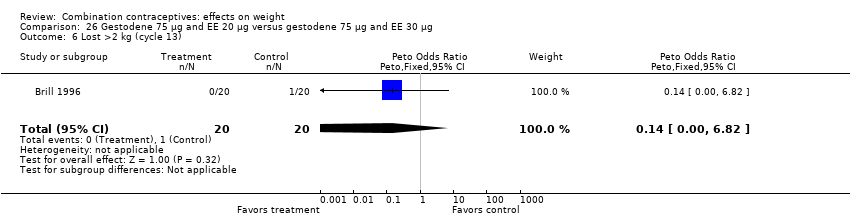
Comparison 26 Gestodene 75 µg and EE 20 µg versus gestodene 75 µg and EE 30 µg, Outcome 6 Lost >2 kg (cycle 13).
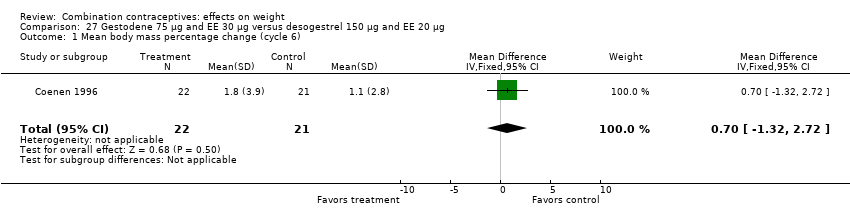
Comparison 27 Gestodene 75 µg and EE 30 µg versus desogestrel 150 µg and EE 20 µg, Outcome 1 Mean body mass percentage change (cycle 6).

Comparison 27 Gestodene 75 µg and EE 30 µg versus desogestrel 150 µg and EE 20 µg, Outcome 2 Mean weight change in kg (cycle 6).

Comparison 27 Gestodene 75 µg and EE 30 µg versus desogestrel 150 µg and EE 20 µg, Outcome 3 Mean weight change in kg (cycle 12).

Comparison 28 Gestodene 75 µg and EE 30 µg versus desogestrel 150 µg and EE 30 µg, Outcome 1 Gained >2 kg (cycle 6).

Comparison 28 Gestodene 75 µg and EE 30 µg versus desogestrel 150 µg and EE 30 µg, Outcome 2 Lost >2 kg ( cycle 6).

Comparison 28 Gestodene 75 µg and EE 30 µg versus desogestrel 150 µg and EE 30 µg, Outcome 3 Mean body mass percentage change (cycle 6).

Comparison 29 Gestodene 75 µg and EE 30 µg versus norgestimate 250 µg and EE 35 µg, Outcome 1 Gained >2 kg (cycle 6).

Comparison 29 Gestodene 75 µg and EE 30 µg versus norgestimate 250 µg and EE 35 µg, Outcome 2 Mean body mass percentage change (cycle 6).
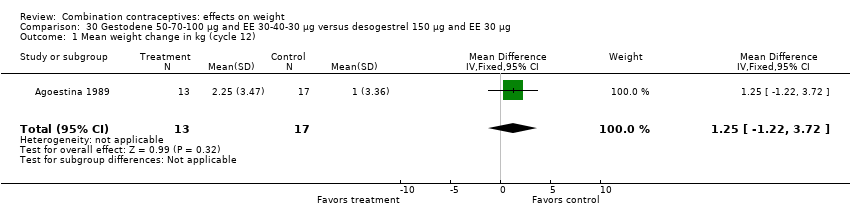
Comparison 30 Gestodene 50‐70‐100 µg and EE 30‐40‐30 µg versus desogestrel 150 µg and EE 30 µg, Outcome 1 Mean weight change in kg (cycle 12).

Comparison 31 Gestodene 50‐70‐100 µg and EE 30‐40‐30 µg versus norgestimate 250 µg and EE 35 µg, Outcome 1 Mean weight change in kg (cycle 12).

Comparison 32 Prolonged gestodene and EE regimen versus standard gestodene and EE regimen, Outcome 1 Mean weight change in kg (cycle 3).

Comparison 33 Levonorgestrel 100 µg and EE 20 µg versus levonorgestrel 150 µg and EE 30 µg, Outcome 1 Gained >2 kg (cycle 6).
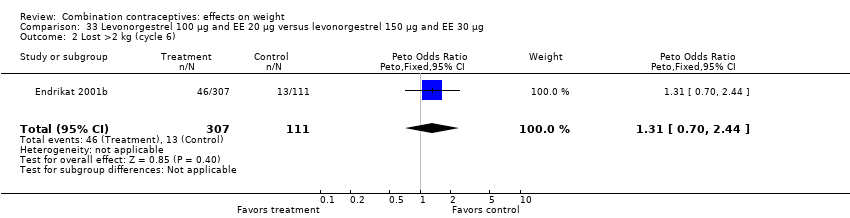
Comparison 33 Levonorgestrel 100 µg and EE 20 µg versus levonorgestrel 150 µg and EE 30 µg, Outcome 2 Lost >2 kg (cycle 6).
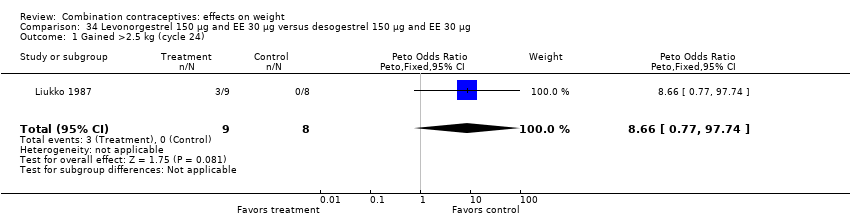
Comparison 34 Levonorgestrel 150 µg and EE 30 µg versus desogestrel 150 µg and EE 30 µg, Outcome 1 Gained >2.5 kg (cycle 24).
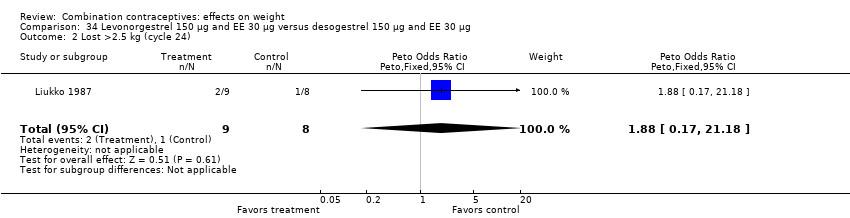
Comparison 34 Levonorgestrel 150 µg and EE 30 µg versus desogestrel 150 µg and EE 30 µg, Outcome 2 Lost >2.5 kg (cycle 24).
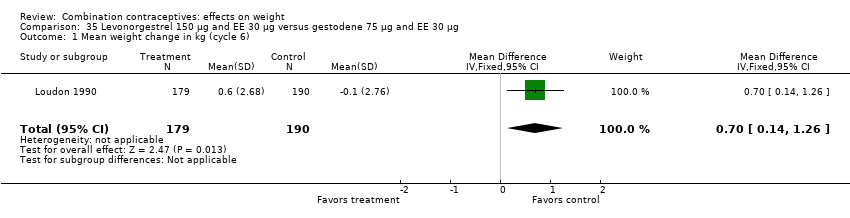
Comparison 35 Levonorgestrel 150 µg and EE 30 µg versus gestodene 75 µg and EE 30 µg, Outcome 1 Mean weight change in kg (cycle 6).

Comparison 36 Levonorgestrel 250 µg and EE 50 µg versus levonorgestrel 150 µg and EE 30 µg, Outcome 1 Gained >2.7 kg (cycle 6).
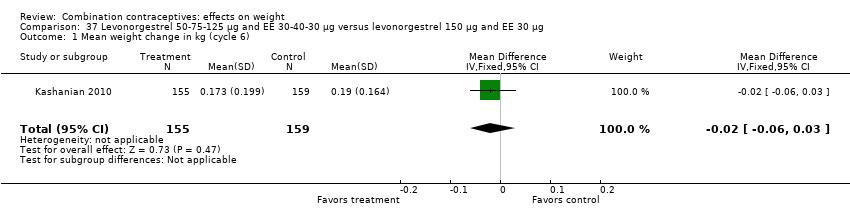
Comparison 37 Levonorgestrel 50‐75‐125 µg and EE 30‐40‐30 µg versus levonorgestrel 150 µg and EE 30 µg, Outcome 1 Mean weight change in kg (cycle 6).

Comparison 38 Levonorgestrel 50‐75‐125 µg and EE 30‐40‐30 µg versus desogestrel 50‐100‐150 µg and EE 35‐30‐30 µg, Outcome 1 Mean BMI change (cycle 6).

Comparison 38 Levonorgestrel 50‐75‐125 µg and EE 30‐40‐30 µg versus desogestrel 50‐100‐150 µg and EE 35‐30‐30 µg, Outcome 2 Mean weight change in kg (cycle 6).
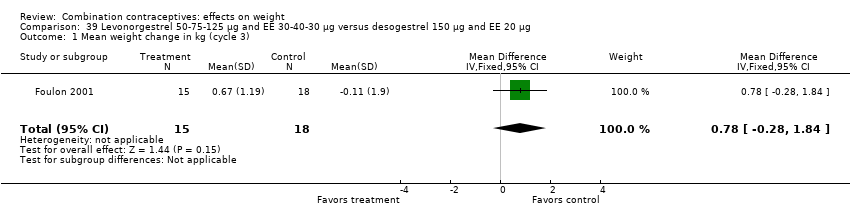
Comparison 39 Levonorgestrel 50‐75‐125 µg and EE 30‐40‐30 µg versus desogestrel 150 µg and EE 20 µg, Outcome 1 Mean weight change in kg (cycle 3).

Comparison 40 Levonorgestrel 250 µg and EE 50 µg versus norethisterone acetate 1 mg and EE 50 µg, Outcome 1 Mean weight change in kg (cycle 3).

Comparison 41 Levonorgestrel and EE 6‐6‐9 day regimen versus levonorgestrel 6‐5‐10 day regimen, Outcome 1 Mean weight change in kg (cycle 3).
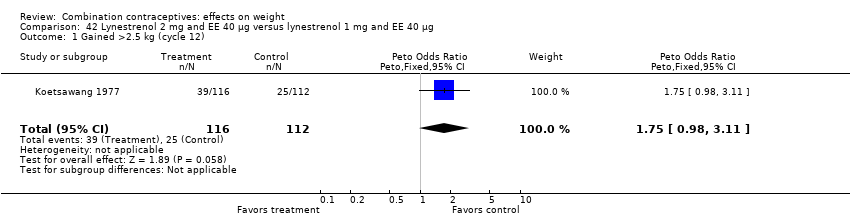
Comparison 42 Lynestrenol 2 mg and EE 40 µg versus lynestrenol 1 mg and EE 40 µg, Outcome 1 Gained >2.5 kg (cycle 12).

Comparison 42 Lynestrenol 2 mg and EE 40 µg versus lynestrenol 1 mg and EE 40 µg, Outcome 2 Lost >2.5 kg (cycle 12).
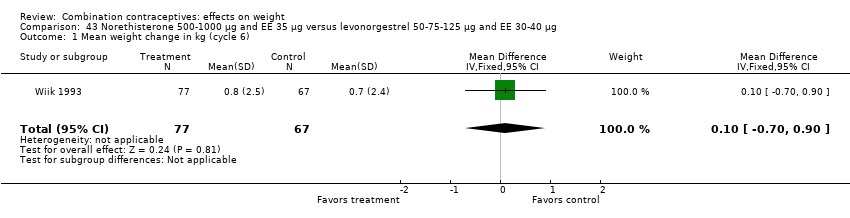
Comparison 43 Norethisterone 500‐1000 µg and EE 35 µg versus levonorgestrel 50‐75‐125 µg and EE 30‐40 µg, Outcome 1 Mean weight change in kg (cycle 6).

Comparison 44 Norgestimate 250 µg and EE 35 µg versus desogestrel 150 µg and EE 30 µg, Outcome 1 Gained >2 kg (cycle 6).
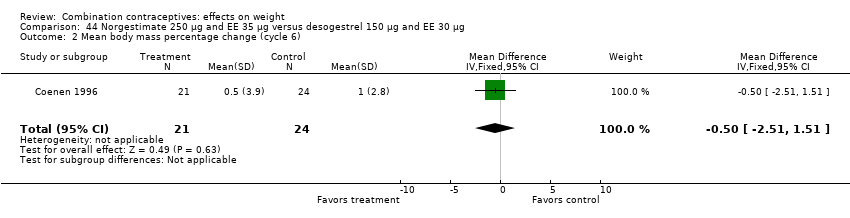
Comparison 44 Norgestimate 250 µg and EE 35 µg versus desogestrel 150 µg and EE 30 µg, Outcome 2 Mean body mass percentage change (cycle 6).

Comparison 45 Norethisterone 500 µg and EE 20 µg versus levonorgestrel 150 µg and EE 30 µg, Outcome 1 Gained >2 kg (cycle 6).

Comparison 45 Norethisterone 500 µg and EE 20 µg versus levonorgestrel 150 µg and EE 30 µg, Outcome 2 Lost >2 kg (cycle 6).
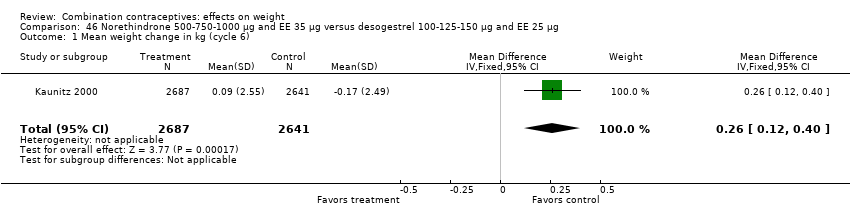
Comparison 46 Norethindrone 500‐750‐1000 µg and EE 35 µg versus desogestrel 100‐125‐150 µg and EE 25 µg, Outcome 1 Mean weight change in kg (cycle 6).
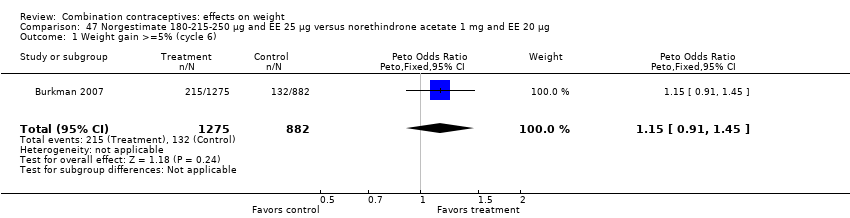
Comparison 47 Norgestimate 180‐215‐250 µg and EE 25 µg versus norethindrone acetate 1 mg and EE 20 µg, Outcome 1 Weight gain >=5% (cycle 6).

Comparison 47 Norgestimate 180‐215‐250 µg and EE 25 µg versus norethindrone acetate 1 mg and EE 20 µg, Outcome 2 Weight gain >=5% (cycle 13).

Comparison 47 Norgestimate 180‐215‐250 µg and EE 25 µg versus norethindrone acetate 1 mg and EE 20 µg, Outcome 3 Weight loss >=5% (cycle 6).

Comparison 47 Norgestimate 180‐215‐250 µg and EE 25 µg versus norethindrone acetate 1 mg and EE 20 µg, Outcome 4 Weight loss >=5% (cycle 13).

Comparison 48 Standard norgestrel and EE regimen versus prolonged norgestrel and EE regimen, Outcome 1 Mean weight change in kg (cycle 12).

Comparison 49 Injectable medroxyprogesterone acetate 25 mg and EC 5 mg versus norethisterone enanthate 50 mg and EV 5 mg, Outcome 1 Mean weight change in kg (cycle 12).
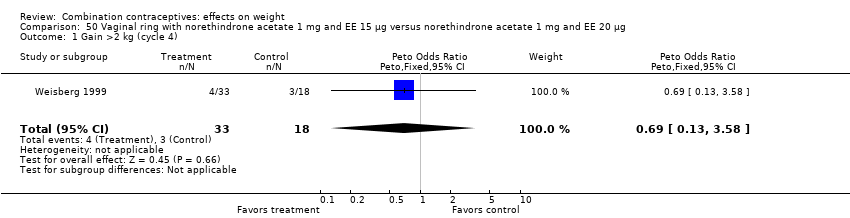
Comparison 50 Vaginal ring with norethindrone acetate 1 mg and EE 15 µg versus norethindrone acetate 1 mg and EE 20 µg, Outcome 1 Gain >2 kg (cycle 4).

Comparison 50 Vaginal ring with norethindrone acetate 1 mg and EE 15 µg versus norethindrone acetate 1 mg and EE 20 µg, Outcome 2 Lost >2 kg (cycle 4).

Comparison 51 Vaginal ring etonogestrel 120 µg and EE 15 µg versus levonorgestrel 150 µg and EE 30 µg, Outcome 1 Gain >=7% body weight (cycle 13).
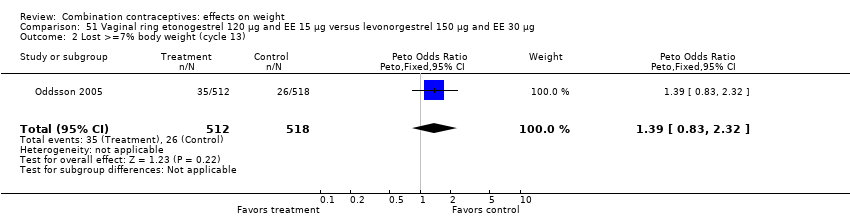
Comparison 51 Vaginal ring etonogestrel 120 µg and EE 15 µg versus levonorgestrel 150 µg and EE 30 µg, Outcome 2 Lost >=7% body weight (cycle 13).

Comparison 52 Vaginal ring etonogestrel 120 µg and EE 15 µg versus drospirenone 3 mg and EE 30 µg, Outcome 1 Mean weight change in kg (cycle 13 or last assessment).
| Study ID | Intervention group | n | N (randomized women) |
| Prolonged desogestrel / ethinyl estradiol (EE) regimen | 10 | 200 | |
| Standard desogestrel / EE regimen | 1 | 100 | |
| Norgestimate 250 μg / EE 35 μg | 1 | 25 | |
| Gestodene 75 μg / EE 30 μg | 0 | 25 | |
| Desogestrel 150 μg / EE 30 μg | 0 | 25 | |
| Desogestrel 150 μg / EE 20 μg | 0 | 25 | |
| Levonorgestrel 100 μg / EE 20 μg | 2 | 359 | |
| Placebo | 0 | 362 | |
| Levonorgestrel 250 μg / EE 50 μg | 3 | 73 | |
| Levonorgestrel 150 μg / EE 30 μg | 1 | 77 | |
| Gestodene 75 μg / EE 30 μg | 4 | 279 | |
| Desogestrel 150 μg / EE 30 μg | 0 | 316 | |
| Gestodene 75 μg / EE 30 μg | 4 | 505 | |
| Desogestrel 150 μg / EE 20 μg | 2 | 501 | |
| Standard norgestrel / EE regimen | 0 | 44 | |
| Prolonged norgestrel / EE regimen | 1 | 46 | |
| Vaginal ring etonogestrel 120 µg / EE 15 µg | 2 | 512 | |
| Levonorgestrel 150 µg / EE 30 µg | 6 | 518 | |
| Injectable medroxyprogesterone acetate 25 mg / estradiol cypionatge (EC) 5 mg | 14 | 1955 | |
| Injectable norethisterone enanthate 50 mg / estradiol valerate (EV) 5 mg | 10 | 1960 | |
| Norethisterone 500‐1000 μg / EE 35 μg | 3 | 100 | |
| Levonorgestrel 50‐75‐125 μg / EE 30‐40 μg | 1 | 96 |
| Outcome or subgroup title | No. of studies | No. of participants | Statistical method | Effect size |
| 1 Gained >2.3 kg (cycle 4) Show forest plot | 1 | 113 | Peto Odds Ratio (Peto, Fixed, 95% CI) | 1.02 [0.46, 2.26] |
| Outcome or subgroup title | No. of studies | No. of participants | Statistical method | Effect size |
| 1 Gained >2.3 kg (cycle 4) Show forest plot | 1 | 112 | Peto Odds Ratio (Peto, Fixed, 95% CI) | 0.57 [0.24, 1.33] |
| Outcome or subgroup title | No. of studies | No. of participants | Statistical method | Effect size |
| 1 Mean weight change in kg (cycle 6) Show forest plot | 1 | 473 | Mean Difference (IV, Fixed, 95% CI) | 0.30 [‐0.23, 0.83] |
| Outcome or subgroup title | No. of studies | No. of participants | Statistical method | Effect size |
| 1 Mean weight change in kg per year Show forest plot | 1 | 150 | Mean Difference (IV, Fixed, 95% CI) | ‐0.54 [‐1.39, 0.31] |
| Outcome or subgroup title | No. of studies | No. of participants | Statistical method | Effect size |
| 1 Gained >2.3 kg (cycle 4) Show forest plot | 1 | 123 | Peto Odds Ratio (Peto, Fixed, 95% CI) | 0.50 [0.22, 1.17] |
| Outcome or subgroup title | No. of studies | No. of participants | Statistical method | Effect size |
| 1 Gained >5% baseline weight (cycle 9) Show forest plot | 1 | 136 | Peto Odds Ratio (Peto, Fixed, 95% CI) | 0.95 [0.30, 2.98] |
| 2 Lost >5% baseline weight (cycle 9) Show forest plot | 1 | 136 | Peto Odds Ratio (Peto, Fixed, 95% CI) | 0.27 [0.04, 1.82] |
| Outcome or subgroup title | No. of studies | No. of participants | Statistical method | Effect size |
| 1 Mean weight change (112 days or cycle 4) Show forest plot | 1 | 191 | Mean Difference (IV, Fixed, 95% CI) | ‐0.12 [‐0.79, 0.55] |
| Outcome or subgroup title | No. of studies | No. of participants | Statistical method | Effect size |
| 1 Mean body mass percentage change (cycle 6) Show forest plot | 1 | 45 | Mean Difference (IV, Fixed, 95% CI) | 0.10 [‐1.54, 1.74] |
| Outcome or subgroup title | No. of studies | No. of participants | Statistical method | Effect size |
| 1 Gained >2 kg (cycle 6) Show forest plot | 1 | 801 | Peto Odds Ratio (Peto, Fixed, 95% CI) | 0.84 [0.58, 1.22] |
| 2 Lost >2 kg (cycle 6) Show forest plot | 1 | 801 | Peto Odds Ratio (Peto, Fixed, 95% CI) | 1.65 [1.13, 2.41] |
| 3 Gained >2 kg (cycle 12) Show forest plot | 1 | 1476 | Peto Odds Ratio (Peto, Fixed, 95% CI) | 1.13 [0.85, 1.49] |
| 4 Lost >2 kg (cycle 12) Show forest plot | 1 | 1476 | Peto Odds Ratio (Peto, Fixed, 95% CI) | 0.95 [0.68, 1.33] |
| Outcome or subgroup title | No. of studies | No. of participants | Statistical method | Effect size |
| 1 Mean body mass percentage change (cycle 6) Show forest plot | 1 | 42 | Mean Difference (IV, Fixed, 95% CI) | 0.60 [‐1.45, 2.65] |
| Outcome or subgroup title | No. of studies | No. of participants | Statistical method | Effect size |
| 1 Gained >2 kg (cycle 6) Show forest plot | 1 | 469 | Peto Odds Ratio (Peto, Fixed, 95% CI) | 3.29 [1.84, 5.88] |
| Outcome or subgroup title | No. of studies | No. of participants | Statistical method | Effect size |
| 1 Gained >2 kg (cycle 7) Show forest plot | 1 | 890 | Peto Odds Ratio (Peto, Fixed, 95% CI) | 1.20 [0.86, 1.68] |
| Outcome or subgroup title | No. of studies | No. of participants | Statistical method | Effect size |
| 1 Mean weight change in kg (cycle 12) Show forest plot | 1 | 196 | Mean Difference (IV, Fixed, 95% CI) | 0.57 [‐0.42, 1.56] |
| Outcome or subgroup title | No. of studies | No. of participants | Statistical method | Effect size |
| 1 Gained >5% baseline weight (cycle 3) Show forest plot | 1 | 49 | Peto Odds Ratio (Peto, Fixed, 95% CI) | 1.20 [0.32, 4.51] |
| 2 Lost >5% baseline weight (cycle 3) Show forest plot | 1 | 49 | Peto Odds Ratio (Peto, Fixed, 95% CI) | 7.10 [0.14, 358.08] |
| Outcome or subgroup title | No. of studies | No. of participants | Statistical method | Effect size |
| 1 Gained >5% baseline weight (cycle 3) Show forest plot | 1 | 49 | Peto Odds Ratio (Peto, Fixed, 95% CI) | 0.95 [0.24, 3.76] |
| 2 Lost >5% baseline weight (cycle 3) Show forest plot | 1 | 49 | Peto Odds Ratio (Peto, Fixed, 95% CI) | 7.40 [0.45, 121.93] |
| Outcome or subgroup title | No. of studies | No. of participants | Statistical method | Effect size |
| 1 Gained >5% baseline weight (cycle 3) Show forest plot | 1 | 48 | Peto Odds Ratio (Peto, Fixed, 95% CI) | 0.77 [0.18, 3.21] |
| 2 Lost >5% baseline weight (cycle 3) Show forest plot | 1 | 48 | Peto Odds Ratio (Peto, Fixed, 95% CI) | 7.39 [0.15, 372.38] |
| Outcome or subgroup title | No. of studies | No. of participants | Statistical method | Effect size |
| 1 Mean weight change in kg (cycle 3) Show forest plot | 1 | 21 | Mean Difference (IV, Fixed, 95% CI) | 0.22 [‐1.30, 1.74] |
| Outcome or subgroup title | No. of studies | No. of participants | Statistical method | Effect size |
| 1 Mean weight change in kg (cycle 3) Show forest plot | 1 | 16 | Mean Difference (IV, Fixed, 95% CI) | 1.14 [‐0.54, 2.82] |
| Outcome or subgroup title | No. of studies | No. of participants | Statistical method | Effect size |
| 1 Gained >2 kg (cycle 3) Show forest plot | 2 | 112 | Peto Odds Ratio (Peto, Fixed, 95% CI) | 0.14 [0.00, 6.82] |
| 2 Lost >2 kg (cycle 3) Show forest plot | 1 | 66 | Peto Odds Ratio (Peto, Fixed, 95% CI) | 1.99 [0.20, 19.82] |
| Outcome or subgroup title | No. of studies | No. of participants | Statistical method | Effect size |
| 1 Gained >2 kg (cycle 6) Show forest plot | 1 | 40 | Peto Odds Ratio (Peto, Fixed, 95% CI) | 0.50 [0.05, 5.06] |
| 2 Lost >2 kg (cycle 6) Show forest plot | 1 | 40 | Peto Odds Ratio (Peto, Fixed, 95% CI) | 9.92 [1.79, 55.04] |
| Outcome or subgroup title | No. of studies | No. of participants | Statistical method | Effect size |
| 1 Gained >2 kg (cycle 6) Show forest plot | 1 | 40 | Peto Odds Ratio (Peto, Fixed, 95% CI) | 0.13 [0.01, 2.13] |
| 2 Lost >2 kg (cycle 6) Show forest plot | 1 | 40 | Peto Odds Ratio (Peto, Fixed, 95% CI) | 7.39 [0.15, 372.38] |
| Outcome or subgroup title | No. of studies | No. of participants | Statistical method | Effect size |
| 1 Gained >2 kg (cycle 13) Show forest plot | 1 | 56 | Peto Odds Ratio (Peto, Fixed, 95% CI) | 0.86 [0.29, 2.56] |
| 2 Lost >2 kg (cycle 13) Show forest plot | 1 | 56 | Peto Odds Ratio (Peto, Fixed, 95% CI) | 1.38 [0.29, 6.62] |
| Outcome or subgroup title | No. of studies | No. of participants | Statistical method | Effect size |
| 1 Mean weight change in kg (cycle 7) Show forest plot | 1 | 441 | Mean Difference (IV, Fixed, 95% CI) | ‐0.67 [‐1.16, ‐0.18] |
| Outcome or subgroup title | No. of studies | No. of participants | Statistical method | Effect size |
| 1 Gained >2 kg (cycle 6) Show forest plot | 1 | 40 | Peto Odds Ratio (Peto, Fixed, 95% CI) | 0.13 [0.01, 2.13] |
| 2 Lost >2 kg (cycle 6) Show forest plot | 1 | 40 | Peto Odds Ratio (Peto, Fixed, 95% CI) | 7.39 [0.15, 372.38] |
| Outcome or subgroup title | No. of studies | No. of participants | Statistical method | Effect size |
| 1 Mean weight change in kg (cycle 6) Show forest plot | 1 | 57 | Mean Difference (IV, Fixed, 95% CI) | 0.30 [‐1.43, 2.03] |
| Outcome or subgroup title | No. of studies | No. of participants | Statistical method | Effect size |
| 1 Gained >2 kg (cycle 6) Show forest plot | 1 | 39 | Peto Odds Ratio (Peto, Fixed, 95% CI) | 1.05 [0.06, 17.51] |
| 2 Lost >2 kg (cycle 6) Show forest plot | 1 | 39 | Peto Odds Ratio (Peto, Fixed, 95% CI) | 7.79 [0.15, 393.02] |
| 3 Gained >2 kg (cycle 12) Show forest plot | 1 | 452 | Peto Odds Ratio (Peto, Fixed, 95% CI) | 1.06 [0.63, 1.81] |
| 4 Lost >2 kg (cycle 12) Show forest plot | 1 | 452 | Peto Odds Ratio (Peto, Fixed, 95% CI) | 1.13 [0.63, 2.03] |
| 5 Gained >2 kg (cycle 13) Show forest plot | 1 | 40 | Peto Odds Ratio (Peto, Fixed, 95% CI) | 0.71 [0.14, 3.57] |
| 6 Lost >2 kg (cycle 13) Show forest plot | 1 | 40 | Peto Odds Ratio (Peto, Fixed, 95% CI) | 0.14 [0.00, 6.82] |
| Outcome or subgroup title | No. of studies | No. of participants | Statistical method | Effect size |
| 1 Mean body mass percentage change (cycle 6) Show forest plot | 1 | 43 | Mean Difference (IV, Fixed, 95% CI) | 0.7 [‐1.32, 2.72] |
| 2 Mean weight change in kg (cycle 6) Show forest plot | 1 | 805 | Mean Difference (IV, Fixed, 95% CI) | 0.20 [0.00, 0.40] |
| 3 Mean weight change in kg (cycle 12) Show forest plot | 2 | 462 | Mean Difference (IV, Fixed, 95% CI) | 0.01 [‐0.50, 0.51] |
| Outcome or subgroup title | No. of studies | No. of participants | Statistical method | Effect size |
| 1 Gained >2 kg (cycle 6) Show forest plot | 3 | 1524 | Peto Odds Ratio (Peto, Fixed, 95% CI) | 1.18 [0.87, 1.60] |
| 2 Lost >2 kg ( cycle 6) Show forest plot | 2 | 1172 | Peto Odds Ratio (Peto, Fixed, 95% CI) | 1.34 [0.90, 2.00] |
| 3 Mean body mass percentage change (cycle 6) Show forest plot | 1 | 46 | Mean Difference (IV, Fixed, 95% CI) | 0.8 [‐1.18, 2.78] |
| Outcome or subgroup title | No. of studies | No. of participants | Statistical method | Effect size |
| 1 Gained >2 kg (cycle 6) Show forest plot | 1 | 357 | Peto Odds Ratio (Peto, Fixed, 95% CI) | 1.54 [0.92, 2.60] |
| 2 Mean body mass percentage change (cycle 6) Show forest plot | 1 | 43 | Mean Difference (IV, Fixed, 95% CI) | 1.3 [‐1.03, 3.63] |
| Outcome or subgroup title | No. of studies | No. of participants | Statistical method | Effect size |
| 1 Mean weight change in kg (cycle 12) Show forest plot | 1 | 30 | Mean Difference (IV, Fixed, 95% CI) | 1.25 [‐1.22, 3.72] |
| Outcome or subgroup title | No. of studies | No. of participants | Statistical method | Effect size |
| 1 Mean weight change in kg (cycle 12) Show forest plot | 1 | 47 | Mean Difference (IV, Fixed, 95% CI) | ‐0.25 [‐1.09, 0.59] |
| Outcome or subgroup title | No. of studies | No. of participants | Statistical method | Effect size |
| 1 Mean weight change in kg (cycle 3) Show forest plot | 1 | 58 | Mean Difference (IV, Fixed, 95% CI) | 0.0 [‐1.23, 1.23] |
| Outcome or subgroup title | No. of studies | No. of participants | Statistical method | Effect size |
| 1 Gained >2 kg (cycle 6) Show forest plot | 1 | 418 | Peto Odds Ratio (Peto, Fixed, 95% CI) | 1.26 [0.74, 2.15] |
| 2 Lost >2 kg (cycle 6) Show forest plot | 1 | 418 | Peto Odds Ratio (Peto, Fixed, 95% CI) | 1.31 [0.70, 2.44] |
| Outcome or subgroup title | No. of studies | No. of participants | Statistical method | Effect size |
| 1 Gained >2.5 kg (cycle 24) Show forest plot | 1 | 17 | Peto Odds Ratio (Peto, Fixed, 95% CI) | 8.66 [0.77, 97.74] |
| 2 Lost >2.5 kg (cycle 24) Show forest plot | 1 | 17 | Peto Odds Ratio (Peto, Fixed, 95% CI) | 1.88 [0.17, 21.18] |
| Outcome or subgroup title | No. of studies | No. of participants | Statistical method | Effect size |
| 1 Mean weight change in kg (cycle 6) Show forest plot | 1 | 369 | Mean Difference (IV, Fixed, 95% CI) | 0.7 [0.14, 1.26] |
| Outcome or subgroup title | No. of studies | No. of participants | Statistical method | Effect size |
| 1 Gained >2.7 kg (cycle 6) Show forest plot | 1 | 109 | Peto Odds Ratio (Peto, Fixed, 95% CI) | 1.92 [0.74, 4.96] |
| Outcome or subgroup title | No. of studies | No. of participants | Statistical method | Effect size |
| 1 Mean weight change in kg (cycle 6) Show forest plot | 1 | 314 | Mean Difference (IV, Fixed, 95% CI) | ‐0.02 [‐0.06, 0.03] |
| Outcome or subgroup title | No. of studies | No. of participants | Statistical method | Effect size |
| 1 Mean BMI change (cycle 6) Show forest plot | 1 | 57 | Mean Difference (IV, Fixed, 95% CI) | 0.35 [‐0.13, 0.83] |
| 2 Mean weight change in kg (cycle 6) Show forest plot | 1 | 31 | Mean Difference (IV, Fixed, 95% CI) | 1.30 [‐0.32, 2.92] |
| Outcome or subgroup title | No. of studies | No. of participants | Statistical method | Effect size |
| 1 Mean weight change in kg (cycle 3) Show forest plot | 1 | 33 | Mean Difference (IV, Fixed, 95% CI) | 0.78 [‐0.28, 1.84] |
| Outcome or subgroup title | No. of studies | No. of participants | Statistical method | Effect size |
| 1 Mean weight change in kg (cycle 3) Show forest plot | 1 | 21 | Mean Difference (IV, Fixed, 95% CI) | 0.92 [‐1.25, 3.09] |
| Outcome or subgroup title | No. of studies | No. of participants | Statistical method | Effect size |
| 1 Mean weight change in kg (cycle 3) Show forest plot | 1 | 28 | Mean Difference (IV, Fixed, 95% CI) | 0.09 [‐1.15, 1.33] |
| Outcome or subgroup title | No. of studies | No. of participants | Statistical method | Effect size |
| 1 Gained >2.5 kg (cycle 12) Show forest plot | 1 | 228 | Peto Odds Ratio (Peto, Fixed, 95% CI) | 1.75 [0.98, 3.11] |
| 2 Lost >2.5 kg (cycle 12) Show forest plot | 1 | 228 | Peto Odds Ratio (Peto, Fixed, 95% CI) | 0.66 [0.25, 1.77] |
| Outcome or subgroup title | No. of studies | No. of participants | Statistical method | Effect size |
| 1 Mean weight change in kg (cycle 6) Show forest plot | 1 | 144 | Mean Difference (IV, Fixed, 95% CI) | 0.10 [‐0.70, 0.90] |
| Outcome or subgroup title | No. of studies | No. of participants | Statistical method | Effect size |
| 1 Gained >2 kg (cycle 6) Show forest plot | 1 | 349 | Peto Odds Ratio (Peto, Fixed, 95% CI) | 1.15 [0.65, 2.06] |
| 2 Mean body mass percentage change (cycle 6) Show forest plot | 1 | 45 | Mean Difference (IV, Fixed, 95% CI) | ‐0.5 [‐2.51, 1.51] |
| Outcome or subgroup title | No. of studies | No. of participants | Statistical method | Effect size |
| 1 Gained >2 kg (cycle 6) Show forest plot | 1 | 292 | Peto Odds Ratio (Peto, Fixed, 95% CI) | 1.09 [0.60, 1.99] |
| 2 Lost >2 kg (cycle 6) Show forest plot | 1 | 292 | Peto Odds Ratio (Peto, Fixed, 95% CI) | 1.69 [0.89, 3.20] |
| Outcome or subgroup title | No. of studies | No. of participants | Statistical method | Effect size |
| 1 Mean weight change in kg (cycle 6) Show forest plot | 1 | 5328 | Mean Difference (IV, Fixed, 95% CI) | 0.26 [0.12, 0.40] |
| Outcome or subgroup title | No. of studies | No. of participants | Statistical method | Effect size |
| 1 Weight gain >=5% (cycle 6) Show forest plot | 1 | 2157 | Peto Odds Ratio (Peto, Fixed, 95% CI) | 1.15 [0.91, 1.45] |
| 2 Weight gain >=5% (cycle 13) Show forest plot | 1 | 453 | Peto Odds Ratio (Peto, Fixed, 95% CI) | 1.09 [0.69, 1.74] |
| 3 Weight loss >=5% (cycle 6) Show forest plot | 1 | 2157 | Peto Odds Ratio (Peto, Fixed, 95% CI) | 0.99 [0.72, 1.37] |
| 4 Weight loss >=5% (cycle 13) Show forest plot | 1 | 453 | Peto Odds Ratio (Peto, Fixed, 95% CI) | 1.32 [0.74, 2.34] |
| Outcome or subgroup title | No. of studies | No. of participants | Statistical method | Effect size |
| 1 Mean weight change in kg (cycle 12) Show forest plot | 1 | 43 | Mean Difference (IV, Fixed, 95% CI) | 1.8 [‐0.73, 4.33] |
| Outcome or subgroup title | No. of studies | No. of participants | Statistical method | Effect size |
| 1 Mean weight change in kg (cycle 12) Show forest plot | 1 | 3029 | Mean Difference (IV, Fixed, 95% CI) | 0.13 [‐0.04, 0.30] |
| Outcome or subgroup title | No. of studies | No. of participants | Statistical method | Effect size |
| 1 Gain >2 kg (cycle 4) Show forest plot | 1 | 51 | Peto Odds Ratio (Peto, Fixed, 95% CI) | 0.69 [0.13, 3.58] |
| 2 Lost >2 kg (cycle 4) Show forest plot | 1 | 51 | Peto Odds Ratio (Peto, Fixed, 95% CI) | 1.69 [0.35, 8.07] |
| Outcome or subgroup title | No. of studies | No. of participants | Statistical method | Effect size |
| 1 Gain >=7% body weight (cycle 13) Show forest plot | 1 | 1030 | Peto Odds Ratio (Peto, Fixed, 95% CI) | 0.84 [0.55, 1.28] |
| 2 Lost >=7% body weight (cycle 13) Show forest plot | 1 | 1030 | Peto Odds Ratio (Peto, Fixed, 95% CI) | 1.39 [0.83, 2.32] |
| Outcome or subgroup title | No. of studies | No. of participants | Statistical method | Effect size |
| 1 Mean weight change in kg (cycle 13 or last assessment) Show forest plot | 1 | 937 | Mean Difference (IV, Fixed, 95% CI) | 0.4 [0.03, 0.77] |