Scolaris Content Display Scolaris Content Display

original image
Figuras y tablas -
Figure 1

Comparison 1 STEROIDS vs no treatment or placebo or other non immunosuppressive treatment (dypiridamole), Outcome 1 ESRD.
Figuras y tablas -
Analysis 1.1

Comparison 1 STEROIDS vs no treatment or placebo or other non immunosuppressive treatment (dypiridamole), Outcome 1 ESRD.

Comparison 1 STEROIDS vs no treatment or placebo or other non immunosuppressive treatment (dypiridamole), Outcome 2 Doubling of serum creatinine.
Figuras y tablas -
Analysis 1.2

Comparison 1 STEROIDS vs no treatment or placebo or other non immunosuppressive treatment (dypiridamole), Outcome 2 Doubling of serum creatinine.

Comparison 1 STEROIDS vs no treatment or placebo or other non immunosuppressive treatment (dypiridamole), Outcome 3 Remission of proteinuria.
Figuras y tablas -
Analysis 1.3

Comparison 1 STEROIDS vs no treatment or placebo or other non immunosuppressive treatment (dypiridamole), Outcome 3 Remission of proteinuria.

Comparison 1 STEROIDS vs no treatment or placebo or other non immunosuppressive treatment (dypiridamole), Outcome 4 Urinary protein excretion (g/24) at end of treatment.
Figuras y tablas -
Analysis 1.4

Comparison 1 STEROIDS vs no treatment or placebo or other non immunosuppressive treatment (dypiridamole), Outcome 4 Urinary protein excretion (g/24) at end of treatment.

Comparison 1 STEROIDS vs no treatment or placebo or other non immunosuppressive treatment (dypiridamole), Outcome 5 Serum creatinine (micromoL/L) at end of treatment.
Figuras y tablas -
Analysis 1.5

Comparison 1 STEROIDS vs no treatment or placebo or other non immunosuppressive treatment (dypiridamole), Outcome 5 Serum creatinine (micromoL/L) at end of treatment.

Comparison 1 STEROIDS vs no treatment or placebo or other non immunosuppressive treatment (dypiridamole), Outcome 6 GFR (any measure) at end of treatment.
Figuras y tablas -
Analysis 1.6

Comparison 1 STEROIDS vs no treatment or placebo or other non immunosuppressive treatment (dypiridamole), Outcome 6 GFR (any measure) at end of treatment.

Comparison 2 CYTOTOXIC agents WITH STEROIDS vs no treatment or placebo, Outcome 1 ESRD.
Figuras y tablas -
Analysis 2.1

Comparison 2 CYTOTOXIC agents WITH STEROIDS vs no treatment or placebo, Outcome 1 ESRD.

Comparison 2 CYTOTOXIC agents WITH STEROIDS vs no treatment or placebo, Outcome 2 Urinary protein excretion (g/24 h) at end of treatment.
Figuras y tablas -
Analysis 2.2

Comparison 2 CYTOTOXIC agents WITH STEROIDS vs no treatment or placebo, Outcome 2 Urinary protein excretion (g/24 h) at end of treatment.

Comparison 2 CYTOTOXIC agents WITH STEROIDS vs no treatment or placebo, Outcome 3 GFR (any measure) at end of treatment.
Figuras y tablas -
Analysis 2.3

Comparison 2 CYTOTOXIC agents WITH STEROIDS vs no treatment or placebo, Outcome 3 GFR (any measure) at end of treatment.

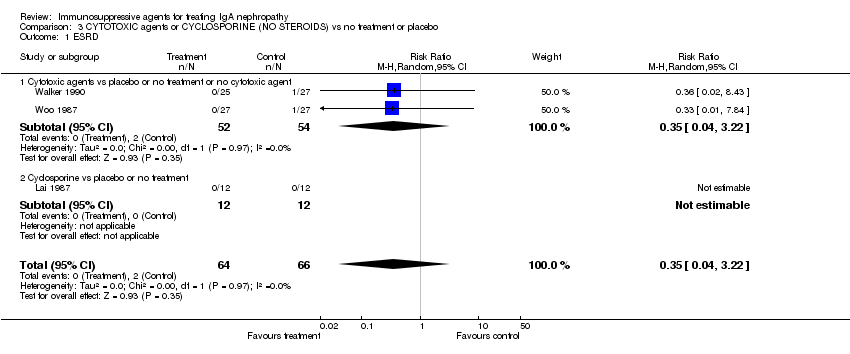
Comparison 3 CYTOTOXIC agents or CYCLOSPORINE (NO STEROIDS) vs no treatment or placebo, Outcome 1 ESRD.
Figuras y tablas -
Analysis 3.1

Comparison 3 CYTOTOXIC agents or CYCLOSPORINE (NO STEROIDS) vs no treatment or placebo, Outcome 1 ESRD.

Comparison 3 CYTOTOXIC agents or CYCLOSPORINE (NO STEROIDS) vs no treatment or placebo, Outcome 2 Urinary protein excretion (g/24 h) at end of treatment.
Figuras y tablas -
Analysis 3.2

Comparison 3 CYTOTOXIC agents or CYCLOSPORINE (NO STEROIDS) vs no treatment or placebo, Outcome 2 Urinary protein excretion (g/24 h) at end of treatment.

Comparison 3 CYTOTOXIC agents or CYCLOSPORINE (NO STEROIDS) vs no treatment or placebo, Outcome 3 Serum creatinine (micromoL/L) at end of treatment.
Figuras y tablas -
Analysis 3.3

Comparison 3 CYTOTOXIC agents or CYCLOSPORINE (NO STEROIDS) vs no treatment or placebo, Outcome 3 Serum creatinine (micromoL/L) at end of treatment.

Comparison 3 CYTOTOXIC agents or CYCLOSPORINE (NO STEROIDS) vs no treatment or placebo, Outcome 4 GFR (any measure) at end of treatment.
Figuras y tablas -
Analysis 3.4

Comparison 3 CYTOTOXIC agents or CYCLOSPORINE (NO STEROIDS) vs no treatment or placebo, Outcome 4 GFR (any measure) at end of treatment.

Table 1. Electronic search strategies

Database searched

Search strategy

MEDLINE (1966 ‐ September 2002)

1. RANDOMISED CONTROLLED TRIAL[pt]
2. CONTROLLED CLINICAL TRIAL.[pt]
3. RANDOMIZED CONTROLLED TRIALS[mh]
4. RANDOM ALLOCATION[mh]
5. DOUBLE BLIND METHOD[mh]
6. SINGLE BLIND METHOD[mh]
7. 1 or 2 or 3 or 4 or 5 or 6
8. (ANIMAL[mh] NOT (animal[mh] AND human[mh])
9. 7 not 8
10. CLINICAL TRIAL[pt]
11. CLINICAL TRIALS[mh]
12. Clinical[tw] AND trials[tw]
13. PLACEBOS[mh]
14. placebo*[tw]
15. random*[tw]
16. RESEARCH DESIGN[mh]
17. 10 or 11 or 12 or 13 or 14 or 15 or 16
18. 17 not 8
19. 18 or 9
20. glomerulonephritis,iga[mh]
21. glomerulonephritis[mh] AND immunology[sh]
22. iga[mh] AND immunology[sh]
23. iga nephropathy[tw]
24. berger disease[tw]
25. 20 or 21 or 22 or 23 or 24
26. 19 and 25

EMBASE (1980 ‐ September 2002)

1. exp Immunoglobulin a Nephropathy/
2. iga nephropathy.tw.
3. berger$ disease.tw.
4. glomerulonephritis, iga.tw.
5. 1 or 2 or 3 or 4
6. exp clinical trial/
7. evidence based medicine/
8. outcomes research/
9. crossover procedure/
10. double blind procedure/
11. single blind procedure/
12. prospective study/
13. major clinical study/
14. exp comparative study/
15. placebo/
16. "evaluation and follow up"/
17. follow up/
18. randomisation/
19. or/6‐18
20. controlled study/ not case control study/
21. or/19‐20
22. (clinic$ adj5 trial$).ti,ab.
23. ((singl$ or doubl$ or trebl$ or tripl$) adj (blind$ or mask$)).ti,ab.
24. (control$ or prospectiv$ or volunteer$).ti,ab.
25. random$.ti,ab.
26. placebo$.ti,ab.
27. or/22‐26
28. 21 or 27
29. limit 28 to human
30. 5 and 29
31. exp clinical trial/
32. comparative study/
33. drug comparison/
34. major clinical study/
35. randomisation/
36. crossover procedure/
37. double blind procedure/
38. single blind procedure/
39. placebo/
40. prospective study/
41. ((clinical or controlled or comparative or placebo or prospective or randomi#ed) adj3 (trial or study)).ti,ab.
42. (random$ adj7 (allocat$ or allot$ or assign$ or basis$ or divid$ or order$)).ti,ab.
43. ((singl$ or doubl$ or trebl$ or tripl$) adj7 (blind$ or mask$)).ti,ab.
44. (cross?over$ or (cross adj1 over$)).ti,ab.
45. ((allocat$ or allot$ or assign$ or divid$) adj3 (condition$ or experiment$ or intervention$ or treatment$ or therap$ or control$ or group$)).ti,ab.
46. or/31‐40
47. or/41‐45
48. 46 or 47
49. 5 and 48

CENTRAL (Issue 3, 2002)

1. GLOMERULONEPHRITIS‐IGA*:ME
2. (BERGER next DISEASE)
3. (BERGERS next DISEASE)
4. (IGA next NEPHROPATHY)
5. (IGA and NEPHROPATHY)
6. 1 or 2 or 3 or 4 or 5

Figuras y tablas -
Table 1. Electronic search strategies
Table 2. Quality of randomised trials included in this review

Study ID

Allocation concealment

Blinding

Intention‐to‐treat

Lost to follow‐up %

Julian 1993

Unclear

No

No

2/35 (5.7)

Katafuchi 2003

Unclear

No

No

13/90 (14.4)

Kobayashi 1996

Inadequate

No

No

44/90 (49)

Lai 1986

Unclear

No

No

0/34 (0)

Pozzi 1999

Unclear

No

Yes

3/86 (3.5)

Shoji 2000

Unclear

No

No

2/21 (9)

Welch 1992

Unclear

Participants, Investigators

Unelar

3/20 (15)

Ballardie 2002

Unclear

Outcome assessors

Yes

0/30 (0)

Harmankaya 2002

Unclear

No

No

0/43 (0)

Yoshikawa 1999

Unclear

No

Unclear

4/78 (5.1)

Lai 1987

Unclear

Participants

Yes

0/22 (0)

Walker 1990

Unclear

No

Yes

1/52 (1.9)

Woo 1987

Unclear

No

Yes

0/48 (0)

Figuras y tablas -
Table 2. Quality of randomised trials included in this review
Table 3. Categories of interventions used in individual trials and duration of follow‐up

Study ID

Treatment

Control

Follow‐up duration

Julian 1993

Steroids

No treatment

6‐24 mths

Katafuchi 2003

Steroids + dipyridamole

Dipyridamole

60 mths

Kobayashi 1996

Steroids

No treatment

120 mths

Lai 1986

Steroids

No treatment

38 mths

Pozzi 1999

Steroids

No treatment

60 mths

Shoji 2000

Steroids

Anticoagulants

13.4 mths

Welch 1992

Steroids

Placebo

3 mths

Ballardie 2002

Steroids + cyclophosphamide

No treatment

24‐72 mths

Harmankaya 2002

Steroids + azathioprine

No treatment

60 mths

Yoshikawa 1999

Steroids + azathioprine +anticoagulants

Anticoagulants

24 mths

Lai 1987

Cyclosporin

Placebo

3 mths

Walker 1990

Cyclophosphamide + anticoagulants

Anticoagulants

23 mths

Woo 1987

Cyclophosphamide + anticoagulants

no treatment

36 mths

Figuras y tablas -
Table 3. Categories of interventions used in individual trials and duration of follow‐up
Table 4. Reports of adverse events in individual trials

Study ID

Intervention

Reported side effect

n in Rx group

N in Rx group

n in control group

N in control group

Julian 1993

Steroids vs no treatment

Overt diabetes, insomnia, acne

2+2+3

18

1

17

Katafuchi 2003

Steroids+dypiridamole vs dypiridamole

Palpitations, insomnia

3

43

1

47

Kobayashi 1996

Steroids vs no treatment

None reported

0

20

0

26

Lai 1986

Steroids vs no treatment

Gastritis, hypertension

1+3

17

0+0

17

Pozzi 1999

Steroids vs no treatment

None reported

0

43

0

43

Shoji 2000

Steroids vs dypiridamole

Headache

0

11

1

8

Welch 1992

Steroids vs placebo

None reported

0

20

0

20

Ballardie 2002

Steroids+cyclophosphamide vs no treatment

Pulmonary TBC, overt diabetes, bone marrow toxicity, gastrointestinal toxicity

1+1+1+1+1

19

0+0+0+0+0

19

Harmankaya 2002

Steroids+azathioprine vs no treatment

Increased transaminase levels, minor cushingoid features, gastric pain

1+2+1

21

0

22

Yoshikawa 1999

Steroids+azathioprine+dypiridamole vs dypiridamole

Alopecia, anemia, leukopenia, cataract, ulcer, depression

1+0+3+1+1+1

40

0+1+0+0+0+0

38

Lai 1987

Cyclosporin vs placebo

Dyspepsia, headache, hypertension, hirsutism

6+7+1+3+7

12

0+0+0+0+1

12

Walker 1990

Cyclophosphamide+dypiridamole+warfarin vs no treatment

Gonadal toxicity, headache

2+1

25

0+0

27

Woo 1987

Cyclophosphamide+dypiridamole+warfarin vs no treatment

Gum bleeding

2

27

0

21

Figuras y tablas -
Table 4. Reports of adverse events in individual trials
Comparison 1. STEROIDS vs no treatment or placebo or other non immunosuppressive treatment (dypiridamole)

Outcome or subgroup title

No. of studies

No. of participants

Statistical method

Effect size

1 ESRD Show forest plot

6

Risk Ratio (M‐H, Random, 95% CI)

Subtotals only

1.1 Steroid vs no treatment or placebo

6

341

Risk Ratio (M‐H, Random, 95% CI)

0.44 [0.25, 0.80]

2 Doubling of serum creatinine Show forest plot

6

Risk Ratio (M‐H, Random, 95% CI)

Subtotals only

2.1 Steroid vs no treatment or placebo

6

341

Risk Ratio (M‐H, Random, 95% CI)

0.45 [0.29, 0.69]

3 Remission of proteinuria Show forest plot

1

Risk Ratio (M‐H, Random, 95% CI)

Totals not selected

3.1 Steroid vs no treatment or placebo

1

Risk Ratio (M‐H, Random, 95% CI)

15.0 [0.92, 243.52]

4 Urinary protein excretion (g/24) at end of treatment Show forest plot

6

263

Mean Difference (IV, Random, 95% CI)

‐0.49 [‐0.72, ‐0.25]

4.1 Steroid vs no treatment or placebo

5

244

Mean Difference (IV, Random, 95% CI)

‐0.58 [‐0.95, ‐0.21]

4.2 Steroid vs dypiridamole

1

19

Mean Difference (IV, Random, 95% CI)

‐0.42 [‐0.72, ‐0.12]

5 Serum creatinine (micromoL/L) at end of treatment Show forest plot

5

173

Mean Difference (IV, Random, 95% CI)

‐23.95 [‐53.71, 5.81]

5.1 Steroid vs no treatment or placebo

4

154

Mean Difference (IV, Random, 95% CI)

‐31.08 [‐63.84, 1.68]

5.2 Steroid vs dypiridamole

1

19

Mean Difference (IV, Random, 95% CI)

0.0 [‐17.62, 17.62]

6 GFR (any measure) at end of treatment Show forest plot

4

138

Mean Difference (IV, Random, 95% CI)

17.87 [4.93, 30.82]

6.1 Steroid vs no treatment or placebo

3

119

Mean Difference (IV, Random, 95% CI)

21.66 [7.87, 35.44]

6.2 Steroid vs dypiridamole

1

19

Mean Difference (IV, Random, 95% CI)

2.5 [‐19.46, 24.46]

Figuras y tablas -
Comparison 1. STEROIDS vs no treatment or placebo or other non immunosuppressive treatment (dypiridamole)
Comparison 2. CYTOTOXIC agents WITH STEROIDS vs no treatment or placebo

Outcome or subgroup title

No. of studies

No. of participants

Statistical method

Effect size

1 ESRD Show forest plot

3

Risk Ratio (M‐H, Random, 95% CI)

Subtotals only

1.1 Cytotoxic agents + steroids vs placebo or no treatment or anticoagulants

3

152

Risk Ratio (M‐H, Random, 95% CI)

0.59 [0.06, 6.03]

2 Urinary protein excretion (g/24 h) at end of treatment Show forest plot

3

Mean Difference (IV, Random, 95% CI)

Subtotals only

2.1 Cytotoxic agents vs placebo or no treatment

3

154

Mean Difference (IV, Random, 95% CI)

‐1.25 [‐2.71, 0.21]

3 GFR (any measure) at end of treatment Show forest plot

1

Mean Difference (IV, Random, 95% CI)

Totals not selected

3.1 Cytotoxic agents vs placebo or no treatment

1

Mean Difference (IV, Random, 95% CI)

2.0 [‐15.98, 19.98]

Figuras y tablas -
Comparison 2. CYTOTOXIC agents WITH STEROIDS vs no treatment or placebo
Comparison 3. CYTOTOXIC agents or CYCLOSPORINE (NO STEROIDS) vs no treatment or placebo

Outcome or subgroup title

No. of studies

No. of participants

Statistical method

Effect size

1 ESRD Show forest plot

3

130

Risk Ratio (M‐H, Random, 95% CI)

0.35 [0.04, 3.22]

1.1 Cytotoxic agents vs placebo or no treatment or no cytotoxic agent

2

106

Risk Ratio (M‐H, Random, 95% CI)

0.35 [0.04, 3.22]

1.2 Cyclosporine vs placebo or no treatment

1

24

Risk Ratio (M‐H, Random, 95% CI)

0.0 [0.0, 0.0]

2 Urinary protein excretion (g/24 h) at end of treatment Show forest plot

3

122

Mean Difference (IV, Random, 95% CI)

‐0.94 [‐1.43, ‐0.46]

2.1 Cytotoxic agents vs placebo or no treatment

2

100

Mean Difference (IV, Random, 95% CI)

‐0.74 [‐0.95, ‐0.54]

2.2 Cyclosporine vs placebo or no treatment

1

22

Mean Difference (IV, Random, 95% CI)

‐1.60 [‐2.43, ‐0.77]

3 Serum creatinine (micromoL/L) at end of treatment Show forest plot

3

122

Mean Difference (IV, Random, 95% CI)

‐7.53 [‐33.58, 18.51]

3.1 Cytotoxic agents vs placebo or no treatment

2

100

Mean Difference (IV, Random, 95% CI)

‐21.30 [‐65.09, 22.49]

3.2 Cyclosporine vs placebo or no treatment

1

22

Mean Difference (IV, Random, 95% CI)

0.0 [‐32.39, 32.39]

4 GFR (any measure) at end of treatment Show forest plot

2

70

Mean Difference (IV, Random, 95% CI)

7.94 [‐1.69, 17.57]

4.1 Cytotoxic agents vs placebo or no treatment

1

48

Mean Difference (IV, Random, 95% CI)

14.59 [‐1.89, 31.07]

4.2 Cyclosporine vs placebo or no treatment

1

22

Mean Difference (IV, Random, 95% CI)

4.5 [‐7.36, 16.36]

Figuras y tablas -
Comparison 3. CYTOTOXIC agents or CYCLOSPORINE (NO STEROIDS) vs no treatment or placebo