| 1 Overall failure (disregarding modifications) Show forest plot | 7 | 943 | Risk Ratio (M‐H, Fixed, 95% CI) | 1.00 [0.79, 1.27] |
|
| 1.1 Glycopeptide empirical | 3 | 293 | Risk Ratio (M‐H, Fixed, 95% CI) | 1.09 [0.28, 4.20] |
| 1.2 Glycopeptide first modification | 1 | 165 | Risk Ratio (M‐H, Fixed, 95% CI) | 0.61 [0.18, 2.09] |
| 1.3 Other antiGP empirical | 3 | 485 | Risk Ratio (M‐H, Fixed, 95% CI) | 1.03 [0.81, 1.32] |
| 2 Failure, modifications included Show forest plot | 11 | 2169 | Risk Ratio (M‐H, Fixed, 95% CI) | 0.72 [0.65, 0.79] |
|
| 2.1 Glycopeptide empirical | 5 | 1178 | Risk Ratio (M‐H, Fixed, 95% CI) | 0.70 [0.61, 0.80] |
| 2.2 Glycopeptide first modification | 2 | 279 | Risk Ratio (M‐H, Fixed, 95% CI) | 0.98 [0.79, 1.22] |
| 2.3 Other antiGP empirical | 4 | 712 | Risk Ratio (M‐H, Fixed, 95% CI) | 0.62 [0.51, 0.77] |
| 3 Failure, modifications included (adequate allocation concealment) Show forest plot | 7 | 1101 | Risk Ratio (M‐H, Fixed, 95% CI) | 0.78 [0.68, 0.89] |
|
| 3.1 Glycopeptide empirical | 2 | 230 | Risk Ratio (M‐H, Fixed, 95% CI) | 0.80 [0.59, 1.08] |
| 3.2 Glycopeptide first modification | 2 | 279 | Risk Ratio (M‐H, Fixed, 95% CI) | 0.98 [0.79, 1.22] |
| 3.3 Other antiGP empirical | 3 | 592 | Risk Ratio (M‐H, Fixed, 95% CI) | 0.66 [0.53, 0.81] |
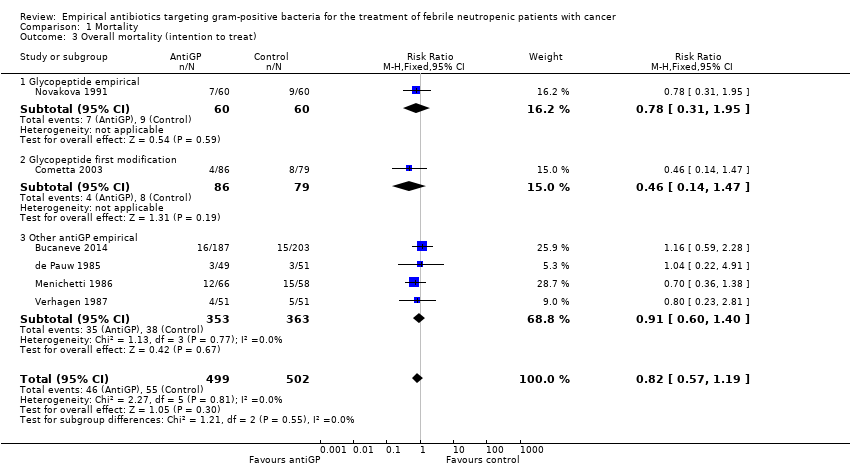
| 4 Failure, modifications included (intention to treat) Show forest plot | 7 | 1068 | Risk Ratio (M‐H, Fixed, 95% CI) | 0.79 [0.69, 0.90] |
|
| 4.1 Glycopeptide empirical | 2 | 186 | Risk Ratio (M‐H, Fixed, 95% CI) | 0.81 [0.61, 1.08] |
| 4.2 Glycopeptide first modification | 2 | 290 | Risk Ratio (M‐H, Fixed, 95% CI) | 1.00 [0.81, 1.23] |
| 4.3 Other antiGP empirical | 3 | 592 | Risk Ratio (M‐H, Fixed, 95% CI) | 0.66 [0.53, 0.81] |
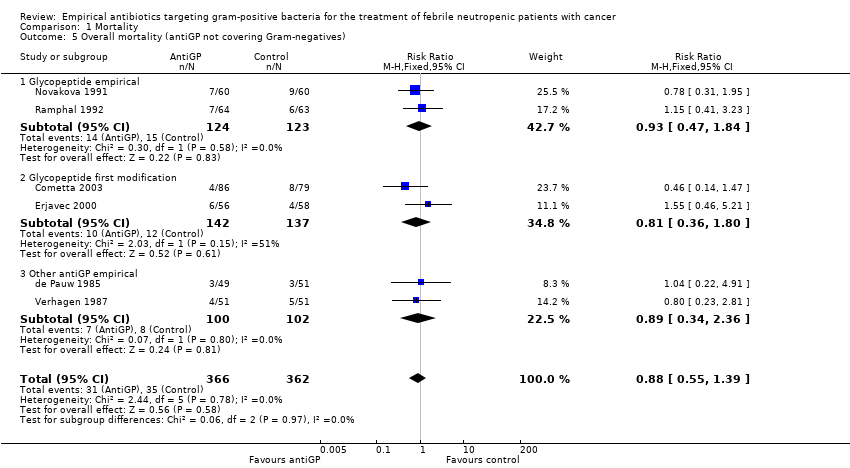
| 5 Failure, modifications included (antiGP not covering Gram‐negatives) Show forest plot | 9 | 1659 | Risk Ratio (M‐H, Fixed, 95% CI) | 0.78 [0.69, 0.87] |
|
| 5.1 Glycopeptide empirical | 5 | 1178 | Risk Ratio (M‐H, Fixed, 95% CI) | 0.70 [0.61, 0.80] |
| 5.2 Glycopeptide first modification | 2 | 279 | Risk Ratio (M‐H, Fixed, 95% CI) | 0.98 [0.79, 1.22] |
| 5.3 Other antiGP empirical | 2 | 202 | Risk Ratio (M‐H, Fixed, 95% CI) | 1.02 [0.62, 1.67] |
| 6 Failure in Gram‐positive infections Show forest plot | 5 | 175 | Risk Ratio (M‐H, Fixed, 95% CI) | 0.56 [0.38, 0.84] |
|
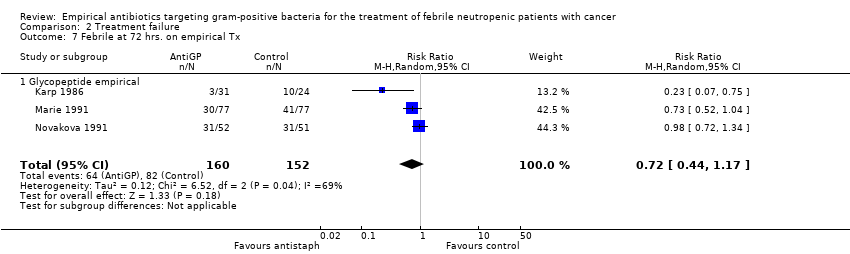
| 7 Febrile at 72 hrs. on empirical Tx Show forest plot | 3 | 312 | Risk Ratio (M‐H, Random, 95% CI) | 0.72 [0.44, 1.17] |
|
| 7.1 Glycopeptide empirical | 3 | 312 | Risk Ratio (M‐H, Random, 95% CI) | 0.72 [0.44, 1.17] |
| 8 Addition of amphotericin Show forest plot | 5 | 1201 | Risk Ratio (M‐H, Random, 95% CI) | 1.23 [0.84, 1.80] |
|
| 8.1 Non‐blinded | 3 | 976 | Risk Ratio (M‐H, Random, 95% CI) | 1.51 [0.80, 2.83] |
| 8.2 Double blind | 2 | 225 | Risk Ratio (M‐H, Random, 95% CI) | 0.99 [0.75, 1.33] |