رژیمهای آنتیبیوتیکی تجربی هدفگذاری شده روی باکتریهای گرم مثبت برای درمان بیماران مبتلا به نوتروپنی تبدار مبتلا به سرطان
چکیده
پیشینه
الگوی عفونتها میان بیماران مبتلا به نوتروپنی مبتلا به سرطان در دهههای اخیر به سمت برتری عفونتهای گرممثبت تغییر پیدا کرده است. برخی از باکتریهای گرممثبت به طور فزایندهای در برابر بتالاکتامها مقاوم بوده و درمان را با آنتیبیوتیکهای خاص ضروری میسازد.
اهداف
ارزیابی اثربخشی درمان آنتیبیوتیکی تجربی ضد‐گرممثبت برای بیماران مبتلا به نوتروپنی تبدار مبتلا به سرطان به لحاظ مورتالیتی و شکست درمان. ارزیابی نرخ پیشرفت مقاومت، عفونتهای بیشتر و حوادث جانبی مربوط به درمان antiGP اضافی.
روشهای جستوجو
برای این مرور بهروز شده، پایگاه ثبت مرکزی کارآزماییهای کنترل شده کاکرین (CENTRAL) (2017، شماره 2)؛ MEDLINE (می 2012 تا 2017)؛ Embase (می 2012 تا 2017)؛ LILACS (2012 تا 2017)، مجموعه مقالات کنفرانس، پایگاه ثبت کارآزمایی ClinicalTrials.gov و منابع مطالعات وارد شده را جستوجو کردیم. با نویسندگان اول تمامی کارآزماییهای وارد شده و کارآزماییهای بالقوه مرتبط تماس گرفتیم.
معیارهای انتخاب
کارآزماییهای تصادفیسازی و کنترل شده (randomised controlled trials; RCTs) که به مقایسه یک رژیم آنتیبیوتیکی در برابر همان رژیم به اضافه یک آنتیبیوتیک antiGP برای درمان بیماران مبتلا به نوتروپنی تبدار مبتلا به سرطان پرداخته بودند.
گردآوری و تجزیهوتحلیل دادهها
دو نویسنده مرور بهطور مستقل از هم به ارزیابی واجد شرایط بودن کارآزمایی و خطر سوگیری (bias) پرداخته و تمامی دادهها را استخراج کردند. خطرات نسبی (RR) با 95% فواصل اطمینان (CIs) محاسبه شد. برای تمامی مقایسههایی که دارای ناهمگونی قابل توجهی بود (I2 > 50%) از مدل اثرات تصادفی استفاده شد. پیامدها بر اساس قصد درمان (intention‐to‐treat) استخراج شدند و انجام تجزیهوتحلیلها هر زمانی که امکانپذیر بود به صورت بیمار‐محور (patient‐based) امکانپذیر بود.
نتایج اصلی
چهارده کارآزمایی و 2782 بیمار یا اپیزود وارد مرور شدند. آنتیبیوتیکهای تجربی antiGP در شروع درمان در 12 مطالعه، و برای تب پایدار (persistent fever) در دو مطالعه تست شدند. درمان antiGP در نه کارآزمایی، گلیکوپپتید (glycopeptide) بود. هشت مطالعه به لحاظ مقایسه مورتالیتی کلی ارزیابی شدند و هیچ تفاوت معنیداری بین بازوهای مقایسه کننده مشاهده نشد، RR: 0.90؛ (95% CI؛ 0.64 تا 1.25؛ 8 مطالعه؛ 1242 بیمار؛ دادهها با کیفیت متوسط). یازده کارآزمایی شکست درمان را شامل تعدیلات (modifications)، ارزیابی کرده بودند، در حالی که هفت مطالعه شکست کلی، فارغ از تعدیلات درمانی را ارزیابی کرده بودند. شکست با تعدیلات کاهش یافته بود، RR: 0.72؛ (95% CI؛ 0.65 تا 0.79؛ 11 مطالعه؛ 2169 بیمار؛ دادهها با کیفیت پائین)، در حالی که شکست کلی مشابه بود، RR: 1.00؛ (95% CI؛ 0.79 تا 1.27؛ 7 مطالعه؛ 943 بیمار؛ دادهها با کیفیت پائین). تجزیهوتحلیل حساسیت برای پنهانسازی تخصیص و دادههای ناقص پیامد، نتایج را تغییر ندادند. شکست میان بیماران مبتلا به عفونتهای گرممثبت با دریافت درمان antiGP کاهش یافته بود، RR: 0.56؛ (95% CI؛ 0.38 تا 0.84؛ 5 مطالعه؛ 175 بیمار)، اگرچه، مورتالیتی میان این بیماران تغییر نکرده بود.
دادههای مربوط به سایر زیرگروههای بیمار که احتمالا درمان antiGP برای آنها مزیتی به همراه داشت، در دسترس نبودند. گلیکوپپتیدها نرخهای اضافه شدن عفونتهای قارچی (fungal superinfection rates) را افزایش نداده بودند، و با کاهش در اضافه شدن عفونتهای گرممثبت رابطه داشتند. کولونیزاسیون مقاوم (resistant colonisation) در این مطالعات مستندسازی نشده بود.
نتیجهگیریهای نویسندگان
شواهد با کیفیت بسیار پائین یا پائین ارزیابی شده بر اساس رویکرد درجهبندی توصیه، ارزیابی، توسعه و ارزشیابی (GRADE) و خطر پائین سوگیری کلی نشان میدهد که افزودن روتین درمان antiGP تجربی، تحت عنوان گلیکوپپتیدها، پیامدهای مربوط به بیماران مبتلا به نوتروپنی تبدار مبتلا به سرطان را بهبود نمیبخشد.
PICO
خلاصه به زبان ساده
طیف درمان آنتیبیوتیکی اولیه برای بیماران سرطانی تبدار و دارای شمارش پائین لکوسیتها
پیشینه: بیماران سرطانی مبتلا به نوتروپنی (neutropenia) میشوند، حالتی که در آن بخشی از لکوسیتهای مسئول حفاظت در برابر باکتریها در نتیجه شیمیدرمانی یا سرطان کاهش مییابند. نوتروپنی بیماران را در معرض ابتلا به عفونتهای شدید باکتریایی قرار میدهد. رژیمهای استاندارد آنتیبیوتیکی برای بیماران مبتلا به نوتروپنی و تبدار مبتلا به سرطان در مورد اکثر باکتریهایی که منجر به بروز عفونت میشوند، استفاده میشوند. با وجود این، بخشی از باکتریهای مقاوم متعلق به گروه گرممثبت (gram‐positive) (استافیلوکوس اورئوس (Staphylococcus aureus) و استرپتوکوکی (streptococci))، در صورت عدم افزودن آنتیبیوتیکهای خاص به درمان، درمان نشده باقی میمانند.
سوال مطالعه مروری: ما به ارزیابی این موضوع پرداختیم که افزودن آنتیبیوتیکهای خاص ضد‐گرممثبت قبل از شناسایی باکتری مسبب، بقا و درمان را میان بیماران مبتلا به نوتروپنی تبدار مبتلا به سرطان بهبود میدهد یا خیر.
تاریخ جستوجو: شواهد تا فوریه 2017 بهروز هستند.
ویژگیهای مطالعه: ما کارآزماییهای تصادفیسازی و کنترل شدهای را وارد کردیم که به مقایسه یک رژیم آنتیبیوتیکی در برابر همان رژیم به اضافه یک آنتیبیوتیکی که در باکتریهای گرممثبت ساخته شده بود، پرداخته بودند. به طور کلی، 14 کارآزمایی تصادفیسازی و کنترل شده با 2782 بیمار یا اپیزود عفونت وارد مرور شدند. آنتیبیوتیکها به بیماران سرطانی مبتلا به نوتروپنی به عنوان درمان خط اول (12 کارآزمایی) یا برای تب عود کننده (دو کارآزمایی) داده شد.
منابع تامین مالی مطالعه: 9 کارآزمایی از 14 کارآزمایی منابع مالی خود را از صنعت دریافت کرده بودند.
نتایج کلیدی: مورتالیتی بین گروههای بیماران تفاوت نداشت. درمان آنتیبیوتیک با فراوانی بیشتری میان بیمارانی که در ابتدا آنتیبیوتیکهای خاص ضد‐باکتری گرممثبت دریافت نکرده بودند، تعدیل شده بود، اما شکستهای درمان در کل تفاوتی نداشتند. ما تلاش کردیم که طول دوره تب و بستری را در بیمارستان بررسی کنیم، اما این موارد به صورت همسو و سازگار گزارش نشده بودند. افزودن آنتیبیوتیکهای خاص ضد‐باکتریهای گرممثبت منجر به بروز حوادث جانبی بیشتری، عمدتا بثورات، شده بودند. ما نتیجه گرفتیم که درمان آنتیبیوتیک استفاده شده علیه باکتریهای گرممثبت مقاوم میتواند تا پس از شناسایی باکتریها به تاخیر انداخته شود و نیاز ندارد که به صورت روتین قبل از شناسایی باکتریایی به بیمار داده شود.
کیفیت شواهد: در مجموع، کیفیت شواهد بر مبنای کارآزماییهای تصادفیسازی و کنترل شده، پائین تا بسیار پائین بود، به طوری که بیشتر آنها دارای خطر پائین سوگیری بودند. یک محدودیت برای نتایج مربوط به مورتالیتی عبارت بود از اینکه مورتالیتی به هر علتی گزارش نشده بود و در 6 مطالعه از 14 مطالعه قابل دستیابی نبودند. کارآزماییها شرایط خاصی را که ممکن بود الزام به استفاده تجربی از آنتیبیوتیکهای ضد‐باکتریهای گرممثبت ایجاد کرده باشند، بررسی نکرده بودند و بنابراین شواهد مرتبط با بیماران سرطانی تبدار و بدون فشار خون پائین، یا دارای عفونتی است که ممکن بوده به دلیل باکتریهای گرممثبت ایجاد شده باشد.
Authors' conclusions
Summary of findings
| Mortality with anti‐gram‐positive antibiotics compared to placebo for the treatment of febrile neutropenic patients with cancer | ||||||
| Patient or population: febrile neutropenic patients with cancer | ||||||
| Outcomes | Anticipated absolute effects* (95% CI) | Relative effect | № of participants | Quality of the evidence | Comments | |
| Risk with placebo | Risk with anti gram‐positive antibiotics | |||||
| Overall mortality | Study population | RR 0.90 | 1242 | ⊕⊕⊕⊝ | ||
| 104 per 1,000 | 94 per 1,000 | |||||
| *The risk in the intervention group (and its 95% confidence interval) is based on the assumed risk in the comparison group and the relative effect of the intervention (and its 95% CI). | ||||||
| GRADE Working Group grades of evidence | ||||||
| 1 Lack of blinding should not affect the objective outcome of mortality 2 Wide CI ranging from a large benefit of anti‐gram‐positive antibiotics to possible harm | ||||||
| Treatment failure with anti gram‐positive antibiotics compared to placebo for the treatment of febrile neutropenic patients with cancer | ||||||
| Patient or population: febrile neutropenic patients with cancer | ||||||
| Outcomes | Anticipated absolute effects* (95% CI) | Relative effect | № of participants | Quality of the evidence | Comments | |
| Risk with placebo | Risk with treatment failure | |||||
| Overall failure (disregarding modifications) | Study population | RR 1.00 | 943 | ⊕⊕⊝⊝ | ||
| 187 per 1,000 | 187 per 1,000 | |||||
| Failure, modifications included | Study population | RR 0.72 | 2169 | ⊕⊝⊝⊝ | ||
| 463 per 1,000 | 333 per 1,000 | |||||
| *The risk in the intervention group (and its 95% confidence interval) is based on the assumed risk in the comparison group and the relative effect of the intervention (and its 95% CI). | ||||||
| GRADE Working Group grades of evidence | ||||||
| 1 Lack of blinding in most studies, subjective outcome 2 Indirectness: outcome driven by treatment modifications, an outcome not relevant to this patient population | ||||||
| Adverse events with anti gram‐positive antibiotics compared to placebo for the treatment of febrile neutropenic patients with cancer | ||||||
| Patient or population: febrile neutropenic patients with cancer | ||||||
| Outcomes | Anticipated absolute effects* (95% CI) | Relative effect | № of participants | Quality of the evidence | Comments | |
| Risk with placebo | Risk with Adverse events | |||||
| Any adverse events | Study population | RR 1.74 | 1936 | ⊕⊝⊝⊝ | ||
| 192 per 1,000 | 335 per 1,000 | |||||
| *The risk in the intervention group (and its 95% confidence interval) is based on the assumed risk in the comparison group and the relative effect of the intervention (and its 95% CI). | ||||||
| GRADE Working Group grades of evidence | ||||||
| 1 Lack of blinding 2 Adverse events were not described in all studies and are interpreted differently in each study | ||||||
Background
Advances in therapy for cancer patients are associated with an increased risk of infection. Newer chemotherapeutic regimens, indwelling intravenous catheters, and bone marrow transplantation for both haematological and solid tumour cancer patients constitute major risk factors for infection. These cause bone marrow suppression with resulting neutropenia and damage to the physiological barriers of infection such as skin and mucous membranes. Infections are the most common cause of death among cancer patients and they are a common rate‐limiting factor for continuing cancer therapy (Nesher 2014).
Gram‐negative bacteria were the most common cause for bacteriologically‐documented infections when empirical treatment for neutropenic cancer patients was proposed. Eventually, gram‐positive bacteria have replaced the gram‐negative bacteria as the most commonly documented infection. These include mainly Staphylococci, Streptococcus species, Enterococci and Corynebacterium species. Between 1973 to 1994, the European Organisation for Research and Treatment of Cancer International Antimicrobial Therapy Cooperative Group (EORTC‐IATCG) has conducted several multi‐centre randomised controlled trials (RCTs) of empirical therapy in cancer patients with fever and neutropenia (EORTC 1978; EORTC 1983; EORTC 1986; EORTC 1987; EORTC 1991; EORTC 1993; EORTC 1995; EORTC 1996). In these trials, the frequency of gram‐positive isolates increased steadily from 29% to 69% of single‐organism bacteraemias, while the rate of single‐agent gram‐negative bacteraemias dropped from 71% to 31%. In addition, the overall mortality associated with treated infection has decreased from around 25% to 6% in trials conducted during recent years (Del Favero 2001; EORTC 1996; Gurwith 1978). Of late, epidemiology might be reverting to a predominance of gram‐negative bacteria, at least in some locations (Montassier 2013; Nesher 2014; Yan 2016; Yapici 2016.
Several explanations may underlie the changes in the epidemiology of febrile neutropenia. The increase in infections due to gram‐positive bacteria is probably due mainly to the widespread use of centrally placed venous catheters, which have the propensity to be colonised by gram‐positive bacteria (Press 1984). Mucositis induced by intensive chemotherapy is similarly associated with gram‐positive bacteria. Quinolone prophylaxis decreases both the incidence of gram‐negative and gram‐positive infections, but infections occurring despite prophylaxis are more likely to be gram‐positive (Bucaneve 2005; Gafter‐Gvili 2005). The recent resurgence of gram‐negative infections might be related to discontinuation of quinolone prophylaxis as a consequence to rising resistance of gram‐negative bacteria to quinolones.
Gram‐positive bacteria among cancer patients are frequently resistant to the beta‐lactams, which are currently recommended for the empirical treatment of febrile neutropenic cancer patients. Methicillin (an antistaphylococcal penicillin)‐resistant Staphylococcus aureus (MRSA) is common in the healthcare setting, with methicillin‐resistance rates reaching up to 50% of all S. aureus isolates in high‐endemicity locations in Europe (EARS‐NET). However, the observed prevalence of MRSA has stabilised or declined in the last decade worldwide (Akova 2016). This reduction has been assumed to result from improved infection control. Coagulase‐negative staphylococci are commonly responsible for bloodstream infections in cancer patients and resistance rates of 90% for methicillin, 68.4% for ciprofloxacin, and 48.5% for clindamycin have been reported in the USA (May 2014).
Current guidelines for the use of antimicrobial agents in febrile neutropenic patients advise against routine empirical treatment with glycopeptides, prior to identification of the causative pathogen or its susceptibilities (Averbuch 2013; Cometta 2007; Freifeld 2011; Penack 2011). Exceptions are defined in patients with hypotension, severe sepsis and septic shock, and those with severe mucositis. Pre‐emptive treatment is advised for patients with suspected catheter‐related infections (with clinical signs of catheter infection). European guidelines recommend the consideration of empirical glycopeptides in centres where resistant gram‐positive bacteria (that is methicillin‐resistant S. aureus or penicillin‐resistant streptococci) are predominant (Cometta 2007). Targeted treatments are recommended for patients with documented infections caused by beta‐lactam resistant gram‐positive bacteria, and for those with bacteraemia caused by gram‐positive bacteria, prior to final identification of the pathogen and susceptibility testing (Averbuch 2013; Freifeld 2011).
Withholding broad‐spectrum anti‐gram‐positive (antiGP) treatment is not necessarily detrimental and may even be advantageous. Early empirical antibiotic treatment for febrile neutropenic patients was suggested when gram‐negative organisms dominated. Such early treatment reduced mortality since gram‐negative infections are notoriously rapidly fatal. Infections due to gram‐positive bacteria, especially those caused by coagulase‐negative staphylococci, may be less rapidly fatal permitting initiation of specific antibiotic treatment when an infection is documented (Rosa 2014). Administration of glycopeptides may be associated with adverse effects, especially when combined with aminoglycosides or other nephrotoxic agents (Finch 2005). Moreover, use of glycopeptides has been associated with emergence of glycopeptide‐resistant enterococci and S. aureus resistant to glycopeptides (Montecalvo 1994; Sievert 2002; Tenover 2001).
Considering an overall mortality rate among patients with febrile neutropenia of around 6%, the sample size needed to assess the effect of antiGP treatment is large (Other published versions of this review). We therefore conducted a meta‐analysis of trials comparing the treatment for febrile neutropenia with or without specific antiGP coverage. We looked for specific patient subgroups for whom antiGP treatment may be specifically indicated.
Objectives
-
To assess whether the addition of empirical anti‐gram‐positive (antiGP) antibiotic treatment in febrile neutropenic cancer patients reduces mortality and treatment failure.
-
To assess the rate of resistance development, further infections and adverse events caused by additional antiGP treatment.
Methods
Criteria for considering studies for this review
Types of studies
Any randomised controlled trial (RCT) or quasi‐RCT. Studies with a dropout rate above 30% were excluded, unless an intention‐to‐treat (ITT) analysis was possible for any of the review‐defined outcomes.
Types of participants
Febrile neutropenic patients with cancer with suspected or documented infections.
Types of interventions
We included studies assessing first‐line treatment (that is treatment instituted before final identification of causative pathogen(s) and their susceptibilities) for all patients or those with risk factors for gram‐positive infections (e.g. suspected catheter‐related infections, hypotension, mucositis) or pre‐emptive therapy (for patients with identification of gram‐positive cocci in blood before final identification), both at onset of treatment (empirical treatment) and for fever persisting beyond 48 to 72 hours after treatment initiation (first modification). Only studies comparing one antibiotic regimen with or without a placebo versus the same antibiotic regimen with the addition of an antiGP antibiotic (as defined) were included. Studies comparing different antibiotic regimens, including an antiGP antibiotic in one arm, were excluded.
The following antiGP antibiotics were included.
-
Glycopeptides:
-
vancomycin;
-
teicoplanin.
-
-
Beta‐lactams:
-
penicillinase‐resistant penicillins, oxacillin, cloxacillin, dicloxacillin, flucloxacillin, or nafcillin;
-
first‐generation cephalosporins, cefazolin;
-
advanced‐generation cephalosporins: cefepime*, ceftaroline*, cetobiprole*.
-
-
Lincosamines:
-
clindamycin.
-
-
Streptogramins:
-
quinupristin‐dalfopristin.
-
-
Oxazolidinones:
-
linezolid;
-
tedizolid.
-
-
Sulphonamides:
-
trimethoprim‐sulphamethoxazole*.
-
-
Lipopeptides:
-
daptomycin;
-
dalbavancin;
-
oritavancin.
-
-
Glycylcyclines:
-
tigecycline*.
-
Antibiotics marked with * are active also against gram‐negative bacteria (see investigation of heterogeneity and subgroup analyses).
Types of outcome measures
Primary outcomes
-
Overall mortality at end of study follow‐up and up to 30 days following end of treatment. We extracted 30‐day mortality. If not reported, we used overall mortality data at the latest point of study follow‐up when the follow‐up did not exceed 30 days.
Secondary outcomes
-
Treatment failure, as defined in the study, once including any modification of the empirical antibiotic regimen in the definition of failure (modifications included), and once disregarding treatment modifications (overall failure) (Consensus 1990)
-
Duration of fever and hospital stay among survivors
-
Removal of central catheter
-
Addition of amphotericin (antifungal antibiotic)
-
Superinfection: new, persistent, or worsening symptoms or signs of infection associated with the isolation of a new pathogen (different pathogen, or same pathogen with different susceptibilities), or the development of a new site of infection
-
Colonisation by resistant bacteria: the isolation of bacteria during or following antibiotic therapy, without signs or symptoms of infection
-
Development of resistance: change in susceptibility of pathogens isolated at initiation of antibiotic therapy
-
Adverse events
The adverse events were described as:
-
any serious adverse events that were fatal, life‐threatening, or requiring inpatient hospitalisation or prolongation of existing hospitalisation (death due to adverse event, anaphylaxis, nephrotoxicity requiring renal replacement therapy, pseudomembranous colitis); serious adverse events were not independent of the primary outcome, overall mortality;
-
any adverse events that resulted in significant disability or incapacity (e.g. nephrotoxicity, ototoxicity, bleeding severe skin reactions);
-
any important medical events that might not be immediately life‐threatening or result in death or hospitalisation but might jeopardise the patient or require intervention to prevent one of the above outcomes;
-
any adverse events that required discontinuation of medication;
-
any adverse event.
Search methods for identification of studies
Electronic searches
A comprehensive search strategy was formulated in an attempt to identify all relevant studies regardless of language or publication status, in combination with the search strategy for clinical trials developed by Cochrane and detailed in the Cochrane Handbook for Systematic Reviews of Interventions (Higgins 2011a). The following databases were searched using the tailored search strategies detailed in Appendix 1, Appendix 2, and Appendix 3.
For this review update the searches were re‐run on 08 March 2017.
Cochrane Central Register of Controlled Trials (CENTRAL 2017, Issue 2).
MEDLINE (May 2012 to February Week 4 2017).
Embase (May 2012 to 2017 week 10).
LILACS (2012 to March 2017).
Searching other resources
The bibliographies of all included studies and pertinent reviews were scanned for additional references. We contacted the first or corresponding author of each included study, and the researchers active in the field for information regarding unpublished trials or complementary information on their own trials. We searched the following conference proceedings for unpublished trials: Interscience Conference on Antimicrobial Agents and Chemotherapy (ICAAC) (1995 to 2017); European Congress of Clinical Microbiology and Infectious Diseases (ECCMID) (2003 to 2017). We searched for ongoing and unpublished trials in the National Institutes of Health database (https://clinicaltrials.gov/).
Data collection and analysis
Selection of studies
One review author (OBK for the 2017 update) inspected the abstract of each reference identified in the search and applied the inclusion criteria. Where potentially relevant articles were identified, the full‐text article was obtained and inspected independently by two review authors (MP, OBK).
Data extraction and management
Two review authors extracted the data from the included trials independently into a data extraction sheet. Differences in the data that were extracted were resolved by discussion with a third review author (LL). Justification for excluding studies from the review was documented. We contacted authors of all included trials, and trials in the assessment for inclusion for clarifications and further information. Data regarding all‐cause mortality and randomisation methods were primarily requested.
For the mortality comparison, we extracted results by ITT, including all individuals randomised in the outcome assessment. Where this was impossible, we extracted the data by available‐case analysis. We compared the main analysis, including both types of studies, to the ITT analysis. All other outcome data were extracted preferentially by ITT and combined with the available‐case analysis. For sensitivity analysis, we imputed failure for all dropouts and presented an ITT analysis including all randomised individuals in the denominator. We could not include all studies in this comparison as some trials did not report the number of dropouts per study arm, prohibiting imputation for dropouts.
The following data were extracted, checked, and recorded.
Trial characteristics
-
Year (defined as recruitment initiation year) and country of study
-
Trial sponsor
-
Publication status: published in journal; abstract or proceeding; unpublished
-
ITT analysis: performed; possible to extract; efficacy analysis
-
Randomisation methods: allocation generation and concealment
-
Blinding
-
Failure definition: including time of failure assessment
-
Study follow‐up duration
-
Performance of surveillance cultures
Patient characteristics
-
Number of patients with clinically documented infections
-
Number of patients with bacteriologically documented infections
-
Number of patients with documented infections due to gram‐positive bacteria: any gram‐positive, Staphlococcus epidermidis, Staphylococcus aureus; Streptococci
-
Number of patients with bacteraemia
-
Number of patients with gram‐positive bacteraemia: any gram‐positive, Staphylococcus epidermidis, Staphylococcus aureus; Streptococci
-
Number of patients with gram‐negative bacteraemia
-
Number of patients with infections caused by bacteria resistant to the administered antibiotic regimen: methicillin‐resistant staphylococci; other
Infection characteristics
-
Number of patients with clinically documented infections
-
Number of patients with bacteriologically documented infections
-
Number of patients with documented gram‐positive infections: any gram‐positive, Staphlococcus epidermidis, Staphylococcus aureus; Streptococci
-
Number of patients with bacteraemia
-
Number of patients with gram‐positive bacteraemia: any gram‐positive, Staphylococcus epidermidis, Staphylococcus aureus; Streptococci
-
Number of patients with gram‐negative bacteraemia
-
Number of patients with infections caused by bacteria resistant to the administered antibiotic regimen: methicillin‐resistant staphylococci; other
Intervention characteristics
-
Antibiotics type and dose
-
Treatment duration
-
Treatment modifications
-
Previous antibiotic regimen for the first modification trials
Measures of outcome
Measures of outcome as defined under Types of outcome measures, extracted as number of patients per group
Assessment of risk of bias in included studies
The risk of bias of the included trials was assessed for allocation sequence generation, allocation concealment, blinding of participants, personnel and outcome assessors and incomplete outcome data using the Cochrane 'Risk of bias' tool (Higgins 2011b). Other risk of bias was considered when patients were randomised more than once into the trial (see Unit of analysis issues). 'Risk of bias' assessment was performed independently by two review authors (MP, OBK). 'Risk of bias' assessment was based on the evidence of a strong association between poor allocation concealment and overestimation of effect, and was defined low risk of bias; adequate allocation concealment, moderate risk of bias; unclear allocation concealment, and high risk of bias; inadequate allocation concealment) (Schulz 1995).
Measures of treatment effect
Dichotomous data were analysed by calculating the risk ratio (RR) for each trial, with the uncertainty of each result being expressed using the 95% confidence interval (CI). We planned to extract time‐to‐event data for hospitalisation, fever and treatment durations according to the method described by Parmar (Parmar 1998).
Unit of analysis issues
Some trials allowed the inclusion of several episodes for each patient; these outcomes for different episodes in the same patient are not independent. Ideally, such trials should be analysed allowing for clustering of episodes within patients, but this clustering is often ignored giving rise to spuriously narrow confidence intervals on the estimated effects of treatment. To minimise such problems, we extracted the number of patients and episodes per trial. Where data were available, we used the number of patients with the outcome and number of patients randomised, rather than basing the analysis on episodes.
Assessment of heterogeneity
Heterogeneity in the results of the trials was assessed using a Chi2 test of heterogeneity (P less than 0.1) and the I2 statistic. We planned to explore heterogeneity by performing subgroup analyses and meta‐regression (see Subgroup analysis and investigation of heterogeneity).
Assessment of reporting biases
A funnel plot of log odds ratio (OR) for efficacy against the sample size was examined in order to assess potential selection bias (publication and language). In addition, the standard normal deviate (SND), defined as the OR divided by its standard error, was regressed against the estimate's precision (regression equation: SND = a + b x precision) in order to summarise any potential selection bias (Egger 1997). In this equation, the SND reflects the degree of funnel plot asymmetry as measured by the intercept from regression of standard normal deviates against precision.
Data synthesis
Meta‐analysis was performed using the fixed‐effect model for comparisons showing no substantial heterogeneity (I2 less than 50%) and the random‐effects model for other comparisons. The effect of risk of bias on results was examined using sensitivity analysis restricting the analysis to trials at low risk of bias for allocation concealment and reporting results by ITT.
Univeraite meta‐regression was performed using Comprehensive Meta Analysis V3.
Subgroup analysis and investigation of heterogeneity
We planned to compare the effects of empirical treatment with and without additional antiGP antibiotics in the following patient subgroups:
-
patients diagnosed eventually with gram‐positive infections;
-
patients with central venous catheters;
-
patients having received quinolone prophylaxis.
Meta‐regression using Comprehensive Meta‐analysis Version 2 was performed to assess the relationship between the rate of gram‐positive infections in the studies and their estimated treatment effects, in order to assess the hypothesis that antiGP treatment would appear more effective with increasing prevalence of gram‐positive infections.
In this 2017 update, we added a subgroup analysis of trials in which the antiGP antibiotic provides coverage also against gram‐negative bacteria. Thus, this analysis is restricted to antiGPs whose spectrum of coverage includes not only gram‐positive bacteria.
Sensitivity analysis
The effect of risk of bias on results was examined using sensitivity analysis restricting the analysis to trials at low risk of bias for allocation concealment and reporting results by ITT.
Results
Description of studies
Results of the search
The original search strategy resulted in 331 references. After reviewing all abstracts, we retrieved 42 studies for full‐text inspection. We updated the search in 2013 and 3515 new references were screened, but no new trials were identified for inclusion. The current 2017 update revealed 2723 new references with one study identified for inclusion (Bucaneve 2014). See Figure 1.

Study flow diagram.
Included studies
We included 22 publications representing 14 individual randomised controlled trials (RCTs) corresponding to our inclusion criteria. The trials were conducted between 1979 and 2014.
Glycopeptides were tested in nine trials (vancomycin five, teicoplanin four) (see Characteristics of included studies). These trials were performed between 1984 and 2000. Other anti‐gram‐positive (antiGP) drugs were tested in five trials: cephalothin in two (Lawson 1979; Verhagen 1987), flucloxacillin and trimethoprim‐sulphamethoxazole in one trial each (de Pauw 1985; Menichetti 1986, respectively), and tigecycline in the last trial identified in the 2017 update (Bucaneve 2014). The last two antiGP antibiotics cover also gram‐negative bacteria (Bucaneve 2014; Menichetti 1986). The basic antibiotic regimens are specified in the table 'Characteristics of included studies'. Ceftazidime, the most commonly used beta‐lactam used as a basic regimen, was used alone in five trials and with amikacin in two trials.
The antiGP antibiotic was tested at the onset of antibiotic treatment as the first line (empirical) regimen in all trials but two, which assessed its addition for persistently febrile patients (first modification) after 72 to 96 hours of imipenem monotherapy (Erjavec 2000), or after 48 to 60 hours of piperacillin‐tazobactam monotherapy (Cometta 2003). We did not identify studies assessing pre‐emptive antiGP treatment.
Nine trials randomised 1993 patients. Five studies allowed patient re‐entry for separate neutropenic febrile episodes, thus randomising episodes instead of patients. Three trials included 352 episodes representing 292 patients (Del Favero 1987; Erjavec 2000; Menichetti 1986), and two trials included 437 episodes without specifying the number of patients (Lawson 1979; Marie 1991). Overall, 2782 febrile episodes were included and 2549 were evaluated.
All trials included patients with haematological malignancies, except for one trial that was restricted to patients with solid tumours (Molina 1993). One trial included only patients with haematological malignancies (Bucaneve 2014). Two trials did not specify patients' age. In the remaining trials, children less than 16 years were included in six trials, and the mean age ranged between 38 to 48 years. With regard to exclusion of patients at risk for infections due to gram‐positive bacteria, the two first modification trials excluded patients with documented or suspected catheter‐related infections (Cometta 2003; Erjavec 2000). Two empirical studies excluded patients with a documented focus of infection (Marie 1991; Novakova 1991), of which one also excluded patients in septic shock (Marie 1991). Otherwise, no restrictions related to the criteria suggested for empirical antiGP treatment (see Background) were imposed on patient inclusion.
The rate of single‐agent gram‐positive bacteraemia varied between 6% and 28% (Table 1) and did not correlate with the study year.
| Study ID | Study year | GP bacteraemia |
| Empirical | ||
| 1983 | 13% | |
| 1984 | 19% | |
| 1984 | 28% | |
| 1987 | 25% | |
| 1988 | 25% | |
| 1988 | 18% | |
| 1992 | 6% | |
| 2010 | 25% | |
| Semi‐empirical | ||
| 2000 | 11% |
Excluded studies
Twenty studies were excluded. Two studies were excluded on account of a high percentage of dropouts. An EORTC trial randomised 841 patients and evaluated 419 patients (EORTC 1983). Martino and colleagues reported outcomes for a 10‐month period and 158 patients of a trial which was conducted for 15 months and included 232 patients (Martino 1992). The reasons for exclusion of the remaining studies are listed in the Characteristics of excluded studies table.
Risk of bias in included studies
Results are summarised in Figure 2 and Figure 3 and detailed per study in Characteristics of included studies. Generation of the randomisation sequence was described as low risk in 12 of the 14 trials. Allocation concealment was described as low risk in nine trials, and four additional trials used sealed envelopes that were not described as opaque (classified as unclear). The two first modification trials were double‐blinded (Cometta 2003; Erjavec 2000), as was a single empirical trial (Karp 1986). All remaining trials were open‐label.

Risk of bias graph: review authors' judgements about each risk of bias item presented as percentages across all included studies.

Risk of bias summary: review authors' judgements about each risk of bias item for each included study.
Full intention‐to‐treat (ITT) analysis for failure and mortality was reported in four trials (Bucaneve 2014; Cometta 2003; de Pauw 1985; Verhagen 1987) and for mortality alone in two (Menichetti 1986; Novakova 1991). Four additional trials provided the number of patients excluded from each study arm, allowing an ITT analysis by imputing failure for dropouts (Del Favero 1987; Erjavec 2000; Karp 1986; Novakova 1991).
Five trials permitted patient re‐inclusion, referring to episodes or infections instead of individual patients, as stated above ('Other bias'). Results per patient were unavailable from the publication even when the number of included patients was known. Results from these trials were analysed together with the remaining trials.
Patients' consent was reported in eight trials and approval of the ethics committee in four, all of which required patient consent. Eight trials reported funding by industry, while no external sources of funding were stated in the other trials.
Effects of interventions
See: Summary of findings for the main comparison Mortality with anti‐gram‐positive antibiotics compared to placebo for the treatment of febrile neutropenic patients with cancer; Summary of findings 2 Treatment failure with anti‐gram‐positive antibiotics compared to placebo for the treatment of febrile neutropenic patients with cancer; Summary of findings 3 Adverse events with anti‐gram‐positive antibiotics compared to placebo for the treatment of febrile neutropenic patients with cancer
Mortality
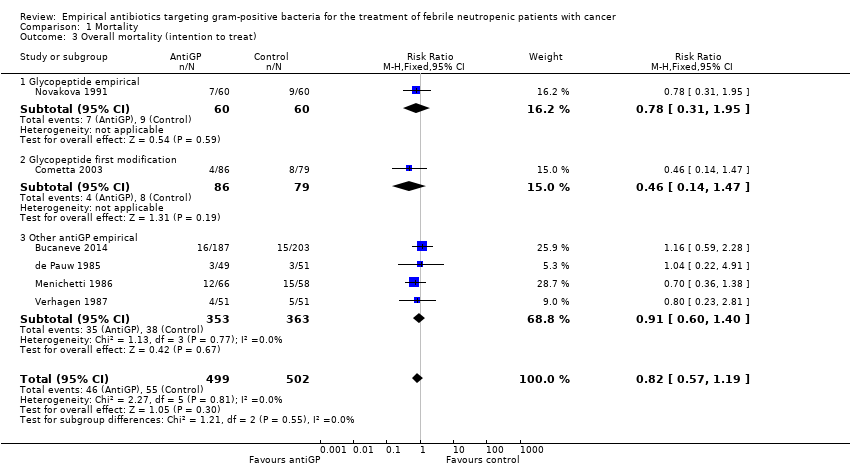
Eight studies, including 1242 participants, reported overall mortality. The adjusted mean mortality rate in these studies was 9.0%. The risk ratio (RR) for death was 0.9 (95% confidence interval (CI) 0.64 to 1.25; 8 studies, 1242 participants; Analysis 1.1), values lower than 1 favouring the antiGP arm. The quality of this evidence was rated as moderate, downgraded for imprecision (summary of findings Table for the main comparison). Two trials used a glycopeptide empirically, two used a glycopeptide semi‐empirically, and four used another antiGP antibiotic empirically. No difference in mortality was seen in each of these groups. Considering only studies with low‐risk allocation concealment, or those reporting mortality by ITT results, the results were similar, below 1 (Analysis 1.2; Analysis 1.3). Overall, no heterogeneity was seen with this comparison, which was performed using the fixed‐effect model (I2 = 0%).
Data regarding mortality among patient subgroups were scarce. Only five studies were included in the comparison for patients in whom a gram‐positive infection was documented (Analysis 1.4). Only 13 deaths were recorded; hence although overall mortality among patients receiving antiGP treatment was almost twice that in the control group, this was not interpreted into a difference. The rate of single‐agent gram‐positive bacteraemia (Table 1) was reported only for five of the studies in the mortality analysis and no association was observed between this rate and the RRs for mortality, but the analysis was limited by the paucity of data with extreme 95% CI for the ratio of odds ratios (ORs). Excluding two studies in which the antiGP was active also against gram‐negative bacteria did not change results (Analysis 1.5). Data for the other pre‐defined subgroup analyses were not available. Inspecting the funnel plot did not reveal a small‐study effect (Figure 4).

Failure.
Eight trials compared infection‐related fatality, two of which did not report overall mortality. The RR was 1.15 (95% CI 0.76 to 1.75; 8 studies, 1810 participants; Analysis 1.6).
Treatment failure
Overall failure, disregarding treatment modifications, was assessed in seven studies including 943 participants and was similar in both study arms (RR 1.00, 95% CI 0.79 to 1.27; 7 studies, 943 participants; Analysis 2.1, low‐quality evidence). When modifications were counted as causes for treatment failure, an advantage in favour of antiGP treatment was evident (RR 0.72, 95% CI 0.65 to 0.79, 11 studies, 2169 participants; Analysis 2.2, very low‐quality evidence). The quality of the evidence for failure was downgraded for lack of blinding for both outcomes and indirectness of the outcome for treatment failure with modifications (summary of findings Table 2). The advantage originated from studies that assessed the initial empirical administration of antiGP antibiotics and was demonstrated both for empirical glycopeptides and other antiGP agents. No benefit was observed for the addition of glycopeptides for persistent fever (first modification), in two double‐blind studies (Cometta 2003; Erjavec 2000; Analysis 2.2). Results were not affected by randomisation methods, with similar direction of effects when the analysis was limited to studies with adequate allocation concealment (Analysis 2.3) or those permitting analysis by ITT(Analysis 2.4). Excluding the double‐blind trials decreased the risk ratio (RR 0.67, 95% CI 0.60 to 0.75), demonstrating the effect of the open design on treatment modifications. The funnel plot for failure was centred approximately symmetrically around the effect estimate (Figure 5).

Mortality.
In subgroup analyses of failure with modifications, when excluding antiGP antibiotics covering gram‐negative bacteria, there was no longer an advantage to non‐glycopeptide empirical antiGP antibiotics (Analysis 2.5). An analysis restricted to patients who ultimately had a gram‐positive infection, was composed of studies assessing empirical antiGP treatment and demonstrated a large advantage to this intervention, (RR 0.56, 95% CI 0.38 to 0.84; 5 studies, 175 patients; Analysis 2.6). Meta‐regression demonstrated no association between the rate of single gram‐positive bacteraemia in the studies and their risk ratio for failure with antiGP treatment. No data were available for the subgroup of patients with central catheters or those having received quinolone prophylaxis.
Duration of fever was not reported comparatively, but three studies compared the number of persistently febrile patients at 72 hours after the initiation of empirical antibiotic treatment (Analysis 2.7). An advantage to the antiGP arm was seen, but the number of patients evaluated was small (312 patients). Amphotericin was added more frequently to the control arm (RR 1.23, 95% CI 0.84 to 1.80, 5 studies, 1201 participants, Analysis 2.8). Substantial heterogeneity was seen in the comparisons of persistent fever and addition of amphotericin, which were analysed using the random‐effects model.
Superinfections and adverse events
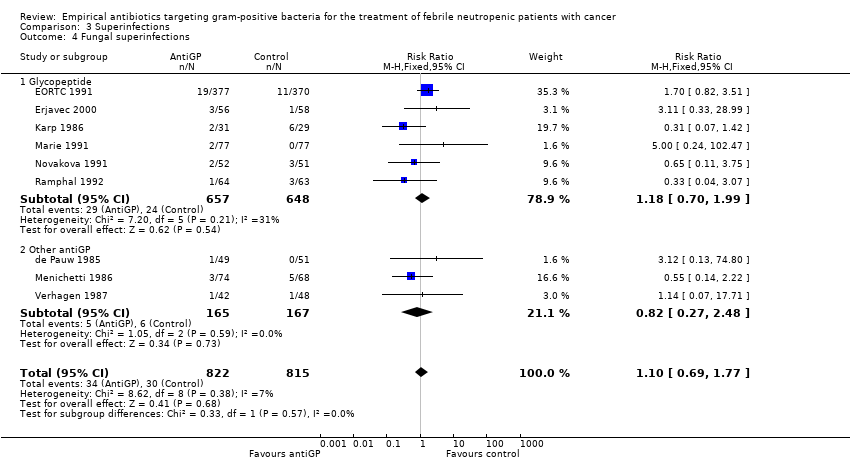
AntiGP treatment did not increase superinfection rates (Analysis 3.1). Focusing on bacterial superinfections, we observed a decrease with antiGPs (RR 0.41, 95% CI 0.27 to 0.6, Analysis 3.2); specifically gram‐positive superinfections (RR 0.24, 95% CI 0.14 to 0.4, Analysis 3.3). The rate of fungal superinfections was similar in both arms (RR 1.04, 95% CI 0.60 to 1.82, Analysis 3.4). No study assessed the effect of additional antiGP treatment on the rate of colonisation with resistant microorganisms or development of resistance.
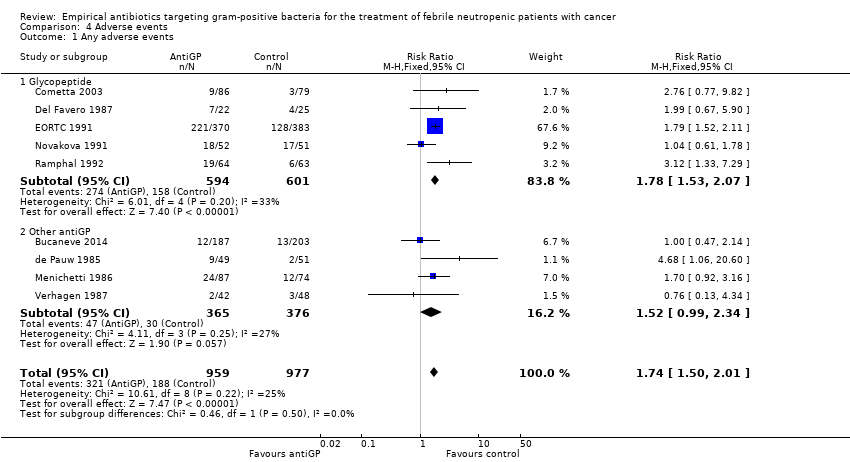
Adverse events were more frequent in the antiGP arm (Analysis 4.1) (summary of findings Table 3) with very low quality of evidence. However, this originated mainly from a difference in skin reactions (Analysis 4.2) rather than in adverse events incurring significant morbidity. Nephrotoxicity did not differ between the study groups (Analysis 4.3).
Other outcomes
Duration of hospital stay was inconsistently reported and summarised heterogeneously, as means or medians without appropriate CIs, in the included trials. Thus results could not be combined. Duration of fever and removal of central catheters were not reported in the studies.
Discussion
We show that the current evidence does not point to a reduction in the risk of death with the empirical addition of anti‐gram‐positive (antiGP) antibiotics. Twelve studies assessed their addition to the initial antibiotic regimen among non‐selected febrile neutropenic patients. Two studies assessed their addition after 48 to 72 hours of persistent fever. Both combined and separately, these studies show that there is no difference in overall 30‐day patient mortality (RR 0.90, 95% CI 0.64 to 1.25) (summary of findings Table for the main comparison). Failure of the empirical antibiotic regimen, denoting mainly the need to add or change antibiotic therapy, was more common in the control arm in studies assessing the initial, empirical, addition of antiGP treatment. No such advantage was demonstrated for the addition of glycopeptides for persistent fever. Most studies included in the review were conducted at the time when practice guidelines suggested the addition of empirical antiGP treatment on day three to five for persistent fever (Hughes 1990). Similarly, amphotericin was added more frequently to the control arm. Current guidelines advise addition of antifungal therapy on day five to seven for persistent fever with neutropenia (Freifeld 2011). Thus, treatment modifications and the addition of amphotericin may represent persistence of fever regardless of the incidence of uncontrolled infection or fungal infections. Overall failure, whether or not antibiotic treatment was modified, was equal in both study arms (summary of findings Table 2). Results were similar when analysing the subgroup of patients ultimately diagnosed with gram‐positive infections and, similarly, there was no association between the percentage of gram‐positive bacteria among bacteraemic patients in each trial and the RR for mortality or treatment failure. The rate of antiGP infections did not correlate with study year as expected, possibly due to the differing locations and inclusion criteria of the studies included in the review. The quality of the evidence ranged from moderate for mortality to very low for failure comprising treatment modifications.
In this update, one trial examining the effects of empirical tigecycline added to a backbone of piperacillin‐tazobactam was included to the review and did not change the overall conclusions (Bucaneve 2014). The addition of this study led to a new subgroup analysis of antiGP whose spectrum comprises and might enhance coverage against gram‐negative bacteria. Exclusion of two such trials ( Bucaneve 2014, Menichetti 1986) from the mortality analysis cancelled the advantage of empirical non‐glycopeptide antiGP treatment.
Adverse events were more common in the antiGP arm as expected, but the difference was in minor adverse events (summary of findings Table 3). The most feared adverse outcome of adding an antibiotic, especially a glycopeptide, is the induction or selection of resistance. Studies conducted in other settings have shown that excessive use of glycopeptides is associated with increased rates of vancomycin‐resistant enterococci and, vancomycin‐resistant staphylococci (Gardete 2014). Studies included in this review assessed superinfection rates and these did not increase in the antiGP arm. Rather, gram‐positive bacterial superinfections were reduced in the treatment arm, possibly reflecting reduced detection of these infections in the presence of antiGP antibiotic treatment. However, there are no data on colonisation from these studies. Therefore, we do not know whether patients treated with glycopeptides were more likely to carry resistant gram‐positive bacteria, an important factor when considering future infections and the environment. The assessment of resistance induction may require a longer timescale than possible in randomised trials.
Several limitations of our analysis should be noted. Firstly, all‐cause mortality was reported only in eight of 14 included studies. We contacted the authors of the six studies with missing mortality data, of which four replied that the data could no longer be retrieved. Secondly, the definition for treatment failure varied between studies, such that we could not combine all studies to assess treatment failure, with or without treatment modifications. We have encountered methodological issues in included studies, which we could not correct for in the meta‐analysis. Randomising patients more than once creates episode clusters in which individual outcomes are not independent. Since data could not be extracted only for the first episode of each included patient, we could not enter the data correctly for the analysis. ITT analysis was frequently missing and could not be reproduced since the number of patients excluded from each study arm was not consistently reported. While the handling of loss to follow‐up with regard to measurable outcomes must entail some assumptions (carry‐over, imputations, etc.), all randomised patients can be included in the all‐cause mortality comparison. Adequate randomisation should ensure that deaths unrelated to infection are equally distributed between trial arms. Finally, our results pertain to patients with uncomplicated low‐ or high‐risk febrile neutropenia, that is patients presenting without specific risk factors such as catheter‐related infection, skin or soft‐tissue infection, pneumonia, or haemodynamic instability, who were excluded from all existing trials. Current guidelines recommend empirical glycopeptide treatment for these patients (Freifeld 2011).

Study flow diagram.

Risk of bias graph: review authors' judgements about each risk of bias item presented as percentages across all included studies.

Risk of bias summary: review authors' judgements about each risk of bias item for each included study.


Comparison 1 Mortality, Outcome 1 Overall mortality.

Comparison 1 Mortality, Outcome 2 Overall mortality (adequate allocation concealment).
Comparison 1 Mortality, Outcome 3 Overall mortality (intention to treat).

Comparison 1 Mortality, Outcome 4 Mortality in Gram‐positive infections.
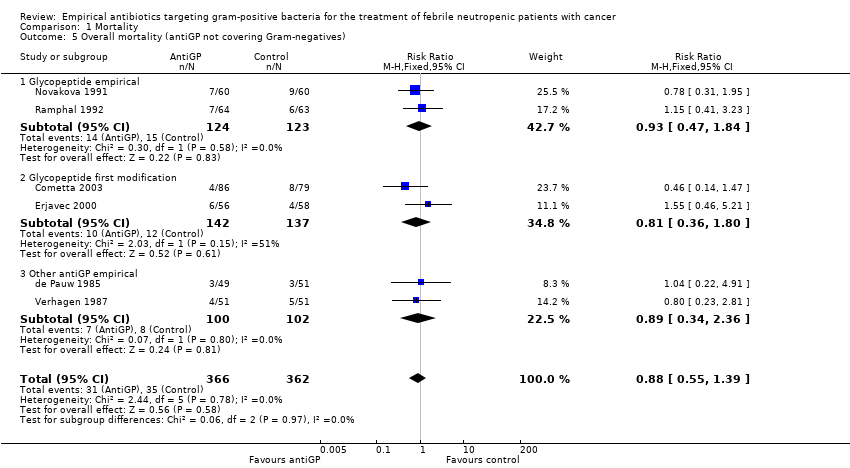
Comparison 1 Mortality, Outcome 5 Overall mortality (antiGP not covering Gram‐negatives).
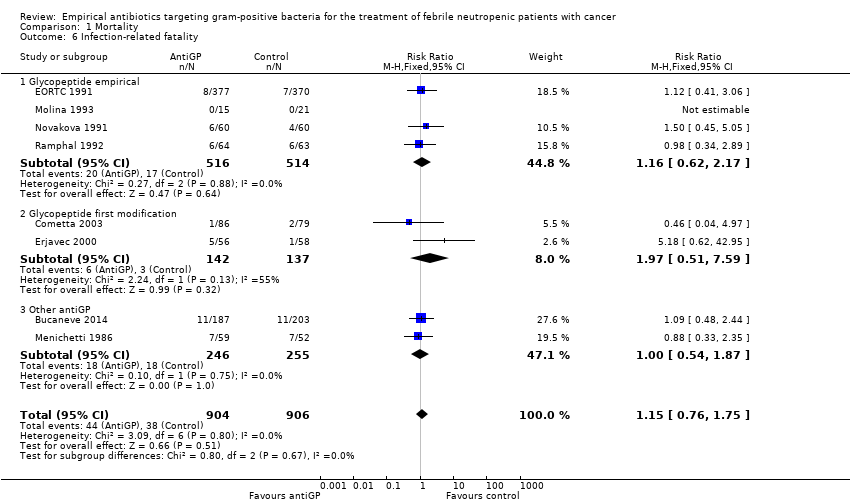
Comparison 1 Mortality, Outcome 6 Infection‐related fatality.

Comparison 2 Treatment failure, Outcome 1 Overall failure (disregarding modifications).

Comparison 2 Treatment failure, Outcome 2 Failure, modifications included.

Comparison 2 Treatment failure, Outcome 3 Failure, modifications included (adequate allocation concealment).

Comparison 2 Treatment failure, Outcome 4 Failure, modifications included (intention to treat).

Comparison 2 Treatment failure, Outcome 5 Failure, modifications included (antiGP not covering Gram‐negatives).

Comparison 2 Treatment failure, Outcome 6 Failure in Gram‐positive infections.
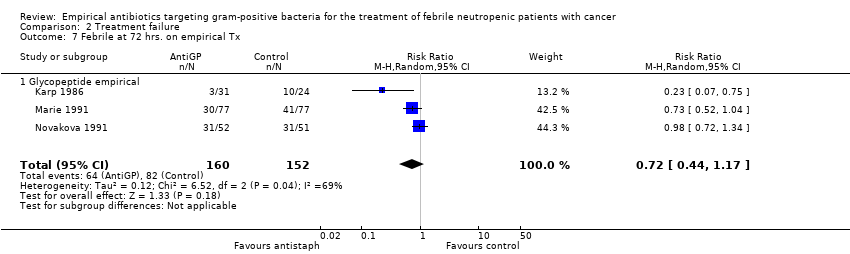
Comparison 2 Treatment failure, Outcome 7 Febrile at 72 hrs. on empirical Tx.

Comparison 2 Treatment failure, Outcome 8 Addition of amphotericin.

Comparison 3 Superinfections, Outcome 1 Any superinfections.

Comparison 3 Superinfections, Outcome 2 Bacterial superinfections.

Comparison 3 Superinfections, Outcome 3 Gram‐positive superinfections.
Comparison 3 Superinfections, Outcome 4 Fungal superinfections.
Comparison 4 Adverse events, Outcome 1 Any adverse events.

Comparison 4 Adverse events, Outcome 2 Rash/ allergy.

Comparison 4 Adverse events, Outcome 3 Any nephrotoxicity.
| Mortality with anti‐gram‐positive antibiotics compared to placebo for the treatment of febrile neutropenic patients with cancer | ||||||
| Patient or population: febrile neutropenic patients with cancer | ||||||
| Outcomes | Anticipated absolute effects* (95% CI) | Relative effect | № of participants | Quality of the evidence | Comments | |
| Risk with placebo | Risk with anti gram‐positive antibiotics | |||||
| Overall mortality | Study population | RR 0.90 | 1242 | ⊕⊕⊕⊝ | ||
| 104 per 1,000 | 94 per 1,000 | |||||
| *The risk in the intervention group (and its 95% confidence interval) is based on the assumed risk in the comparison group and the relative effect of the intervention (and its 95% CI). | ||||||
| GRADE Working Group grades of evidence | ||||||
| 1 Lack of blinding should not affect the objective outcome of mortality 2 Wide CI ranging from a large benefit of anti‐gram‐positive antibiotics to possible harm | ||||||
| Treatment failure with anti gram‐positive antibiotics compared to placebo for the treatment of febrile neutropenic patients with cancer | ||||||
| Patient or population: febrile neutropenic patients with cancer | ||||||
| Outcomes | Anticipated absolute effects* (95% CI) | Relative effect | № of participants | Quality of the evidence | Comments | |
| Risk with placebo | Risk with treatment failure | |||||
| Overall failure (disregarding modifications) | Study population | RR 1.00 | 943 | ⊕⊕⊝⊝ | ||
| 187 per 1,000 | 187 per 1,000 | |||||
| Failure, modifications included | Study population | RR 0.72 | 2169 | ⊕⊝⊝⊝ | ||
| 463 per 1,000 | 333 per 1,000 | |||||
| *The risk in the intervention group (and its 95% confidence interval) is based on the assumed risk in the comparison group and the relative effect of the intervention (and its 95% CI). | ||||||
| GRADE Working Group grades of evidence | ||||||
| 1 Lack of blinding in most studies, subjective outcome 2 Indirectness: outcome driven by treatment modifications, an outcome not relevant to this patient population | ||||||
| Adverse events with anti gram‐positive antibiotics compared to placebo for the treatment of febrile neutropenic patients with cancer | ||||||
| Patient or population: febrile neutropenic patients with cancer | ||||||
| Outcomes | Anticipated absolute effects* (95% CI) | Relative effect | № of participants | Quality of the evidence | Comments | |
| Risk with placebo | Risk with Adverse events | |||||
| Any adverse events | Study population | RR 1.74 | 1936 | ⊕⊝⊝⊝ | ||
| 192 per 1,000 | 335 per 1,000 | |||||
| *The risk in the intervention group (and its 95% confidence interval) is based on the assumed risk in the comparison group and the relative effect of the intervention (and its 95% CI). | ||||||
| GRADE Working Group grades of evidence | ||||||
| 1 Lack of blinding 2 Adverse events were not described in all studies and are interpreted differently in each study | ||||||
| Study ID | Study year | GP bacteraemia |
| Empirical | ||
| 1983 | 13% | |
| 1984 | 19% | |
| 1984 | 28% | |
| 1987 | 25% | |
| 1988 | 25% | |
| 1988 | 18% | |
| 1992 | 6% | |
| 2010 | 25% | |
| Semi‐empirical | ||
| 2000 | 11% |
| Outcome or subgroup title | No. of studies | No. of participants | Statistical method | Effect size |
| 1 Overall mortality Show forest plot | 8 | 1242 | Risk Ratio (M‐H, Fixed, 95% CI) | 0.90 [0.64, 1.25] |
| 1.1 Glycopeptide empirical | 2 | 247 | Risk Ratio (M‐H, Fixed, 95% CI) | 0.93 [0.47, 1.84] |
| 1.2 Glycopeptide first modification | 2 | 279 | Risk Ratio (M‐H, Fixed, 95% CI) | 0.81 [0.36, 1.80] |
| 1.3 Other antiGP empirical | 4 | 716 | Risk Ratio (M‐H, Fixed, 95% CI) | 0.91 [0.60, 1.40] |
| 2 Overall mortality (adequate allocation concealment) Show forest plot | 7 | 1118 | Risk Ratio (M‐H, Fixed, 95% CI) | 0.96 [0.66, 1.40] |
| 2.1 Glycopeptide empirical | 2 | 247 | Risk Ratio (M‐H, Fixed, 95% CI) | 0.93 [0.47, 1.84] |
| 2.2 Glycopeptide first modification | 2 | 279 | Risk Ratio (M‐H, Fixed, 95% CI) | 0.81 [0.36, 1.80] |
| 2.3 Other antiGP empirical | 3 | 592 | Risk Ratio (M‐H, Fixed, 95% CI) | 1.06 [0.61, 1.85] |
| 3 Overall mortality (intention to treat) Show forest plot | 6 | 1001 | Risk Ratio (M‐H, Fixed, 95% CI) | 0.82 [0.57, 1.19] |
| 3.1 Glycopeptide empirical | 1 | 120 | Risk Ratio (M‐H, Fixed, 95% CI) | 0.78 [0.31, 1.95] |
| 3.2 Glycopeptide first modification | 1 | 165 | Risk Ratio (M‐H, Fixed, 95% CI) | 0.46 [0.14, 1.47] |
| 3.3 Other antiGP empirical | 4 | 716 | Risk Ratio (M‐H, Fixed, 95% CI) | 0.91 [0.60, 1.40] |
| 4 Mortality in Gram‐positive infections Show forest plot | 5 | 195 | Risk Ratio (M‐H, Fixed, 95% CI) | 1.73 [0.58, 5.12] |
| 5 Overall mortality (antiGP not covering Gram‐negatives) Show forest plot | 6 | 728 | Risk Ratio (M‐H, Fixed, 95% CI) | 0.88 [0.55, 1.39] |
| 5.1 Glycopeptide empirical | 2 | 247 | Risk Ratio (M‐H, Fixed, 95% CI) | 0.93 [0.47, 1.84] |
| 5.2 Glycopeptide first modification | 2 | 279 | Risk Ratio (M‐H, Fixed, 95% CI) | 0.81 [0.36, 1.80] |
| 5.3 Other antiGP empirical | 2 | 202 | Risk Ratio (M‐H, Fixed, 95% CI) | 0.89 [0.34, 2.36] |
| 6 Infection‐related fatality Show forest plot | 8 | 1810 | Risk Ratio (M‐H, Fixed, 95% CI) | 1.15 [0.76, 1.75] |
| 6.1 Glycopeptide empirical | 4 | 1030 | Risk Ratio (M‐H, Fixed, 95% CI) | 1.16 [0.62, 2.17] |
| 6.2 Glycopeptide first modification | 2 | 279 | Risk Ratio (M‐H, Fixed, 95% CI) | 1.97 [0.51, 7.59] |
| 6.3 Other antiGP | 2 | 501 | Risk Ratio (M‐H, Fixed, 95% CI) | 1.00 [0.54, 1.87] |
| Outcome or subgroup title | No. of studies | No. of participants | Statistical method | Effect size |
| 1 Overall failure (disregarding modifications) Show forest plot | 7 | 943 | Risk Ratio (M‐H, Fixed, 95% CI) | 1.00 [0.79, 1.27] |
| 1.1 Glycopeptide empirical | 3 | 293 | Risk Ratio (M‐H, Fixed, 95% CI) | 1.09 [0.28, 4.20] |
| 1.2 Glycopeptide first modification | 1 | 165 | Risk Ratio (M‐H, Fixed, 95% CI) | 0.61 [0.18, 2.09] |
| 1.3 Other antiGP empirical | 3 | 485 | Risk Ratio (M‐H, Fixed, 95% CI) | 1.03 [0.81, 1.32] |
| 2 Failure, modifications included Show forest plot | 11 | 2169 | Risk Ratio (M‐H, Fixed, 95% CI) | 0.72 [0.65, 0.79] |
| 2.1 Glycopeptide empirical | 5 | 1178 | Risk Ratio (M‐H, Fixed, 95% CI) | 0.70 [0.61, 0.80] |
| 2.2 Glycopeptide first modification | 2 | 279 | Risk Ratio (M‐H, Fixed, 95% CI) | 0.98 [0.79, 1.22] |
| 2.3 Other antiGP empirical | 4 | 712 | Risk Ratio (M‐H, Fixed, 95% CI) | 0.62 [0.51, 0.77] |
| 3 Failure, modifications included (adequate allocation concealment) Show forest plot | 7 | 1101 | Risk Ratio (M‐H, Fixed, 95% CI) | 0.78 [0.68, 0.89] |
| 3.1 Glycopeptide empirical | 2 | 230 | Risk Ratio (M‐H, Fixed, 95% CI) | 0.80 [0.59, 1.08] |
| 3.2 Glycopeptide first modification | 2 | 279 | Risk Ratio (M‐H, Fixed, 95% CI) | 0.98 [0.79, 1.22] |
| 3.3 Other antiGP empirical | 3 | 592 | Risk Ratio (M‐H, Fixed, 95% CI) | 0.66 [0.53, 0.81] |
| 4 Failure, modifications included (intention to treat) Show forest plot | 7 | 1068 | Risk Ratio (M‐H, Fixed, 95% CI) | 0.79 [0.69, 0.90] |
| 4.1 Glycopeptide empirical | 2 | 186 | Risk Ratio (M‐H, Fixed, 95% CI) | 0.81 [0.61, 1.08] |
| 4.2 Glycopeptide first modification | 2 | 290 | Risk Ratio (M‐H, Fixed, 95% CI) | 1.00 [0.81, 1.23] |
| 4.3 Other antiGP empirical | 3 | 592 | Risk Ratio (M‐H, Fixed, 95% CI) | 0.66 [0.53, 0.81] |
| 5 Failure, modifications included (antiGP not covering Gram‐negatives) Show forest plot | 9 | 1659 | Risk Ratio (M‐H, Fixed, 95% CI) | 0.78 [0.69, 0.87] |
| 5.1 Glycopeptide empirical | 5 | 1178 | Risk Ratio (M‐H, Fixed, 95% CI) | 0.70 [0.61, 0.80] |
| 5.2 Glycopeptide first modification | 2 | 279 | Risk Ratio (M‐H, Fixed, 95% CI) | 0.98 [0.79, 1.22] |
| 5.3 Other antiGP empirical | 2 | 202 | Risk Ratio (M‐H, Fixed, 95% CI) | 1.02 [0.62, 1.67] |
| 6 Failure in Gram‐positive infections Show forest plot | 5 | 175 | Risk Ratio (M‐H, Fixed, 95% CI) | 0.56 [0.38, 0.84] |
| 7 Febrile at 72 hrs. on empirical Tx Show forest plot | 3 | 312 | Risk Ratio (M‐H, Random, 95% CI) | 0.72 [0.44, 1.17] |
| 7.1 Glycopeptide empirical | 3 | 312 | Risk Ratio (M‐H, Random, 95% CI) | 0.72 [0.44, 1.17] |
| 8 Addition of amphotericin Show forest plot | 5 | 1201 | Risk Ratio (M‐H, Random, 95% CI) | 1.23 [0.84, 1.80] |
| 8.1 Non‐blinded | 3 | 976 | Risk Ratio (M‐H, Random, 95% CI) | 1.51 [0.80, 2.83] |
| 8.2 Double blind | 2 | 225 | Risk Ratio (M‐H, Random, 95% CI) | 0.99 [0.75, 1.33] |
| Outcome or subgroup title | No. of studies | No. of participants | Statistical method | Effect size |
| 1 Any superinfections Show forest plot | 10 | 1896 | Risk Ratio (M‐H, Fixed, 95% CI) | 0.84 [0.66, 1.08] |
| 1.1 Glycopeptide | 6 | 1281 | Risk Ratio (M‐H, Fixed, 95% CI) | 0.87 [0.67, 1.13] |
| 1.2 Other antiGP | 4 | 615 | Risk Ratio (M‐H, Fixed, 95% CI) | 0.73 [0.38, 1.40] |
| 2 Bacterial superinfections Show forest plot | 9 | 1992 | Risk Ratio (M‐H, Fixed, 95% CI) | 0.41 [0.27, 0.60] |
| 2.1 Glycopeptide | 5 | 1296 | Risk Ratio (M‐H, Fixed, 95% CI) | 0.38 [0.24, 0.59] |
| 2.2 Other antiGP | 4 | 696 | Risk Ratio (M‐H, Fixed, 95% CI) | 0.52 [0.23, 1.15] |
| 3 Gram‐positive superinfections Show forest plot | 9 | 1688 | Risk Ratio (M‐H, Fixed, 95% CI) | 0.24 [0.14, 0.40] |
| 3.1 Glycopeptide | 6 | 1356 | Risk Ratio (M‐H, Fixed, 95% CI) | 0.21 [0.11, 0.37] |
| 3.2 Other antiGP | 3 | 332 | Risk Ratio (M‐H, Fixed, 95% CI) | 0.46 [0.15, 1.45] |
| 4 Fungal superinfections Show forest plot | 9 | 1637 | Risk Ratio (M‐H, Fixed, 95% CI) | 1.10 [0.69, 1.77] |
| 4.1 Glycopeptide | 6 | 1305 | Risk Ratio (M‐H, Fixed, 95% CI) | 1.18 [0.70, 1.99] |
| 4.2 Other antiGP | 3 | 332 | Risk Ratio (M‐H, Fixed, 95% CI) | 0.82 [0.27, 2.48] |
| Outcome or subgroup title | No. of studies | No. of participants | Statistical method | Effect size |
| 1 Any adverse events Show forest plot | 9 | 1936 | Risk Ratio (M‐H, Fixed, 95% CI) | 1.74 [1.50, 2.01] |
| 1.1 Glycopeptide | 5 | 1195 | Risk Ratio (M‐H, Fixed, 95% CI) | 1.78 [1.53, 2.07] |
| 1.2 Other antiGP | 4 | 741 | Risk Ratio (M‐H, Fixed, 95% CI) | 1.52 [0.99, 2.34] |
| 2 Rash/ allergy Show forest plot | 7 | 1526 | Risk Ratio (M‐H, Fixed, 95% CI) | 2.31 [1.47, 3.63] |
| 2.1 Glycopeptide | 5 | 1336 | Risk Ratio (M‐H, Fixed, 95% CI) | 2.33 [1.43, 3.80] |
| 2.2 Other antiGP | 2 | 190 | Risk Ratio (M‐H, Fixed, 95% CI) | 2.17 [0.65, 7.30] |
| 3 Any nephrotoxicity Show forest plot | 10 | 1916 | Risk Ratio (M‐H, Fixed, 95% CI) | 1.28 [0.96, 1.70] |
| 3.1 Glycopeptide | 6 | 1282 | Risk Ratio (M‐H, Fixed, 95% CI) | 1.43 [1.06, 1.94] |
| 3.2 Other antiGP | 4 | 634 | Risk Ratio (M‐H, Fixed, 95% CI) | 0.84 [0.40, 1.75] |