Psicoterapia individual en el tratamiento ambulatorio de adultos con anorexia nerviosa
Referencias
Referencias de los estudios incluidos en esta revisión
Referencias de los estudios excluidos de esta revisión
Referencias adicionales
Characteristics of studies
Characteristics of included studies [ordered by study ID]
Ir a:
| Methods | Randomized controlled trial (RCT), duration of treatment was for a year, followed by one year of follow‐up. Treatment integrity was done by written or recorded sessions, blinding of outcome evaluation was unclear, ITT was not included. | |
| Participants | 13 female patients with anorexia nervosa (DSM‐IV) | |
| Interventions | Self psychological treatment vs cognitive orientation. Both groups had nutritional counselling. | |
| Outcomes | DSM Symptomatology Scare, Eating Attitudes Test (EAT 26), Global Severity Index (GSI) and Selves Questionnaire | |
| Notes | Blinding of the outcome unclear, allocation of concealment not mentioned and specific outcome data was not avalable for anorexia nervosa participants. Sequence Genereation: The bulimia group was divided into the control, self psychotherapy and cognitive orientation therapy groups, and the anorexia group was divided into the COT and SPT group such that both intervention groups had 17 people and the control group had 10 people: "The 31 bulimic patients were randomly assigned to the three groups in the following numbers: 10 in SPT, 11 in COT, and 10 in C/NC. The 13 anorexic patients were randomly assigned to the two psychological treatment groups: 7 in SPT and 6 in COT. Thus, the total number of patients in each group at the beginning of this study was 17 in SPT, 17 in COT, and 10 in C/NC." ‐ allocation sequence was adequately generated. Incomplete Outcome Data: Specific outcome data was not made available for anorexia (only mentioned for bulimia). There was no explanation given as to why. Numbers were given for drop‐outs, but no explanations: "Finally, one of the inherent problems with treatment studies is dropout. We know that the dropouts in the present study did not differ on any of the sociodemographic data or on the baseline of any of the outcome measures. But we do not know whether they have gone elsewhere for therapy or whether they differed on a crucial and yet unquantifiable measure of willingness to be cured. The dropout rate in our sample was 25%." ‐ incomplete outcome data was not completely addressed. Selective Outcome Reporting: Considerable attrition of data, no explanations given for drop‐outs. There was also no ITT. Also, as mentioned previously, specific outcome data was omitted for anorexia.There was no reporting of potential conflicts of interest: "We did not implement an intent‐to‐treat analysis because the dropouts in our study left within the first few sessions of the therapy, which lasted one year." There was also bias in the selection stradegy in that subjects were "from families belonging to the upper middle class" even though "The target population for this study consisted of all the bulimic and anorexic patients who were referred to the eating disorder units of the psychiatry departments of two general hospitals in Israel" (at least mentions the area from which subjects were selected. There were no inclusion and exclusion criteria for subjects detailed in this paper ‐ the lack of ITT in particular is indicative of selective outcome reporting. Also, the attrition of anorexia data could be indicative of this. Risk of bias ‐ present | |
| Risk of bias | ||
| Bias | Authors' judgement | Support for judgement |
| Allocation concealment? | Unclear risk | B ‐ Unclear |
| Methods | RCT of a treatment for 19 anorexia nervosa and 13 bulimia nervosa patients. Randomization by computer generation and allocations were kept in sealed envelopes. No comparative data of treatment outcome is presented for active and control groups in the published paper but this was supplied later by the authors. Cisapride was administered to seven anorexia nervosa patients. Four patients were treated as inpatients for between 8 and 30 days. It was unclear if outcome ratings were blind to group status. | |
| Participants | 19 patients with anorexia nervosa (DSM‐IV). Median age was 16 (range 10‐33). 19 of 47 screened (40%) participated. | |
| Interventions | The treatment incorporated computer supported feedback to participants on satiety ratings. The approach was predomiantly nutritional and behavioural.Controls were placed on a wait‐list of variable duration (7.1‐21.6 months). | |
| Outcomes | Remission (defined as no longer meeting criteria for an eating disorder). Body weight, psychiatric profile and laboratory tests were normal. Patients had to state food and dieting were no longer problems and they were back in school or professional activites. | |
| Notes | Data as to the numbers of anorexia nervosa patients assigned to active treatment and control groups (10 and 8 respectively) was provided by the authors. Sequence Generation: "We used a computer‐generated randomization list to assign patients to treatment or deferred treatment. Randomization was done in blocks of four consecutive patients at the time of the initial evaluation." ‐ the allocation sequence was adequately generated. Allocation concealment: "Treatment allocations were kept in numbered sealed envelopes." ‐ allocation was adequately concealed. Blinding: It was unclear if outcome ratings were blind to group status. ‐ Treatment allocation was adequately blinded but it was unclear whether outcome ratings were blind to group status. Incomplete Outcome Data: No comparative data of traetment outcome is presented for active and control groups in the published paper: There was very little detail presented in this regard; only a graph comparing the control to the active treatment group only in terms of percentage of group in remission. ‐ incomplete outcome data was not adequately addressed. Selective Outcome Reporting: Authors did not give comprehensive details on the selection strategy of subjects (specifically the area from which they were picked). Inclusion criteria was given as a reference to the Diagnostic and Statistical Manual of Mental Disorders(DSM)‐IV). No comparative data of traetment outcome is presented for active and control groups in the published paper: There was very little detail presented in this regard; only a graph comparing the control to the active treatment group only in terms of percentage of group in remission: ‐ it is possible that there was selective outcome reporting. Risk of bias ‐ present | |
| Risk of bias | ||
| Bias | Authors' judgement | Support for judgement |
| Allocation concealment? | Low risk | A ‐ Adequate |
| Methods | Randomized controlled trial (RCT), duration of treatment was 6 months and follow‐up was one year. All treatment sessions were audiotaped, outcome evaluation was not blind, ITT by withdrawals followed up and included in analysis. | |
| Participants | 24 female patients with anorexia nervosa (Russell's 1983 criteria) Mean age 23.84 years. 29% of those screened were excluded. | |
| Interventions | Cognitive behavioural therapy vs behavioural therapy vs specialist eclectic therapy. | |
| Outcomes | BMI, Morgan and Russell interview and Self report measures of Eating Disorders Inventory (EDI), Beck Depression Inventory (BDI), Maudsley Obsessive‐ Compulsive Inventory and preferred weight. | |
| Notes | Sequence allocation: "Restricted randomisation was made in blocks of six, so that equal numbers of Ss were entered into each group after every six referrals." The sequence allocation was not adequately described. Blinding: Outcome evaluation was not blind. No mention of any other blinding. Incomplete Outcome Data: "There were no dropouts in the cognitive‐behavioural group. One subject in the behavioural group and two in the control treatment dropped out during the 12‐month follow‐up period, but were seen at the appropriate assessment intervals and included in the analysis." There was no reason given for this drop‐out. ITT by withdrawals followed up and included in analysis (information given by authors on request). Incomplete outcome data was adequately addressed. Selective Outcome Reporting: Authors gave sufficient detail on where patients came from and the inclusion criteria for subjects in this study which reducing the risk of selective outcome reporting. "The Ss were a series of female outpatients from the Eating Disorders Clinic of the Maudsley Hospital, London, who were referred for the trial during the 15month intake period, and who met Russell's (1983) diagnostic criteria for anorexia nervosa. Patients with bulimic features were accepted only if they also met the diagnostic criteria for anorexia nervosa. There was no selection for the amount of treatment received prior to acceptance into the trial. Thirty‐four patients were referred for an initial assessment, and 24 of these met the admission criteria for the trial." Risk of bias ‐ present | |
| Risk of bias | ||
| Bias | Authors' judgement | Support for judgement |
| Allocation concealment? | Unclear risk | B ‐ Unclear |
| Methods | Randomized controlled trial (RCT), duration of treatment was for a year, no follow‐up reported beyond this, treatment was closely supervised but integrity not formally assessed, outcome evaluation was not blind, ITT by estimation of outcome. | |
| Participants | 84 (two men) with anorexia nervosa (DSM‐IV) Mean age 26.3 years and all >18 years. | |
| Interventions | Focal psychoanalytic psychotherapy (1 year) vs cognitive analytic therapy (7 months) vs Family therapy (1 year) vs routine treatment (1 year). 'Routine treatment' was a low‐contact management, the usual practice of an eating disorder service in which specialist treatments are not used. Therapist were mid‐level trainee psychiatrists who changed rotations each 6 months. Sessions were 30 minutes with weekly supervision over one year. Therapy included psycho‐education, supportive encouragement towards a more healthy diet, and regular monitoring of weight and physical state. | |
| Outcomes | Morgan and Russell interview and BMI | |
| Notes | The CAT was not 'purely' individual in that it included some contact between parents and/or the partner of the patient, and their relationship to the therapy and patient was a topic of treatment. Sequence generation: “A stratified randomization procedure – the minimization method (Pocock 1983) was used to control for the age of onset and the duration of the illness, the presence of bulimic symptoms and marital status.” ‐ allocation sequence was adequately generated. Allocation concealment: no method of allocation concealment mentioned. Blinding: Subjects were blinded to which treatment group they would join, but at follow up the patients experiences of therapy were explored at the end of the interview, so they were no longer blinded (outcome evaluation not blind).: “The initial assessment was blind to the treatment to which the patients would be allocated. At the follow up assessments, the patients’ experiences of therapy were explored at the end of the interview, and therefore the follow‐up research clinician was not blind to the treatment.” ‐ Blinding was performed to the extent it could have been since the follow up involved an interview discussion of the patient's experiences. Incomplete outcome data: All outcomes were followed up for 1 year, but only 73% of patients at the beginning were followed‐up after one year (with telephone follow up for a further 11%). Researchers were transparent in their reporting of data, especially drop‐outs, but did not give explanations for drop‐outs. ITT reported by estimation of outcome. ‐ Outcome follow up was incomplete in spite of best efforts. Selective outcome reporting: Authors were transparent about numbers but not explanations on drop‐outs. There were no reports of potential conflicts of interest. Authors were transparent about power of the study and were also transparent about inclusion and exclusion criteria for subjects (reducing potential for bias: this is written in the "Patients" subheading in the study). The area the patients came from was mentioned ("psychiatric teaching hospital, the Maudsley) ‐ It is possible but unlikely that there was selective outcome reporting. Risk of bias ‐ present | |
| Risk of bias | ||
| Bias | Authors' judgement | Support for judgement |
| Allocation concealment? | Low risk | A ‐ Adequate |
| Methods | Randomized controlled trial (RCT), duration of treatment was 20 sessions over a minumum of 20 weeks. Treatment integrity was done and sessions were recorded, blinding of outcome evaluation was done, ITT was included (by carrying forward the last observation). Randomisation was computer generated and sealed envelopes were used for allocation concealment. Follow‐up is ongoing at 3,6,9,12 months and 2,3,5 years post‐treatment. | |
| Participants | 56 female patients with anorexia nervosa (DSM‐IV criteria) of EDNOS AN (lenient weight BMI 17.5‐19, DSM‐IV criteria) without amenorrheoa criteria being imposed. Age 17‐40 years. 42% of those screened were excluded. | |
| Interventions | Cognitive behaviour therapy vs interpersonal psychotherapy vs nonspecific clinical management. | |
| Outcomes | Primary outcome: clinician global rating: 4=full criteria for spectrum AN, 3=number of features of AN but not full criteria, 2= few features of an eating disorder, 1= no significant features of eating disorders | |
| Notes | Moderately high exclusion rate: 400 inquiries, 135 individuals interviewed, 78 deemed eligible. Sequence Generation: randomization was computer generated (wrote to author to find out). ‐ allocation sequnce was adequate. Allocation concealment: envelopes were used for allocation concealment (wrote to author to find this out). ‐ Allocation concealment was sufficient. Blinding: Blinding of outcome evaluation was done (found out from author). ‐ Knowledge of the allocated interventions were adequately prevented during the study. Incomplete outcome data: Outcome data was complete for all subjects who completed the study. There were many few drop‐outs, but these all well explained and well accounted for, and ITT analysis was performed by carrying last observation forward. ‐ Incomplete outcome data was properly addressed with ITT and through accountability. Selective outcome reporting: authors were transparent about potential sources of support (therefore reducing sources of bias) (Supported by project (97/144) and program grants from the Health Research Council of New Zealand.) Furthermore there was a considerably high exclusion rate of subjects, suggesting that there is the possibility of selecting subjects with biased judgement. Authors were quite transparent about selection stradegy for patients: "The inclusion criteria for this study were female gender, an age of 17–40 years, and the presence of current primary anorexia nervosa; the participants included individuals diagnosed according to the DSM‐IV weight criterion (body mass index, <17.5), which was considered to be a strict definition of anorexia nervosa, andthose diagnosed according to a lenient weight criterion (body Risk of bias ‐ low | |
| Risk of bias | ||
| Bias | Authors' judgement | Support for judgement |
| Allocation concealment? | Low risk | A ‐ Adequate |
| Methods | Randomized controlled trial (RCT), duration of treatment was six months (20 weekly sessions) and no further follow‐up was reported, treatment integrity was assessed using audiotaped sessions, outcome evaluation was not blind, ITT by estimation of outcome. | |
| Participants | 35 (two men) with anorexia nervosa (DSM III‐R) over 16 years of age. None of those screened were excluded. Seven participants had a BMI of between 17.5 and 19 thus technically not meeting diagnostic criteria. | |
| Interventions | Cognitive therapy vs dietary advice. | |
| Outcomes | BMI, EDI, Dysfunctional Attitudes Scale(DAS), Locus of Control of Behaviour (LCB) and BDI | |
| Notes | Sixth month data reported as "follow‐up" is presumed to be end of treatment data. Authors responded to inquiries. Sequence Generation: “Using cards randomly placed into sealed envelopes, patients were allocated to one of two groups; dietician control (D) or cognitive therapy (CT).” ‐ Allocation sequence was sufficiently generated. Allocation Concealment: Cards which allocated subjects to their random group were placed in envelopes (wrote to authors to get this information. ‐ Allocation was adequately concealed. Blinding: Outcome evaluation was not blind, but personnel and participants were blinded for allocation (information received later from authors). During the study, knowledge of the allocated interventions were sufficiently concealed. Incomplete outcome data: In the dietary counselling group, all subjects dropped out. ITT analysis by estimation of outcome was used for clinical diagnosis and BMI for this group. No further follow up was reported. Authors were transparent about numbers and explanations of drop‐outs: "All the patients in the dietary advice group had dropped out within 3 months of entry into the study.""Although follow‐up of the dietary control group was attempted, by writing and telephoning all participants and their GPs, the dietary control group refused to allow data to be released." ‐ Incomplete outcome data were not sufficiently addressed (could have been followed up by a phone call rather than ITT estimation analysis). Selective Outcome Reporting: Authors were transparent about their selection of subjects strategy suggesting limited bias in outcome reporting:"Participants were drawn from a consecutive group of new patient general practitioner referrals to a new Eating Disorders Service at the Royal Hallamshire Hospital serving a catchment area of approximately 500,000. Although it is possible that a very small number of patients were referred to therapists in the private sector, this practice is extremely rare and there were no other NHS disposal routes for referrals." Inclusion criteria was mentioned: "All patients were eligible for the study, providing they were 16 years old or more and had a DSM‐III‐R (American Psychiatric Association, 1987) diagnosis of anorexia nervosa." Risk of bias ‐ present | |
| Risk of bias | ||
| Bias | Authors' judgement | Support for judgement |
| Allocation concealment? | Low risk | A ‐ Adequate |
| Methods | Randomized controlled trial (RCT), duration of treatment was 5 months with one year follow‐up, treatment integrity was not done, outcome of evaluation was not blind, ITT by withdrawals followed up and included in analysis | |
| Participants | 30 (one man) with anorexia nervosa (ICD‐10) All over 18 years in age. 21% of those screened were excluded. | |
| Interventions | Educational Behavioural therapy (EDT) vs cognitive analytic therapy (CAT) | |
| Outcomes | Morgan and Russell interview and BMI | |
| Notes | End of Treatment data not reported. Authors responded to inquiries. They reported that the EBT group would be more like a "treatment as usual" than "dietary advice alone" treatment and the CAT was the same as in the Dare 2001 study. Sequence Generation: Subjects were randomly number allocated to different treatment groups, but this was matched: “After assessment patients were randomised using random numbers to the two treatment groups, (1) educational behavioural therapy and (2) cognitive analytical therapy.= “The randomisation was successful in that the groups were well matched before treatment” ‐ Allocation generation was adequate. Allocation Concealment: No mention of strategies of allocation concealment. Blinding: Outcome evaluation was not blind. Apart from this, there was no other mention of the blinding stradegies ‐ Unclear as to blinding to personnel and participants was sufficient but outcome evaluation was not blinded. Incomplete outcome data: Authors were transparent about drop‐out numbers and explanantions, but did not report use of ITT.: “Thirty eight patients were assessed and thirty two fulfilled these entry criteria. Of these one lost further weight after the assessment interview and was admitted before therapy began. One eligible patient refused the offer of treatment.”‐ Incomplete outcome data was properly explained, but unclear if it was accounted for (e.g. through ITT). Selective Outcome Data: Transparency about short comings and potential conflicts of interest so unlikely to be selective reporting: “The size of the study was small and so the power to distinguish between two forms of treatment was limited. As this was a pilot study of a new approach the therapists were relatively inexperienced.” Authors gave sufficient details on the selection strategy of subjects including where they came from and also inclusion criteria: "The subjects were a consecutive series of outpatients from the Eating Disorder Clinic at the Maudsley Clinic who were referred for treatment during the eighteen month recruitment phase of the trial. All patients met ICD‐10 diagnosis for anorexia nervosa and were over 18 years in age. Patients with a mixed diagnosis of anorexia nervosa and bulimia nervosa were included (see Table 1 for details of how many binged or used the various weight control measures). Patients were excluded if the psychiatrist giving the assessment interview judged that inpatient treatment was necessary Risk of bias ‐ present | |
| Risk of bias | ||
| Bias | Authors' judgement | Support for judgement |
| Allocation concealment? | Unclear risk | B ‐ Unclear |
Characteristics of excluded studies [ordered by study ID]
Ir a:
| Study | Reason for exclusion |
| RCT of computerised psychoeducation, which was not pertinent to the questions in this review. | |
| RCT of fluoxetine treatment, which was not pertinent to the questions in this review. | |
| An RCT of individual CBT versus family therapy, thereby not pertinent to his review but to the review of family therapy. (No differences between groups in this study were found however.) | |
| This is a typology study comparing different types of anorexia, not an intervention study. | |
| RCT of amitriptyline versus placebo‐controlled study, which was not pertinent to the questions in this review. | |
| RCT of zinc treatment, which was not pertinent to the questions in this review. | |
| RCT of olanzapine therapy + cognitive behaviour therapy vs placebo + cognitive behavior therapy, which was not pertinent to the questions in this review. | |
| RCT of combined cognitive‐behavioural versus antidepressant drugs versus nutritional therapy, which was not pertinent to the questions in this review. | |
| RCT of combined cognitive‐behavioural versus antidepressant drugs versus nutritional therapy, which was not pertinent to the questions in this review. | |
| RCT of clonidine treatment, which was not pertinent to the questions in this review. | |
| RCT of clomipramine treatment, which was not pertinent to the questions in this review. | |
| RCT of individual and group (both including family therapy) versus inpatient treatment vs assessment only in adults >20 years, which was not pertinent to the questions in this review. | |
| RCT of behavioural therapy, which was not pertinent to the questions in this review. | |
| RCT of family therapy and individual therapy of 5 year follow‐up, which was not pertinent to the questions in this review. | |
| RCT of two forms of family therapy, which was not pertinent to the questions in this review. | |
| RCT of day patient programme, which was not pertinent to the questions in this review. | |
| A review used to identify studies. Not an RCT. | |
| RCT of family therapy versus family group psychoeducation therapy, which was not pertinent to the questions in this review. | |
| RCT of cyproheptadine treatment, which was not pertinent to the questions in this review. | |
| RCT of cyproheptadine treatment , which was not pertinent to the questions in this review. | |
| RCT of changes in bone turnover markers and menstrual function after short‐term oral DHEA, which was not pertinent to the questions in this review. | |
| RCT of individual and family psychotherapy versus no treatment, which was not pertinent to the questions in this review. | |
| RCT of human insulin‐like growth factor on bone turnover in osteopenic women with aneroxia nervosa, which was not pertinent to the questions this review. | |
| RCT of lithium carbonate treatment, which was not pertinent to the questions in this review. | |
| RCT of tetrahydrocannabinol treatment, which was not pertinent to the questions in this review. | |
| RCT of dietary advice versus combined individual and family psychotherapy, which was not pertinent to the questions in this review. | |
| A trial investigating the effects of behaviour therapy; it did not meet the cirteria for this review because it was not an RCT and it did not compare behaviour therapy to any other interventions investigated in this review. | |
| RCT of cyproheptadine treatment versus amitriptyline treatment, which was not pertinent to the questions in this review. | |
| RCT of cyproheptadine treatment versus amitriptyline treatment, which was not pertinent to the questions in this review. | |
| RCT comparing drug therapy (fluoxetine) to cognitive‐behavioural therapy, which is not a comparison pertinent in this review. | |
| Study of predictors of treatment acceptance (primary treatment efficacy outcomes not reported) with only 37% completion rate. High self‐esteem was the single predictor of treatment completion. Non‐completion rates were highest in the medication alone (fluoxetine 60mg) group vs CBT vs combined treatment. | |
| RCT. Pilot study of recombinant human growth hormone treatment, which was not pertinent to the questions in this review. | |
| RCT Fluoxetine treatment, which was not pertinent to the questions in this review. | |
| Not an RCT. Did not compare behaviour therapy to any other form of psychotherapy. Only 8 participants. | |
| RCT of estrogen therapy on trabecular bone loss in young women with aneroxia nervosa, which was not pertinent to the questions in this review. | |
| RCT of a comprehensive combined psychological (CBT and IPT) and pharmacological (SSRIs and benzodiazepines) delivered in a day versus an outpatient setting. An interesting study but not pertinent to the questions in this review. | |
| RCT of clomipramine treatment, which was not pertinent to the questions in this review. | |
| RCT of conjoint family therapy versus family therapy, which was not pertinent to the questions in this review. | |
| RCT of naltrexone treatment, which was not pertinent to the questions in this review. | |
| Single case study of chemotherapy and behavioural therapy, which was not pertinent to the questions in this review. | |
| An interesting study of cognitive behaviour therapy following hospitalisation and weight gain to within 90% of ideal body weight., but thereby not pertinant to the questions in this review. | |
| RCT of social skills training versus placebo condition, which was not pertinent to the questions in this review. | |
| A letter detailing suggestions for future research into anorexia nervosa. Not an RCT. | |
| RCT of family therapy versus individual therapy, which was not pertinent to the questions in this review. | |
| RCT of family therapy versus individual therapy, which was not pertinent to the questions in this review. | |
| RCT of family therapy versus individual therapy, which was a study following weight restoration and therby not pertinent to the questions in this review. | |
| This paper describes the current state of the different psychotherapies and their application and suggests reasons why proper evaluations as to the gold standard treatment have not been made. Not an RCT. | |
| RCT of periactin treatment, which was not relevant to the questions in this review. | |
| RCT of Cisapride treatment, which was not relevant to the questions in this review. | |
| RCT of parental expressed emotion and dropping out treatment, which was not relevant to the questions in this review. | |
| RCT. Pilot study of a graded exercise program, which was not pertinent to the questions in this review. | |
| RCT of CBT vs behavioural family therapy. It was excluded because this review focuses on individual psychotherapy, not family therapy. | |
| RCT of pimozide combined with behavioural therapy, which was not pertinent to the questions in this review. | |
| RCT of neuroleptics treatment, which was not pertinent to the questions in this review. | |
| A trial (not randomized) investigating the efficacy of pimozide compared to behaviour therapy. Drug therapy was not a intervention investigated in this review; also, RCT were required for this review. | |
| A trial (not randomized) investigating isolation, appetite stimulating drugs and psychotherapy against psychotherpay. It was not included because it is not RCT and one of the interventions included in this study was not of relevance for the review. | |
| This is a retrospective comparative study comparing the "classic" approach (strict isolation, medication and psychotherapy) against the then contemporary method of conditioning and avoidance learning. Neither of these interventions were relevant to this review, and this trial was not randomised, therefore it was excluded. | |
| Not an RCT. SImply examines the effects of just one type of psychotherapy (cognitive behaviour therapy) and does not compare psychotherapies. |
Data and analyses
| Outcome or subgroup title | No. of studies | No. of participants | Statistical method | Effect size |
| 2 N not meeting Morgan & Russell "recovered" or "significantly improved" outcome criteria at 12 months (Rx end). Show forest plot | 1 | 43 | Risk Ratio (M‐H, Random, 95% CI) | 1.09 [0.73, 1.62] |
| Analysis 1.2  Comparison 1 CAT versus individual focal psychotherapy (FPT: Dare et al., 2001)., Outcome 2 N not meeting Morgan & Russell "recovered" or "significantly improved" outcome criteria at 12 months (Rx end).. | ||||
| 3 N participants not completing treatment for any reason Show forest plot | 1 | 43 | Risk Ratio (M‐H, Random, 95% CI) | 0.95 [0.47, 1.93] |
| Analysis 1.3  Comparison 1 CAT versus individual focal psychotherapy (FPT: Dare et al., 2001)., Outcome 3 N participants not completing treatment for any reason. | ||||
| Outcome or subgroup title | No. of studies | No. of participants | Statistical method | Effect size |
| 1 N of participants not meeting Morgan and Russell's criteria for "recovered" or "significantly improved". Show forest plot | 1 | 40 | Risk Ratio (M‐H, Random, 95% CI) | 0.70 [0.51, 0.97] |
| Analysis 2.1  Comparison 2 FPT versus treatment as usual (Dare et al., 2001), Outcome 1 N of participants not meeting Morgan and Russell's criteria for "recovered" or "significantly improved".. | ||||
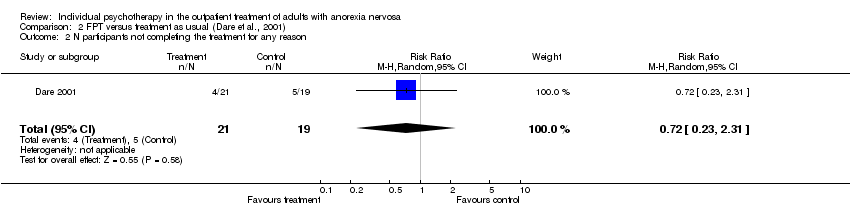
| 2 N participants not completing the treatment for any reason Show forest plot | 1 | 40 | Risk Ratio (M‐H, Random, 95% CI) | 0.72 [0.23, 2.31] |
| Analysis 2.2  Comparison 2 FPT versus treatment as usual (Dare et al., 2001), Outcome 2 N participants not completing the treatment for any reason. | ||||
| Outcome or subgroup title | No. of studies | No. of participants | Statistical method | Effect size |
| 1 N participants in Morgan & Russell in 'poor' or 'intermediate' categories at 12‐months Show forest plot | 1 | 41 | Risk Ratio (M‐H, Random, 95% CI) | 0.77 [0.58, 1.01] |
| Analysis 3.1  Comparison 3 CAT versus treatment as usual (Dare et al., 2001), Outcome 1 N participants in Morgan & Russell in 'poor' or 'intermediate' categories at 12‐months. | ||||
| 2 N participants not completing the trial for any reason Show forest plot | 1 | 41 | Risk Ratio (M‐H, Random, 95% CI) | 1.30 [0.56, 2.97] |
| Analysis 3.2  Comparison 3 CAT versus treatment as usual (Dare et al., 2001), Outcome 2 N participants not completing the trial for any reason. | ||||
| Outcome or subgroup title | No. of studies | No. of participants | Statistical method | Effect size |
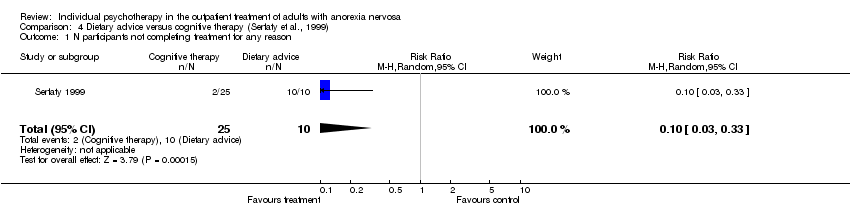
| 1 N participants not completing treatment for any reason Show forest plot | 1 | 35 | Risk Ratio (M‐H, Random, 95% CI) | 0.10 [0.03, 0.33] |
| Analysis 4.1  Comparison 4 Dietary advice versus cognitive therapy (Serfaty et al., 1999), Outcome 1 N participants not completing treatment for any reason. | ||||
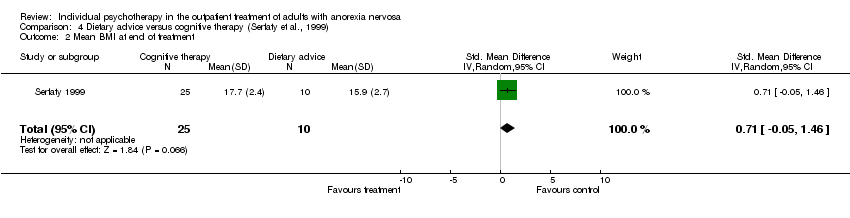
| 2 Mean BMI at end of treatment Show forest plot | 1 | 35 | Std. Mean Difference (IV, Random, 95% CI) | 0.71 [‐0.05, 1.46] |
| Analysis 4.2  Comparison 4 Dietary advice versus cognitive therapy (Serfaty et al., 1999), Outcome 2 Mean BMI at end of treatment. | ||||
| Outcome or subgroup title | No. of studies | No. of participants | Statistical method | Effect size |
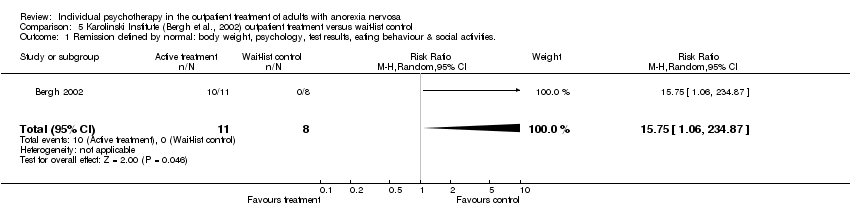
| 1 Remission defined by normal: body weight, psychology, test results, eating behaviour & social activities. Show forest plot | 1 | 19 | Risk Ratio (M‐H, Random, 95% CI) | 15.75 [1.06, 234.87] |
| Analysis 5.1  Comparison 5 Karolinski Institute (Bergh et al., 2002) outpatient treatment versus wait‐list control, Outcome 1 Remission defined by normal: body weight, psychology, test results, eating behaviour & social activities.. | ||||
| Outcome or subgroup title | No. of studies | No. of participants | Statistical method | Effect size |
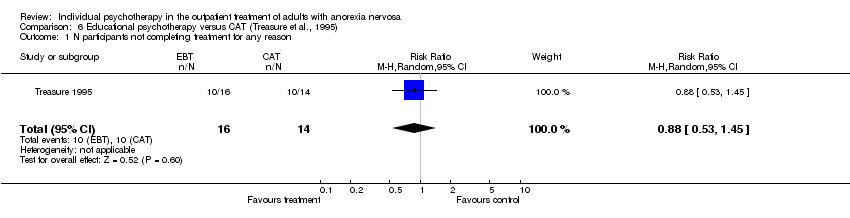
| 1 N participants not completing treatment for any reason Show forest plot | 1 | 30 | Risk Ratio (M‐H, Random, 95% CI) | 0.88 [0.53, 1.45] |
| Analysis 6.1  Comparison 6 Educational psychotherapy versus CAT (Treasure et al., 1995), Outcome 1 N participants not completing treatment for any reason. | ||||
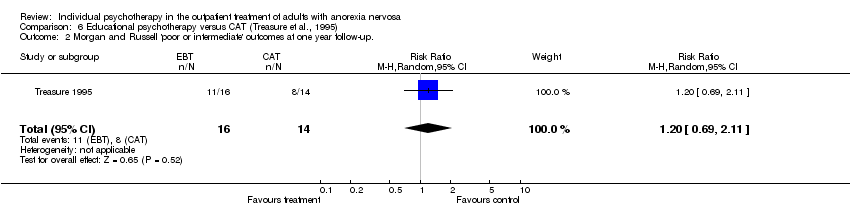
| 2 Morgan and Russell 'poor or intermediate' outcomes at one year follow‐up. Show forest plot | 1 | 30 | Risk Ratio (M‐H, Random, 95% CI) | 1.20 [0.69, 2.11] |
| Analysis 6.2  Comparison 6 Educational psychotherapy versus CAT (Treasure et al., 1995), Outcome 2 Morgan and Russell 'poor or intermediate' outcomes at one year follow‐up.. | ||||
| 3 Mean BMI at 12 months follow‐up Show forest plot | 1 | 30 | Std. Mean Difference (IV, Random, 95% CI) | ‐0.41 [‐1.13, 0.32] |
| Analysis 6.3  Comparison 6 Educational psychotherapy versus CAT (Treasure et al., 1995), Outcome 3 Mean BMI at 12 months follow‐up. | ||||
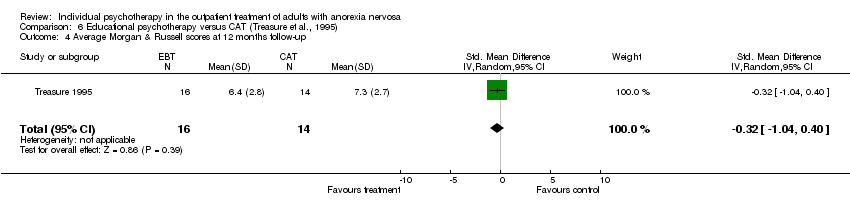
| 4 Average Morgan & Russell scores at 12 months follow‐up Show forest plot | 1 | 30 | Std. Mean Difference (IV, Random, 95% CI) | ‐0.32 [‐1.04, 0.40] |
| Analysis 6.4  Comparison 6 Educational psychotherapy versus CAT (Treasure et al., 1995), Outcome 4 Average Morgan & Russell scores at 12 months follow‐up. | ||||
| Outcome or subgroup title | No. of studies | No. of participants | Statistical method | Effect size |
| 1 N participants not having a good outcome (BMI > 17.5 and return of menstruation) Show forest plot | 1 | 13 | Risk Ratio (M‐H, Random, 95% CI) | 0.34 [0.12, 0.96] |
| Analysis 7.1  Comparison 7 Self‐psychology versus cognitive orientation therapy (both with nutritional counselling; Bachar et al., 1999), Outcome 1 N participants not having a good outcome (BMI > 17.5 and return of menstruation). | ||||
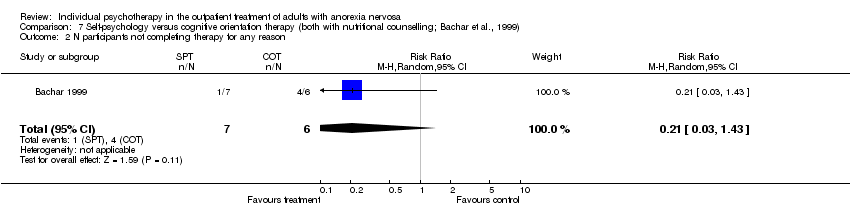
| 2 N participants not completing therapy for any reason Show forest plot | 1 | 13 | Risk Ratio (M‐H, Random, 95% CI) | 0.21 [0.03, 1.43] |
| Analysis 7.2  Comparison 7 Self‐psychology versus cognitive orientation therapy (both with nutritional counselling; Bachar et al., 1999), Outcome 2 N participants not completing therapy for any reason. | ||||
| Outcome or subgroup title | No. of studies | No. of participants | Statistical method | Effect size |
| 1 N participants not completing treatment Show forest plot | 1 | 16 | Risk Ratio (M‐H, Random, 95% CI) | 0.33 [0.02, 7.14] |
| Analysis 8.1  Comparison 8 Cognitive‐behavioural therapy (Channon et al., 1989 & Garner & Bemis, 1982, 1985) versus Behaviour therapy, Outcome 1 N participants not completing treatment. | ||||
| Outcome or subgroup title | No. of studies | No. of participants | Statistical method | Effect size |
| 1 N of participants not completing treatment Show forest plot | 1 | 16 | Risk Ratio (M‐H, Random, 95% CI) | 0.2 [0.01, 3.61] |
| Analysis 9.1  Comparison 9 CBT versus eclectic specialist therapy ("treatment as usual"; Channon et al., 1999), Outcome 1 N of participants not completing treatment. | ||||
| Outcome or subgroup title | No. of studies | No. of participants | Statistical method | Effect size |
| 1 Global treatment outcome ‐ number rated 3 or 4 Show forest plot | 1 | 40 | Risk Ratio (M‐H, Random, 95% CI) | 0.76 [0.54, 1.06] |
| Analysis 10.1  Comparison 10 CBT versus IPT (McIntosh et al., 2005), Outcome 1 Global treatment outcome ‐ number rated 3 or 4. | ||||
| 2 BMI Show forest plot | 1 | 40 | Std. Mean Difference (IV, Fixed, 95% CI) | 0.0 [‐0.62, 0.62] |
| Analysis 10.2  Comparison 10 CBT versus IPT (McIntosh et al., 2005), Outcome 2 BMI. | ||||
| 3 EDE restraint Show forest plot | 1 | 40 | Std. Mean Difference (IV, Fixed, 95% CI) | ‐0.74 [‐1.38, ‐0.09] |
| Analysis 10.3  Comparison 10 CBT versus IPT (McIntosh et al., 2005), Outcome 3 EDE restraint. | ||||
| 4 Global ssessment of function (GAF‐DSM‐IV) Show forest plot | 1 | 40 | Std. Mean Difference (IV, Fixed, 95% CI) | 0.25 [‐0.38, 0.87] |
| Analysis 10.4  Comparison 10 CBT versus IPT (McIntosh et al., 2005), Outcome 4 Global ssessment of function (GAF‐DSM‐IV). | ||||
| 5 Hamilton depression rating scale (HDRS) Show forest plot | 1 | 40 | Std. Mean Difference (IV, Fixed, 95% CI) | ‐0.39 [‐1.02, 0.24] |
| Analysis 10.5  Comparison 10 CBT versus IPT (McIntosh et al., 2005), Outcome 5 Hamilton depression rating scale (HDRS). | ||||
| Outcome or subgroup title | No. of studies | No. of participants | Statistical method | Effect size |
| 1 Global treatment outcome‐ number rated 3 or 4 (poor) Show forest plot | 1 | 35 | Risk Ratio (M‐H, Random, 95% CI) | 1.56 [0.83, 2.95] |
| Analysis 11.1  Comparison 11 CBT versus nonspecific clinician support (McIntosh et al., 2005), Outcome 1 Global treatment outcome‐ number rated 3 or 4 (poor). | ||||
| 2 BMI Show forest plot | 1 | 35 | Std. Mean Difference (IV, Fixed, 95% CI) | ‐0.34 [‐1.01, 0.33] |
| Analysis 11.2  Comparison 11 CBT versus nonspecific clinician support (McIntosh et al., 2005), Outcome 2 BMI. | ||||
| 3 EDE restraint Show forest plot | 1 | 35 | Std. Mean Difference (IV, Fixed, 95% CI) | 0.40 [‐0.27, 1.07] |
| Analysis 11.3  Comparison 11 CBT versus nonspecific clinician support (McIntosh et al., 2005), Outcome 3 EDE restraint. | ||||
| 4 GAF Show forest plot | 1 | 35 | Std. Mean Difference (IV, Fixed, 95% CI) | ‐0.63 [‐1.31, 0.06] |
| Analysis 11.4  Comparison 11 CBT versus nonspecific clinician support (McIntosh et al., 2005), Outcome 4 GAF. | ||||
| 5 HDRS Show forest plot | 1 | 35 | Std. Mean Difference (IV, Fixed, 95% CI) | 0.01 [‐0.65, 0.68] |
| Analysis 11.5  Comparison 11 CBT versus nonspecific clinician support (McIntosh et al., 2005), Outcome 5 HDRS. | ||||
| Outcome or subgroup title | No. of studies | No. of participants | Statistical method | Effect size |
| 1 Global treatment outcome ‐ number rated 3 or 4 Show forest plot | 1 | 37 | Risk Ratio (M‐H, Random, 95% CI) | 2.07 [1.17, 3.67] |
| Analysis 12.1  Comparison 12 IPT versus nonspecific clinician support (McIntosh et al., 2005), Outcome 1 Global treatment outcome ‐ number rated 3 or 4. | ||||
| 2 BMI Show forest plot | 1 | 37 | Std. Mean Difference (IV, Fixed, 95% CI) | ‐0.25 [‐0.91, 0.40] |
| Analysis 12.2  Comparison 12 IPT versus nonspecific clinician support (McIntosh et al., 2005), Outcome 2 BMI. | ||||
| 3 EDE restraint Show forest plot | 1 | 37 | Std. Mean Difference (IV, Fixed, 95% CI) | 1.17 [0.46, 1.88] |
| Analysis 12.3  Comparison 12 IPT versus nonspecific clinician support (McIntosh et al., 2005), Outcome 3 EDE restraint. | ||||
| 4 GAF Show forest plot | 1 | 37 | Std. Mean Difference (IV, Fixed, 95% CI) | ‐0.89 [‐1.57, ‐0.20] |
| Analysis 12.4  Comparison 12 IPT versus nonspecific clinician support (McIntosh et al., 2005), Outcome 4 GAF. | ||||
| 5 HDRS Show forest plot | 1 | 37 | Std. Mean Difference (IV, Fixed, 95% CI) | 0.42 [‐0.24, 1.08] |
| Analysis 12.5  Comparison 12 IPT versus nonspecific clinician support (McIntosh et al., 2005), Outcome 5 HDRS. | ||||

Comparison 1 CAT versus individual focal psychotherapy (FPT: Dare et al., 2001)., Outcome 2 N not meeting Morgan & Russell "recovered" or "significantly improved" outcome criteria at 12 months (Rx end)..

Comparison 1 CAT versus individual focal psychotherapy (FPT: Dare et al., 2001)., Outcome 3 N participants not completing treatment for any reason.

Comparison 2 FPT versus treatment as usual (Dare et al., 2001), Outcome 1 N of participants not meeting Morgan and Russell's criteria for "recovered" or "significantly improved"..
Comparison 2 FPT versus treatment as usual (Dare et al., 2001), Outcome 2 N participants not completing the treatment for any reason.

Comparison 3 CAT versus treatment as usual (Dare et al., 2001), Outcome 1 N participants in Morgan & Russell in 'poor' or 'intermediate' categories at 12‐months.

Comparison 3 CAT versus treatment as usual (Dare et al., 2001), Outcome 2 N participants not completing the trial for any reason.
Comparison 4 Dietary advice versus cognitive therapy (Serfaty et al., 1999), Outcome 1 N participants not completing treatment for any reason.
Comparison 4 Dietary advice versus cognitive therapy (Serfaty et al., 1999), Outcome 2 Mean BMI at end of treatment.
Comparison 5 Karolinski Institute (Bergh et al., 2002) outpatient treatment versus wait‐list control, Outcome 1 Remission defined by normal: body weight, psychology, test results, eating behaviour & social activities..
Comparison 6 Educational psychotherapy versus CAT (Treasure et al., 1995), Outcome 1 N participants not completing treatment for any reason.
Comparison 6 Educational psychotherapy versus CAT (Treasure et al., 1995), Outcome 2 Morgan and Russell 'poor or intermediate' outcomes at one year follow‐up..

Comparison 6 Educational psychotherapy versus CAT (Treasure et al., 1995), Outcome 3 Mean BMI at 12 months follow‐up.
Comparison 6 Educational psychotherapy versus CAT (Treasure et al., 1995), Outcome 4 Average Morgan & Russell scores at 12 months follow‐up.

Comparison 7 Self‐psychology versus cognitive orientation therapy (both with nutritional counselling; Bachar et al., 1999), Outcome 1 N participants not having a good outcome (BMI > 17.5 and return of menstruation).
Comparison 7 Self‐psychology versus cognitive orientation therapy (both with nutritional counselling; Bachar et al., 1999), Outcome 2 N participants not completing therapy for any reason.
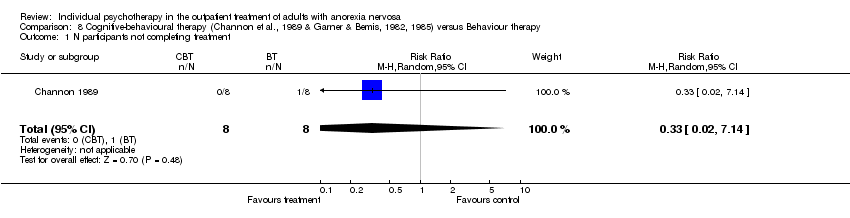
Comparison 8 Cognitive‐behavioural therapy (Channon et al., 1989 & Garner & Bemis, 1982, 1985) versus Behaviour therapy, Outcome 1 N participants not completing treatment.

Comparison 9 CBT versus eclectic specialist therapy ("treatment as usual"; Channon et al., 1999), Outcome 1 N of participants not completing treatment.

Comparison 10 CBT versus IPT (McIntosh et al., 2005), Outcome 1 Global treatment outcome ‐ number rated 3 or 4.

Comparison 10 CBT versus IPT (McIntosh et al., 2005), Outcome 2 BMI.
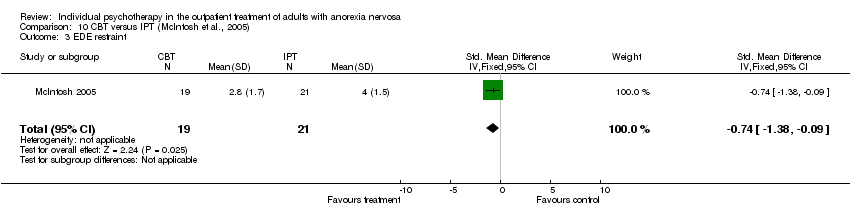
Comparison 10 CBT versus IPT (McIntosh et al., 2005), Outcome 3 EDE restraint.

Comparison 10 CBT versus IPT (McIntosh et al., 2005), Outcome 4 Global ssessment of function (GAF‐DSM‐IV).
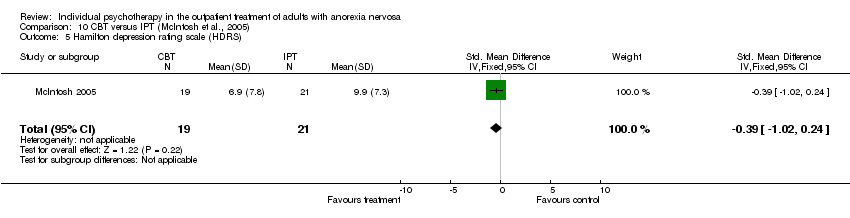
Comparison 10 CBT versus IPT (McIntosh et al., 2005), Outcome 5 Hamilton depression rating scale (HDRS).

Comparison 11 CBT versus nonspecific clinician support (McIntosh et al., 2005), Outcome 1 Global treatment outcome‐ number rated 3 or 4 (poor).

Comparison 11 CBT versus nonspecific clinician support (McIntosh et al., 2005), Outcome 2 BMI.

Comparison 11 CBT versus nonspecific clinician support (McIntosh et al., 2005), Outcome 3 EDE restraint.

Comparison 11 CBT versus nonspecific clinician support (McIntosh et al., 2005), Outcome 4 GAF.

Comparison 11 CBT versus nonspecific clinician support (McIntosh et al., 2005), Outcome 5 HDRS.

Comparison 12 IPT versus nonspecific clinician support (McIntosh et al., 2005), Outcome 1 Global treatment outcome ‐ number rated 3 or 4.

Comparison 12 IPT versus nonspecific clinician support (McIntosh et al., 2005), Outcome 2 BMI.

Comparison 12 IPT versus nonspecific clinician support (McIntosh et al., 2005), Outcome 3 EDE restraint.

Comparison 12 IPT versus nonspecific clinician support (McIntosh et al., 2005), Outcome 4 GAF.
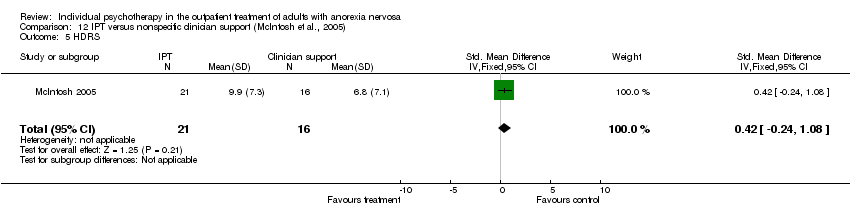
Comparison 12 IPT versus nonspecific clinician support (McIntosh et al., 2005), Outcome 5 HDRS.
| DSM‐IV criteria |
| a.Refusal to maintain body weight at or above a minimally normal weight for age and height, (eg. weight loss leading to maintenance of body weight less than 85% of that expected; or failure to make expected weight gain during period of growth, leading to body weight less than 85% below that expected) |
| QRS criteria |
| Quality Rating Scale (QRS) criteria |
| Outcome or subgroup title | No. of studies | No. of participants | Statistical method | Effect size |
| 2 N not meeting Morgan & Russell "recovered" or "significantly improved" outcome criteria at 12 months (Rx end). Show forest plot | 1 | 43 | Risk Ratio (M‐H, Random, 95% CI) | 1.09 [0.73, 1.62] |
| 3 N participants not completing treatment for any reason Show forest plot | 1 | 43 | Risk Ratio (M‐H, Random, 95% CI) | 0.95 [0.47, 1.93] |
| Outcome or subgroup title | No. of studies | No. of participants | Statistical method | Effect size |
| 1 N of participants not meeting Morgan and Russell's criteria for "recovered" or "significantly improved". Show forest plot | 1 | 40 | Risk Ratio (M‐H, Random, 95% CI) | 0.70 [0.51, 0.97] |
| 2 N participants not completing the treatment for any reason Show forest plot | 1 | 40 | Risk Ratio (M‐H, Random, 95% CI) | 0.72 [0.23, 2.31] |
| Outcome or subgroup title | No. of studies | No. of participants | Statistical method | Effect size |
| 1 N participants in Morgan & Russell in 'poor' or 'intermediate' categories at 12‐months Show forest plot | 1 | 41 | Risk Ratio (M‐H, Random, 95% CI) | 0.77 [0.58, 1.01] |
| 2 N participants not completing the trial for any reason Show forest plot | 1 | 41 | Risk Ratio (M‐H, Random, 95% CI) | 1.30 [0.56, 2.97] |
| Outcome or subgroup title | No. of studies | No. of participants | Statistical method | Effect size |
| 1 N participants not completing treatment for any reason Show forest plot | 1 | 35 | Risk Ratio (M‐H, Random, 95% CI) | 0.10 [0.03, 0.33] |
| 2 Mean BMI at end of treatment Show forest plot | 1 | 35 | Std. Mean Difference (IV, Random, 95% CI) | 0.71 [‐0.05, 1.46] |
| Outcome or subgroup title | No. of studies | No. of participants | Statistical method | Effect size |
| 1 Remission defined by normal: body weight, psychology, test results, eating behaviour & social activities. Show forest plot | 1 | 19 | Risk Ratio (M‐H, Random, 95% CI) | 15.75 [1.06, 234.87] |
| Outcome or subgroup title | No. of studies | No. of participants | Statistical method | Effect size |
| 1 N participants not completing treatment for any reason Show forest plot | 1 | 30 | Risk Ratio (M‐H, Random, 95% CI) | 0.88 [0.53, 1.45] |
| 2 Morgan and Russell 'poor or intermediate' outcomes at one year follow‐up. Show forest plot | 1 | 30 | Risk Ratio (M‐H, Random, 95% CI) | 1.20 [0.69, 2.11] |
| 3 Mean BMI at 12 months follow‐up Show forest plot | 1 | 30 | Std. Mean Difference (IV, Random, 95% CI) | ‐0.41 [‐1.13, 0.32] |
| 4 Average Morgan & Russell scores at 12 months follow‐up Show forest plot | 1 | 30 | Std. Mean Difference (IV, Random, 95% CI) | ‐0.32 [‐1.04, 0.40] |
| Outcome or subgroup title | No. of studies | No. of participants | Statistical method | Effect size |
| 1 N participants not having a good outcome (BMI > 17.5 and return of menstruation) Show forest plot | 1 | 13 | Risk Ratio (M‐H, Random, 95% CI) | 0.34 [0.12, 0.96] |
| 2 N participants not completing therapy for any reason Show forest plot | 1 | 13 | Risk Ratio (M‐H, Random, 95% CI) | 0.21 [0.03, 1.43] |
| Outcome or subgroup title | No. of studies | No. of participants | Statistical method | Effect size |
| 1 N participants not completing treatment Show forest plot | 1 | 16 | Risk Ratio (M‐H, Random, 95% CI) | 0.33 [0.02, 7.14] |
| Outcome or subgroup title | No. of studies | No. of participants | Statistical method | Effect size |
| 1 N of participants not completing treatment Show forest plot | 1 | 16 | Risk Ratio (M‐H, Random, 95% CI) | 0.2 [0.01, 3.61] |
| Outcome or subgroup title | No. of studies | No. of participants | Statistical method | Effect size |
| 1 Global treatment outcome ‐ number rated 3 or 4 Show forest plot | 1 | 40 | Risk Ratio (M‐H, Random, 95% CI) | 0.76 [0.54, 1.06] |
| 2 BMI Show forest plot | 1 | 40 | Std. Mean Difference (IV, Fixed, 95% CI) | 0.0 [‐0.62, 0.62] |
| 3 EDE restraint Show forest plot | 1 | 40 | Std. Mean Difference (IV, Fixed, 95% CI) | ‐0.74 [‐1.38, ‐0.09] |
| 4 Global ssessment of function (GAF‐DSM‐IV) Show forest plot | 1 | 40 | Std. Mean Difference (IV, Fixed, 95% CI) | 0.25 [‐0.38, 0.87] |
| 5 Hamilton depression rating scale (HDRS) Show forest plot | 1 | 40 | Std. Mean Difference (IV, Fixed, 95% CI) | ‐0.39 [‐1.02, 0.24] |
| Outcome or subgroup title | No. of studies | No. of participants | Statistical method | Effect size |
| 1 Global treatment outcome‐ number rated 3 or 4 (poor) Show forest plot | 1 | 35 | Risk Ratio (M‐H, Random, 95% CI) | 1.56 [0.83, 2.95] |
| 2 BMI Show forest plot | 1 | 35 | Std. Mean Difference (IV, Fixed, 95% CI) | ‐0.34 [‐1.01, 0.33] |
| 3 EDE restraint Show forest plot | 1 | 35 | Std. Mean Difference (IV, Fixed, 95% CI) | 0.40 [‐0.27, 1.07] |
| 4 GAF Show forest plot | 1 | 35 | Std. Mean Difference (IV, Fixed, 95% CI) | ‐0.63 [‐1.31, 0.06] |
| 5 HDRS Show forest plot | 1 | 35 | Std. Mean Difference (IV, Fixed, 95% CI) | 0.01 [‐0.65, 0.68] |
| Outcome or subgroup title | No. of studies | No. of participants | Statistical method | Effect size |
| 1 Global treatment outcome ‐ number rated 3 or 4 Show forest plot | 1 | 37 | Risk Ratio (M‐H, Random, 95% CI) | 2.07 [1.17, 3.67] |
| 2 BMI Show forest plot | 1 | 37 | Std. Mean Difference (IV, Fixed, 95% CI) | ‐0.25 [‐0.91, 0.40] |
| 3 EDE restraint Show forest plot | 1 | 37 | Std. Mean Difference (IV, Fixed, 95% CI) | 1.17 [0.46, 1.88] |
| 4 GAF Show forest plot | 1 | 37 | Std. Mean Difference (IV, Fixed, 95% CI) | ‐0.89 [‐1.57, ‐0.20] |
| 5 HDRS Show forest plot | 1 | 37 | Std. Mean Difference (IV, Fixed, 95% CI) | 0.42 [‐0.24, 1.08] |