吸入硫酸镁治疗急性哮喘
摘要
研究背景
哮喘发作很频繁,严重程度从轻微到危及生命。使用硫酸镁(Magnesium Sulfate, MgSO₄)是急性加重期间可用的众多治疗选择之一。虽然静脉注射MgSO₄的效果已得到证实,但吸入MgSO₄的作用不太清楚。
研究目的
确定吸入MgSO₄治疗急性哮喘的疗效和安全性。
具体目的:量化吸入MgSO₄ I) 添加吸入β₂‐激动剂和异丙托溴铵的联合治疗、 ii) 添加吸入β₂‐激动剂、 iii) 与吸入β₂‐激动剂相比的效果。
检索策略
我们于2017年9月从Cochrane呼吸道组试验注册库(Cochrane Airways Group register of trials)和在线试验注册库中确定了随机对照试验(Randomised Controlled Trials, RCTs)。我们通过检索已发表研究的参考文献列表以及联系实验者来补充这些内容。
纳入排除标准
包括患有急性哮喘的成人或儿童在内的RCTs符合纳入本系统综述的条件。我们纳入了单独使用雾化吸入MgSO₄或联合β₂‐激动剂或异丙托溴铵或两者治疗患者,并与单独使用相同的联合干预措施或非活阳性对照进行比较的研究。
资料收集与分析
两位系统综述作者独立进行了试验筛选、资料提取并评价偏倚风险。我们努力从作者那里收集缺失的数据。我们通过95%置信区间(Confidence Intervals, CIs),以及用均差(Mean Differences, MDs)或标准化均差(Standardised Mean Differences, SMDs)表示肺功能、临床严重程度评分和生命体征和用风险比(Risk Ratios, RRs)表示入院情况来呈现结果。我们使用风险差(Risk Differences, RDs)来分析不良事件,因为事件很少见。
主要结果
二十五项具有不同方法学质量的试验(43项参考文献)合格;它们包括2907名随机患者(2777名患者完成)。纳入的25项研究中有九项涉及成人;四项研究包括成人和儿童患者;八项研究招募了儿童患者;在其余四项研究中没有说明受试者的年龄。所有25项研究的设计、定义、干预措施和结局都不同;这种异质性使得直接比较变得困难。提供的证据质量从高到极低质量不等,大多数结局被评为低或极低质量。这主要是由于对纳入研究的方法学质量和合并的效果评估的不精确性的担忧。
吸入硫酸镁联合吸入β₂‐激动剂和异丙托溴铵
我们在此比较中纳入了七项研究。虽然一些个体研究报告了肺功能指数的改善有利于干预组,但总体结果不一致,报告该结局的最大研究发现60分钟时组间没有差异(MD=‐0.3% 预测的呼气流速峰值(Peak Expiratory Flow Rate, PEFR), 95% CI [‐2.71%, 2.11%])。添加吸入硫酸镁可能会减少初次就诊时的入院率(RR=0.95, 95% CI [0.91, 1.00];受试者=1308;研究=4; I²=52%),但对于ITU/HD在再次入院或护理升级方面未发现差异。入院期间的严重不良事件很少见。组间在入院期间的所有不良事件方面没有差异(RD=0.01, 95% CI [‐0.03, 0.05];受试者=1197;研究=2)。
吸入硫酸镁联合吸入β₂‐激动剂
我们在此比较中纳入了13项研究。虽然一些个体研究报告了肺功能指数的改善有利于干预组,但没有一项合并的结果显示通过FEV1或PEFR测量的结论性获益。入院的合并结果显示点估计有利于MgSO₄和β₂‐激动剂的组合,但置信区间包括干预组入院增加的可能性(RR=0.78, 95% CI [0.52, 1.15];受试者=375;研究=6; I²=0%)。任何纳入研究均未报告严重不良事件,组间的所有不良事件均无差异(RD=‐0.01, 95% CI [‐0.05, 0.03];受试者=694;研究=5)。
吸入硫酸镁对比吸入β₂‐激动剂外
我们在此比较中纳入了四项研究。有关β₂‐激动剂治疗急性哮喘的疗效的证据已得到充分证实,因此这可被视为历史比较。两项研究报告了β₂‐激动剂相比单独使用MgSO₄对PEFR有益,两项研究报告没有差异;我们没有合并这些结果。只有一项小型研究报告了入院情况,而且事件很少见,这导致结果不确定。在此比较中的任何研究中均未报告严重的不良事件;一项小型研究报告了轻度至中度的不良事件,但结果不准确。
作者结论
当添加吸入β₂‐激动剂和异丙托溴铵时,雾化吸入MgSO₄治疗可能会对肺功能和住院产生一定的额外获益,但我们对证据的可信度低,并且这仍然存在很大的不确定性。最近大型且精心设计的试验通常没有显示出临床上重要的获益。雾化吸入MgSO₄似乎与严重不良事件的增加无关。个体研究表明,那些发作更严重和发作持续时间更短的人可能会获得更大的获益,但有必要对亚组进行进一步的研究。
尽管在本系统综述的更新中纳入了24项试验,但我们无法合并所有感兴趣的结局的数据,这限制了得出的结论的强度。需要为急性哮喘研究设定一个核心结局。这在儿童研究中尤为重要,因为在这些研究中可能无法在病情恶化时测量肺功能。在对标准最大治疗(包括吸入β₂‐激动剂和异丙托溴铵和全身性类固醇)无反应的患者中进行的安慰剂对照试验可能有助于确定雾化吸入MgSO₄是否在急性哮喘中起作用。然而,越来越多的证据表明获得实质性获益的可能性不大。
PICO
简语概要
吸入硫酸镁对哮喘发作的人来说是一种安全有效的治疗方法吗?
系统综述背景
哮喘发作在成人和儿童中很常见。发作的人可能需要在医院急诊科(emergency department, A&E)中进行治疗。即使有最好的治疗,有些人还是需要住院,甚至需要进入重症监护室。一些指南建议通过注射或直接吸入硫酸镁到肺部可能是有益的。在本系统综述中,我们重点研究吸入(或“雾化”)硫酸镁。我们特别感兴趣的是找出硫酸镁对肺功能(呼吸测试)、严重程度评分和住院的影响。我们也想知道它是否安全。
研究特征
我们寻找对急诊科就诊的哮喘发作的成人和儿童进行的研究。我们纳入了比较给予吸入硫酸镁加标准治疗与单独使用标准治疗的研究。我们还纳入了将直接吸入硫酸镁与标准治疗进行比较的研究。我们纳入了在世界任何地方、任何时间、以任何语言进行的研究。
主要研究结果
我们总共发现了25项研究,其中包括近3000名哮喘发作患者。本系统综述的最新更新包括几项以极高的标准进行的大型试验。我们发现,在标准治疗中添加吸入硫酸镁可能会在肺功能、住院和严重程度评分方面带来小的获益,但我们对这些发现不确定。这是因为许多研究以不同的方式进行,并在不同的时间测量了不同的结局,因此很难将个体研究的结果结合起来。在我们发现的研究中,吸入硫酸镁似乎没有引起任何严重的副作用。我们没有发现证据表明使用吸入硫酸镁代替标准治疗是有益的。
证据质量
我们使用评分系统来评价我们对所呈现的结果的可信度。我们的分数从高可信度至极低可信度不等,但我们将大多数结局评为低或极低。这是因为我们对某些研究的进行方式感到担忧:例如,可能不清楚研究中如何为两个不同的治疗组选择人;或者不清楚进行试验的患者或人员是否知道谁在接受哪种治疗。另一个降低我们可信度的因素是对合并结局的不确定:例如,在某些情况下,我们无法判断硫酸镁是否更好、更差还是相同。
关键信息
有一些有限的证据表明,吸入硫酸镁在添加到标准治疗中时可能对哮喘发作的人有一点获益。然而,最近的高质量试验通常并未显示出重要的获益。此外,我们无法确定某些群体是否会比其他群体获益更多,例如那些发作更严重的群体。
Authors' conclusions
Summary of findings
| MgSO₄+ SABA + ipratropium compared to SABA + ipratropium in the treatment of acute asthma | ||||||
| Patient or population: adults and children with acute exacerbation of asthma | ||||||
| Outcomes | Anticipated absolute effects* (95% CI) | Relative effect | № of participants | Quality of the evidence | Comments | |
| Risk with SABA + ipratropium | Risk with MgSO4 + SABA + ipratropium | |||||
| Pulmonary function (% predicted FEV1) (90 to 120 minutes) | The mean pulmonary function (% predicted FEV1) was 65% | % predicted FEV1 was 3.28% higher | ‐ | 120 | ⊕⊝⊝⊝ | Outcome measured at 90 mins in 1 study and 120 mins in the other. 1 study (Gaur 2008) has reported much smaller standard deviations and contributes almost 90% of analysis weight |
| Pulmonary function % predicted PEF (60 minutes) | The mean pulmonary function % predicted PEF was 50.45% | % predicted PEF was 0.05 higher | ‐ | 636 | ⊕⊕⊕⊝ | Both studies in adults Mean control group % predicted PEF was 36% in 1 study and 64.9% in the other |
| Clinical severity scores (60 minutes) | The mean dyspnoea VAS was 31.8; the mean Yung ASS was 4.95 | SMD 0.01 higher | ‐ | 1130 | ⊕⊕⊝⊝ | 1 study reported Yung ASS and the other change in dyspnoea VAS |
| Admission at first presentation | 819 per 1000 | 778 per 1000 | RR 0.95 | 1308 | ⊕⊕⊕⊝ | Adults vs children test for subgroup difference: P = 0.72, I² = 0% |
| Readmission (7 to 30 days) | 26 per 1000 | 46 per 1000 | RR 1.80 | 750 | ⊕⊕⊝⊝ | Outcome measured at 7 days in 1 study and 30 days in the other. |
| Serious adverse events (during admission) | 43 per 1000 | Not estimable. See comment. | ‐ | 557 | ⊕⊕⊕⊝ | Risk difference: −0.03 (95% CI −0.06 to 0.00) Adults vs children test for subgroup difference: P = 0.39, I² = 0% Goodacre 2013 also reported participants with 1 or more SAE within 30 days: 35/332 in the MgSO₄ group and 28/358 in the placebo group (RD: 0.03; 95% CI −0.02 to 0.07) |
| Any adverse event (during admission) | 144 per 1000 | Not estimable. See comment. | ‐ | 1197 | ⊕⊕⊕⊕ | Risk Difference: 0.01 (95% CI −0.03 to 0.05) Adults vs children test for subgroup difference: P = 0.34, I² = 0% Goodacre 2013 also reported participants with 1 or more adverse event within 30 days: 52/332 in the MgSO₄ group and 36/358 in the placebo group (OR 1.66, 95% CI 1.05 to 2.62) |
| *The risk in the intervention group (and its 95% confidence interval) is based on the assumed risk in the comparison group and the relative effect of the intervention (and its 95% CI). | ||||||
| GRADE Working Group grades of evidence | ||||||
| 1 One study contributing most of weight at unclear risk of bias in multiple domains (−1 study limitations) 2 I² > 50% (−1 inconsistency) 3 Studies equal size but one study contributes almost 90% of weight to analysis due to much smaller standard deviations. Result no longer significant if random‐effects model applied (−1 imprecision) 4 Although one study at unclear risk of bias in several domains, the larger study, which contributes vast majority of weight to analysis, if of high methodological quality (no downgrade) 5 Although confidence interval includes no difference, they are sufficiently tight to effectively rule out an important between‐group difference (no downgrade) 6 Confidence intervals include both harm and benefit of intervention (−1 imprecision) 7 Although two of the studies at unclear risk of bias in several domains the two large studies contributing nearly 95% of weight in analysis are both of high methodological quality (no downgrade) 8 Although the I² = 52%, the two large studies contributing to this analysis show consistent results (no downgrade) 9 Confidence intervals include no difference (−1 imprecision) 10 Confidence intervals include no difference and appreciable harm or benefit of the intervention (−2 imprecision) 11 Events rare and confidence intervals include no difference (−1 imprecision) | ||||||
| MgSO₄+ SABA compared to SABA in the treatment of acute asthma | ||||||
| Patient or population: adults and children with acute exacerbation of asthma | ||||||
| Outcomes | Anticipated absolute effects* (95% CI) | Relative effect | № of participants | Quality of the evidence | Comments | |
| Risk with SABA | Risk with MgSO4 + SABA | |||||
| Pulmonary function % predicted FEV1 (20 minutes to 2 to 3 h) | The mean pulmonary function % predicted FEV1 was 56.55% | % predicted FEV1 was 3.34% higher | ‐ | 208 | ⊕⊕⊝⊝ | Adults vs children test for subgroup difference: P = 0.35, I² = 0% Severe vs moderate asthma exacerbation test for subgroup difference: P = 0.15, I² = 51.8% (favouring a greater effect in the more severe subgroup) |
| Pulmonary function PEF L/min ‐ Adults (20 minutes to 2 to 3 h) | The mean pulmonary function PEF was 233 L/min | PEF was 11.91 L/min higher | ‐ | 155 | ⊕⊕⊝⊝ | |
| Pulmonary function PEF L/min ‐ Children (60 minutes) | The mean pulmonary function PEF was 143.5 | PEF was 11.9 L/min higher | ‐ | 80 | ⊕⊕⊝⊝ | |
| Admission to hospital at initial presentation | 202 per 1000 | 158 per 1000 (105 to 233) | RR 0.78, (0.52 to 1.15) | 375 | ⊕⊕⊝⊝ | Adults vs children test for subgroup difference: P = 0.35, I² = 0% |
| Serious adverse events (During ED/hospital admission) | Not estimable | Not estimable. See comment | ‐ | 243 | ⊕⊕⊝⊝ | Risk difference: 0.00 (95% CI −0.04 to 0.04) No events reported |
| Any adverse events (During ED/hospital admission) | 107 per 1000 | Not estimable. See comment | ‐ | 694 | ⊕⊕⊝⊝ | Risk difference: −0.01 (95% CI −0.05 to 0.03) Adults vs children test for subgroup difference: P = 0.77, I² = 0% |
| *The risk in the intervention group (and its 95% confidence interval) is based on the assumed risk in the comparison group and the relative effect of the intervention (and its 95% CI). | ||||||
| GRADE Working Group grades of evidence | ||||||
| 1 Several studies were at unclear or high risk of bias in one or more domain (−1 study limitations) 2 Confidence intervals include both possible harm and benefit of the intervention (−1 imprecision) 3 Study at unclear risk of bias in several domains (−1 study limitations) 4 No events reported but less than 250 participants in total. Risk difference confidence intervals include a possible important harm or benefit of the intervention (−1 imprecision) | ||||||
| MgSO₄compared to SABA in the treatment of acute asthma | ||||||
| Patient or population: adults and children with acute exacerbation of asthma | ||||||
| Outcomes | Anticipated absolute effects* (95% CI) | Relative effect | № of participants | Quality of the evidence | Comments | |
| Risk with SABA | Risk with MgSO4 | |||||
| Lung function | Reported narratively in text | |||||
| Clinical severity score ‐ Fischl index (120 minutes) | The Fischl index score was 2.1 | Fischl index score 0.13 lower | ‐ | 93 | ⊕⊝⊝⊝ | Time point 120 minutes in 2 studies and unclear in the third study Wide range of control group scores (0.3, 0.76 and 4.81). Scale out of 7 with higher score indicating more severe symptoms. 4.81 reported in study with unclear time point. |
| Admission to hospital at initial presentation | 118 per 1000 | 62 per 1000 | RR 0.53 | 33 | ⊕⊝⊝⊝ | |
| Serious adverse events (During ED/hospital admission) | Not estimable | Not estimable. See comment | 53 | ⊕⊕⊝⊝ | Risk difference: 0.00 (95% CI −0.10 to 0.10) No events reported | |
| *The risk in the intervention group (and its 95% confidence interval) is based on the assumed risk in the comparison group and the relative effect of the intervention (and its 95% CI). | ||||||
| GRADE Working Group grades of evidence | ||||||
| 1 Several studies at unclear or high risk of bias in one or more domains (−1 study limitations) 2 Confidence intervals include both possible harm and benefit of the intervention (−1 imprecision) 3 Time‐point for measurement unclear in one study (−1 indirectness) 4 Study at unclear risk of bias in several domains (−1 study limitations) 5 One small study. Confidence intervals include appreciable harm or benefit of the intervention (−2 imprecision) 6 Two small studies. No events reported. Risk difference confidence intervals include appreciable harm or benefit of the intervention (−1 for imprecision) | ||||||
Background
Description of the condition
Asthma is a chronic respiratory disease characterised by reversible airflow obstruction, with periods of relative control and episodes of deterioration referred to as exacerbations. Exacerbations range in severity from mild to life‐threatening and can result in visits to healthcare providers and emergency departments, at times necessitating hospital admission. While rare, admissions to the intensive care setting, mechanical ventilation and deaths from severe acute asthma exacerbations do still occur (NRAD 2014): thus the prevention and treatment of exacerbations are important considerations for everyone with asthma. Due to its chronicity, variability, risk of mortality, and cost to the healthcare system, asthma remains the cause of significant personal and social burden.
Description of the intervention
Asthma exacerbations are characterised by acute episodes of bronchoconstriction and airway inflammation. These episodes generally result in increased requirements for inhaled beta₂‐agonist (β₂‐agonist) therapy (Cates 2004). Unfortunately, in acute asthmatic episodes, β₂‐agonists may not be enough to relieve bronchospasm and reduce dyspnoea. The evidence‐based guideline for the management of asthma developed by the British Thoracic Society (BTS) and the Scottish Intercollegiate Guideline Network (SIGN) offers comprehensive guidance on the acute and chronic management of asthma in children and adults (BTS/SIGN 2016). Although the management of children and adults is broadly similar, differences remain between the management of acute exacerbations of asthma in children (less than 16 years old) and adults (16 years and older) (BTS/SIGN 2016).
For children and adults seen in an emergency department (ED or A&E) with an asthma exacerbation, the BTS/SIGN guideline recommends inhaled or nebulised β₂‐agonists, systemic corticosteroids, and oxygen if needed. International guidelines also recommend the use of inhaled ipratropium for all adults, and children over the age of 5 with severe exacerbations (GINA 2017). For poorly responsive children the next step is nebulised ipratropium (if not already given), and consideration of nebulised magnesium sulfate (MgSO₄) if life‐threatening features are identified. Intravenous (IV) MgSO₄ (Shan 2013), salbutamol and aminophylline are considered if response remains poor. For poorly responsive adults, or those with a life‐threatening exacerbation, the addition of nebulised ipratropium (if not already given) is recommended, with consideration of IV MgSO₄ (Kew 2014). Nebulised magnesium sulfate is not recommended for the treatment of adults with acute asthma (BTS/SIGN 2016).
How the intervention might work
Magnesium sulfate has been proposed as a possible additive treatment in acute asthma, and has been shown to be effective in severe acute asthma when delivered intravenously (Shan 2013; Kew 2014). It may be effective in acute asthma through one or more of a variety of mechanisms. There is evidence that magnesium sulfate may augment the beta receptor response to salbutamol (Turner 2017). Magnesium sulfate has been shown to relax smooth muscle by inhibiting calcium ion influx (Gourgoulianis 2001); it inhibits acetylcholine and histamine release from cholinergic motor nerve terminals and mast cells respectively (Del Castillo 1954; Bois 1962), and promotes synthesis of nitric oxide (Ashutosh 2000) and prostacyclin (Nadler 1987), which stimulate broncho‐ and vasodilation. Finally, magnesium ions may have an anti‐inflammatory role, attenuating neutrophil activation in adults with asthma (Cairns 1996).
Why it is important to do this review
The potential clinical benefits of nebulised MgSO₄ have been studied and research publications have produced conflicting results. Subgroup analysis from one large multi‐centre RCT suggests a possible role for MgSO₄ in the treatment of children with acute severe asthma (Powell 2013), and has led to current guidance to consider nebulised MgSO₄ for children presenting with a life‐threatening acute asthma attack (BTS/SIGN 2016). However, nebulised MgSO₄ has not yet been used widely in the acute care setting.
In the previous version of this Cochrane Review (Powell 2012), sixteen trials involving 896 patients were included. Seven studies compared nebulised MgSO₄ with β₂‐agonist to β₂‐agonist alone, three studies compared nebulised MgSO₄ to β₂‐agonist alone, and two studies compared nebulised MgSO₄ with β₂‐agonist and ipratropium to β₂‐agonist and ipratropium alone. The review concluded that there was no good evidence that inhaled MgSO₄ could be used as a substitute for inhaled β₂‐agonists; and when used in addition to standard inhaled treatments there was no clear evidence of improved pulmonary function or reduced hospital admissions. However, individual study results from three trials suggest possible improved pulmonary function in those with severe asthma exacerbations. The review called for further studies focusing on inhaled MgSO₄ in addition to the current guideline treatment for acute asthma and including those with more severe exacerbations.
A 2013 systematic review including nine trials of nebulised magnesium sulfate (some of which were excluded from the 2012 Cochrane Review) identified benefits in pulmonary function for adults treated with nebulised magnesium sulfate compared to placebo (Shan 2013).
Thus, MgSO₄ administration in combination with β₂‐agonists may be of benefit with respect to pulmonary function in patients presenting to the emergency department with severe acute exacerbations of asthma, and there may be evidence that MgSO₄ administered in combination with β₂‐agonists reduces hospitalisations. Due to significant heterogeneity among studies, both in terms of treatments and outcome measures, there remains a need for further trials before recommendations can be made regarding the use of nebulised magnesium sulfate for acute asthma exacerbations. The rationale for completing this updated systematic review was to examine the influence any further studies would make on these conclusions.
Objectives
To determine the efficacy and safety of inhaled MgSO₄ administered in acute asthma.
Specific aims: to quantify the effects of inhaled MgSO₄ I) in addition to combination treatment with inhaled β₂‐agonist and ipratropium bromide, ii) in addition to inhaled β₂‐agonist and iii) in comparison to inhaled β₂‐agonist.
Methods
Criteria for considering studies for this review
Types of studies
We included randomised (or quasi‐randomised) controlled trials. We included only parallel study designs; cross‐over trials were excluded.
Types of participants
We included studies restricting enrolment to patients with acute asthma; patients with chronic or 'stable' asthma were excluded from the review. We included studies involving all ages; however, we sub‐grouped data into adults and children where possible. We accepted any reasonable diagnosis of asthma, namely clinical and guideline‐based criteria.
Types of interventions
We included studies where participants were randomised to receive inhaled MgSO₄ compared with a control inhaled treatment. That is, studies comparing the efficacy of:
-
inhaled MgSO₄ and β₂‐agonist and ipratropium versus β₂‐agonist and ipratropium and placebo;
-
inhaled MgSO₄ and β₂‐agonist versus β₂‐agonist and placebo;
-
inhaled MgSO₄ versus β₂‐agonist.
We allowed co‐interventions, and recorded information we received about them.
Types of outcome measures
Primary outcomes
Change in pulmonary function from baseline using the following indices.
-
Forced expiratory volume in one second (FEV1) and percentage predicted FEV1;
-
Peak expiratory flow (PEF) and percentage predicted PEF.
Secondary outcomes
-
Clinical severity scores.
-
Proportion of patients requiring admission to hospital.
-
Duration of symptoms.
-
Vital signs (pulse and respiratory rates; systolic and diastolic blood pressure).
-
Adverse events (tremor, nausea, etc).
For the 2017 update, we chose to extract and present outcomes including lung function, vital signs and severity scores at — or as close as possible to — 60 minutes post‐baseline. The rationale for this decision is given in the Potential biases in the review process section.
Search methods for identification of studies
Electronic searches
We identified trials from the Cochrane Airways Trials Register, which is maintained by the Information Specialist for the Group. The Cochrane Airways Trials Register contains studies identified from several sources.
-
Monthly searches of the Cochrane Central Register of Controlled Trials (CENTRAL), through the Cochrane Register of Studies Online (crso.cochrane.org).
-
Weekly searches of MEDLINE Ovid SP 1946 to date.
-
Weekly searches of Embase Ovid SP 1974 to date.
-
Monthly searches of PsycINFO Ovid SP 1967 to date.
-
Monthly searches of CINAHL EBSCO (Cumulative Index to Nursing and Allied Health Literature) 1937 to date.
-
Monthly searches of AMED EBSCO (Allied and Complementary Medicine).
-
Handsearches of the proceedings of major respiratory conferences.
Studies contained in the Trials Register are identified through search strategies based on the scope of Cochrane Airways. Details of these strategies, as well as a list of handsearched conference proceedings are in Appendix 1. See Appendix 2 for the search terms we used to identify studies for this review.
We also conducted a search of ClinicalTrials.gov (www.ClinicalTrials.gov) and the World Health Organization (WHO) trials portal (apps.who.int/trialsearch) (Appendix 2). We searched all sources from their inception to the present and we placed no restriction on the language of publication. Search methods used in the previous version of this review are detailed in Appendix 3. The previously published version included searches up to September 2012. The search period for this update is September 2012 to 6 September 2017.
Searching other resources
We examined the reference lists of all selected articles, primary studies and review articles for relevant studies. We contacted primary authors of studies to request information on additional trials (published and unpublished). We contacted clinicians, colleagues, collaborators and trialists to identify potentially relevant studies. Since MgSO₄ is not currently commercially delivered, we did not contact any industry sponsor.
Data collection and analysis
Selection of studies
The selection of studies involved two steps. First, to retrieve studies two independent investigators screened by title, abstract, MeSH headings and keywords the initial search of all databases and reference lists to identify all citations of randomised controlled trials (RCTs) or possible RCTs with potential relevance. We obtained the full texts of those selected articles for 'formal inclusion' review. Second, another review author independently decided on trial inclusion using pre‐determined eligibility criteria.
Data extraction and management
We extracted data independently using a standardised data collection form. We extracted the following information, if available: characteristics of the study (design, methods of randomisation, withdrawals/dropouts); participants (age, gender); intervention (type, dose, route of administration, timing and duration of therapy, co‐interventions); control (agent and dose); outcomes (types of outcome measures measured and reported, timing of outcomes, adverse events); and results. We requested unpublished data from the primary authors when necessary. For this update, two review authors (RK and RN) entered data into Review Manager 2014.
Assessment of risk of bias in included studies
We applied the Cochrane 'Risk of bias' tool in this 2017 update (Higgins 2011). Two review authors (RK and RN) independently assessed the risk of bias for all new included studies for the following six items: random sequence generation; allocation concealment; blinding; incomplete outcome data; selective outcome reporting; and other types of bias. We recorded the judgement as high, low or unclear risk of bias and added a description from the trial reports. We discussed any disagreements and resolved them by consensus.
Measures of treatment effect
For dichotomous variables, we expressed data as risk ratio (RR) with 95% confidence intervals (CIs) and reported adverse events as risk difference (RD) together with 95% CIs. For the continuous variables 'pulmonary function' and 'clinical severity score', we reported data as mean differences (MD) or standardised mean differences (SMD) with 95% CIs.
Unit of analysis issues
The unit of analysis was the patient.
Dealing with missing data
If baseline or outcome data or information on trial design were missing, we attempted to contact trial authors.
Assessment of heterogeneity
We assessed heterogeneity by visual inspection of the forest plots. We also used the Chi² test (where a P value < 0.10 indicates substantial heterogeneity); however, we exercised caution in interpretation due to the low power associated with this test. I² was calculated and a guide to interpretation is:
-
0% to 40%: might not be important;
-
30% to 60%: may represent moderate heterogeneity;
-
50% to 90%: may represent substantial heterogeneity;
-
75% to 100%: considerable heterogeneity (Higgins 2011).
Assessment of reporting biases
We planned to test for publication bias using a funnel plot if there was a sufficient number of trials included in a single forest plot (more than 10). It should be noted that an asymmetrical funnel plot can be caused by heterogeneity, outcome reporting bias and small‐study effects as well as publication bias.
Data synthesis
We combined data using a fixed‐effect model except in cases where we identified substantial heterogeneity, as defined above, where we employed a random‐effects model as a sensitivity analysis.
Subgroup analysis and investigation of heterogeneity
A priori subgroup analyses were planned to examine the effect of:
-
age (two to 16 years old (paediatric) and > 16 years old (adult));*
-
severity of asthma as measured by pre‐administration spirometric deviation from predicted (baseline FEV1 or PEF < 50% predicted).
*For the 2017 update, if the age range of participants was unclear, we classified the study according to average age of participants.
Sensitivity analysis
We planned to conduct sensitivity analyses to assess the effect of the overall risk of bias of included trials, but there were insufficient trials of varied methodological quality in the meta‐analysis for a sensitivity analysis (e.g. either all the studies were of similar methodological quality, or removing a trial in which we had concerns about risk of bias made no difference to the pooled result).
For the 2017 update we performed a post‐hoc sensitivity analysis using a random‐effects model when we encountered a study with unusually small standard deviations, which was therefore dominating the meta‐analysis. Results of such random‐effects model meta‐analyses should be interpreted with caution as the model is based on the assumption of a normal distribution of the true effect from each study; this is problematic in analyses with few studies.
We also employed a random‐effects model as a sensitivity analysis if substantial heterogeneity was detected, as previously described.
'Summary of findings' table
For this update we included a 'Summary of findings' table for each main comparison and assessed the quality of the evidence using the five GRADE domains (study limitations, imprecision, inconsistency, indirectness and publication bias). We decided a priori to include lung function, clinical severity scores, hospital admissions and adverse events. We used GRADEPro software (GRADEpro GDT) to create the 'Summary of findings' tables.
Results
Description of studies
Results of the search
The previous version of the review included 16 trials. For this update, the database search yielded 45 records and we identified six records from additional sources. Fourteen records were excluded on the basis of the title or abstract and we assessed 37 full texts for eligibility. We excluded a further 10 full texts, with reasons, and identified three ongoing studies. We included nine new studies (22 records) in the review, bringing the total number of included studies to 25 (43 records). See Figure 1, Characteristics of excluded studies and Characteristics of ongoing studies for further details. In addition, we moved two studies which had previously been excluded to Studies awaiting classification (Abd 1997; Bustamante 2000); and added one additional study to Studies awaiting classification (ISRCTN61336225)

Study flow diagram: review update
Included studies
We incorporated 25 trials (43 references) including 2907 randomised participants (2777 of whom completed) into the review (see Characteristics of included studies). All of the studies included in this manuscript were published since 1995. There is no particular geographic preference, with Argentina, Egypt, India, Iran, Mexico, New Zealand, Tenerife, Turkey, the UK and the USA represented.
We requested lung function data from the primary authors for two included studies (Meral 1996; Drobina 2006); and further information on trials design and baseline data from four authors (Neki 2006; Badawy 2014; Hossein 2016; Sarhan 2016). We also requested clarification on adverse event data from one author (Powell 2013). With the exception of clarification from the authors of Badawy 2014 and Powell 2013 we did not receive a reply before this review was published. Should information subsequently become available, we will include it in a future update.
Populations
Nine of the 25 included studies involved adults exclusively (Nannini 2000; Abreu‐Gonzalez 2002; Bessmertny 2002; Hughes 2003; Kokturk 2005; Gaur 2008; Gallegos‐Solórzano 2010; Goodacre 2013; Hossein 2016); and four included adults and children (Mangat 1998; Aggarwal 2006; Neki 2006; Sarhan 2016). Eight studies enrolled children (Meral 1996; Mahajan 2004; Ashtekar 2008; Khashabi 2008; Powell 2013; Mohammedzadeh 2014; Alansari 2015; Turker 2017); and in the remaining four studies the age of participants was not stated (Dadhich 2005; Drobina 2006; Ahmed 2013; Badawy 2014).
The severity of disease varied between studies (Table 1). Fourteen studies enrolled patients based on specific lung function criteria (Meral 1996; Mangat 1998; Nannini 2000; Bessmertny 2002; Hughes 2003; Mahajan 2004; Dadhich 2005; Neki 2006; Gaur 2008; Gallegos‐Solórzano 2010; Goodacre 2013; Powell 2013; Alansari 2015; Hossein 2016), while the remaining studies enrolled patients previously diagnosed with asthma using accepted clinical standards, or did not specify how asthma was diagnosed. Based on the baseline demographic data, 15 studies were considered to enrol severe acute exacerbations of asthma (FEV1 or PEF < 50% predicted at baseline or symptom criteria defined by BTS/SIGN guideline) (Meral 1996; Mangat 1998; Nannini 2000; Bessmertny 2002; Hughes 2003; Mahajan 2004; Dadhich 2005; Kokturk 2005; Aggarwal 2006; Neki 2006; Ashtekar 2008; Gaur 2008; Gallegos‐Solórzano 2010; Goodacre 2013; Powell 2013).
| Study | Severity of asthma exacerbation | Diagnosis based on | Population (adult/mixed/paediatric) |
| MgSO₄ and SABA and Ipratropium bromide versus SABA and Ipratropium | |||
| Severe | BTS definition clinical features | Paediatric (2 to 16) | |
| Unclear | PEF and clinical signs | Adults | |
| Moderate to severe | FEV1 < 60% | Adults >18 | |
| Severe | FEV1 < 30% | Adults (18 to 60) | |
| Severe | BTS definition | Adult (≥ 16) | |
| Moderate to severe | PEF < 70% and clinical signs | Adult (> 16) | |
| Severe after conventional treatment | BTS definition | Paediatric (2 to 16) | |
| MgSO4 and SABA versus SABA | |||
| Moderate | FEV1 and PEF at baseline | Adults | |
| Severe and life threatening | BTS definition clinical features and PEF | Mixed (13 to 60) | |
| Severe | PEF | Not documented | |
| Moderate to severe | Clinical score | Paediatric (2 to 14) | |
| Unclear | N/A | Adult | |
| Moderate to severe | PEF between 40% to 80% | Adults (18 to 65) | |
| Severe | PEF < 50% | Adults | |
| Severe | FEV1 < 50% | Adults (16 to 65) | |
| Unclear | Clinically defined as respiratory distress | Paediatric (mean age 3.55 years) | |
| Moderate to severe | Clinical scores and PEF | Adults (18 to 60) | |
| Moderate to severe | FEV1 between 45% and 75% | Paediatric (5 to 17) | |
| Moderate to severe | GINA definition | Paediatric (5 to 14) | |
| Severe | PEF < 50% | Adult (> 18) | |
| Unclear | PEF < 300L/min | Mixed (11 to 70) | |
| Moderate | Not described | Children (3 to 15) | |
| MgSO₄ versus SABA | |||
| Severe | PEF < 50% | Adults | |
| Moderate to severe | PEF < 300 L/Min | Mixed (12 to 60) | |
| Moderate to severe | PEF < 75% | Paediatric | |
| Severe | FEV1 < 40% or PEF < 300 L/Min | Adult (15 to 60) | |
| Unclear | PEF < 300L/min | Mixed (11 to 70) | |
BTS: British Thoracic Society
GINA: Global Initiative for Asthma
FEV1: Forced expiratory volume in one second
PEF: Peak Expiratory Flow Rate
Sixteen studies recruited participants from emergency departments; two from outpatient or emergency departments (Badawy 2014; Sarhan 2016); and one in a children's assessment unit after general practitioner referral (Ashtekar 2008). Department of presentation was unclear in the remaining six studies (see Table 2).
| Study | Presentation to which department? | Origin | Primary outcome(s) | Total n randomised | Side effects (patients in study) | Pharmaceutical exclusions | Other Interventions |
| MgSO₄ and SABA and Ipratropium bromide versus SABA and Ipratropium | |||||||
| Children’s Assessment Unit after GP referral | Cardiff, Wales | ASS (Yung) | 17 | 1 tingling in fingers and 1 transient hypotension | None stated | All management followed the BTS/SIGN guidelines; all children received 2 mg/kg prednisolone | |
| ED | USA | PEF, admissions | 110 | No comment on side effects in paper | Not stated | All subjects received 50 mg of oral prednisone at the onset of the treatment | |
| ED | Mexico City, Mexico | % change FEV1, O₂ post treatment, admission rates | 112 | Dry and bitter mouth (MgSO₄ group 1), dizziness (MgSO₄ 1; placebo 1) | Use of steroids prior to presentation | All participants received one IV dose of 125 mg methylprednisolone at admission and 1 mg/kg/day for 10 days prednisolone,on discharge. Other treatments were administered according to the treating physician | |
| ED | Delhi, India | FEV1 | 60 | None reported | None stated | All participants received IV hydrocortisone on arrival | |
| ED | UK | Admission within 7d, visual analogue scale for breathlessness at 2 h | 703 | AEs (41 MgSO₄/salbutamol; 36 placebo/salbutamol) | MgSO₄ in the past 24 h | All participants were managed according to BTS/SIGN guidelines (consisting of | |
| ED | Tehran, Iran | PEFR improvement, admission rate | 50 | No serious side effects reported | None stated | All participants received 50 mg oral prednisolone | |
| ED and children's assessment units | UK | Yung asthma severity score | 508 | 47 in MgSO₄ group and 59 in control group | None | Hospital‐defined conventional treatment | |
| MgSO4 and SABA versus SABA | |||||||
| ‐ | Tenerife Spain | FEV1, PEF | 24 | None reported | None stated | Not stated | |
| ED | New Delhi India | PEF | 100 | Palpitations (MgSO₄/salbutamol 13; salbutamol/placebo 11) and tremors (7; 7). | None stated | Clinicians free to administer steroids, salbutamol, IV hydrocortisone if judged to be required | |
| ‐ | Mymensingh, Bangladesh | PEF | 120 | None reported | None stated | Not stated | |
| Paediatric emergency centre | Doha, Qatar | Time to readiness for discharge | 400 | Chest tightness and facial rash (MgSO₄/salbutamol 191), excessive cough (placebo/salbutamol 174) | None stated | All participants received methylprednisolone 1 mg/kg IV every 12h and additional nebulised albuterol at clinicians' discretion | |
| Outpatient department and ED | Sohag, Egypt | Exacerbations post intervention, delivery outcome, post‐partum health status | 60 | None reported | None stated | All participants received 100 mg hydrocortisone IV, 500 mg aminophylline IV | |
| ED | Brooklyn, USA | FEV1 (% pred) | 74 | No SAEs reported | No theophylline or anticholinergics 2 h prior to presentation | Intravenous hydrocortisone, 2 mg/kg | |
| ED | Ajmer India | PEF | 71 | "Side effects were self limiting" | Not stated | Not stated | |
| ED | Wellington New Zealand | FEV1 | 52 | None reported | None | All participants received 100 mg hydrocortisone IV | |
| ‐ | Urmia, Iran | Reduced mean duration of O₂ therapy in MgSO₄ group, no change in Respiratory Distress Score) | 40 | No side effects | Not stated | Not stated | |
| ED | Gazi, Turkey | PEF difference | 26 | Transient hypotension (1 MgSO₄), palpitation (1 salbutamol) | None | All participants received 1 mg/kg prednisolone. Theophylline, anticholinergics and salbutamol given at clinicians discretion | |
| ED | Detroit, USA | % change in FEV1 | 62 | No side effects | Steroids, ipratropium or theophylline in the last 3 days. | All participants received 2 mg/kg of prednisone | |
| ‐ | Babol, Iran | Pulmonary index, PEFR, adjusted PEFR | 80 | ‐ | Corticosteroids; steroids, theophylline or ipratropium use within last 72 h | Not stated | |
| ED | 4 hospitals in Argentina | PEF, admissions | 35 | None reported | Oral or parenteral steroids in the last 7 days | No other medications were permitted during the study except | |
| Chest and ED | Minia, Egypt | Clinical improvement, PEFR | 30 | None severe enough to warrant withdrawal | Bronchodilators in last 6 h, steroids in last 12 h | Nebulised salbutamol, IV hydrocortisone, IV aminophylline at clinicians' discretion | |
| ED | Turkey | Modified pulmonary index score | 100 | "No side effect caused by magnesium was observed in any of the patients in the study" | Not stated | Nebulised salbutamol (0.15 mg/kg), methylprednisolone 1 mg/kg IV; Oxygen was given to patients with SaO2≤ 95% | |
| MgSO₄ versus SABA | |||||||
| ED | Ajmer India | PEF | 71 | "Side effects were self limiting" | Not stated | Not stated | |
| ED | St John’s College, India | PEF, Fischl index score, admissions | 33 | Transient self limiting hypotension (1) palpitation (1) tremors (2) all in control group and only 1 transient hypotension in MgSO₄ group (33) | Oral parenteral bronchodilators (6 h) steroids (last 12 h) | All participants received 100 mg hydrocortisone IV | |
| ‐ | Izmir, Turkey | % change in PEF ASS (Davies Leffert, Dabbous score) | 40 | No side effects | Beta2‐agonists or theophylline in the last 12 h | No other medication given | |
| ‐ | Amritsar Punjab | PEF, RR, Fischl index | 40 | ‐ | Oral, inhaled or parenteral steroids in last 12 h | All participants received 100 mg hydrocortisone IV | |
| Chest and ED | Minia, Egypt | Clinical improvement, PEFR | 30 | None severe enough to warrant withdrawal | Bronchodilators in last 6 h, steroids in last 12 h | Nebulised salbutamol, IV hydrocortisone, IV aminophylline at clinicians' discretion | |
ASS: Asthma Severity Score; BP: blood pressure; ED: emergency department; FEV1: Forced expiratory volume in 1 second; h: hour(s)
HR: heart rate; IV: intravenous; MgSO₄: magnesium sulfate; PEF: Peak Expiratory Flow Rate; SAEs: serious adverse events
Badawy 2014 recruited exclusively pregnant women. Due to concerns about baseline imbalance in this study, and the narrow population recruited, we did not include this study in our meta‐analyses and instead present the results narratively. The study has been included in another Cochrane Review that addresses asthma treatment options in pregnant women (Bain 2014).
Participants were excluded for a number of reasons including pre‐existing lung conditions and features of infection on examination. There was great variation in pharmaceutical exclusion due to drugs taken before recruitment (see Table 2).
Interventions
All studies used nebulised MgSO₄ in the intervention group but the comparison and placebo nebulised solutions varied (Table 3). Three studies compared MgSO₄ with β₂‐agonist directly with no placebo (Meral 1996; Mangat 1998; Neki 2006). Twelve studies compared β₂‐agonist with MgSO₄ to β₂‐agonist with placebo (normal saline) (Nannini 2000; Abreu‐Gonzalez 2002; Bessmertny 2002; Hughes 2003; Mahajan 2004; Kokturk 2005; Aggarwal 2006; Khashabi 2008; Ahmed 2013; Badawy 2014; Mohammedzadeh 2014; Turker 2017) . Five studies compared β₂‐agonist and ipratropium with MgSO₄ to β₂‐agonist and ipratropium with placebo (Ashtekar 2008; Gaur 2008; Gallegos‐Solórzano 2010; Powell 2013; Hossein 2016), and Drobina 2006 compared β₂‐agonist and ipratropium with MgSO₄ to β₂‐agonist and ipratropium only (i.e. no placebo). Alansari 2015 compared β₂‐agonist with MgSO₄ to β₂‐agonist with placebo (normal saline) after both groups had received one hour of therapy with combined β₂‐agonist and ipratropium, and thus is included in comparison one. Two studies had three groups and investigated MgSO₄ versus β₂‐agonist versus MgSO₄ plus β₂‐agonist (Dadhich 2005 and Sarhan 2016) and thus appear in comparisons 2 and 3. Goodacre 2013 studied one group with nebulised MgSO₄, β₂‐agonist, ipratropium and IV placebo, one with IV MgSO₄, β₂‐agonist, ipratropium and nebulised placebo, and a third group with β₂‐agonist, ipratropium and both nebulised and IV placebo. The comparison involving IV MgSO₄ has been covered in other reviews (Kew 2014; Griffiths 2016).
| Study (N) | Magnesium sulfate | Control | ||||
| Dose | N | Co‐interventions | Dose | N | Co‐interventions | |
| MgSO₄ and SABA and Ipratropium bromide versus SABA and Ipratropium | ||||||
| 2.5 mL isotonic MgSO₄ (151 mg /dose) | 7 | 500 mcg Ipratropium bromide 2.5 mg salbutamol or 5 mg salbutamol (depending on age) 3 times per h | 2.5 mL of isotonic saline) | 10 | Same as for MgSO₄ group | |
| 150 mg MgSO₄ (0.3 mL of 50% MgSO₄ heptahydrate) | 60 | Albuterol sulfate (0.5%) 5 mg/mL) and 0.5 mg ipratropium bromide (0.02% inhalation solution) (frequency*) | No placebo so volume will be less: i.e. blinding may be an issue) | 50 | Same as for MgSO₄ group | |
| 3 mL (333 mg) of 10% isotonic MgSO₄ (1 g/10 mL) | 60 (30 withdrawals) | 2.5 mg albuterol and 500 mcg ipratropium 3 doses per hour | 3 mL isotonic saline | 52 (22 withdrawals) | Same as for MgSO₄ group | |
| 3 mL (3.2 g%) isotonic MgSO₄ | 30 | Salbutamol and ipratropium (dose*, frequency*) | Saline | 30 | Same as for MgSO₄ group | |
| 2 mmol MgSO₄ | 339 (7 withdrawal) | 7.5 mL 0.9% NaCl nebulised, 3 doses; 100 mL 0.9% NaCl IV once, BTS/SIGN standard treatments plus others at clinicians' discretion | 7.5 mL 0.9% saline nebulised, 3 doses, 100 mL 0.9% NaCl IV once | 364 (7 withdrawal) | BTS/SIGN standard treatments plus others at clinicians' discretion | |
| 3 mL (260 mmol/L) MgSO4 | 25 | 2.5 mg salbutamol, 0.5 mg ipratropium nebulised every 20 to 60 minutes, 50 mg oral prednisolone (once*) | 3 mL 0.9% NaCl | 25 | Same as for MgSO₄ group | |
| 2.5 mL 250 mmol/L MgSO₄ | 252 (13 withdrawals) | 3 doses every 20 min. Hospital‐defined conventional treatment | 2.5 mL isotonic saline | 256 (10 withdrawals) | Same as for MgSO₄ group | |
| MgSO4 and SABA versus SABA | ||||||
| 2 mL MgSO₄ (isotonic) | 13 | 400 mcg salbutamol (once*) | 2 mL of a physiological serum of an inhaled form 11 patients | 11 | 400 mcg salbutamol | |
| 1 mL of 500 mg/mL MgSO₄ | 50 | 1 mL salbutamol (dose*, 8 mL distilled water, (295 mOsml/kg) 3 times per h ultrasonic nebuliser | 7.5 mL normal saline | 50 | 1 mL salbutamol (dose*), 1.5 mL distilled water (287 mOsml/kg) 3 times per h | |
| MgSO₄ (dose* frequency*) | 60 | Not recorded | Normal saline (dose* frequency*) | 60 | Not recorded | |
| 800 mg (15 mL) MgSO₄ | 208 (17 withdrawals) | 5 mg albuterol, divided into 3 doses over 1 h. Methylprednisolone 1 mg/kg IV every 12 h. 3 doses nebulized 1 mL albuterol (5 mg/mL), 250 mcg ipratropium, 2 mL normal saline before trial doses started | 15 mL 0.9% NaCl | 192 (18 withdrawals) | Same as for MgSO₄ group | |
| 500 mg (1mL) MgSO₄ | 30 | 1 mL salbutamol solution (dose*), 8 mL 0.9% NaCl, max 3 doses with 20 mins apart. 100 mg hydrocortisone IV, 500 mg aminophylline IV (once*) | 1 mL 0.9% NaCl | 30 | Same as for MgSO₄ group | |
| MgSO₄ (384 mg) | 37 (3 withdrawals) | Followed by ( i.e. not mixed) albuterol 2.5 mg/mL 3 times per h | Normal saline (no volume documented) | 37 (3 withdrawals) | Same as for MgSO₄ group | |
| MgSO₄ | 26 | No doses in any group or co‐interventions described | Not stated | 24 | No doses in any group or co‐interventions described | |
| 2.5 mL isotonic MgSO₄ (250 mmol/L 151 mg) 28 patients | 28 | 2.5 mg salbutamol 3 times per 30 minutes | 2.5 mL normal saline | 24 | Same as for MgSO₄ group | |
| Isotonic MgSO₄ (dose*, frequency*) | * | Salbutamol (dose*) | 2.5 mL normal saline (frequency*) | * | Same as for MgSO₄ group | |
| Isotonic MgSO₄ (2.5 mL) | 14 | Salbutamol (dose*) 3 times per h then 1 per h for 3 h | 2.5 mL normal saline | 12 | Same as for MgSO₄ group | |
| 3 mL 7.5% MgSO₄ | 40 | 0.15 mg/kg salbutamol 3 doses, every 20 min | 3 mL normal saline | 40 | Same as for MgSO₄ group | |
| 2.5 mL Isotonic (6.3%) MgSO₄ solution | 31 | Albuterol 2.5 mg 1 dose | 2.5 mL normal saline | 31 | Same as for MgSO₄ group | |
| 3 mL isotonic MgSO₄ (286 mOsml, 7.5%, 225 mg) | 19 | 0.5 mL 2.5 mg salbutamol 1 dose* | 3 mL normal saline | 16 | Same as for MgSO₄ group | |
| 2.5 mL MgSO4 (100 mg), 0.5 mL salbutamol (2.5 mg) | 10 | 4 doses at 20 min intervals. If needed: additional nebulised salbutamol, IV hydrocortisone, IV aminophylline | 2.5 mL isotonic saline | 10 | Same as for MgSO4 group | |
| 1 mL magnesium sulfate (15%) + 1.5 mL isotonic saline | 50 | 3 doses at 20 min intervals. Also nebulised salbutamol (0.15 mg/kg), methylprednisolone 1 mg/kg IV; Oxygen was given to patients with SaO2 ≤ 95% | 1.5 mL isotonic saline | 50 | Same as for MgSO₄ group | |
| MgSO₄ versus SABA | ||||||
| MgSO₄ | 21 | No doses in any group or co‐interventions described | Not stated | 24 | No doses in any group or co‐interventions described | |
| 3.2% solution MgSO₄ = 95 mg) | 16 | 4 doses every 20 minutes | 3 mL (2.5 mg) salbutamol | 17 | Four doses every 20 minutes | |
| 2 mL MgSO₄ (280 mmol/L) | 20 | 1* dose given over 10 to 15 minutes | Salbutamol 2.5 mg in 2.5 mL | 20 | 1 dose* given over 10 to 15 minutes | |
| 20 patients 3.2 G % MgSO₄ | 20 | 4 doses every 20 min | 3 mL of 25 mg* salbutamol (likely decimal point missing) | 20 | Same as for MgSO4 group | |
| 3 mL (100 mg) MgSO4 | 10 | 4 doses at 20 min intervals. If needed: additional nebulised salbutamol, IV hydrocortisone, IV aminophylline | 0.5 mL salbutamol (2.5 mg) | 10 | Same as for MgSO₄ group | |
| TOTAL: 2907 randomised to comparisons of interest. 130 withdrawn, 2777 completed | TOTAL: 1476 randomised, 70 withdrawn = 1406 completed intervention | TOTAL: 1431 randomised, 60 withdrawn = 1371 completed control | ||||
* denotes uncertainty
Most studies used 0.9% normal saline as placebo; Aggarwal 2006 used distilled water (as well as normal saline) for placebo and Abreu‐Gonzalez 2002 used ‘physiological serum’ as placebo.
We identified the following comparisons which have been used throughout the review to lend structure.
-
MgSO₄ and β₂‐agonist and ipratropium versus placebo (saline) and β₂‐agonist and ipratropium (seven studies: Drobina 2006; Ashtekar 2008; Gaur 2008; Gallegos‐Solórzano 2010; Goodacre 2013; Powell 2013; Hossein 2016).
-
MgSO₄ with β₂‐agonist versus placebo (saline) and β₂‐agonist (15 studies: Nannini 2000; Abreu‐Gonzalez 2002; Bessmertny 2002; Hughes 2003; Mahajan 2004; Dadhich 2005; Kokturk 2005; Aggarwal 2006; Khashabi 2008; Ahmed 2013; Badawy 2014; Mohammedzadeh 2014; Alansari 2015; Sarhan 2016; Turker 2017).
-
MgSO₄ versus β₂‐agonist alone (five studies: Meral 1996; Mangat 1998; Dadhich 2005; Neki 2006; Sarhan 2016).
Dose, formulation and dose frequency of MgSO₄ differed, meaning that the overall dose of MgSO₄ given differed between studies (Table 3). Not all studies reported the concentration of MgSO₄ nebulised, but when the information was available most included studies used MgSO₄ of similar concentration and osmolality. However, dose per nebulisation and the number of nebulisations performed varied.
Ten studies nebulised three doses of MgSO₄ at 20 minutes intervals (Bessmertny 2002; Hughes 2003; Aggarwal 2006; Ashtekar 2008; Gallegos‐Solórzano 2010; Goodacre 2013; Powell 2013; Mohammedzadeh 2014; Alansari 2015; Turker 2017). Three studies nebulised four doses at 20 minute intervals (Mangat 1998; Neki 2006; Sarhan 2016). Kokturk 2005 nebulised hourly up to four hours after the initial treatment of three doses in one hour. Five studies nebulised only one treatment (Meral 1996; Nannini 2000; Abreu‐Gonzalez 2002; Mahajan 2004; Ahmed 2013). Khashabi 2008 gave two doses of treatment but the timing was unclear. Three studies were unclear how frequently the doses were given but probably only one dose was given (Dadhich 2005; Drobina 2006; Gaur 2008). One study gave up to three doses at 20 minute intervals (Badawy 2014). Hossein 2016 gave treatments every 20 to 60 minutes but the total number of doses given was unclear.
All control or placebo interventions were similar in appearance to the treatment drug. The most frequent placebo was saline. One study collected data on participants' ability to distinguish between the treatment and control, and noted no ability to discern (Hughes 2003). Even when not expressly stated, it can reasonably be assumed that the control (placebo) would be similar in appearance to the treatment drug (especially if given in a β₂‐agonist vehicle).
Co‐interventions
Co‐interventions used added complexity and heterogeneity to the review (Table 2). In 11 studies, systemic corticosteroids were administered to all participants, although the timing (before/after nebulised treatment) varied (Mangat 1998; Hughes 2003; Mahajan 2004; Kokturk 2005; Neki 2006; Ashtekar 2008; Gaur 2008; Badawy 2014; Alansari 2015; Sarhan 2016; Turker 2017). In one study, systemic corticosteroids were administered if there was no improvement after the three doses of study treatment (Bessmertny 2002). Overall, 15 studies routinely administered corticosteroids, but in different doses, routes and frequency. In three studies, corticosteroids were administered according to local standard/conventional treatment, or at the clinicians’ discretion (Aggarwal 2006; Goodacre 2013; Powell 2013). Meral 1996 gave no further medication as a co‐intervention. Six studies made no comments on co‐interventions (Nannini 2000; Abreu‐Gonzalez 2002; Dadhich 2005; Khashabi 2008; Ahmed 2013; Mohammedzadeh 2014).
Outcomes
A summary of the outcomes relevant to this review reported in the included studies is given in Table 4.
| Study ID (author, date of publication) | Review primary outcomes | Review secondary outcomes | |||||
| FEV1 | PEF | Clinical severity scores | Hospital admissions | Duration of symptoms | Vital signs | Adverse effects | |
| MgSO₄ and SABA and Ipratropium bromide versus SABA and Ipratropium | |||||||
| N | N | Y | N | N | N | Y | |
| N | P | N | N | N | N | P | |
| Y | N | N | N | N | N | Y | |
| Y | N | N | N | N | N | N | |
| N | Y | N | Y | N | Y | Y | |
| N | Y | Y | Y | N | Y | N | |
| N | N | Y | P | N | N | Y | |
| MgSO4 and SABA versus SABA | |||||||
| Y | Y | N | N | N | N | N | |
| N | Y | N | Y | N | Y | Y | |
| N | P | N | N | N | N | N | |
| N | N | Y | P | N | N | Y | |
| Y | Y | N | N | N | Y | N | |
| P | N | N | N | N | N | Y | |
| P | P | N | N | N | N | Y | |
| Y | N | N | Y | N | N | Y | |
| N | N | N | N | N | N | N | |
| N | Y | P | Y | N | N | Y | |
| Y | N | N | Y | N | N | Y | |
| N | Y | Y | N | N | N | N | |
| N | Y | N | Y | N | N | Y | |
| N | Y | Y | N | N | Y | N | |
| N | N | Y | Y | N | N | Y | |
| MgSO₄ versus SABA | |||||||
| P | P | N | N | N | N | Y | |
| N | Y | N | Y | N | N | Y | |
| N | Y | N | N | N | N | Y | |
| N | Y | N | N | N | Y | N | |
| N | Y | Y | N | N | Y | N | |
N ‒ the study did not report the outcome but it is not clear whether the outcome was measured or not
Y ‒ full reporting
P ‒ partial reporting
Ongoing trials and unpublished data
We have identified three ongoing studies relevant to this review (Motamed 2015; Saucedo 2015; Schuh 2016a).
Excluded studies
During the history of this review, 65 studies have been excluded for the following reasons: 19 not acute asthma, 12 reviews articles, 11 not randomised controlled trials, eight investigated intravenous magnesium sulfate, seven investigated oral supplements, two investigated intravenous versus inhaled magnesium sulfate, two letters, one study unobtainable, one editorial, one study comparing nebulised magnesium sulfate to ipratropium/fenoterol, and one study in bronchiolitis (see Characteristics of excluded studies).
Risk of bias in included studies
See Figure 2 for summary of the risk of bias judgements.

'Risk of bias' summary: review authors' judgements about each risk of bias item for each included study.
Allocation
Fourteen studies were described as 'randomised' but the method of sequence generation was not described; these studies were therefore at an unclear risk of bias (Abreu‐Gonzalez 2002; Ahmed 2013; Dadhich 2005; Drobina 2006; Gallegos‐Solórzano 2010; Gaur 2008; Khashabi 2008; Kokturk 2005; Mangat 1998; Meral 1996; Mohammedzadeh 2014; Nannini 2000; Sarhan 2016; Turker 2017). One further study was at an unclear risk of bias as it is not clear if the study was randomised; we contacted the author for clarification but received no response (Neki 2006). One study was described as ‘randomised’ but no indication was given of random sequence generation and we were unable to confirm that the groups were balanced with regard to baseline clinical asthma criteria; this study was at high risk of bias (Badawy 2014).
Nine studies were at low risk of bias (Figure 2): the randomisation lists were computer‐generated for four studies (Bessmertny 2002; Powell 2013; Alansari 2015; Hossein 2016); produced by the pharmacy for two studies (Hughes 2003; Ashtekar 2008); produced by random number tables for two studies (Mahajan 2004; Aggarwal 2006); and produced by a web‐based randomisation system for one study (Goodacre 2013).
No details, or minimal details, were provided on allocation concealment in 17 studies; they were therefore assessed as at unclear risk of bias (Meral 1996; Mangat 1998; Nannini 2000; Abreu‐Gonzalez 2002; Hughes 2003; Dadhich 2005; Kokturk 2005; Drobina 2006; Neki 2006; Gaur 2008; Khashabi 2008; Ahmed 2013; Badawy 2014; Mohammedzadeh 2014; Hossein 2016; Sarhan 2016; Turker 2017). A description of allocation concealment was provided in eight studies and they were assessed as at low risk of bias (Bessmertny 2002; Mahajan 2004; Aggarwal 2006; Ashtekar 2008; Gallegos‐Solórzano 2010; Goodacre 2013; Powell 2013; Alansari 2015).
Blinding
Fifteen studies gave details as to their double blinding and were therefore at low risk of bias (Mangat 1998; Nannini 2000; Abreu‐Gonzalez 2002; Bessmertny 2002; Hughes 2003; Mahajan 2004; Aggarwal 2006; Drobina 2006; Ashtekar 2008; Khashabi 2008; Gallegos‐Solórzano 2010; Goodacre 2013; Powell 2013; Alansari 2015; Hossein 2016). Two studies were single blind and therefore at unclear risk of performance and assessment bias (Kokturk 2005; Gaur 2008). One study was described as an open trial and was at high risk of bias (Ahmed 2013). One study gave no baseline clinical asthma data and no details about blinding and was therefore at high risk of detection bias (Badawy 2014). No details were provided of blinding procedure or who was blinded for eight studies so we deemed them to have an unclear risk of bias (Meral 1996; Dadhich 2005; Kokturk 2005; Neki 2006; Gaur 2008; Mohammedzadeh 2014; Sarhan 2016; Turker 2017).
Incomplete outcome data
Fourteen studies were at unclear risk of attrition bias for the following reasons. Six studies were reported as conference abstracts only, with no details provided regarding dropouts (Abreu‐Gonzalez 2002; Dadhich 2005; Drobina 2006; Gaur 2008; Khashabi 2008; Ahmed 2013); and no dropout data were given in six studies (Meral 1996; Mangat 1998; Mahajan 2004; Neki 2006; Hossein 2016; Sarhan 2016). In Kokturk 2005 it appears as though there were no dropouts but the published report states that a participant was later excluded because the final diagnosis was COPD and the treatment group is not stated. On further correspondence, Badawy 2014 gave appropriate reasons for exclusions, but details regarding the groups from which participants were excluded were not given.
There was a high risk of bias in one study as three participants were enrolled more than once; only the initial visit was used in the analysis but the treatment group was not stated (Nannini 2000).
There was a low risk of bias in ten studies, with all randomised participants completing in four studies (Aggarwal 2006; Ashtekar 2008; Mohammedzadeh 2014; Turker 2017); and reasons fully described for dropouts in six studies (Bessmertny 2002; Hughes 2003; Gallegos‐Solórzano 2010; Goodacre 2013; Powell 2013; Alansari 2015).
Selective reporting
Ten studies were at unclear risk of reporting bias. Six studies were only reported in conference abstracts and therefore the risk of selective reporting bias is unclear (Abreu‐Gonzalez 2002; Dadhich 2005; Drobina 2006; Neki 2006; Ashtekar 2008; Ahmed 2013). Hossein 2016 was also at unclear risk of bias as not all primary outcome data were reported, adverse events were recorded only as “no treatment‐related complications” and there were clear mistakes in the reporting of vital signs. Sarhan 2016 did not distinguish between primary or secondary outcomes, while Mangat 1998 mentioned but did not report two outcomes.
Seven studies were judged to be at high risk of bias. One study was considered at high risk of bias as outcomes were partially reported and not statistically significant (Gaur 2008). Badawy 2014 was at high risk of bias as no primary outcome was stated. On further correspondence, adverse event data but no clinical asthma baseline characteristics were given. Bessmertny 2002 did not present data for outcomes which were described as not statistically significant, and only means were presented for FEV1. We did not identify a prospective trial registration for Turker 2017, adverse events were reported as “no side effect caused by magnesium was observed in any of the patients in the study” and the modified pulmonary index score was reported numerically at 120 minutes only. Hughes 2003, Meral 1996 and Nannini 2000 were also at high risk of bias as the trial report stated there was no difference in blood pressure and heart rate between the groups and no data were reported.
Eight studies were judged to be at low risk of bias. Four studies were at low risk of bias as all outcomes stated in the methods were reported, although no protocols were available (Mahajan 2004; Kokturk 2005; Aggarwal 2006; Gallegos‐Solórzano 2010). Pre‐registered protocols were available for four studies, in which all planned outcomes were reported (Goodacre 2013; Powell 2013; Mohammedzadeh 2014; Alansari 2015).
Other potential sources of bias
No other risks of bias were identified.
Effects of interventions
See: Summary of findings for the main comparison MgSO4 + SABA + ipratropium compared to SABA + ipratropium in the treatment of acute asthma; Summary of findings 2 MgSO4 + SABA compared to SABA in the treatment of acute asthma; Summary of findings 3 MgSO4 compared to SABA in the treatment of acute asthma
As detailed in the Methods section, we have presented effects of interventions within the following comparisons.
-
MgSO₄ and β₂‐agonist and ipratropium versus placebo (saline) and β₂‐agonist and ipratropium (comparison 1).
-
MgSO₄ with β₂‐agonist versus placebo (saline) and β₂‐agonist (comparison 2).
-
MgSO₄ versus β₂‐agonist alone (comparison 3).
MgSO₄ and β₂‐agonist and ipratropium versus placebo (saline) and β₂‐agonist and ipratropium (comparison 1)
Pulmonary function
Four studies including 1279 participants reported on FEV1 or PEF (Gaur 2008; Gallegos‐Solórzano 2010; Goodacre 2013; Hossein 2016).
Gallegos‐Solórzano 2010 and Gaur 2008, both adult studies, reported a greater %FEV1 in the MgSO₄ and β₂‐agonist and ipratropium group at 90 minutes (MD: 8.57, 95% CI 1.99 to 15.15; participants = 60) and 120 minutes (MD: 2.60, 95% CI 0.25 to 4.95; participants = 60) respectively with the pooled fixed‐effect result favouring the MgSO₄ intervention (MD 3.28, 95% CI 1.06 to 5.49; participants = 120; studies = 2; I² = 64%; Analysis 1.1).
Despite being similar‐sized studies, Gaur 2008 contributed nearly 90% of the weight to the pooled analysis due to reporting much smaller standard deviations. Sensitivity analysis with a random‐effects model results in reduced weighting for that study, and increased the size of the CI such that the lower confidence interval included no difference (MD 4.76, 95% CI −0.86 to 10.39; participants = 120; studies = 2).
Hossein 2016 reported a significantly greater per cent predicted PEF in the MgSO₄ and β₂‐agonist and ipratropium group at 20 minutes (MD 6.90, 95% CI 1.63 to 12.17) but an important between‐group difference was not found when 60 minute data were combined with 60 minute data from the large Goodacre 2013 trial (MD 0.05, 95% CI −2.33 to 2.42; participants = 636; studies = 2; I² = 67%). A random‐effects model substantially increases imprecision, and the effect estimate remains inconclusive. The Goodacre results taken individually did not demonstrate an important between‐group difference (MD −0.30%, 95% CI −2.71% to 2.11%).
Alansari 2015, Ashtekar 2008 and Powell 2013 did not report this outcome. Drobina 2006 reported that "peak flow measurements improved over time in both groups (p < 0.001). The addition of aerosolized magnesium sulfate did not result in a statistically significant increase in either the maximum or the average peak flow over time (p = 0.279 and p = 0.399, respectively)." As this research is only available in abstract form, it is unclear how many participants were in each group and no data were reported to include in the meta‐analysis.
Clinical severity scores
Powell 2013 reported a lower (therefore better) Yung asthma severity score (ASS) in children receiving MgSO₄ and β₂‐agonist and ipratropium compared to placebo (saline) and β₂‐agonist and ipratropium at 60 minutes (MD −0.23, 95% CI −0.48 to 0.02; participants = 472). The minimal important difference on this nine point scale is not known, but in Powell 2013 it was regarded as 0.5 by the trial steering group. Goodacre 2013 reported no significant difference in the change in dyspnoea visual analogue scale between the groups at 60 (MD 3.10, 95% CI −0.53 to 6.73; participants = 658) or 120 minutes (MD 3.12, 95% CI −1.35 to 7.59; participants = 619). The minimal important difference on the 100 mm scale used in Goodacre 2013 is thought to be 22 mm. When the '60 minute' data from each study are combined using an SMD analysis there is no between‐group difference (SMD 0.01, 95% CI −0.11 to 0.12; participants = 1130; studies = 2) but a high level of heterogeneity (I² = 83%). As the studies were of a similar size and weight in this analysis, a random‐effects model has little impact on the effect estimates, although the confidence interval is widened.
Ashtekar 2008 reported that there was no significant difference between the median area under the curve of ASS of the MgSO₄ compared with the placebo‐treated group (1530 versus 1355).
Of note: Powell 2013 performed subgroup analysis for asthma severity score, investigating whether participants with a more severe asthma exacerbation or an exacerbation of shorter duration derived more benefit. Although not powered to detect a difference, the study results support the hypothesis that children with more severe exacerbations and children with shorter duration of symptoms prior to presentation benefit more from inhaled MgSO₄ as measured using the Yung asthma severity score.
Admission to hospital
Gallegos‐Solórzano 2010 reported admissions to the emergency department and the general ward; Goodacre 2013 reported admissions to hospital, HDU and ICU; and Powell 2013 reported admissions to PICU/HDU or intubation.
Pooled results for adults and children for admissions from the emergency department at initial presentation suggests that admissions are decreased in those receiving MgSO₄, β₂‐agonist and ipratropium compared to placebo (saline), β₂‐agonist and ipratropium (RR 0.95, 95% CI 0.91 to 1.00; participants = 1308; studies = 4; I² = 52%) but the upper confidence interval reaches no difference (Analysis 1.4). The overall risk of admission was 82% on placebo which translates into a 78% risk of admission (95% CI 75% to 82%) with nebulised magnesium (Figure 3, summary of findings Table for the main comparison). The RR is the same if a random‐effects model is used, but the result is less precise (RR 0.95, 95% CI 0.87 to 1.05).

In the control group 82 people out of 100 had hospital admission , compared to 78 (95% CI 75 to 82) out of 100 for the active treatment group.
Gallegos‐Solórzano 2010, an adult study, also reported admission to the emergency department (RR 0.38, 95% CI 0.16 to 0.94; participants = 60).
Goodacre 2013 and Gallegos‐Solórzano 2010, both adult studies, reported on readmission after initial attendance (up to 7 days in Goodacre 2013; time point unclear in Gallegos‐Solórzano 2010). There was no significant difference in admission rates between the two groups, but the result is imprecise (RR 1.80, 95% CI 0.84 to 3.87; participants = 750; studies = 2; I² = 37%, Analysis 1.6).
Goodacre 2013 did not detect a between‐group difference for either HDU admission (RR 1.19, 95% CI 0.66 to 2.13; participants = 690) or ICU (RR 1.94, 95% CI 0.66 to 5.73; participants = 690) but events were infrequent and both results inconclusive (Analysis 1.5). Similarly Powell 2013, a study in children, reported HDU or ICU admissions/intubations and did not detect a between‐group difference (RR 1.48, 95% CI 0.79 to 2.79; participants = 505).
Duration of symptoms
Not reported.
Vital signs
Hossein 2016 and Goodacre 2013 reported on vital signs at various time points. For this update, we chose to present the 60‐minute time point in the meta‐analysis. There are concerns that administration of MgSO₄ may lead to an unwanted drop in blood pressure. Goodacre 2013 reported a significantly higher (therefore better in this context) diastolic blood pressure in participants receiving MgSO₄ and β₂‐agonist and ipratropium compared to placebo and β₂‐agonist and ipratropium at 60 minutes (MD 2.40, 95% CI 0.29 to 4.51; participants = 674), but this difference is unlikely to be clinically meaningful (Analysis 1.10). There was no significant difference in respiratory rate, heart rate or systolic and diastolic blood pressure at any other time point. Similarly there was no significant difference in the change in vital signs between groups at 60 or 120 minutes (Goodacre 2013; data not shown).
Drobina 2006 stated that vital signs were measured in the conference abstract but data were not reported.
Adverse events
Four studies including 2067 participants reported adverse events (Goodacre 2013; Powell 2013; Alansari 2015; Hossein 2016). During admission, more serious adverse events were reported in the placebo group compared to the MgSO₄ group, but only one of the two studies reporting this outcome contributed events and the confidence interval includes no difference (RD −0.03, 95% CI −0.06 to −0.00; participants = 557; studies = 2; I² = 0%; Analysis 1.11). There was no significant difference in adverse events between groups for any adverse event (RD 0.01, 95% CI −0.03 to 0.05; participants = 1197; studies = 2; I² = 0%; Analysis 1.12).
Goodacre 2013 reported a significantly higher 'all adverse event' rate within 30 days of primary attendance for those participants receiving MgSO₄ and β₂‐agonist and ipratropium compared to placebo (saline) and β₂‐agonist and ipratropium (RD 0.06, 95% CI 0.01 to 0.11; participants = 690; Analysis 1.14) but there was no difference in serious adverse events (Analysis 1.13). Hossein 2016 reported no serious adverse events in either group in the first 60 minutes of treatment.
Both Goodacre 2013 and Powell 2013 reported hypotension and flushing but did not detect a significant between‐group difference for either outcome (Analysis 1.15; Analysis 1.16).
Ashtekar 2008 reported that one child had a transiently low blood pressure and another had tingling of the fingers; both received nebulised MgSO₄. Drobina 2006 reported that there were no significant side effects noted in either treatment group, but did not report data. Gaur 2008 did not report adverse effects.
Gallegos‐Solórzano 2010 reported that the most common adverse reaction associated with MgSO₄ was a dry and bitter mouth, but no other side effect was associated with treatment. Electrocardiography (ECG) was abnormal in some participants (43% versus 36%): most commonly, sinus tachycardia (40% versus 36%). One person in the MgSO₄ group developed supraventricular extrasystole that did not require additional management. One from each group reported dizziness.
MgSO₄ with β₂‐agonist versus placebo (saline) and β₂‐agonist (comparison 2)
Pulmonary function
Eleven studies involving 589 participants reported at least one measure of lung function (Nannini 2000; Abreu‐Gonzalez 2002; Bessmertny 2002; Hughes 2003; Mahajan 2004; Kokturk 2005; Aggarwal 2006; Ahmed 2013; Badawy 2014; Mohammedzadeh 2014; Sarhan 2016).
Five studies reported per cent predicted FEV1; two at 120 minutes (Badawy 2014; Sarhan 2016), two at 60 minutes (Bessmertny 2002; Hughes 2003) and one at 20 minutes (Mahajan 2004). Due to our concerns about potential baseline imbalance and the population recruited in Badawy 2014 (all pregnant women) we chose not to include this study in the analysis.
Pulmonary function based on per cent predicted FEV1 was improved in those who received MgSO₄ and a β₂‐agonist compared to β₂‐agonist and placebo, but the confidence interval includes no difference (MD 3.34, 95% CI −1.58 to 8.26; participants = 208; studies = 4), with moderate between‐study heterogeneity identified (I² = 43%). We did not detect a difference between adults and children, but only one study involving children contributed to the analysis. We were only able to present subgrouping based on severity at presentation with three studies as we were unable to characterise severity in Sarhan 2016. Results suggest the combination of MgSO₄ and salbutamol may be more beneficial in people with a more severe exacerbation (FEV1 < 50% predicted) but the test for subgroup difference was negative (I² = 51.8%, P = 0.15). Badawy 2014 reports significantly higher post‐treatment per cent predicted FEV1 in pregnant women receiving MgSO₄ in addition to salbutamol compared to salbutamol alone; end‐point scores were 56.31% (SD 8.25) in the intervention group compared to 32.68% (SD 7.15) (P < 0.001, 30 participants), but baseline FEV1 in each group was not measured.
Six studies reported peak expiratory flow rate (PEF): one at 20 minutes (Nannini 2000), two at 60 minutes (Aggarwal 2006; Mohammedzadeh 2014), two at 120 minutes (Badawy 2014; Sarhan 2016), one at discharge (Kokturk 2005). Where studies reported at more than one time point we have extracted and presented the closest time point to 60 minutes. We excluded Badawy 2014 due to the reasons given above and Kokturk 2005 due to the incompatible time point. We have not pooled adults and children in this analysis. In adults, there was small improvement in PEF compared to the control group, but the confidence interval includes no difference (MD 11.91 L/min, 95% CI −4.12 to 27.95, participants 155, studies 3, I² = 13%, Analysis 2.3). A similar small and imprecise effect was seen in Mohammedzadeh 2014, the study involving children: MD 11.90 L/min, 95% CI −6.86 to 30.66, participants 80. Mohammedzadeh 2014 also reports a change from baseline "adjusted % PEF", which favours the combination of MgSO₄ and salbutamol compared to salbutamol alone (MD 6.70, 95% CI 3.80 to 9.60; data not displayed). Kokturk 2005 reported "both groups displayed comparable improvement in PEF (%) and clinical scores over 120 min" and displayed results graphically. Discharge mean (SD) per cent predicted PEF was similar in both groups (71.18 (11.55) and 70.50 (12.34)).
One study (Ahmed 2013; an abstract) reported "the percentage increase in peak flow" at 10 and 20 minutes, but the lack of clarity about whether this was a per cent change in the absolute values or a change in the per cent predicted meant we could not include data in the analyses. The study reported a greater improvement in the intervention group compared to the control group at both 10 and 20 minutes (20 (SD 4) vs 13 (3) at 10 minutes; and 35 (7) vs 24 (6) at 20 minutes).
Abreu‐Gonzalez 2002 (n = 24), also a conference abstract, selectively reports improvement in PEF at 30 minutes for people in the β₂‐agonist and MgSO₄ group compared to the placebo plus β₂‐agonist group and improvement in FEV1 at 45 minutes for those in the β₂‐agonist alone with placebo group compared to the β₂‐agonist and MgSO₄ group.
Clinical severity score
Four studies involving 575 participants reported clinical severity scores with enough detail for data extraction (Mohammedzadeh 2014; Alansari 2015; Sarhan 2016; Turker 2017), but we did not perform meta‐analysis. Pulmonary index score was significantly lower (therefore better) for those receiving MgSO₄ and β₂‐agonist compared to β₂‐agonist and placebo at 90 minutes in Mohammedzadeh 2014 (MD −0.90, 95% CI −1.43 to −0.37, participants = 80; ) but not at other time points. Sarhan 2016 reported no significant difference in change in Fischl index at two hours between the two groups (MD −0.10, 95% CI −1.22 to 1.02; participants = 20; studies = 1). Alansari 2015 reported PRAM asthma severity score at seven time points (from four to 48 hours). PRAM was significantly lower (therefore better) for those receiving placebo (saline) and β₂‐agonist and ipratropium compared to MgSO₄ and β₂‐agonist and ipratropium at the earliest time point (4 hours; MD −0.4, 95% CI −0.7 to −0.01; P = 0.05; participants = 365;) but not at later time points. Turker 2017 measured the modified pulmonary index score at 20, 40 and 120 minutes post baseline but it was only possible to extract data at 120 minutes; no between‐group difference was identified (MD 0.38, 95% CI −0.25 to 1.01; participants = 100; studies = 1).
Kokturk 2005 reported that both groups displayed comparable improvement in clinical scores over 120 minutes. Khashabi 2008 reported a non‐significant difference in respiratory distress scores, but it is not clear which score was used and the number of participants in each group is not clear. The author was contacted for further information before the 2012 update but no response was received.
Admission to hospital
Six studies involving 375 participants reported admissions for MgSO₄ and β₂‐agonist compared to β₂‐agonist and placebo (Nannini 2000; Hughes 2003; Mahajan 2004; Kokturk 2005; Aggarwal 2006; Turker 2017). Although there was a reduction in the risk of admission for people receiving the MgSO₄ intervention, the confidence interval includes no difference (risk ratio 0.78, 95% CI 0.52 to 1.15; participants = 375; studies = 6; I² = 0%). It should be noted that this analysis is dominated by evidence from adult studies. As we did not detect any statistical heterogeneity in the analysis we did not perform our prespecified subgroup analyses. One study in children reported that one child from each group required admission/re‐admission in the two weeks after discharge (Alansari 2015).
Vital signs
Three studies including 190 participants reported heart rate at 120 minutes (Aggarwal 2006; Badawy 2014; Sarhan 2016). As previously, we have not included Badawy 2014 in the analysis and combining the remaining two studies resulted in such substantial heterogeneity (I² = 82%) that we did not perform meta‐analysis (Analysis 2.5). Participants receiving MgSO₄ and β₂‐agonist had a slightly lower (therefore better) heart rate at 120 minutes compared to those receiving β₂‐agonist and placebo in Aggarwal 2006 (MD −2.70, 95% CI −6.15 to 0.75; participants = 100), but the opposite effect was seen in Sarhan 2016 (MD 22.60, 95% CI 1.61 to 43.59; participants = 20). Badawy 2014 reported a MD of −25.46 (95% CI −28.38 to −22.54) favouring the MgSO₄ group.
There was no significant difference between the two groups in systolic or diastolic blood pressure or respiratory rate in the studies reporting these outcomes.
Adverse events
Serious adverse events were reported by five studies including 243 participants (Nannini 2000; Bessmertny 2002; Hughes 2003; Mahajan 2004; Sarhan 2016). No serious events occurred in any of the studies (Analysis 2.9).
Three studies reported on mild‐moderate adverse events (Nannini 2000; Bessmertny 2002; Aggarwal 2006); and two reported all adverse events (Ahmed 2013; Alansari 2015). There was no significant difference in those experiencing one or more events between the two groups (RD −0.01, 95% CI −0.05 to 0.03; participants = 694; studies = 5; I² = 0%; Analysis 2.10); and no difference detected between adults and children.
Turker 2017 reports narratively that "no side effect caused by magnesium was observed in any of the patients in the study"; this data has not been included in the forest plots.
Aggarwal 2006 reported that tremor was the same in both groups. Khashabi 2008 reported no side effects but it is not clear how many participants were in each group, so their data were not included in this analysis. Kokturk 2005 reported that two participants in the MgSO₄ group and four in the placebo group required additional therapy. Two participants developed transient hypotension after receiving MgSO₄ and β₂‐agonist. No one needed nebulisation to be withheld. One participant in the placebo group suffered palpitations after the second salbutamol nebulisation. No other side effects were reported. Alansari 2015 reported that no participants experienced hypotension; one participant in the placebo group had excessive cough after the first nebulisation and was withdrawn by his parents; one participant in the MgSO₄ group experienced chest tightness and facial rash after the third nebulisation (both resolved after 30 minutes); and one placebo group participant required paediatric ICU admission for refractory status asthmaticus.
MgSO₄ versus β₂‐agonist alone (comparison 3)
Pulmonary function
Four studies involving 133 participants reported PEF, but due to the range of time points and ways of reporting the outcome we have not presented the results on a forest plot. Mangat 1998 found no significant difference in % predicted PEF for MgSO₄ alone compared with β₂‐agonist alone at 60 minutes (MD 4.20, 95% CI −12.29 to 20.69; participants = 33). Neki 2006 shows a significant advantage for β₂‐agonist alone but the time point reported is unclear (MD −50 L/min, 95% CI −67.83 to −32.17; participants = 4). Meral 1996 reported the mean improvement per group in PEFR (%) at five minutes, favouring the β₂‐agonist group (MD −36.77, 95% CI −61.26 to −12.28; participants = 40). Sarhan 2016 reported change in per cent predicted PEF and found no significant difference between groups (MD −1.70, 95% CI −8.45 to 5.05; participants = 20).
Clinical severity score
The Fischl index (a composite of vital signs, PEF and clinical features ranging from 0 to 7 with scores > 4 indicating acute severe asthma) was reported in three studies (Mangat 1998; Neki 2006; Sarhan 2016); and the Davies, Leffert, Drabous score (a composite measure of retraction, nasal flaring, cyanosis and wheeze) in one study (Meral 1996). We pooled the results for studies reporting the Fischl Index, which suggests no significant between‐group difference (MD −0.13, 95% CI −0.62 to 0.36; participants = 93; studies = 3; I² = 0%).
Meral 1996 reported the maximum clinical severity score in the first hour (MD −3.20; 95% CI −17.62 to 11.22; participants = 40).
Admission to hospital
There was no significant difference in risk of admission between those receiving MgSO₄ alone compared with β₂‐agonist alone (RR 0.53, 95% CI 0.05 to 5.31; participants = 33, studies = 1; Analysis 3.2); however, the wide confidence interval indicates, due to there being few events in a small trial, that equivalence cannot be claimed. With a single trial contributing data (Mangat 1998), no additional analyses were possible. Three studies did not appear to measure or report this outcome (Meral 1996; Neki 2006; Sarhan 2016).
Vital signs
Sarhan 2016 reported a significantly lower (therefore better) mean heart rate in people receiving β₂‐agonist alone compared to MgSO₄ alone (MD 21.20, 95% CI 0.17 to 42.23; participants = 20). Respiratory rate was reported as significantly lower (therefore better) in those receiving MgSO₄ alone compared to β₂‐agonist alone (MD −2.40, 95% CI −3.91 to −0.89; participants = 60; studies = 2; I² = 0%)(Neki 2006; Sarhan 2016). There was no significant difference in systolic or diastolic blood pressure between those receiving MgSO₄ alone compared with β₂‐agonist alone in the one study which reported this (Analysis 3.5; Analysis 3.6).Two studies did not appear to measure or report these outcomes (Meral 1996; Mangat 1998).
Adverse events
Two studies reported that there were no serious adverse events in either arm (participants = 53; studies = 2) (Mangat 1998; Sarhan 2016). One study reported mild to moderate adverse events and no difference was detected between groups (RD −0.17, 95% CI −0.41 to 0.06; participants = 33; Analysis 3.8). Meral 1996 also reported that there were no adverse events in either group. One study did not report adverse events (Neki 2006).
Reporting biases
Too few studies were included in any meta‐analysis to produce a funnel plot. However, the impact of publication bias was likely limited through a thorough search strategy.
Discussion
Summary of main results
This systematic review summarises evidence from twenty‐four trials including 2807 randomised participants with acute exacerbations of asthma. The most recent update added three new large trials (Goodacre 2013; Powell 2013; Alansari 2015), as well as several small trials. Overall, the results are conflicting with some, generally small, benefits seen of adding MgSO₄ to standard therapy for an exacerbation of asthma. The larger and more recent studies typically show a smaller effect than some of the older/smaller studies. Serious adverse events were rare across all four comparisons, suggesting the treatment is generally well tolerated in people experiencing moderate to severe exacerbations of asthma. Differences between studies in the populations, outcomes reported and time points limited the number of meta‐analyses performed.
Comparison 1: MgSO₄ and β₂‐agonist and ipratropium versus placebo and β₂‐agonist and ipratropium
We included seven studies in this comparison and were able to extract data on lung function, clinical severity scores, admissions to hospital, vital signs and adverse events. Although some individual studies reported improvement in lung function indices favouring the intervention group, results were inconsistent and may not be clinically relevant overall. The largest study reporting this outcome reported no between‐group difference at 60 minutes (Goodacre 2013).
Similarly, clinical severity scores typically did not demonstrate a benefit of the intervention compared to control. Powell 2013, a large study in children, reported a benefit at 60 minutes using the Yung asthma severity score, but the mean difference is unlikely to be clinically important. Admissions to hospital at initial presentation may be reduced by the addition of inhaled magnesium sulfate, but the upper end of the confidence interval includes no difference (RR 0.95, 95% CI 0.91 to 1.00) and it is hard to compare the studies as in Powell 2013 and Goodacre 2013 almost everyone was admitted to hospital, while in the smaller studies a smaller proportion of participants were admitted.
No difference was detected for re‐admissions or escalation of care to ITU/HDU, but events were generally rare. Administration of magnesium sulfate has been associated with hypotension and Goodacre 2013 reported a slightly higher diastolic blood pressure in the control group, but the effect size was small (MD 2.40 mmHg, 95% CI 0.29 to 4.51). No other between‐group differences were detected in the studies reporting vital signs. Finally, serious adverse events during admission were rare and only one study contributed to this analysis. There was no difference between groups for all adverse events during admission (RD 0.01, 95% CI −0.03 to 0.05). Goodacre 2013 reported a lower risk of all adverse events in the 30 days after admission in the placebo group, but no difference in serious adverse events (around 10% of people experience a serious adverse event and 15% an adverse event).
Comparison 2: MgSO₄ with β₂‐agonist versus β₂‐agonist
We included 15 studies in this comparison and were able to extract data on lung function, clinical severity scores, admissions to hospital, vital signs and adverse events. While some individual studies reported improvement in lung function indices favouring the intervention group, none of the pooled results showed a clinically meaningful benefit as measured by FEV1 or PEFR. Clinical severity scores were reported using a number of different scales and at different time points, but no consistent difference between the two groups was identified. Pooled results for hospital admission favoured the combination of MgSO₄ and β₂‐agonist, but the confidence interval includes the possibility of admissions increasing in the intervention group (RR 0.78, 95% CI 0.52 to 1.15). Few studies reported vital signs and of those that did, none detected a significant between‐group difference, with results often imprecise. There were no serious adverse events reported by any of the included studies and no between‐group difference for all adverse events (RD −0.01, 95% CI −0.05 to 0.03).
Comparison 3: MgSO₄ versus β₂‐agonist alone
We included five studies in this comparison and were able to extract data on lung function, clinical severity scores, admissions to hospital, vital signs and adverse events. As the evidence for use of β₂‐agonists in acute asthma is well‐established this could be considered a historical comparison, no longer in keeping with current clinical practice. Two studies reported a benefit in lung function of β₂‐agonist over MgSO₄ alone and two studies reported no difference; we did not pool these results. No between‐group difference was detected for clinical severity scores (Fischl index) but results are based on only a few small studies, which measured at different time points (MD −0.13, 95% CI −0.62 to 0.36; participants = 93). Admissions to hospital were only reported by one small study and events were rare, leading to an uncertain result. Effects on vital signs were inconsistent; one small study reported lower heart rate in the β₂‐agonist group, while pooled results from two studies found a lower respiratory rate in the MgSO₄ group. No serious adverse events were reported in any of the studies in this comparison; one small study reported mild to moderate adverse events but the result is imprecise.
Overall completeness and applicability of evidence
Comparisons 1 and 2, in which MgSO₄ was combined with other bronchodilators, are the most consistent with current clinical guidance, and therefore most applicable to practice (BTS/SIGN 2016; GINA 2017). Comparison 3, in which MgSO₄ was the only inhaled bronchodilator given during the intervention period in one arm, could be considered a more historical comparison. Given the strong evidence of the efficacy of beta‐agonists in acute asthma, it is unlikely that studies with this design would receive ethical approval in many settings.
Within comparisons 1 and 2, populations, interventions, outcomes and time points were heterogeneous, which limited the number of meta‐analyses performed and therefore the conclusions reached. However three large, well‐powered studies of high methodological quality were added to this 2017 update and overall did not demonstrate a substantial benefit of the addition of inhaled MgSO₄ to standard therapy (Goodacre 2013; Powell 2013; Alansari 2015), although modest benefits were seen in some individual studies and meta‐analyses. However, we were not able to fully implement our planned subgroup analysis for severity and thus there remains uncertainty about whether those with more severe exacerbations derive greater benefit.
The included studies used a variety of different dosing regimens for MgSO₄, including different numbers and frequency of doses and different MgSO₄ formulations. The precise regimen was not described in all included studies (Table 3). A limitation of this review is that we did not attempt to subgroup studies according to dosing regimen used. It is possible that this is an important effect modifier which may require further investigation. Also, we have not attempted to explore the cost‐effectiveness of using inhaled MgSO₄; any clinical benefits need to be considered in the context of possible increased costs associated with delivering MgSO₄ and monitoring patients during treatment.
We chose lung function (FEV1 and PEFR) as the primary outcome in this review. Lung function may be considered a surrogate outcome in asthma and does not always correlate well with a patient's symptoms, quality of life and asthma control (Carranza Rosenzweig 2004; Aburuz 2005). In an acute setting, however, lung function — particularly peak flow — is frequently used to guide management and assess response to therapy; and validated patient‐reported outcomes such as the Asthma Control Questionnaire and Asthma Quality of Life Questionnaire have limited applicability during acute exacerbations.
Other uncertainties in the findings are introduced by the lack of consistency between settings in deciding whether, and if so when, to admit patients from the emergency department into the hospital. There were marked differences between studies in terms of the proportion of patients admitted; this may reflect different practices in different hospitals, varied exacerbation severity in those recruited and differences between practices in paediatric and adult populations. Although these variations should be accounted for in the randomisation process within each trial, it introduces clinical heterogeneity into our meta‐analyses and further complicates the interpretation of the evidence.
Finally, adverse events were not consistently reported by all studies. However, we were able to extract data extracted from the more recent larger studies and the combined evidence suggest that inhaled MgSO₄ is unlikely to be associated with an important increase in serious adverse events in the populations studied — it should be noted that events were rare.
Quality of the evidence
Our confidence in the results presented in this review ranges from high to very low, but overall most of the evidence was rated as being of low or very low quality. This means the true effect may be substantially different from the estimate of the effect presented. Please see summary of findings Table for the main comparison; summary of findings Table 2; summary of findings Table 3 for full details of our GRADE assessments. Our confidence was reduced by a number of different considerations.
Most studies were at unclear or high risk of bias in multiple domains; only four studies were considered to be at low risk of bias in all domains (Aggarwal 2006; Goodacre 2013; Powell 2013; Alansari 2015). Many studies did not clearly report their methods of randomisation or allocation. In some studies it was not clear who was masked to treatment group assignment and we had concerns about attrition bias and selective reporting in multiple studies. We downgraded for study limitations when we were judged that a study about which we had important methodological concerns contributed sufficient weight to analysis to potentially affect the overall estimate.
Imprecision was also a problem in many of the meta‐analyses with sample sizes too small and events too few to rule out potential important harm or benefit of the intervention. This was a problem in the lung function, hospitalisation and adverse event analyses. Unexplained statistical heterogeneity was encountered less frequently but this may be a result of us being unable to perform meta‐analyses with substantial numbers of studies contributing data. Indirectness was not thought to be a problem in any of the outcomes to which we applied GRADE and we did not have sufficient studies in any one analysis to formally assess publication bias using a funnel plot.
Potential biases in the review process
Publication bias may have influenced the result of this meta‐analysis. For example, by missing unpublished negative trials we may be over‐estimating the effect of MgSO₄ treatment. In order to reduce bias, however, a comprehensive and systematic search of the published and unpublished literature for potentially relevant studies was conducted and we have recently updated it. This was followed by our attempts to contact corresponding and first authors. However, we recognise that unpublished data may exist.
We conducted our review in accordance with Cochrane methods and have detailed changes between the protocol and the review in Differences between protocol and review section. One such difference, which may have introduced bias, is the selection of the '60 minute' time point for reporting outcomes. Many studies reported outcome at multiple time points and for consistency we selected the outcome closest to 60 minutes from baseline for meta‐analysis. We chose this time point by consensus to maximise the homogeneity of pooled results and because this was identified as a clinically relevant time point for decision making about treatment escalation (i.e. there would be an expectation that most patients are showing a response to treatment with an hour). It is conceivable that choice of a different time point might have led to different conclusions, especially for the lung function and clinical severity score indices, which may be more susceptible to fluctuations over short periods of time.
Agreements and disagreements with other studies or reviews
The conclusions in this updated Cochrane Review are broadly consistent with the previous version of the review (Powell 2012): that there may be some modest benefits associated with addition of magnesium sulfate (MgSO₄) to standard therapy for acute asthma. However, the addition of several large and well‐conducted studies suggests that there is unlikely to be a substantial additional benefit associated with the addition of inhaled MgSO₄. Although we now have more data in children and the effect appears to be similar to that seen in adults, formal subgrouping by age was not always possible due to lack of sufficient data and between‐trial heterogeneity.
To our knowledge, no other systematic review has included as many primary studies as the present review and therefore conclusions are not entirely comparable and findings are somewhat conflicting. Overall, systematic reviews published to date have failed to demonstrate a conclusive benefit of inhaled magnesium sulfate in acute asthma and have suggested the role of the intervention remains unclear. For example, a systematic review published in 2006 included six studies, all of which are included in the present review. Despite some evidence of benefit, the authors were unable to reach conclusions due to lack of evidence and stated that the role of inhaled magnesium sulfate remains unclear. Similarly, a 2005 review also included six studies and concluded that nebulised MgSO₄ may confer some benefits in terms of pulmonary function and hospital admission, but called for more research (Blitz 2005). These findings are also consistent with the systematic review by Mohammed 2007.
More recently, a 2016 systematic review summarised the literature for both inhaled and intravenous magnesium sulfate in children with acute asthma (Su 2017). The review included four studies of nebulised magnesium sulfate in children, three of which we included and one which we excluded as it was a study of methacholine challenge test in stable asthma. The review concluded there was no impact on hospital admission or lung function. Similarly, a 2012 systematic review in adults included six studies of nebulised MgSO₄ (all of which are included in the present review) and concluded that there was insufficient evidence to recommend the use of this intervention (Song 2012). A 2016 review identified 10 relevant trials and concluded "adding nebulized MgSO₄ neither improved pulmonary function nor reduced the number of hospital admissions in adult patients with acute asthma" (Ling 2016). Finally, a 2013 review of both intravenous and inhaled magnesium sulfate suggested that there is a benefit for adults in terms of hospital admissions and lung function, but no benefit seen in children (Shan 2013). However, this study included only nine trials of inhaled magnesium sulfate, all of which are included in the present review with the exception of one, because we did not consider it to be an RCT.
Finally, two recent Cochrane Reviews have examined the efficacy and safety of intravenous (IV) MgSO₄ in adults and children with acute asthma (Griffiths 2016; Kew 2014). The review in adults included 14 studies, randomising over 2000 participants, and concluded that "a single infusion of 1.2 g or 2 g IV MgSO₄ over 15 to 30 minutes reduces hospital admissions and improves lung function in adults with acute asthma who have not responded sufficiently to oxygen, nebulised short‐acting beta₂‐agonists and IV corticosteroids". Limited evidence was found for other measures of benefit and safety (Kew 2014). The evidence in children is more limited with only five studies, involving 182 children, included in the review (Griffiths 2016). The authors conclude that IV MgSO₄ may reduce the need for hospital admission in children with moderate to severe asthma exacerbations, but emphasise the small number of trials and participants. Clinicians managing acute asthma and considering the use of a magnesium preparation will need to choose between the inhaled and IV route; at this time, the evidence for IV magnesium may seem more persuasive, in keeping with guidance (BTS/SIGN 2016).
Study flow diagram: review update

'Risk of bias' summary: review authors' judgements about each risk of bias item for each included study.

In the control group 82 people out of 100 had hospital admission , compared to 78 (95% CI 75 to 82) out of 100 for the active treatment group.
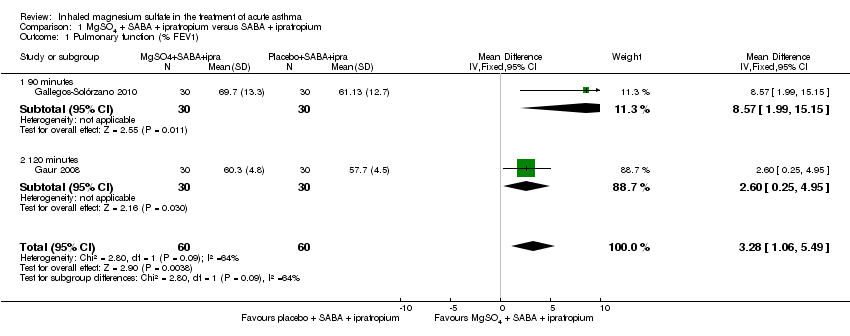
Comparison 1 MgSO4 + SABA + ipratropium versus SABA + ipratropium, Outcome 1 Pulmonary function (% FEV1).

Comparison 1 MgSO4 + SABA + ipratropium versus SABA + ipratropium, Outcome 2 Pulmonary function % predicted PEF.

Comparison 1 MgSO4 + SABA + ipratropium versus SABA + ipratropium, Outcome 3 Clinical severity scores (closest to 60 mins).
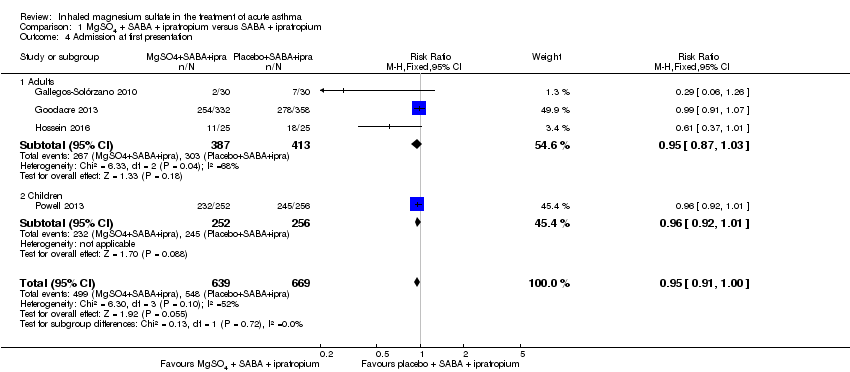
Comparison 1 MgSO4 + SABA + ipratropium versus SABA + ipratropium, Outcome 4 Admission at first presentation.

Comparison 1 MgSO4 + SABA + ipratropium versus SABA + ipratropium, Outcome 5 HDU/ITU admission.

Comparison 1 MgSO4 + SABA + ipratropium versus SABA + ipratropium, Outcome 6 Readmission.
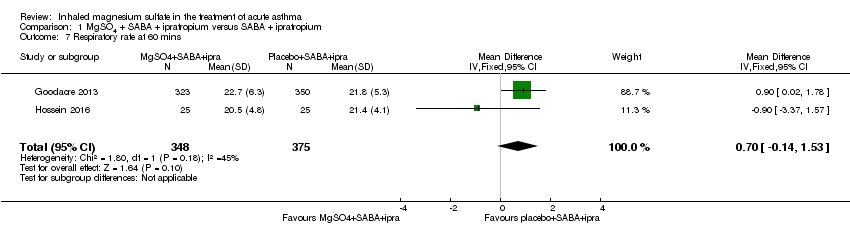
Comparison 1 MgSO4 + SABA + ipratropium versus SABA + ipratropium, Outcome 7 Respiratory rate at 60 mins.
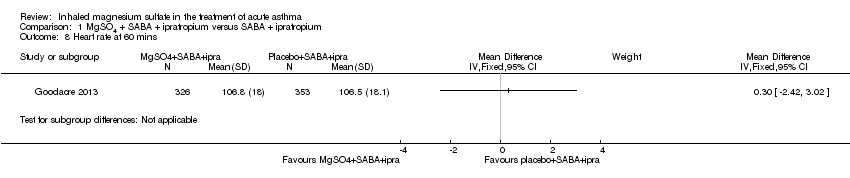
Comparison 1 MgSO4 + SABA + ipratropium versus SABA + ipratropium, Outcome 8 Heart rate at 60 mins.

Comparison 1 MgSO4 + SABA + ipratropium versus SABA + ipratropium, Outcome 9 Systolic blood pressure at 60 mins.

Comparison 1 MgSO4 + SABA + ipratropium versus SABA + ipratropium, Outcome 10 Diastolic blood pressure at 60 mins.
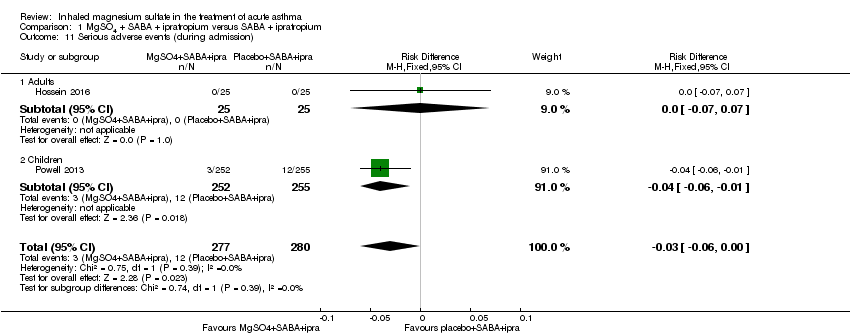
Comparison 1 MgSO4 + SABA + ipratropium versus SABA + ipratropium, Outcome 11 Serious adverse events (during admission).

Comparison 1 MgSO4 + SABA + ipratropium versus SABA + ipratropium, Outcome 12 Any adverse event (during admission).
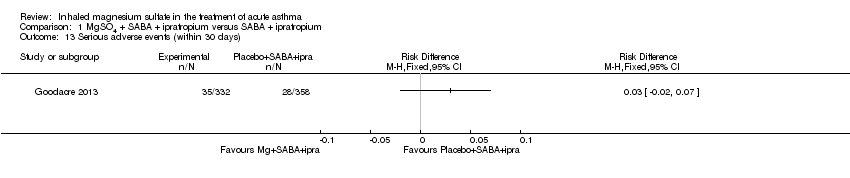
Comparison 1 MgSO4 + SABA + ipratropium versus SABA + ipratropium, Outcome 13 Serious adverse events (within 30 days).

Comparison 1 MgSO4 + SABA + ipratropium versus SABA + ipratropium, Outcome 14 Any adverse event (within 30 days).
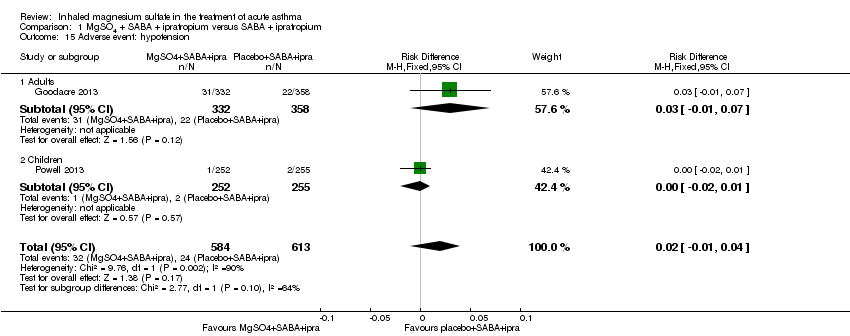
Comparison 1 MgSO4 + SABA + ipratropium versus SABA + ipratropium, Outcome 15 Adverse event: hypotension.

Comparison 1 MgSO4 + SABA + ipratropium versus SABA + ipratropium, Outcome 16 Adverse event: flushing.

Comparison 2 MgSO4 + SABA versus SABA, Outcome 1 Pulmonary function % predicted FEV1.
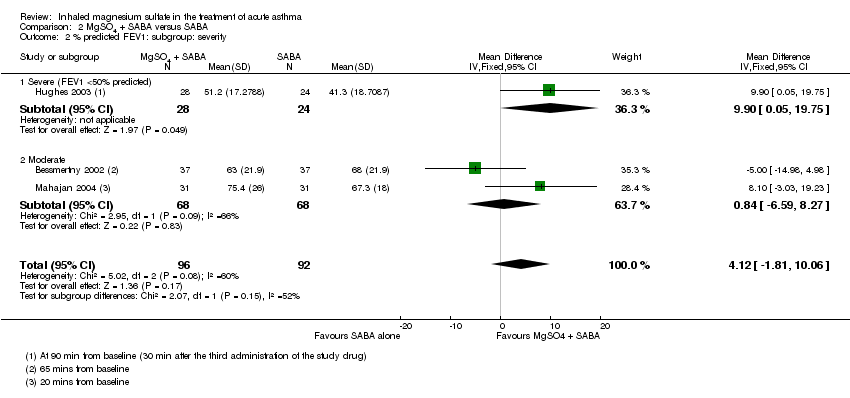
Comparison 2 MgSO4 + SABA versus SABA, Outcome 2 % predicted FEV1: subgroup: severity.

Comparison 2 MgSO4 + SABA versus SABA, Outcome 3 Pulmonary function PEF L/min.

Comparison 2 MgSO4 + SABA versus SABA, Outcome 4 Admission to hospital.
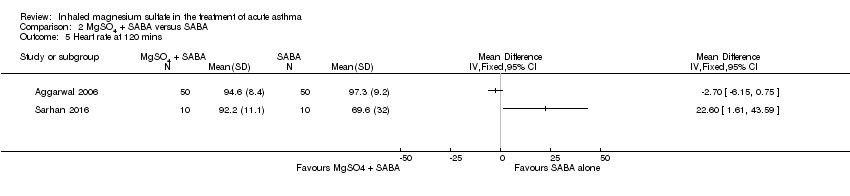
Comparison 2 MgSO4 + SABA versus SABA, Outcome 5 Heart rate at 120 mins.
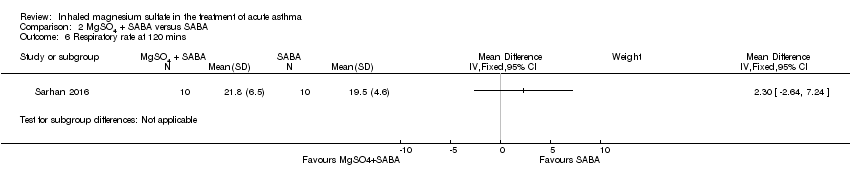
Comparison 2 MgSO4 + SABA versus SABA, Outcome 6 Respiratory rate at 120 mins.

Comparison 2 MgSO4 + SABA versus SABA, Outcome 7 Diastolic blood pressure at 120 mins.

Comparison 2 MgSO4 + SABA versus SABA, Outcome 8 Systolic blood pressure at 120 mins.

Comparison 2 MgSO4 + SABA versus SABA, Outcome 9 Serious adverse events.
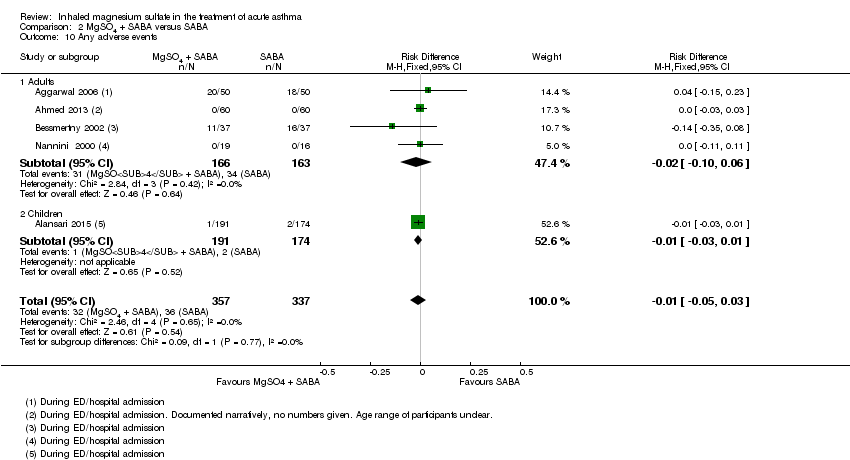
Comparison 2 MgSO4 + SABA versus SABA, Outcome 10 Any adverse events.

Comparison 3 MgSO4 versus SABA, Outcome 1 Clinical severity score.

Comparison 3 MgSO4 versus SABA, Outcome 2 Admission to hospital.

Comparison 3 MgSO4 versus SABA, Outcome 3 Heart rate (120 mins).
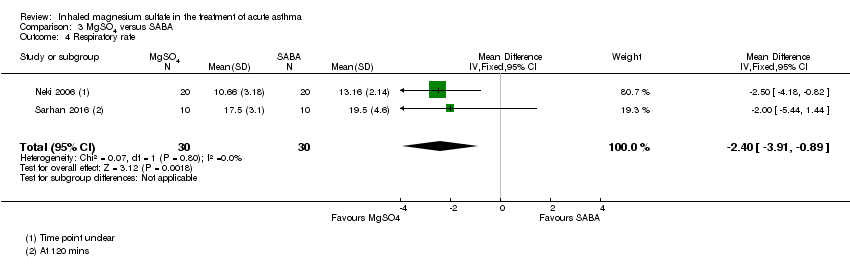
Comparison 3 MgSO4 versus SABA, Outcome 4 Respiratory rate.
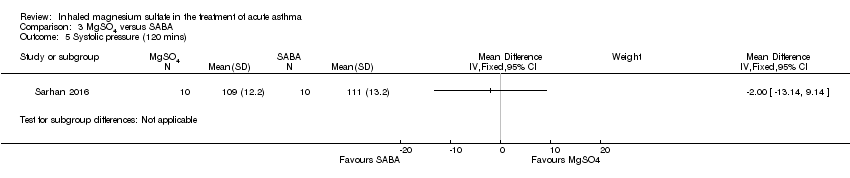
Comparison 3 MgSO4 versus SABA, Outcome 5 Systolic pressure (120 mins).
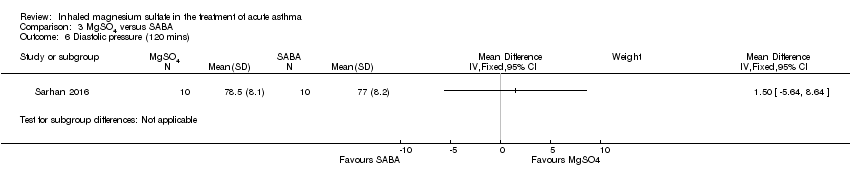
Comparison 3 MgSO4 versus SABA, Outcome 6 Diastolic pressure (120 mins).
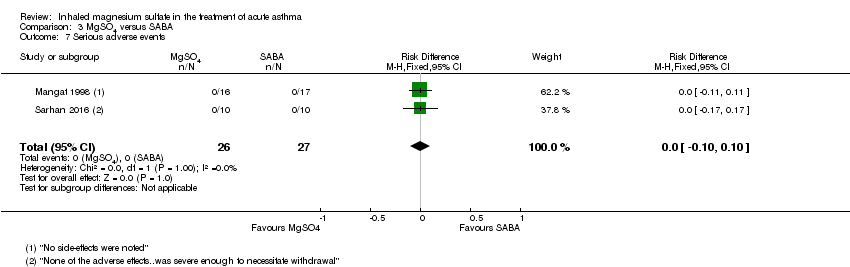
Comparison 3 MgSO4 versus SABA, Outcome 7 Serious adverse events.

Comparison 3 MgSO4 versus SABA, Outcome 8 Mild‐Moderate Side Effects.
| MgSO₄+ SABA + ipratropium compared to SABA + ipratropium in the treatment of acute asthma | ||||||
| Patient or population: adults and children with acute exacerbation of asthma | ||||||
| Outcomes | Anticipated absolute effects* (95% CI) | Relative effect | № of participants | Quality of the evidence | Comments | |
| Risk with SABA + ipratropium | Risk with MgSO4 + SABA + ipratropium | |||||
| Pulmonary function (% predicted FEV1) (90 to 120 minutes) | The mean pulmonary function (% predicted FEV1) was 65% | % predicted FEV1 was 3.28% higher | ‐ | 120 | ⊕⊝⊝⊝ | Outcome measured at 90 mins in 1 study and 120 mins in the other. 1 study (Gaur 2008) has reported much smaller standard deviations and contributes almost 90% of analysis weight |
| Pulmonary function % predicted PEF (60 minutes) | The mean pulmonary function % predicted PEF was 50.45% | % predicted PEF was 0.05 higher | ‐ | 636 | ⊕⊕⊕⊝ | Both studies in adults Mean control group % predicted PEF was 36% in 1 study and 64.9% in the other |
| Clinical severity scores (60 minutes) | The mean dyspnoea VAS was 31.8; the mean Yung ASS was 4.95 | SMD 0.01 higher | ‐ | 1130 | ⊕⊕⊝⊝ | 1 study reported Yung ASS and the other change in dyspnoea VAS |
| Admission at first presentation | 819 per 1000 | 778 per 1000 | RR 0.95 | 1308 | ⊕⊕⊕⊝ | Adults vs children test for subgroup difference: P = 0.72, I² = 0% |
| Readmission (7 to 30 days) | 26 per 1000 | 46 per 1000 | RR 1.80 | 750 | ⊕⊕⊝⊝ | Outcome measured at 7 days in 1 study and 30 days in the other. |
| Serious adverse events (during admission) | 43 per 1000 | Not estimable. See comment. | ‐ | 557 | ⊕⊕⊕⊝ | Risk difference: −0.03 (95% CI −0.06 to 0.00) Adults vs children test for subgroup difference: P = 0.39, I² = 0% Goodacre 2013 also reported participants with 1 or more SAE within 30 days: 35/332 in the MgSO₄ group and 28/358 in the placebo group (RD: 0.03; 95% CI −0.02 to 0.07) |
| Any adverse event (during admission) | 144 per 1000 | Not estimable. See comment. | ‐ | 1197 | ⊕⊕⊕⊕ | Risk Difference: 0.01 (95% CI −0.03 to 0.05) Adults vs children test for subgroup difference: P = 0.34, I² = 0% Goodacre 2013 also reported participants with 1 or more adverse event within 30 days: 52/332 in the MgSO₄ group and 36/358 in the placebo group (OR 1.66, 95% CI 1.05 to 2.62) |
| *The risk in the intervention group (and its 95% confidence interval) is based on the assumed risk in the comparison group and the relative effect of the intervention (and its 95% CI). | ||||||
| GRADE Working Group grades of evidence | ||||||
| 1 One study contributing most of weight at unclear risk of bias in multiple domains (−1 study limitations) 2 I² > 50% (−1 inconsistency) 3 Studies equal size but one study contributes almost 90% of weight to analysis due to much smaller standard deviations. Result no longer significant if random‐effects model applied (−1 imprecision) 4 Although one study at unclear risk of bias in several domains, the larger study, which contributes vast majority of weight to analysis, if of high methodological quality (no downgrade) 5 Although confidence interval includes no difference, they are sufficiently tight to effectively rule out an important between‐group difference (no downgrade) 6 Confidence intervals include both harm and benefit of intervention (−1 imprecision) 7 Although two of the studies at unclear risk of bias in several domains the two large studies contributing nearly 95% of weight in analysis are both of high methodological quality (no downgrade) 8 Although the I² = 52%, the two large studies contributing to this analysis show consistent results (no downgrade) 9 Confidence intervals include no difference (−1 imprecision) 10 Confidence intervals include no difference and appreciable harm or benefit of the intervention (−2 imprecision) 11 Events rare and confidence intervals include no difference (−1 imprecision) | ||||||
| MgSO₄+ SABA compared to SABA in the treatment of acute asthma | ||||||
| Patient or population: adults and children with acute exacerbation of asthma | ||||||
| Outcomes | Anticipated absolute effects* (95% CI) | Relative effect | № of participants | Quality of the evidence | Comments | |
| Risk with SABA | Risk with MgSO4 + SABA | |||||
| Pulmonary function % predicted FEV1 (20 minutes to 2 to 3 h) | The mean pulmonary function % predicted FEV1 was 56.55% | % predicted FEV1 was 3.34% higher | ‐ | 208 | ⊕⊕⊝⊝ | Adults vs children test for subgroup difference: P = 0.35, I² = 0% Severe vs moderate asthma exacerbation test for subgroup difference: P = 0.15, I² = 51.8% (favouring a greater effect in the more severe subgroup) |
| Pulmonary function PEF L/min ‐ Adults (20 minutes to 2 to 3 h) | The mean pulmonary function PEF was 233 L/min | PEF was 11.91 L/min higher | ‐ | 155 | ⊕⊕⊝⊝ | |
| Pulmonary function PEF L/min ‐ Children (60 minutes) | The mean pulmonary function PEF was 143.5 | PEF was 11.9 L/min higher | ‐ | 80 | ⊕⊕⊝⊝ | |
| Admission to hospital at initial presentation | 202 per 1000 | 158 per 1000 (105 to 233) | RR 0.78, (0.52 to 1.15) | 375 | ⊕⊕⊝⊝ | Adults vs children test for subgroup difference: P = 0.35, I² = 0% |
| Serious adverse events (During ED/hospital admission) | Not estimable | Not estimable. See comment | ‐ | 243 | ⊕⊕⊝⊝ | Risk difference: 0.00 (95% CI −0.04 to 0.04) No events reported |
| Any adverse events (During ED/hospital admission) | 107 per 1000 | Not estimable. See comment | ‐ | 694 | ⊕⊕⊝⊝ | Risk difference: −0.01 (95% CI −0.05 to 0.03) Adults vs children test for subgroup difference: P = 0.77, I² = 0% |
| *The risk in the intervention group (and its 95% confidence interval) is based on the assumed risk in the comparison group and the relative effect of the intervention (and its 95% CI). | ||||||
| GRADE Working Group grades of evidence | ||||||
| 1 Several studies were at unclear or high risk of bias in one or more domain (−1 study limitations) 2 Confidence intervals include both possible harm and benefit of the intervention (−1 imprecision) 3 Study at unclear risk of bias in several domains (−1 study limitations) 4 No events reported but less than 250 participants in total. Risk difference confidence intervals include a possible important harm or benefit of the intervention (−1 imprecision) | ||||||
| MgSO₄compared to SABA in the treatment of acute asthma | ||||||
| Patient or population: adults and children with acute exacerbation of asthma | ||||||
| Outcomes | Anticipated absolute effects* (95% CI) | Relative effect | № of participants | Quality of the evidence | Comments | |
| Risk with SABA | Risk with MgSO4 | |||||
| Lung function | Reported narratively in text | |||||
| Clinical severity score ‐ Fischl index (120 minutes) | The Fischl index score was 2.1 | Fischl index score 0.13 lower | ‐ | 93 | ⊕⊝⊝⊝ | Time point 120 minutes in 2 studies and unclear in the third study Wide range of control group scores (0.3, 0.76 and 4.81). Scale out of 7 with higher score indicating more severe symptoms. 4.81 reported in study with unclear time point. |
| Admission to hospital at initial presentation | 118 per 1000 | 62 per 1000 | RR 0.53 | 33 | ⊕⊝⊝⊝ | |
| Serious adverse events (During ED/hospital admission) | Not estimable | Not estimable. See comment | 53 | ⊕⊕⊝⊝ | Risk difference: 0.00 (95% CI −0.10 to 0.10) No events reported | |
| *The risk in the intervention group (and its 95% confidence interval) is based on the assumed risk in the comparison group and the relative effect of the intervention (and its 95% CI). | ||||||
| GRADE Working Group grades of evidence | ||||||
| 1 Several studies at unclear or high risk of bias in one or more domains (−1 study limitations) 2 Confidence intervals include both possible harm and benefit of the intervention (−1 imprecision) 3 Time‐point for measurement unclear in one study (−1 indirectness) 4 Study at unclear risk of bias in several domains (−1 study limitations) 5 One small study. Confidence intervals include appreciable harm or benefit of the intervention (−2 imprecision) 6 Two small studies. No events reported. Risk difference confidence intervals include appreciable harm or benefit of the intervention (−1 for imprecision) | ||||||
| Study | Severity of asthma exacerbation | Diagnosis based on | Population (adult/mixed/paediatric) |
| MgSO₄ and SABA and Ipratropium bromide versus SABA and Ipratropium | |||
| Severe | BTS definition clinical features | Paediatric (2 to 16) | |
| Unclear | PEF and clinical signs | Adults | |
| Moderate to severe | FEV1 < 60% | Adults >18 | |
| Severe | FEV1 < 30% | Adults (18 to 60) | |
| Severe | BTS definition | Adult (≥ 16) | |
| Moderate to severe | PEF < 70% and clinical signs | Adult (> 16) | |
| Severe after conventional treatment | BTS definition | Paediatric (2 to 16) | |
| MgSO4 and SABA versus SABA | |||
| Moderate | FEV1 and PEF at baseline | Adults | |
| Severe and life threatening | BTS definition clinical features and PEF | Mixed (13 to 60) | |
| Severe | PEF | Not documented | |
| Moderate to severe | Clinical score | Paediatric (2 to 14) | |
| Unclear | N/A | Adult | |
| Moderate to severe | PEF between 40% to 80% | Adults (18 to 65) | |
| Severe | PEF < 50% | Adults | |
| Severe | FEV1 < 50% | Adults (16 to 65) | |
| Unclear | Clinically defined as respiratory distress | Paediatric (mean age 3.55 years) | |
| Moderate to severe | Clinical scores and PEF | Adults (18 to 60) | |
| Moderate to severe | FEV1 between 45% and 75% | Paediatric (5 to 17) | |
| Moderate to severe | GINA definition | Paediatric (5 to 14) | |
| Severe | PEF < 50% | Adult (> 18) | |
| Unclear | PEF < 300L/min | Mixed (11 to 70) | |
| Moderate | Not described | Children (3 to 15) | |
| MgSO₄ versus SABA | |||
| Severe | PEF < 50% | Adults | |
| Moderate to severe | PEF < 300 L/Min | Mixed (12 to 60) | |
| Moderate to severe | PEF < 75% | Paediatric | |
| Severe | FEV1 < 40% or PEF < 300 L/Min | Adult (15 to 60) | |
| Unclear | PEF < 300L/min | Mixed (11 to 70) | |
| BTS: British Thoracic Society GINA: Global Initiative for Asthma | |||
| Study | Presentation to which department? | Origin | Primary outcome(s) | Total n randomised | Side effects (patients in study) | Pharmaceutical exclusions | Other Interventions |
| MgSO₄ and SABA and Ipratropium bromide versus SABA and Ipratropium | |||||||
| Children’s Assessment Unit after GP referral | Cardiff, Wales | ASS (Yung) | 17 | 1 tingling in fingers and 1 transient hypotension | None stated | All management followed the BTS/SIGN guidelines; all children received 2 mg/kg prednisolone | |
| ED | USA | PEF, admissions | 110 | No comment on side effects in paper | Not stated | All subjects received 50 mg of oral prednisone at the onset of the treatment | |
| ED | Mexico City, Mexico | % change FEV1, O₂ post treatment, admission rates | 112 | Dry and bitter mouth (MgSO₄ group 1), dizziness (MgSO₄ 1; placebo 1) | Use of steroids prior to presentation | All participants received one IV dose of 125 mg methylprednisolone at admission and 1 mg/kg/day for 10 days prednisolone,on discharge. Other treatments were administered according to the treating physician | |
| ED | Delhi, India | FEV1 | 60 | None reported | None stated | All participants received IV hydrocortisone on arrival | |
| ED | UK | Admission within 7d, visual analogue scale for breathlessness at 2 h | 703 | AEs (41 MgSO₄/salbutamol; 36 placebo/salbutamol) | MgSO₄ in the past 24 h | All participants were managed according to BTS/SIGN guidelines (consisting of | |
| ED | Tehran, Iran | PEFR improvement, admission rate | 50 | No serious side effects reported | None stated | All participants received 50 mg oral prednisolone | |
| ED and children's assessment units | UK | Yung asthma severity score | 508 | 47 in MgSO₄ group and 59 in control group | None | Hospital‐defined conventional treatment | |
| MgSO4 and SABA versus SABA | |||||||
| ‐ | Tenerife Spain | FEV1, PEF | 24 | None reported | None stated | Not stated | |
| ED | New Delhi India | PEF | 100 | Palpitations (MgSO₄/salbutamol 13; salbutamol/placebo 11) and tremors (7; 7). | None stated | Clinicians free to administer steroids, salbutamol, IV hydrocortisone if judged to be required | |
| ‐ | Mymensingh, Bangladesh | PEF | 120 | None reported | None stated | Not stated | |
| Paediatric emergency centre | Doha, Qatar | Time to readiness for discharge | 400 | Chest tightness and facial rash (MgSO₄/salbutamol 191), excessive cough (placebo/salbutamol 174) | None stated | All participants received methylprednisolone 1 mg/kg IV every 12h and additional nebulised albuterol at clinicians' discretion | |
| Outpatient department and ED | Sohag, Egypt | Exacerbations post intervention, delivery outcome, post‐partum health status | 60 | None reported | None stated | All participants received 100 mg hydrocortisone IV, 500 mg aminophylline IV | |
| ED | Brooklyn, USA | FEV1 (% pred) | 74 | No SAEs reported | No theophylline or anticholinergics 2 h prior to presentation | Intravenous hydrocortisone, 2 mg/kg | |
| ED | Ajmer India | PEF | 71 | "Side effects were self limiting" | Not stated | Not stated | |
| ED | Wellington New Zealand | FEV1 | 52 | None reported | None | All participants received 100 mg hydrocortisone IV | |
| ‐ | Urmia, Iran | Reduced mean duration of O₂ therapy in MgSO₄ group, no change in Respiratory Distress Score) | 40 | No side effects | Not stated | Not stated | |
| ED | Gazi, Turkey | PEF difference | 26 | Transient hypotension (1 MgSO₄), palpitation (1 salbutamol) | None | All participants received 1 mg/kg prednisolone. Theophylline, anticholinergics and salbutamol given at clinicians discretion | |
| ED | Detroit, USA | % change in FEV1 | 62 | No side effects | Steroids, ipratropium or theophylline in the last 3 days. | All participants received 2 mg/kg of prednisone | |
| ‐ | Babol, Iran | Pulmonary index, PEFR, adjusted PEFR | 80 | ‐ | Corticosteroids; steroids, theophylline or ipratropium use within last 72 h | Not stated | |
| ED | 4 hospitals in Argentina | PEF, admissions | 35 | None reported | Oral or parenteral steroids in the last 7 days | No other medications were permitted during the study except | |
| Chest and ED | Minia, Egypt | Clinical improvement, PEFR | 30 | None severe enough to warrant withdrawal | Bronchodilators in last 6 h, steroids in last 12 h | Nebulised salbutamol, IV hydrocortisone, IV aminophylline at clinicians' discretion | |
| ED | Turkey | Modified pulmonary index score | 100 | "No side effect caused by magnesium was observed in any of the patients in the study" | Not stated | Nebulised salbutamol (0.15 mg/kg), methylprednisolone 1 mg/kg IV; Oxygen was given to patients with SaO2≤ 95% | |
| MgSO₄ versus SABA | |||||||
| ED | Ajmer India | PEF | 71 | "Side effects were self limiting" | Not stated | Not stated | |
| ED | St John’s College, India | PEF, Fischl index score, admissions | 33 | Transient self limiting hypotension (1) palpitation (1) tremors (2) all in control group and only 1 transient hypotension in MgSO₄ group (33) | Oral parenteral bronchodilators (6 h) steroids (last 12 h) | All participants received 100 mg hydrocortisone IV | |
| ‐ | Izmir, Turkey | % change in PEF ASS (Davies Leffert, Dabbous score) | 40 | No side effects | Beta2‐agonists or theophylline in the last 12 h | No other medication given | |
| ‐ | Amritsar Punjab | PEF, RR, Fischl index | 40 | ‐ | Oral, inhaled or parenteral steroids in last 12 h | All participants received 100 mg hydrocortisone IV | |
| Chest and ED | Minia, Egypt | Clinical improvement, PEFR | 30 | None severe enough to warrant withdrawal | Bronchodilators in last 6 h, steroids in last 12 h | Nebulised salbutamol, IV hydrocortisone, IV aminophylline at clinicians' discretion | |
| ASS: Asthma Severity Score; BP: blood pressure; ED: emergency department; FEV1: Forced expiratory volume in 1 second; h: hour(s) | |||||||
| Study (N) | Magnesium sulfate | Control | ||||
| Dose | N | Co‐interventions | Dose | N | Co‐interventions | |
| MgSO₄ and SABA and Ipratropium bromide versus SABA and Ipratropium | ||||||
| 2.5 mL isotonic MgSO₄ (151 mg /dose) | 7 | 500 mcg Ipratropium bromide 2.5 mg salbutamol or 5 mg salbutamol (depending on age) 3 times per h | 2.5 mL of isotonic saline) | 10 | Same as for MgSO₄ group | |
| 150 mg MgSO₄ (0.3 mL of 50% MgSO₄ heptahydrate) | 60 | Albuterol sulfate (0.5%) 5 mg/mL) and 0.5 mg ipratropium bromide (0.02% inhalation solution) (frequency*) | No placebo so volume will be less: i.e. blinding may be an issue) | 50 | Same as for MgSO₄ group | |
| 3 mL (333 mg) of 10% isotonic MgSO₄ (1 g/10 mL) | 60 (30 withdrawals) | 2.5 mg albuterol and 500 mcg ipratropium 3 doses per hour | 3 mL isotonic saline | 52 (22 withdrawals) | Same as for MgSO₄ group | |
| 3 mL (3.2 g%) isotonic MgSO₄ | 30 | Salbutamol and ipratropium (dose*, frequency*) | Saline | 30 | Same as for MgSO₄ group | |
| 2 mmol MgSO₄ | 339 (7 withdrawal) | 7.5 mL 0.9% NaCl nebulised, 3 doses; 100 mL 0.9% NaCl IV once, BTS/SIGN standard treatments plus others at clinicians' discretion | 7.5 mL 0.9% saline nebulised, 3 doses, 100 mL 0.9% NaCl IV once | 364 (7 withdrawal) | BTS/SIGN standard treatments plus others at clinicians' discretion | |
| 3 mL (260 mmol/L) MgSO4 | 25 | 2.5 mg salbutamol, 0.5 mg ipratropium nebulised every 20 to 60 minutes, 50 mg oral prednisolone (once*) | 3 mL 0.9% NaCl | 25 | Same as for MgSO₄ group | |
| 2.5 mL 250 mmol/L MgSO₄ | 252 (13 withdrawals) | 3 doses every 20 min. Hospital‐defined conventional treatment | 2.5 mL isotonic saline | 256 (10 withdrawals) | Same as for MgSO₄ group | |
| MgSO4 and SABA versus SABA | ||||||
| 2 mL MgSO₄ (isotonic) | 13 | 400 mcg salbutamol (once*) | 2 mL of a physiological serum of an inhaled form 11 patients | 11 | 400 mcg salbutamol | |
| 1 mL of 500 mg/mL MgSO₄ | 50 | 1 mL salbutamol (dose*, 8 mL distilled water, (295 mOsml/kg) 3 times per h ultrasonic nebuliser | 7.5 mL normal saline | 50 | 1 mL salbutamol (dose*), 1.5 mL distilled water (287 mOsml/kg) 3 times per h | |
| MgSO₄ (dose* frequency*) | 60 | Not recorded | Normal saline (dose* frequency*) | 60 | Not recorded | |
| 800 mg (15 mL) MgSO₄ | 208 (17 withdrawals) | 5 mg albuterol, divided into 3 doses over 1 h. Methylprednisolone 1 mg/kg IV every 12 h. 3 doses nebulized 1 mL albuterol (5 mg/mL), 250 mcg ipratropium, 2 mL normal saline before trial doses started | 15 mL 0.9% NaCl | 192 (18 withdrawals) | Same as for MgSO₄ group | |
| 500 mg (1mL) MgSO₄ | 30 | 1 mL salbutamol solution (dose*), 8 mL 0.9% NaCl, max 3 doses with 20 mins apart. 100 mg hydrocortisone IV, 500 mg aminophylline IV (once*) | 1 mL 0.9% NaCl | 30 | Same as for MgSO₄ group | |
| MgSO₄ (384 mg) | 37 (3 withdrawals) | Followed by ( i.e. not mixed) albuterol 2.5 mg/mL 3 times per h | Normal saline (no volume documented) | 37 (3 withdrawals) | Same as for MgSO₄ group | |
| MgSO₄ | 26 | No doses in any group or co‐interventions described | Not stated | 24 | No doses in any group or co‐interventions described | |
| 2.5 mL isotonic MgSO₄ (250 mmol/L 151 mg) 28 patients | 28 | 2.5 mg salbutamol 3 times per 30 minutes | 2.5 mL normal saline | 24 | Same as for MgSO₄ group | |
| Isotonic MgSO₄ (dose*, frequency*) | * | Salbutamol (dose*) | 2.5 mL normal saline (frequency*) | * | Same as for MgSO₄ group | |
| Isotonic MgSO₄ (2.5 mL) | 14 | Salbutamol (dose*) 3 times per h then 1 per h for 3 h | 2.5 mL normal saline | 12 | Same as for MgSO₄ group | |
| 3 mL 7.5% MgSO₄ | 40 | 0.15 mg/kg salbutamol 3 doses, every 20 min | 3 mL normal saline | 40 | Same as for MgSO₄ group | |
| 2.5 mL Isotonic (6.3%) MgSO₄ solution | 31 | Albuterol 2.5 mg 1 dose | 2.5 mL normal saline | 31 | Same as for MgSO₄ group | |
| 3 mL isotonic MgSO₄ (286 mOsml, 7.5%, 225 mg) | 19 | 0.5 mL 2.5 mg salbutamol 1 dose* | 3 mL normal saline | 16 | Same as for MgSO₄ group | |
| 2.5 mL MgSO4 (100 mg), 0.5 mL salbutamol (2.5 mg) | 10 | 4 doses at 20 min intervals. If needed: additional nebulised salbutamol, IV hydrocortisone, IV aminophylline | 2.5 mL isotonic saline | 10 | Same as for MgSO4 group | |
| 1 mL magnesium sulfate (15%) + 1.5 mL isotonic saline | 50 | 3 doses at 20 min intervals. Also nebulised salbutamol (0.15 mg/kg), methylprednisolone 1 mg/kg IV; Oxygen was given to patients with SaO2 ≤ 95% | 1.5 mL isotonic saline | 50 | Same as for MgSO₄ group | |
| MgSO₄ versus SABA | ||||||
| MgSO₄ | 21 | No doses in any group or co‐interventions described | Not stated | 24 | No doses in any group or co‐interventions described | |
| 3.2% solution MgSO₄ = 95 mg) | 16 | 4 doses every 20 minutes | 3 mL (2.5 mg) salbutamol | 17 | Four doses every 20 minutes | |
| 2 mL MgSO₄ (280 mmol/L) | 20 | 1* dose given over 10 to 15 minutes | Salbutamol 2.5 mg in 2.5 mL | 20 | 1 dose* given over 10 to 15 minutes | |
| 20 patients 3.2 G % MgSO₄ | 20 | 4 doses every 20 min | 3 mL of 25 mg* salbutamol (likely decimal point missing) | 20 | Same as for MgSO4 group | |
| 3 mL (100 mg) MgSO4 | 10 | 4 doses at 20 min intervals. If needed: additional nebulised salbutamol, IV hydrocortisone, IV aminophylline | 0.5 mL salbutamol (2.5 mg) | 10 | Same as for MgSO₄ group | |
| TOTAL: 2907 randomised to comparisons of interest. 130 withdrawn, 2777 completed | TOTAL: 1476 randomised, 70 withdrawn = 1406 completed intervention | TOTAL: 1431 randomised, 60 withdrawn = 1371 completed control | ||||
| * denotes uncertainty | ||||||
| Study ID (author, date of publication) | Review primary outcomes | Review secondary outcomes | |||||
| FEV1 | PEF | Clinical severity scores | Hospital admissions | Duration of symptoms | Vital signs | Adverse effects | |
| MgSO₄ and SABA and Ipratropium bromide versus SABA and Ipratropium | |||||||
| N | N | Y | N | N | N | Y | |
| N | P | N | N | N | N | P | |
| Y | N | N | N | N | N | Y | |
| Y | N | N | N | N | N | N | |
| N | Y | N | Y | N | Y | Y | |
| N | Y | Y | Y | N | Y | N | |
| N | N | Y | P | N | N | Y | |
| MgSO4 and SABA versus SABA | |||||||
| Y | Y | N | N | N | N | N | |
| N | Y | N | Y | N | Y | Y | |
| N | P | N | N | N | N | N | |
| N | N | Y | P | N | N | Y | |
| Y | Y | N | N | N | Y | N | |
| P | N | N | N | N | N | Y | |
| P | P | N | N | N | N | Y | |
| Y | N | N | Y | N | N | Y | |
| N | N | N | N | N | N | N | |
| N | Y | P | Y | N | N | Y | |
| Y | N | N | Y | N | N | Y | |
| N | Y | Y | N | N | N | N | |
| N | Y | N | Y | N | N | Y | |
| N | Y | Y | N | N | Y | N | |
| N | N | Y | Y | N | N | Y | |
| MgSO₄ versus SABA | |||||||
| P | P | N | N | N | N | Y | |
| N | Y | N | Y | N | N | Y | |
| N | Y | N | N | N | N | Y | |
| N | Y | N | N | N | Y | N | |
| N | Y | Y | N | N | Y | N | |
| N ‒ the study did not report the outcome but it is not clear whether the outcome was measured or not Y ‒ full reporting P ‒ partial reporting | |||||||
| Outcome or subgroup title | No. of studies | No. of participants | Statistical method | Effect size |
| 1 Pulmonary function (% FEV1) Show forest plot | 2 | 120 | Mean Difference (IV, Fixed, 95% CI) | 3.28 [1.06, 5.49] |
| 1.1 90 minutes | 1 | 60 | Mean Difference (IV, Fixed, 95% CI) | 8.57 [1.99, 15.15] |
| 1.2 120 minutes | 1 | 60 | Mean Difference (IV, Fixed, 95% CI) | 2.60 [0.25, 4.95] |
| 2 Pulmonary function % predicted PEF Show forest plot | 2 | 636 | Mean Difference (IV, Fixed, 95% CI) | 0.05 [‐2.33, 2.42] |
| 3 Clinical severity scores (closest to 60 mins) Show forest plot | 2 | 1130 | Std. Mean Difference (IV, Fixed, 95% CI) | 0.01 [‐0.11, 0.12] |
| 3.1 Yung ASS at 60 minutes | 1 | 472 | Std. Mean Difference (IV, Fixed, 95% CI) | ‐0.17 [‐0.35, 0.02] |
| 3.2 Change in dyspnoea VAS at 60 minutes | 1 | 658 | Std. Mean Difference (IV, Fixed, 95% CI) | 0.13 [‐0.02, 0.28] |
| 4 Admission at first presentation Show forest plot | 4 | 1308 | Risk Ratio (M‐H, Fixed, 95% CI) | 0.95 [0.91, 1.00] |
| 4.1 Adults | 3 | 800 | Risk Ratio (M‐H, Fixed, 95% CI) | 0.95 [0.87, 1.03] |
| 4.2 Children | 1 | 508 | Risk Ratio (M‐H, Fixed, 95% CI) | 0.96 [0.92, 1.01] |
| 5 HDU/ITU admission Show forest plot | 2 | Risk Ratio (M‐H, Fixed, 95% CI) | Totals not selected | |
| 5.1 Admission to HDU (adults) | 1 | Risk Ratio (M‐H, Fixed, 95% CI) | 0.0 [0.0, 0.0] | |
| 5.2 Admission to ICU (adults) | 1 | Risk Ratio (M‐H, Fixed, 95% CI) | 0.0 [0.0, 0.0] | |
| 5.3 Admission to PICU/HDU or intubation (children) | 1 | Risk Ratio (M‐H, Fixed, 95% CI) | 0.0 [0.0, 0.0] | |
| 6 Readmission Show forest plot | 2 | 750 | Risk Ratio (M‐H, Fixed, 95% CI) | 1.80 [0.84, 3.87] |
| 7 Respiratory rate at 60 mins Show forest plot | 2 | 723 | Mean Difference (IV, Fixed, 95% CI) | 0.70 [‐0.14, 1.53] |
| 8 Heart rate at 60 mins Show forest plot | 1 | Mean Difference (IV, Fixed, 95% CI) | Subtotals only | |
| 9 Systolic blood pressure at 60 mins Show forest plot | 1 | Mean Difference (IV, Fixed, 95% CI) | Subtotals only | |
| 10 Diastolic blood pressure at 60 mins Show forest plot | 1 | 674 | Mean Difference (IV, Fixed, 95% CI) | 2.40 [0.29, 4.51] |
| 11 Serious adverse events (during admission) Show forest plot | 2 | 557 | Risk Difference (M‐H, Fixed, 95% CI) | ‐0.03 [‐0.06, ‐0.00] |
| 11.1 Adults | 1 | 50 | Risk Difference (M‐H, Fixed, 95% CI) | 0.0 [‐0.07, 0.07] |
| 11.2 Children | 1 | 507 | Risk Difference (M‐H, Fixed, 95% CI) | ‐0.04 [‐0.06, ‐0.01] |
| 12 Any adverse event (during admission) Show forest plot | 2 | 1197 | Risk Difference (M‐H, Fixed, 95% CI) | 0.01 [‐0.03, 0.05] |
| 12.1 Adults | 1 | 690 | Risk Difference (M‐H, Fixed, 95% CI) | 0.02 [‐0.02, 0.07] |
| 12.2 Children | 1 | 507 | Risk Difference (M‐H, Fixed, 95% CI) | ‐0.02 [‐0.09, 0.05] |
| 13 Serious adverse events (within 30 days) Show forest plot | 1 | Risk Difference (M‐H, Fixed, 95% CI) | Totals not selected | |
| 14 Any adverse event (within 30 days) Show forest plot | 1 | Risk Difference (M‐H, Fixed, 95% CI) | Totals not selected | |
| 15 Adverse event: hypotension Show forest plot | 2 | 1197 | Risk Difference (M‐H, Fixed, 95% CI) | 0.02 [‐0.01, 0.04] |
| 15.1 Adults | 1 | 690 | Risk Difference (M‐H, Fixed, 95% CI) | 0.03 [‐0.01, 0.07] |
| 15.2 Children | 1 | 507 | Risk Difference (M‐H, Fixed, 95% CI) | ‐0.00 [‐0.02, 0.01] |
| 16 Adverse event: flushing Show forest plot | 2 | 1197 | Risk Difference (M‐H, Fixed, 95% CI) | 0.00 [‐0.01, 0.01] |
| 16.1 Adults | 1 | 690 | Risk Difference (M‐H, Fixed, 95% CI) | 0.00 [‐0.01, 0.02] |
| 16.2 Children | 1 | 507 | Risk Difference (M‐H, Fixed, 95% CI) | ‐0.00 [‐0.02, 0.01] |
| Outcome or subgroup title | No. of studies | No. of participants | Statistical method | Effect size |
| 1 Pulmonary function % predicted FEV1 Show forest plot | 4 | 208 | Mean Difference (IV, Fixed, 95% CI) | 3.34 [‐1.58, 8.26] |
| 1.1 Adults | 3 | 146 | Mean Difference (IV, Fixed, 95% CI) | 2.18 [‐3.30, 7.67] |
| 1.2 Children | 1 | 62 | Mean Difference (IV, Fixed, 95% CI) | 8.10 [‐3.03, 19.23] |
| 2 % predicted FEV1: subgroup: severity Show forest plot | 3 | 188 | Mean Difference (IV, Fixed, 95% CI) | 4.12 [‐1.81, 10.06] |
| 2.1 Severe (FEV1 <50% predicted) | 1 | 52 | Mean Difference (IV, Fixed, 95% CI) | 9.90 [0.05, 19.75] |
| 2.2 Moderate | 2 | 136 | Mean Difference (IV, Fixed, 95% CI) | 0.84 [‐6.59, 8.27] |
| 3 Pulmonary function PEF L/min Show forest plot | 4 | Mean Difference (IV, Fixed, 95% CI) | Subtotals only | |
| 3.1 Adults | 3 | 155 | Mean Difference (IV, Fixed, 95% CI) | 11.91 [‐4.12, 27.95] |
| 3.2 Children | 1 | 80 | Mean Difference (IV, Fixed, 95% CI) | 11.90 [‐6.86, 30.66] |
| 4 Admission to hospital Show forest plot | 6 | 375 | Risk Ratio (M‐H, Fixed, 95% CI) | 0.78 [0.52, 1.15] |
| 4.1 Adults | 4 | 213 | Risk Ratio (M‐H, Fixed, 95% CI) | 0.69 [0.45, 1.07] |
| 4.2 Children | 2 | 162 | Risk Ratio (M‐H, Fixed, 95% CI) | 1.14 [0.44, 2.98] |
| 5 Heart rate at 120 mins Show forest plot | 2 | Mean Difference (IV, Fixed, 95% CI) | Totals not selected | |
| 6 Respiratory rate at 120 mins Show forest plot | 1 | Mean Difference (IV, Fixed, 95% CI) | Subtotals only | |
| 7 Diastolic blood pressure at 120 mins Show forest plot | 2 | 120 | Mean Difference (IV, Fixed, 95% CI) | 0.72 [‐1.35, 2.80] |
| 8 Systolic blood pressure at 120 mins Show forest plot | 2 | 120 | Mean Difference (IV, Fixed, 95% CI) | 0.89 [‐2.69, 4.48] |
| 9 Serious adverse events Show forest plot | 5 | 243 | Risk Difference (M‐H, Fixed, 95% CI) | 0.0 [‐0.04, 0.04] |
| 9.1 Adults | 4 | 181 | Risk Difference (M‐H, Fixed, 95% CI) | 0.0 [‐0.04, 0.04] |
| 9.2 Children | 1 | 62 | Risk Difference (M‐H, Fixed, 95% CI) | 0.0 [‐0.06, 0.06] |
| 10 Any adverse events Show forest plot | 5 | 694 | Risk Difference (M‐H, Fixed, 95% CI) | ‐0.01 [‐0.05, 0.03] |
| 10.1 Adults | 4 | 329 | Risk Difference (M‐H, Fixed, 95% CI) | ‐0.02 [‐0.10, 0.06] |
| 10.2 Children | 1 | 365 | Risk Difference (M‐H, Fixed, 95% CI) | ‐0.01 [‐0.03, 0.01] |
| Outcome or subgroup title | No. of studies | No. of participants | Statistical method | Effect size |
| 1 Clinical severity score Show forest plot | 3 | 93 | Mean Difference (IV, Fixed, 95% CI) | ‐0.13 [‐0.62, 0.36] |
| 1.1 Fischl index final score (120 mins) | 1 | 33 | Mean Difference (IV, Fixed, 95% CI) | ‐0.33 [‐1.07, 0.41] |
| 1.2 Fischl index score (time point unclear) | 1 | 40 | Mean Difference (IV, Fixed, 95% CI) | ‐0.20 [‐1.11, 0.71] |
| 1.3 Change in Fischl index at 120 mins | 1 | 20 | Mean Difference (IV, Fixed, 95% CI) | 0.30 [‐0.67, 1.27] |
| 2 Admission to hospital Show forest plot | 1 | Risk Ratio (M‐H, Fixed, 95% CI) | Totals not selected | |
| 3 Heart rate (120 mins) Show forest plot | 1 | 20 | Mean Difference (IV, Fixed, 95% CI) | 21.20 [0.17, 42.23] |
| 4 Respiratory rate Show forest plot | 2 | 60 | Mean Difference (IV, Fixed, 95% CI) | ‐2.40 [‐3.91, ‐0.89] |
| 5 Systolic pressure (120 mins) Show forest plot | 1 | Mean Difference (IV, Fixed, 95% CI) | Subtotals only | |
| 6 Diastolic pressure (120 mins) Show forest plot | 1 | Mean Difference (IV, Fixed, 95% CI) | Subtotals only | |
| 7 Serious adverse events Show forest plot | 2 | 53 | Risk Difference (M‐H, Fixed, 95% CI) | 0.0 [‐0.10, 0.10] |
| 8 Mild‐Moderate Side Effects Show forest plot | 1 | Risk Difference (M‐H, Fixed, 95% CI) | Totals not selected | |