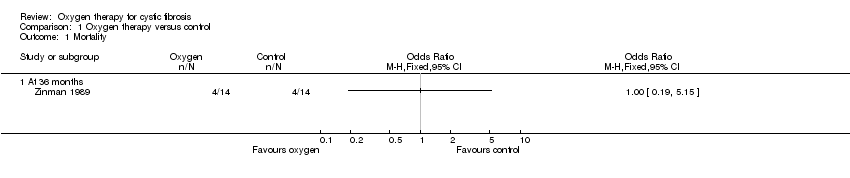
| 1 Mortality Show forest plot | 1 | | Odds Ratio (M‐H, Fixed, 95% CI) | Totals not selected |
|
| 1.1 At 36 months | 1 | | Odds Ratio (M‐H, Fixed, 95% CI) | 0.0 [0.0, 0.0] |
| 2 Change in lung function Show forest plot | 1 | | Mean Difference (IV, Fixed, 95% CI) | Totals not selected |
|
| 2.1 FEV1 at 12 months | 1 | | Mean Difference (IV, Fixed, 95% CI) | 0.0 [0.0, 0.0] |
| 2.2 FVC at 12 months | 1 | | Mean Difference (IV, Fixed, 95% CI) | 0.0 [0.0, 0.0] |
| 3 Change in PaO2 Show forest plot | 1 | | Mean Difference (IV, Fixed, 95% CI) | Totals not selected |
|
| 3.1 At 12 months | 1 | | Mean Difference (IV, Fixed, 95% CI) | 0.0 [0.0, 0.0] |
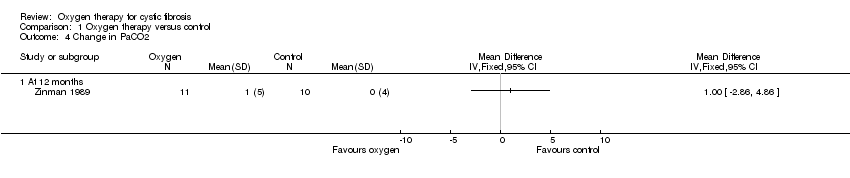
| 4 Change in PaCO2 Show forest plot | 1 | | Mean Difference (IV, Fixed, 95% CI) | Totals not selected |
|
| 4.1 At 12 months | 1 | | Mean Difference (IV, Fixed, 95% CI) | 0.0 [0.0, 0.0] |
| 5 Change in gas exchange during exercise Show forest plot | 3 | | Mean Difference (IV, Fixed, 95% CI) | Subtotals only |
|
| 5.1 Change in ETCO2 (mm Hg) | 2 | 116 | Mean Difference (IV, Fixed, 95% CI) | 5.68 [4.79, 6.56] |
| 5.2 Post exercise ETCO2 (mm Hg) | 1 | 16 | Mean Difference (IV, Fixed, 95% CI) | 2.0 [‐1.46, 5.46] |
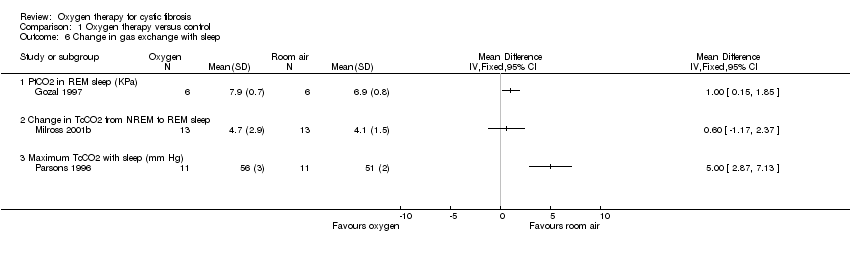
| 6 Change in gas exchange with sleep Show forest plot | 3 | | Mean Difference (IV, Fixed, 95% CI) | Totals not selected |
|
| 6.1 PtCO2 in REM sleep (KPa) | 1 | | Mean Difference (IV, Fixed, 95% CI) | 0.0 [0.0, 0.0] |
| 6.2 Change in TcCO2 from NREM to REM sleep | 1 | | Mean Difference (IV, Fixed, 95% CI) | 0.0 [0.0, 0.0] |
| 6.3 Maximum TcCO2 with sleep (mm Hg) | 1 | | Mean Difference (IV, Fixed, 95% CI) | 0.0 [0.0, 0.0] |
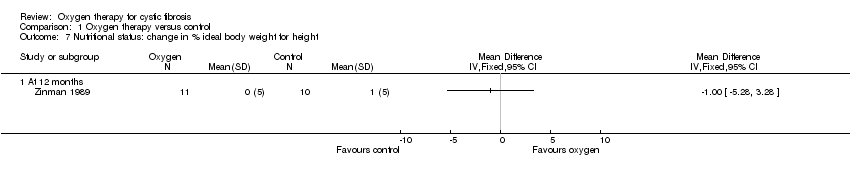
| 7 Nutritional status: change in % ideal body weight for height Show forest plot | 1 | | Mean Difference (IV, Fixed, 95% CI) | Totals not selected |
|
| 7.1 At 12 months | 1 | | Mean Difference (IV, Fixed, 95% CI) | 0.0 [0.0, 0.0] |
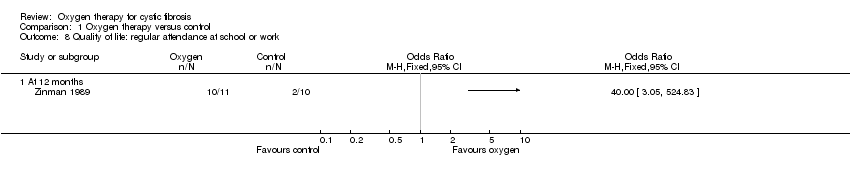
| 8 Quality of life: regular attendance at school or work Show forest plot | 1 | | Odds Ratio (M‐H, Fixed, 95% CI) | Totals not selected |
|
| 8.1 At 12 months | 1 | | Odds Ratio (M‐H, Fixed, 95% CI) | 0.0 [0.0, 0.0] |
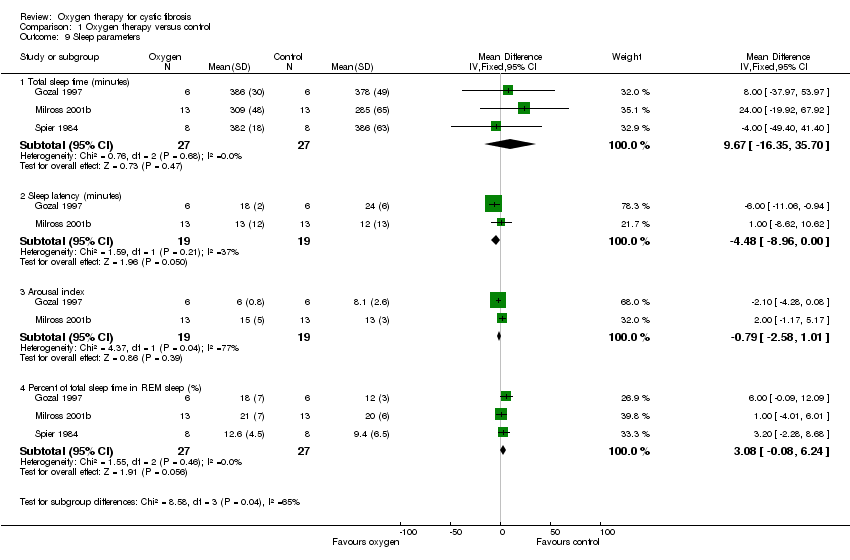
| 9 Sleep parameters Show forest plot | 3 | | Mean Difference (IV, Fixed, 95% CI) | Subtotals only |
|
| 9.1 Total sleep time (minutes) | 3 | 54 | Mean Difference (IV, Fixed, 95% CI) | 9.67 [‐16.35, 35.70] |
| 9.2 Sleep latency (minutes) | 2 | 38 | Mean Difference (IV, Fixed, 95% CI) | ‐4.48 [‐8.96, ‐0.00] |
| 9.3 Arousal index | 2 | 38 | Mean Difference (IV, Fixed, 95% CI) | ‐0.79 [‐2.58, 1.01] |
| 9.4 Percent of total sleep time in REM sleep (%) | 3 | 54 | Mean Difference (IV, Fixed, 95% CI) | 3.08 [‐0.08, 6.24] |
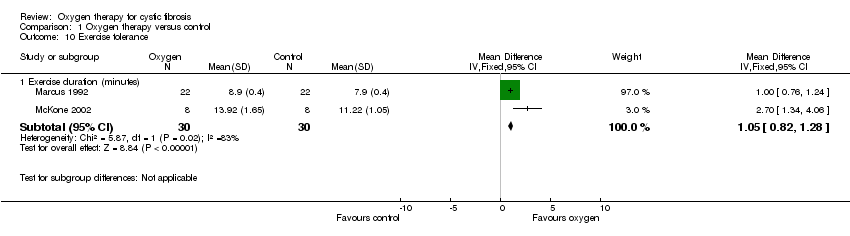
| 10 Exercise tolerance Show forest plot | 2 | | Mean Difference (IV, Fixed, 95% CI) | Subtotals only |
|
| 10.1 Exercise duration (minutes) | 2 | 60 | Mean Difference (IV, Fixed, 95% CI) | 1.05 [0.82, 1.28] |
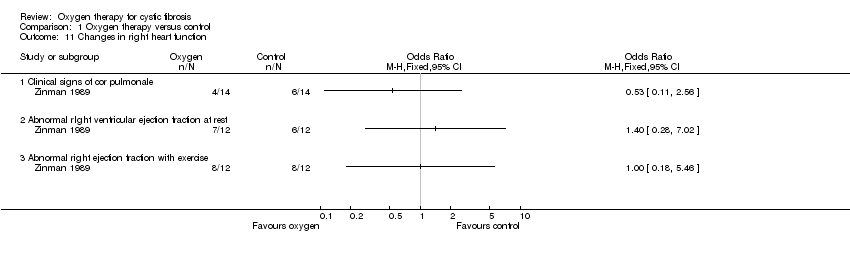
| 11 Changes in right heart function Show forest plot | 1 | | Odds Ratio (M‐H, Fixed, 95% CI) | Totals not selected |
|
| 11.1 Clinical signs of cor pulmonale | 1 | | Odds Ratio (M‐H, Fixed, 95% CI) | 0.0 [0.0, 0.0] |
| 11.2 Abnormal rIght ventricular ejection fraction at rest | 1 | | Odds Ratio (M‐H, Fixed, 95% CI) | 0.0 [0.0, 0.0] |
| 11.3 Abnormal right ejection fraction with exercise | 1 | | Odds Ratio (M‐H, Fixed, 95% CI) | 0.0 [0.0, 0.0] |