Terapia wstrzyknięciami okołocewkowymi w nietrzymaniu moczu u kobiet
Referencias
References to studies included in this review
References to studies excluded from this review
References to ongoing studies
Additional references
References to other published versions of this review
Characteristics of studies
Characteristics of included studies [ordered by study ID]
| Methods | RCT. Follow‐up of mean 54 months | |
| Participants | A: GAX‐collagen (26) B: Macroplastique™ (34). 60/60 women, mean age 76 years (range 45‐88 years) Included: women considered unfit for surgery A:10/26 B:9/34, women who had previous failed continence surgery A:16/26 B:25/34. These women had undergone a mean 2.1 (range 1‐4) of continence procedures. Excluded: women with detrusor instability, voiding difficulties, recurrent urinary tract infection, gross vaginal prolapse. SUI was due to sphincter deficiency. | |
| Interventions | A: glutaraldehyde cross‐linked collagen is a purified bovine dermal collagen cross‐linked with glutaraldehyde and dispersed in phosphate‐buffered physiological saline. B: Macroplastique™ consists of textured silicone particles suspended in a liquid gel (polyvinylpyrrolidone) The injections were performed periurethrally for both A and B. Women were offered a max 3 injections. | |
| Outcomes | Injection required to achieve max benefit Median (IQR) pad test loss at 12 months Mean volume injected (mL) Number failed after injection, King's QOL. | |
| Notes | Willcoxon sign rank test and Mann Witney U tests used. | |
| Risk of bias | ||
| Bias | Authors' judgement | Support for judgement |
| Allocation concealment (selection bias) | Unclear risk | B ‐ Unclear |
| Methods | RCT. 52 women. Follow‐up at a mean of 32.3 months. All patients ISD, Leak point pressure < 90. | |
| Participants | A: Durasphere (25) | |
| Interventions | A: Durasphere contains pyrolytic carbon‐coated zirconium oxide beads. | |
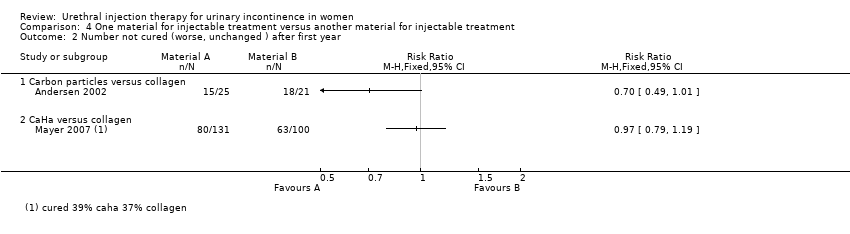
| Outcomes | Numbers not cured at a mean of 32.3 months A:15/25; B: 18/21 | |
| Notes | ||
| Risk of bias | ||
| Bias | Authors' judgement | Support for judgement |
| Allocation concealment (selection bias) | Unclear risk | B ‐ Unclear |
| Blinding (performance bias and detection bias) | Unclear risk | Researcher not surgeon |
| Methods | RCT | |
| Participants | A: Permacol™ (25) | |
| Interventions | A: Permacol™ is porcine collagen | |
| Outcomes | At 6 months | |
| Notes | No statistical analysis was carried out | |
| Risk of bias | ||
| Bias | Authors' judgement | Support for judgement |
| Allocation concealment (selection bias) | Unclear risk | B ‐ Unclear |
| Methods | RCT (multicentre). 12 months follow‐up | |
| Participants | 133 women with SUI. A: collagen (66); B: open surgery (67). A: 2/66; B:13/67 refused intervention. Results reported for A: 64; B: 54. | |
| Interventions | A: (64) submucosal urethral injection, 1‐4 injections in 6 months, follow‐up started after last injection. B: (54) option of BNS (6), Sling (24) or Burch (24). | |
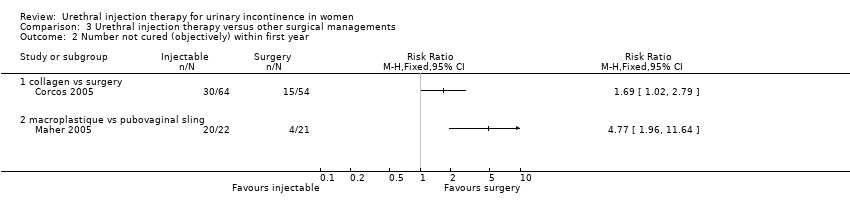
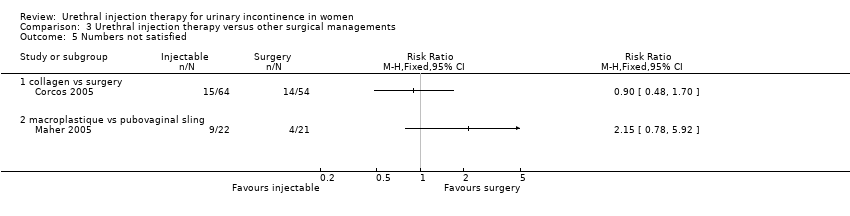
| Outcomes | Numbers not cured or improved at 12 months A:40/64 B:15/54. IIQ questionnaire score mean(SD) A:45.2(18.4) B:41.6(17.6). Numbers not satisfied A:15/64 B:14/54. Complications A:36 B:84 events. | |
| Notes | BNS or IIQ abbreviations not explained in study. No description of inclusion or exclusion criteria. Unsure if women's characteristics in groups are similar. | |
| Risk of bias | ||
| Bias | Authors' judgement | Support for judgement |
| Random sequence generation (selection bias) | Low risk | |
| Allocation concealment (selection bias) | Unclear risk | B ‐ Unclear |
| Blinding (performance bias and detection bias) | High risk | Not blinded and patients and doctors would be aware which treatment had been given |
| Methods | RCT (multicentre). 253 total, 237 women randomised. Results presented for 168 women at 12 months follow up for primary effectiveness. Adverse events for 253 patients. | |
| Participants | Included: women diagnosed with urodynamic SUI confirmed by clinical urodynamic evaluation. Mean age for both groups 61 years. All patients had failed previous incontinence treatment, 46% failing at least one surgery. | |
| Interventions | A: Uryx™ is an injectable solution of ethylene vinyl alcohol copolymer (EVOH) dissolved in dimethyl sulphoxide (DMSO) carrier. Upon contact with an aqueous environment, such as the submucosal tissues of the urethra, the DMSO solvent diffuses away, resulting in precipitation of the polymer, which forms a cohesive spongy mass creating a bulking effect. Uryx™ hand‐injected through a fine 25 g needle. Maximum of 3 treatments in 90 days allowed, | |
| Outcomes | Mean total volume injected per patient. A: 4.7 cc; B: 7.2 cc. Efficacy was assessed at 12 months following last treatment using pad weight and Stamey test. I‐QOL also used. | |
| Notes | No description of participant characteristics (age, parity, BMI). | |
| Risk of bias | ||
| Bias | Authors' judgement | Support for judgement |
| Allocation concealment (selection bias) | Unclear risk | B ‐ Unclear |
| Other bias | Unclear risk | Funded by Genyx medical, Inc. manufacturer of Uryx™ |
| Methods | RCT, multicentre. | |
| Participants | 260 randomised, 247 studied, women with SUI primarily intrinsic sphincter deficiency, failed conservative treatments. Mean age 61 years. 24% had prior surgery. | |
| Interventions | Macroplastique™ versus Contigen™. Repeat treatment allowed after 3 months. | |
| Outcomes | Stamey grade, pad weight and IQOL score 12 months after surgery primary outcome measure. decrease in baseline IQOL of at least 1 Stamey grade at 12 months | |
| Notes | ||
| Risk of bias | ||
| Bias | Authors' judgement | Support for judgement |
| Allocation concealment (selection bias) | High risk | |
| Blinding (performance bias and detection bias) | Unclear risk | Patient blinded; physician unaware; unclear who completed assessment |
| Incomplete outcome data (attrition bias) | Low risk | 12 patients who withdrew and 1 patient wrongly treated were excluded from analysis. At 12 months 51 patients were considered as discontinued as lost to follow‐up. |
| Selective reporting (reporting bias) | Low risk | |
| Methods | RCT | |
| Participants | 30 elderly women with stress incontinence. | |
| Interventions | Transurethral mid‐urethral collage injection versus bladder neck injection. | |
| Outcomes | VAS, residual urine, urethral resting pressure and functional urethral length, cough test and flowmetry. | |
| Notes | ||
| Risk of bias | ||
| Bias | Authors' judgement | Support for judgement |
| Random sequence generation (selection bias) | Unclear risk | Computer assisted |
| Blinding (performance bias and detection bias) | Unclear risk | Follow‐up performed by different team but had access to operation notes |
| Methods | RCT (double‐blind, placebo‐controlled). Of the 68 women randomised: 1 = lost to follow‐up; 8 = withdrew; 2 = desired change treatment; 1 = death from fat embolism; 1 = death. Follow‐up at 3, 6, 9, 12, 18 and 24 months. | |
| Participants | A: Autologous fat (35) B: Saline (33) Results reported for A: 27/35; B: 29/33. Mean age (SD) A: 57.2 (11.6); B: 56.9 (12.3). Groups are similar in terms of parity, history of incontinence surgery, baseline continence questionnaire score, pad test weight, maximum urethral closure pressure, leak point pressure. Included: women with SUI. Excluded: women receiving co‐interventions such as HRT, weight reduction or Kegel exercises, diagnosis causing incontinence such as bladder instability. | |
| Interventions | A: periurethral autologous fat injection, under local anaesthesia and intravenous sedation, about 30 cc fat harvested from anterior abdominal wall or buttock, bulking agent placed at bladder neck and proximal urethra. | |
| Outcomes | Numbers not cured or improved at < 1‐year follow‐up A: 21/27; B: 23/29. Pad weight (g), mean (SD) A:14.8 (20.1); B: 18.56 (27.6). Continence questionnaire score, mean (SD) A: 10.9 (4.5); B:12.2 (4.6). Complications A: 29/91; B:11/98 procedures. Number of injections required to achieve max benefit (1) A: 0; B: 0, (2) A: 1; B: 0, (3) A: 26; B: 29. Mortality A: 1/27; B: 0/29. | |
| Notes | Statistical methods used are not described, | |
| Risk of bias | ||
| Bias | Authors' judgement | Support for judgement |
| Allocation concealment (selection bias) | Low risk | A ‐ Adequate |
| Methods | RCT (multicentre, controlled, double‐blind) 355 women randomised and followed up for mean 14 months (range 9‐30 months), 235 women completed 12 months follow‐up for whom results are reported. | |
| Participants | Included: women diagnosed with SUI due to ISD. All women had abdominal leak pressure < 90 cm H2O. Excluded: positive skin results with test injections of bovine collagen and beta‐glucan. | |
| Interventions | A: Durasphere (pyrolytic carbon‐coated zirconium oxide beads suspended in a carrier gel, prepackaged syringes with 1.0 mL Durasphere and 18‐guage needle delivery device were used, B: bovine collagen (Contigen™ bard collagen implant) women underwent injections according to the manufacturer's instructions. | |
| Outcomes | Mean number of injections required to achieve maximum benefit A: 1.69; B: 1.55. Mean volume injected (mL) A: 4.83 mL; B: 6.23 mL. Mean change in pad weight test at 12 months A: 19.3 g; B: 15.5 g (not significant difference). | |
| Notes | Continence data are reported for 235 women completing 12 months follow‐up (mean 14 months, range 9‐30). Adverse events reported for all 355 women, mean 11 months follow‐up (range 1‐26). | |
| Risk of bias | ||
| Bias | Authors' judgement | Support for judgement |
| Allocation concealment (selection bias) | Unclear risk | B ‐ Unclear |
| Methods | Evaluator blinded prospective RCT Zuidex™ Implacer vs Contigen™ , follow‐up greater than 1 year from last treatment. | |
| Participants | 344 women with urodynamically confirmed stress incontinence (ALP <100 cm/H2O) at 23 North American sites | |
| Interventions | Zuidex™ via Implacer device (227) Contigen™ under endoscopic guidance (117); 2 re‐treatments within initial 3 month period allowed | |
| Outcomes | Primary outcome ‐ proportion of women who achieved ≥ 50% reduction in urinary leakage on provocation testing at baseline compared with 12 months post‐last treatment. Stamey grading, 24‐hour pad test, micturition chart and patient global assessment of incontinence problems. | |
| Notes | Outcome at 12 months from last treatment failed to show that non‐cystoscopically injected Zuidex™ (implacer) was equivalent to Contigen™ injected endoscopically. | |
| Risk of bias | ||
| Bias | Authors' judgement | Support for judgement |
| Random sequence generation (selection bias) | Unclear risk | No comments made |
| Allocation concealment (selection bias) | High risk | Operator visually informed of the randomisation result |
| Blinding (performance bias and detection bias) | Unclear risk | States evaluator blinded but does not describe who did evaluation and if operative note was removed from medical records, patient blinded |
| Incomplete outcome data (attrition bias) | Low risk | Multiple imputations and hot deck procedure Last observation carried forward |
| Selective reporting (reporting bias) | High risk | Selective reporting of secondary outcome measures ‐ 24‐hour pad test results and QOL scores not mentioned |
| Other bias | Unclear risk | Primary outcome data missing for 38% of ZI group and 28% of CE group due to premature withdrawal or protocol violation |
| Methods | RCT, prospective | |
| Participants | Included women with SUI and ISD diagnosed by a maximal urethral closure pressure < 20 cm H2O who failed to respond to conservative treatment. Excluded those who required prolapse surgery, had undergone sling procedure or were unsuitable for anaesthesia. | |
| Interventions | A: Macroplastique™ consists of silicone particles | |
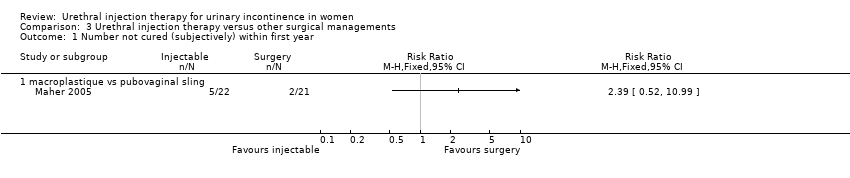
| Outcomes | Subjectively cured A: 17/22; B: 19/21. Patients satisfied A:13/22; B: 17/21. Objectively cured A: 2/22; B: 17/21. Median SUDI score A: 14; B: 11. Median SIIQ score A: 5; B: 9. | |
| Notes | ||
| Risk of bias | ||
| Bias | Authors' judgement | Support for judgement |
| Allocation concealment (selection bias) | Unclear risk | B ‐ Unclear |
| Methods | Prospective single‐blind RCT | |
| Participants | 296 women with stress incontinence (ISD with or without hypermobility) and no previous urethral bulking. | |
| Interventions | CaHA versus collagen soft tissue augmentation of the sphincter; up to 5 injections were allowed in the first 6 months. | |
| Outcomes | Improvement in Stamey urinary incontinence scale by one or more grades at 12 months after initial injection; results available in 231 patients at 12 months. | |
| Notes | ||
| Risk of bias | ||
| Bias | Authors' judgement | Support for judgement |
| Random sequence generation (selection bias) | Low risk | Computer‐generated randomisation tables |
| Allocation concealment (selection bias) | High risk | |
| Blinding (performance bias and detection bias) | Low risk | Surgeon not blinded however ancillary clinical research staff obtaining follow‐up data unaware of treatment assignment. |
| Incomplete outcome data (attrition bias) | Unclear risk | Only 54% (296) of 545 eligible patients participated in study and of these only 231 (78%) had 12‐month Stamey scores available. Only these 231 were evaluated. No details are given regarding the "un‐evaluable" patients to show that they are comparable. Later mentions a separate intention‐to‐treat analysis but is not specific about how this was done. |
| Selective reporting (reporting bias) | Low risk | All primary and secondary outcome measures reported. |
| Other bias | Unclear risk | 13 CaHA and 15 collagen women received periurethral rather than transurethral injections, study sponsored by bioform medical manufacturer of Coaptite (CaHA). |
| Methods | RCT (prospective) | |
| Participants | Included: 40 women with GSI (36/40) or mixed incontinence with a minor and controlled urge component (4/40), no significant differences between groups for any preoperative measurements. Excluded those with UTI, bladder capacity < 250 mL or PVR > 100 mL, neurogenic bladder, Grade 3 cystocoele, uterine prolapse or rectocoele, those taking alpha agonist or antagonist, those previously received radiation to urethra, previous bulking agent therapy, pregnancy or intention to get pregnant during the study period and life expectancy < 15 months. | |
| Interventions | A: (20) periurethral route of injection; B: (20) transurethral route of injection. Average volume of injection A: 3.9 mL; B 3.5 mL. | |
| Outcomes | Number not cured or improved A: 16/17; B: 14/17. Average pad weight A: 4.1 g; B: 6.3 g. QOL score A: 34; B: 27. Retention A: 6/20; B: 1/20. Number of patients with more than one injections A: 10/20; B: 12/20. | |
| Notes | Loss to follow‐up A: 3/20; B: 2/20 (1/20 became pregnant and withdrew from study). | |
| Risk of bias | ||
| Bias | Authors' judgement | Support for judgement |
| Allocation concealment (selection bias) | Low risk | A ‐ Adequate |
| Methods | Prospective RCT | |
| Participants | 47 recruited, 45 women treated with stress incontinence caused by urethral hypermobility and non‐successful conservative treatment. | |
| Interventions | MPQ injections versus pelvis floor muscle exercise and home‐training programme. | |
| Outcomes | Follow‐up at 3 months for both groups and at 12 months for MPQ group. Pad test, number of pads used Frequency volume chart, Physician and patient cure self assessment | |
| Notes | Repeat MPQ at 3 months if requested by patient or clinically indicated. Further follow‐up of this group at 3 and 12 months following repeat treatment. 5 years taken to recruit to study. | |
| Risk of bias | ||
| Bias | Authors' judgement | Support for judgement |
| Allocation concealment (selection bias) | High risk | |
| Blinding (performance bias and detection bias) | High risk | |
| Incomplete outcome data (attrition bias) | Unclear risk | Intention‐to‐treat with missing values are imputed by general mean substitution. 47 patients recruited 45 treated, 1 excluded due to not fulfilling inclusion criteria, 1 patient included twice. |
| Selective reporting (reporting bias) | High risk | 12‐month follow‐up for one group only. |
| Other bias | Unclear risk | Study sponsored by uroplasty BV, makers of Macroplastique™ and Macroplastique™ implantation system. |
ALP = alkaline phophatase; BMI = body mass index; GAX‐collagen = Glutaraldehyde cross‐linked collagen; GSI = genuine stress incontinence; HRT = Hormone Replacement Therapy; IIQ = Incontinence Impact Questionnaire; IQR = Inter Quartile Range; ISD = Intrinsic Sphincter Deficiency; PVR = postvoid residual; MPQ = Macroplastique™; QoL = quality of life; RCT = randomised controlled trial; SD = standard deviation; SUDI = Short Urinary Distress Inventory; SUI = Stress Urinary Incontinence; VAS = visual analogue scale.
Characteristics of excluded studies [ordered by study ID]
| Study | Reason for exclusion |
| Pre‐marketing approval letter | |
| Pre‐marketing approval letter | |
| No control arm (randomisation was to different doses of active treatment) | |
| Case report | |
| Non‐randomised study | |
| Study participants male | |
| Non‐randomised study | |
| Letter to editor | |
| Non‐randomised study | |
| Study withdrawn by publishers | |
| Not relevant to this review |
Characteristics of ongoing studies [ordered by study ID]
| Trial name or title | Collagen versus Macroplastique™ |
| Methods | |
| Participants | Unknown |
| Interventions | Collagen versus Macroplastique™ |
| Outcomes | Unknown |
| Starting date | Unknown ‐ already ongoing at July 2003 |
| Contact information | |
| Notes | Investigational device exemption (IDE) data being prepared for publication. |
| Trial name or title | Comparative study of the efficacy, acceptability, morbidity and cost‐effectiveness of the 'Tension Free Vaginal Tape' and the periurethral injection of collagen in the management of recurrent stress incontinence |
| Methods | |
| Participants | Plan to recruit 56 participants |
| Interventions | Periurethral collagen injection versus TVTTM |
| Outcomes | Unknown |
| Starting date | Started recruiting in September 2001. |
| Contact information | |
| Notes | At 25 January 2005 still ongoing ‐ current status uncertain. |
| Trial name or title | Comparison of two surgical methods for curing stress incontinence (recurrent) |
| Methods | |
| Participants | Inclusion criteria included low UCP |
| Interventions | Macroplastique™ versus TVTTM |
| Outcomes | Unknown |
| Starting date | 2002 |
| Contact information | |
| Notes | Trial stopped due to difficulty recruiting. Planned to recruit 30 participants to each arm but randomised under 15 participants. |
| Trial name or title | A randomised clinical trial for the evaluation of two implantation sites for Macroplastique™ bladder neck implants using the Macroplastique™ implantation system |
| Methods | |
| Participants | Women with urodynamically proven Genuine Stress Incontinence. |
| Interventions | Comparing implantation sites |
| Outcomes | Unknown |
| Starting date | April 1999 |
| Contact information | |
| Notes | Study now finished. Awaiting publication. |
TVTTM = Tension Free Vaginal Tape; UCP = urethral closure pressure.
Data and analyses
| Outcome or subgroup title | No. of studies | No. of participants | Statistical method | Effect size |
| 1 Number not improved (worse or unchanged) within first year Show forest plot | 1 | Risk Ratio (M‐H, Fixed, 95% CI) | Totals not selected | |
| Analysis 1.1  Comparison 1 Urethral injection therapy versus no treatment, Outcome 1 Number not improved (worse or unchanged) within first year. | ||||
| 1.1 periurethral autologous fat vs saline | 1 | Risk Ratio (M‐H, Fixed, 95% CI) | 0.0 [0.0, 0.0] | |
| 2 Pad weight test Show forest plot | 1 | Mean Difference (IV, Fixed, 95% CI) | Totals not selected | |
| Analysis 1.2  Comparison 1 Urethral injection therapy versus no treatment, Outcome 2 Pad weight test. | ||||
| 2.1 periurethral autologous fat vs saline | 1 | Mean Difference (IV, Fixed, 95% CI) | 0.0 [0.0, 0.0] | |
| 3 Disease‐specific measures Show forest plot | 1 | Mean Difference (IV, Fixed, 95% CI) | Totals not selected | |
| Analysis 1.3  Comparison 1 Urethral injection therapy versus no treatment, Outcome 3 Disease‐specific measures. | ||||
| 3.1 periurethral autologous fat vs saline | 1 | Mean Difference (IV, Fixed, 95% CI) | 0.0 [0.0, 0.0] | |
| 4 Number of patients requiring more than 1 treatment to achieve maximum benefit Show forest plot | 1 | Risk Ratio (M‐H, Fixed, 95% CI) | Totals not selected | |
| Analysis 1.4 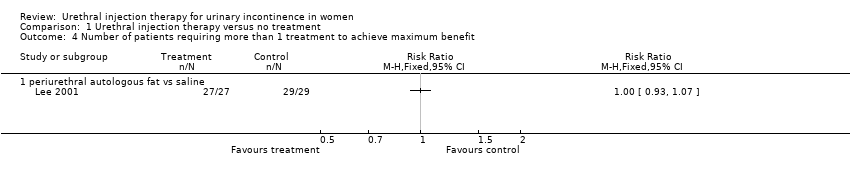 Comparison 1 Urethral injection therapy versus no treatment, Outcome 4 Number of patients requiring more than 1 treatment to achieve maximum benefit. | ||||
| 4.1 periurethral autologous fat vs saline | 1 | Risk Ratio (M‐H, Fixed, 95% CI) | 0.0 [0.0, 0.0] | |
| 5 Peri‐ and postoperative complication Show forest plot | 1 | Risk Ratio (M‐H, Fixed, 95% CI) | Totals not selected | |
| Analysis 1.5  Comparison 1 Urethral injection therapy versus no treatment, Outcome 5 Peri‐ and postoperative complication. | ||||
| 5.1 periurethral autologous fat vs saline | 1 | Risk Ratio (M‐H, Fixed, 95% CI) | 0.0 [0.0, 0.0] | |
| 6 Serious morbidity (such as pulmonary embolism) or mortality Show forest plot | 1 | Risk Ratio (M‐H, Fixed, 95% CI) | Totals not selected | |
| Analysis 1.6  Comparison 1 Urethral injection therapy versus no treatment, Outcome 6 Serious morbidity (such as pulmonary embolism) or mortality. | ||||
| 6.1 periurethral autologous fat vs saline | 1 | Risk Ratio (M‐H, Fixed, 95% CI) | 0.0 [0.0, 0.0] | |
| Outcome or subgroup title | No. of studies | No. of participants | Statistical method | Effect size |
| 1 Number not cured (worse, unchanged or improved) at 3 months Show forest plot | 1 | Risk Ratio (M‐H, Fixed, 95% CI) | Totals not selected | |
| Analysis 2.1  Comparison 2 Urethral injection therapy versus conservative management, Outcome 1 Number not cured (worse, unchanged or improved) at 3 months. | ||||
| 2 Number not improved (worse or unchanged) at 3 months Show forest plot | 1 | Risk Ratio (M‐H, Fixed, 95% CI) | Totals not selected | |
| Analysis 2.2 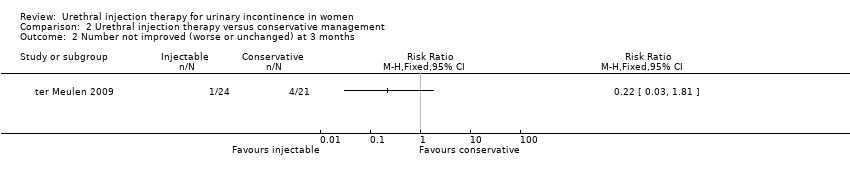 Comparison 2 Urethral injection therapy versus conservative management, Outcome 2 Number not improved (worse or unchanged) at 3 months. | ||||
| 3 Disease‐specific measures Show forest plot | 1 | Mean Difference (IV, Fixed, 95% CI) | Totals not selected | |
| Analysis 2.3  Comparison 2 Urethral injection therapy versus conservative management, Outcome 3 Disease‐specific measures. | ||||
| 4 Peri‐ and postoperative complication Show forest plot | 1 | Risk Ratio (M‐H, Fixed, 95% CI) | Totals not selected | |
| Analysis 2.4 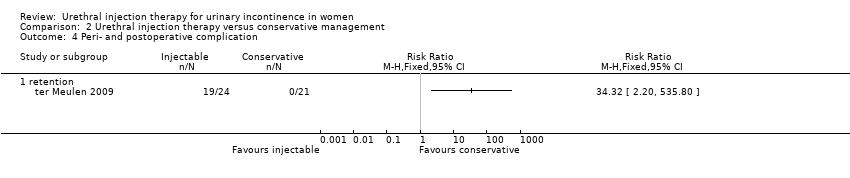 Comparison 2 Urethral injection therapy versus conservative management, Outcome 4 Peri‐ and postoperative complication. | ||||
| 4.1 retention | 1 | Risk Ratio (M‐H, Fixed, 95% CI) | 0.0 [0.0, 0.0] | |
| Outcome or subgroup title | No. of studies | No. of participants | Statistical method | Effect size |
| 1 Number not cured (subjectively) within first year Show forest plot | 1 | Risk Ratio (M‐H, Fixed, 95% CI) | Totals not selected | |
| Analysis 3.1  Comparison 3 Urethral injection therapy versus other surgical managements, Outcome 1 Number not cured (subjectively) within first year. | ||||
| 1.1 macroplastique vs pubovaginal sling | 1 | Risk Ratio (M‐H, Fixed, 95% CI) | 0.0 [0.0, 0.0] | |
| 2 Number not cured (objectively) within first year Show forest plot | 2 | Risk Ratio (M‐H, Fixed, 95% CI) | Totals not selected | |
| Analysis 3.2  Comparison 3 Urethral injection therapy versus other surgical managements, Outcome 2 Number not cured (objectively) within first year. | ||||
| 2.1 collagen vs surgery | 1 | Risk Ratio (M‐H, Fixed, 95% CI) | 0.0 [0.0, 0.0] | |
| 2.2 macroplastique vs pubovaginal sling | 1 | Risk Ratio (M‐H, Fixed, 95% CI) | 0.0 [0.0, 0.0] | |
| 3 Presence of urinary urgency and urge incontinence Show forest plot | 1 | Risk Ratio (M‐H, Fixed, 95% CI) | Totals not selected | |
| Analysis 3.3  Comparison 3 Urethral injection therapy versus other surgical managements, Outcome 3 Presence of urinary urgency and urge incontinence. | ||||
| 3.1 collagen vs surgery | 1 | Risk Ratio (M‐H, Fixed, 95% CI) | 0.0 [0.0, 0.0] | |
| 4 Disease‐specific measures Show forest plot | 1 | Mean Difference (IV, Fixed, 95% CI) | Totals not selected | |
| Analysis 3.4  Comparison 3 Urethral injection therapy versus other surgical managements, Outcome 4 Disease‐specific measures. | ||||
| 4.1 collagen vs surgery | 1 | Mean Difference (IV, Fixed, 95% CI) | 0.0 [0.0, 0.0] | |
| 5 Numbers not satisfied Show forest plot | 2 | Risk Ratio (M‐H, Fixed, 95% CI) | Totals not selected | |
| Analysis 3.5  Comparison 3 Urethral injection therapy versus other surgical managements, Outcome 5 Numbers not satisfied. | ||||
| 5.1 collagen vs surgery | 1 | Risk Ratio (M‐H, Fixed, 95% CI) | 0.0 [0.0, 0.0] | |
| 5.2 macroplastique vs pubovaginal sling | 1 | Risk Ratio (M‐H, Fixed, 95% CI) | 0.0 [0.0, 0.0] | |
| Outcome or subgroup title | No. of studies | No. of participants | Statistical method | Effect size |
| 1 Number not cured (worse, unchanged ) within first year Show forest plot | 5 | Risk Ratio (M‐H, Fixed, 95% CI) | Totals not selected | |
| Analysis 4.1  Comparison 4 One material for injectable treatment versus another material for injectable treatment, Outcome 1 Number not cured (worse, unchanged ) within first year. | ||||
| 1.1 carbon particles vs collagen | 1 | Risk Ratio (M‐H, Fixed, 95% CI) | 0.0 [0.0, 0.0] | |
| 1.2 Silicone particles vs collagen | 1 | Risk Ratio (M‐H, Fixed, 95% CI) | 0.0 [0.0, 0.0] | |
| 1.3 Ethylene vinyl alcohol copolymer vs collagen | 1 | Risk Ratio (M‐H, Fixed, 95% CI) | 0.0 [0.0, 0.0] | |
| 1.4 Permacol vs silicone particles | 1 | Risk Ratio (M‐H, Fixed, 95% CI) | 0.0 [0.0, 0.0] | |
| 1.5 Dextranomer/hyaluronic acid versus collagen <2g leakage on pad test | 1 | Risk Ratio (M‐H, Fixed, 95% CI) | 0.0 [0.0, 0.0] | |
| 2 Number not cured (worse, unchanged ) after first year Show forest plot | 2 | Risk Ratio (M‐H, Fixed, 95% CI) | Totals not selected | |
| Analysis 4.2  Comparison 4 One material for injectable treatment versus another material for injectable treatment, Outcome 2 Number not cured (worse, unchanged ) after first year. | ||||
| 2.1 Carbon particles versus collagen | 1 | Risk Ratio (M‐H, Fixed, 95% CI) | 0.0 [0.0, 0.0] | |
| 2.2 CaHa versus collagen | 1 | Risk Ratio (M‐H, Fixed, 95% CI) | 0.0 [0.0, 0.0] | |
| 3 Number not improved (worse or unchanged) within first year Show forest plot | 3 | Risk Ratio (M‐H, Fixed, 95% CI) | Totals not selected | |
| Analysis 4.3  Comparison 4 One material for injectable treatment versus another material for injectable treatment, Outcome 3 Number not improved (worse or unchanged) within first year. | ||||
| 3.1 silicone particles vs collagen | 1 | Risk Ratio (M‐H, Fixed, 95% CI) | 0.0 [0.0, 0.0] | |
| 3.2 calcium hydroxylapatite versus collagen | 0 | Risk Ratio (M‐H, Fixed, 95% CI) | 0.0 [0.0, 0.0] | |
| 3.3 Permacol vs silicone at 6 months using stamey grade | 1 | Risk Ratio (M‐H, Fixed, 95% CI) | 0.0 [0.0, 0.0] | |
| 3.4 permacol vs silicone at 6 months using KCQ | 1 | Risk Ratio (M‐H, Fixed, 95% CI) | 0.0 [0.0, 0.0] | |
| 3.5 Zuidex versus Contigen using 50% reduction in leak on provocation | 1 | Risk Ratio (M‐H, Fixed, 95% CI) | 0.0 [0.0, 0.0] | |
| 3.6 Zuidex vs collagen improvement of one or more Stamey grade | 1 | Risk Ratio (M‐H, Fixed, 95% CI) | 0.0 [0.0, 0.0] | |
| 4 Number not improved (worse or unchanged) after first year Show forest plot | 2 | Risk Ratio (M‐H, Fixed, 95% CI) | Totals not selected | |
| Analysis 4.4 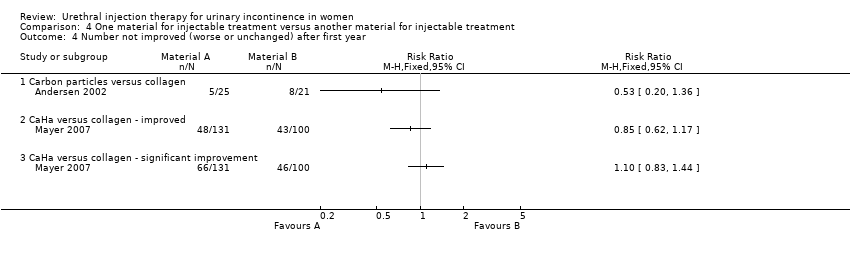 Comparison 4 One material for injectable treatment versus another material for injectable treatment, Outcome 4 Number not improved (worse or unchanged) after first year. | ||||
| 4.1 Carbon particles versus collagen | 1 | Risk Ratio (M‐H, Fixed, 95% CI) | 0.0 [0.0, 0.0] | |
| 4.2 CaHa versus collagen ‐ improved | 1 | Risk Ratio (M‐H, Fixed, 95% CI) | 0.0 [0.0, 0.0] | |
| 4.3 CaHa versus collagen ‐ significant improvement | 1 | Risk Ratio (M‐H, Fixed, 95% CI) | 0.0 [0.0, 0.0] | |
| 5 Presence of urge incontinence Show forest plot | 1 | Risk Ratio (M‐H, Fixed, 95% CI) | Totals not selected | |
| Analysis 4.5  Comparison 4 One material for injectable treatment versus another material for injectable treatment, Outcome 5 Presence of urge incontinence. | ||||
| 5.1 Permacol vs silicone particles | 1 | Risk Ratio (M‐H, Fixed, 95% CI) | 0.0 [0.0, 0.0] | |
| 6 Pad weight test Show forest plot | 4 | Mean Difference (IV, Fixed, 95% CI) | Totals not selected | |
| Analysis 4.6  Comparison 4 One material for injectable treatment versus another material for injectable treatment, Outcome 6 Pad weight test. | ||||
| 6.1 carbon particles vs collagen | 1 | Mean Difference (IV, Fixed, 95% CI) | 0.0 [0.0, 0.0] | |
| 6.2 CaHa versus collagen | 1 | Mean Difference (IV, Fixed, 95% CI) | 0.0 [0.0, 0.0] | |
| 6.3 Silicone particles vs collagen | 1 | Mean Difference (IV, Fixed, 95% CI) | 0.0 [0.0, 0.0] | |
| 6.4 Dexranomer/hyaluronic acid versus collagen | 1 | Mean Difference (IV, Fixed, 95% CI) | 0.0 [0.0, 0.0] | |
| 7 Number of treatment required to achieve maximum benefit Show forest plot | 2 | 699 | Mean Difference (IV, Fixed, 95% CI) | 0.0 [0.0, 0.0] |
| Analysis 4.7  Comparison 4 One material for injectable treatment versus another material for injectable treatment, Outcome 7 Number of treatment required to achieve maximum benefit. | ||||
| 7.1 carbon particles vs collagen | 1 | 355 | Mean Difference (IV, Fixed, 95% CI) | 0.0 [0.0, 0.0] |
| 7.2 Zuidex vs collagen | 1 | 344 | Mean Difference (IV, Fixed, 95% CI) | 0.0 [0.0, 0.0] |
| 8 Number of patients requiring more than 1 treatment to achieve maximum benefit Show forest plot | 2 | Risk Ratio (M‐H, Fixed, 95% CI) | Totals not selected | |
| Analysis 4.8  Comparison 4 One material for injectable treatment versus another material for injectable treatment, Outcome 8 Number of patients requiring more than 1 treatment to achieve maximum benefit. | ||||
| 8.1 silicone particles vs collagen | 1 | Risk Ratio (M‐H, Fixed, 95% CI) | 0.0 [0.0, 0.0] | |
| 8.2 Zuidex versus collagen | 1 | Risk Ratio (M‐H, Fixed, 95% CI) | 0.0 [0.0, 0.0] | |
| 9 Total volume injected Show forest plot | 2 | Mean Difference (IV, Fixed, 95% CI) | Totals not selected | |
| Analysis 4.9  Comparison 4 One material for injectable treatment versus another material for injectable treatment, Outcome 9 Total volume injected. | ||||
| 9.1 Silicon vs collagen | 1 | Mean Difference (IV, Fixed, 95% CI) | 0.0 [0.0, 0.0] | |
| 9.2 Zuidex vs collagen | 1 | Mean Difference (IV, Fixed, 95% CI) | 0.0 [0.0, 0.0] | |
| 10 Peri‐ and post‐ operative complication Show forest plot | 2 | Risk Ratio (M‐H, Fixed, 95% CI) | Totals not selected | |
| Analysis 4.10  Comparison 4 One material for injectable treatment versus another material for injectable treatment, Outcome 10 Peri‐ and post‐ operative complication. | ||||
| 10.1 CaHa particles vs collagen | 1 | Risk Ratio (M‐H, Fixed, 95% CI) | 0.0 [0.0, 0.0] | |
| 10.2 Zuidex vs collagen | 1 | Risk Ratio (M‐H, Fixed, 95% CI) | 0.0 [0.0, 0.0] | |
| 11 Voiding difficulties postoperatively and long‐term (hypercontinence) Show forest plot | 2 | Risk Ratio (M‐H, Fixed, 95% CI) | Totals not selected | |
| Analysis 4.11  Comparison 4 One material for injectable treatment versus another material for injectable treatment, Outcome 11 Voiding difficulties postoperatively and long‐term (hypercontinence). | ||||
| 11.1 CaHa versus collagen | 1 | Risk Ratio (M‐H, Fixed, 95% CI) | 0.0 [0.0, 0.0] | |
| 11.2 permacol vs silicone particles | 1 | Risk Ratio (M‐H, Fixed, 95% CI) | 0.0 [0.0, 0.0] | |
| 12 New urinary symptoms (urge incontinence) Show forest plot | 1 | Risk Ratio (M‐H, Fixed, 95% CI) | Totals not selected | |
| Analysis 4.12 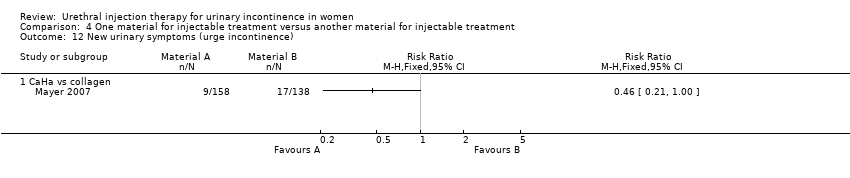 Comparison 4 One material for injectable treatment versus another material for injectable treatment, Outcome 12 New urinary symptoms (urge incontinence). | ||||
| 12.1 CaHa vs collagen | 1 | Risk Ratio (M‐H, Fixed, 95% CI) | 0.0 [0.0, 0.0] | |
| 13 Injection site complications Show forest plot | 1 | Risk Ratio (M‐H, Fixed, 95% CI) | Totals not selected | |
| Analysis 4.13  Comparison 4 One material for injectable treatment versus another material for injectable treatment, Outcome 13 Injection site complications. | ||||
| 13.1 Zuidex versus collagen | 1 | Risk Ratio (M‐H, Fixed, 95% CI) | 0.0 [0.0, 0.0] | |
| Outcome or subgroup title | No. of studies | No. of participants | Statistical method | Effect size |
| 1 Number not cured (worse, unchanged or improved) within first year Show forest plot | 2 | Risk Ratio (M‐H, Fixed, 95% CI) | Totals not selected | |
| Analysis 5.1  Comparison 5 One route of injection versus another route of injection, Outcome 1 Number not cured (worse, unchanged or improved) within first year. | ||||
| 1.1 periurethral injection vs transurethral injection | 1 | Risk Ratio (M‐H, Fixed, 95% CI) | 0.0 [0.0, 0.0] | |
| 1.2 bladder neck versus mid‐urethral | 1 | Risk Ratio (M‐H, Fixed, 95% CI) | 0.0 [0.0, 0.0] | |
| 2 Urinary retention Show forest plot | 2 | Risk Ratio (M‐H, Random, 95% CI) | Totals not selected | |
| Analysis 5.2  Comparison 5 One route of injection versus another route of injection, Outcome 2 Urinary retention. | ||||
| 2.1 periurethral vs transurethral injection | 1 | Risk Ratio (M‐H, Random, 95% CI) | 0.0 [0.0, 0.0] | |
| 2.2 bladder neck vs mid‐urethral | 1 | Risk Ratio (M‐H, Random, 95% CI) | 0.0 [0.0, 0.0] | |

PRISMA Study flow diagram ‐ showing the flow of literature through the review process
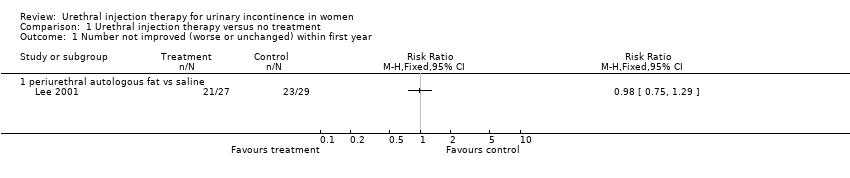
Comparison 1 Urethral injection therapy versus no treatment, Outcome 1 Number not improved (worse or unchanged) within first year.

Comparison 1 Urethral injection therapy versus no treatment, Outcome 2 Pad weight test.

Comparison 1 Urethral injection therapy versus no treatment, Outcome 3 Disease‐specific measures.

Comparison 1 Urethral injection therapy versus no treatment, Outcome 4 Number of patients requiring more than 1 treatment to achieve maximum benefit.

Comparison 1 Urethral injection therapy versus no treatment, Outcome 5 Peri‐ and postoperative complication.
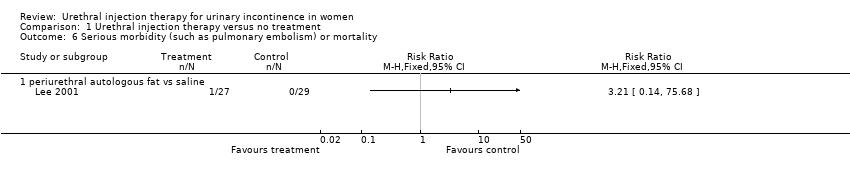
Comparison 1 Urethral injection therapy versus no treatment, Outcome 6 Serious morbidity (such as pulmonary embolism) or mortality.

Comparison 2 Urethral injection therapy versus conservative management, Outcome 1 Number not cured (worse, unchanged or improved) at 3 months.

Comparison 2 Urethral injection therapy versus conservative management, Outcome 2 Number not improved (worse or unchanged) at 3 months.
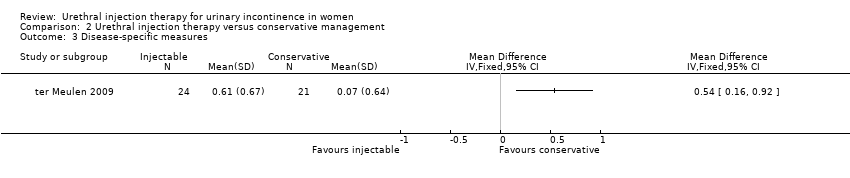
Comparison 2 Urethral injection therapy versus conservative management, Outcome 3 Disease‐specific measures.

Comparison 2 Urethral injection therapy versus conservative management, Outcome 4 Peri‐ and postoperative complication.
Comparison 3 Urethral injection therapy versus other surgical managements, Outcome 1 Number not cured (subjectively) within first year.
Comparison 3 Urethral injection therapy versus other surgical managements, Outcome 2 Number not cured (objectively) within first year.

Comparison 3 Urethral injection therapy versus other surgical managements, Outcome 3 Presence of urinary urgency and urge incontinence.

Comparison 3 Urethral injection therapy versus other surgical managements, Outcome 4 Disease‐specific measures.
Comparison 3 Urethral injection therapy versus other surgical managements, Outcome 5 Numbers not satisfied.

Comparison 4 One material for injectable treatment versus another material for injectable treatment, Outcome 1 Number not cured (worse, unchanged ) within first year.
Comparison 4 One material for injectable treatment versus another material for injectable treatment, Outcome 2 Number not cured (worse, unchanged ) after first year.
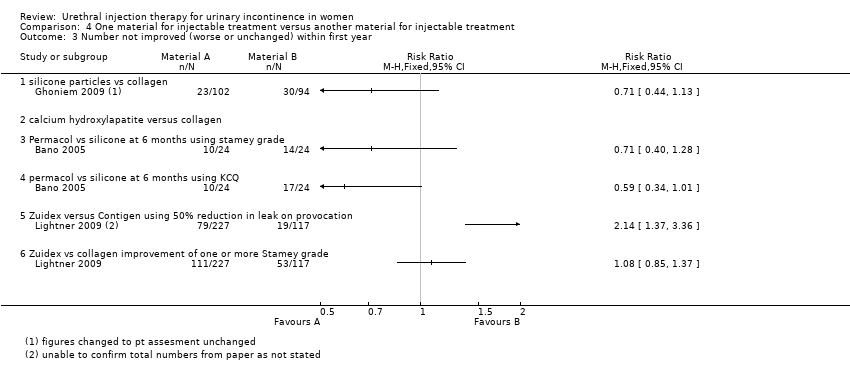
Comparison 4 One material for injectable treatment versus another material for injectable treatment, Outcome 3 Number not improved (worse or unchanged) within first year.

Comparison 4 One material for injectable treatment versus another material for injectable treatment, Outcome 4 Number not improved (worse or unchanged) after first year.

Comparison 4 One material for injectable treatment versus another material for injectable treatment, Outcome 5 Presence of urge incontinence.

Comparison 4 One material for injectable treatment versus another material for injectable treatment, Outcome 6 Pad weight test.

Comparison 4 One material for injectable treatment versus another material for injectable treatment, Outcome 7 Number of treatment required to achieve maximum benefit.

Comparison 4 One material for injectable treatment versus another material for injectable treatment, Outcome 8 Number of patients requiring more than 1 treatment to achieve maximum benefit.
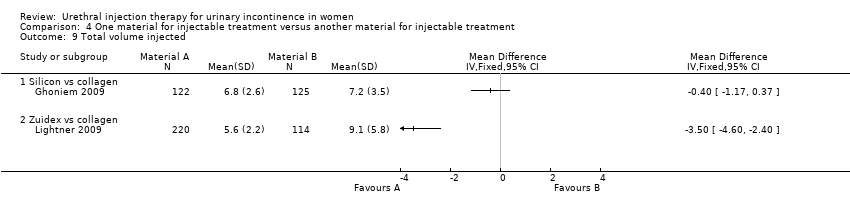
Comparison 4 One material for injectable treatment versus another material for injectable treatment, Outcome 9 Total volume injected.
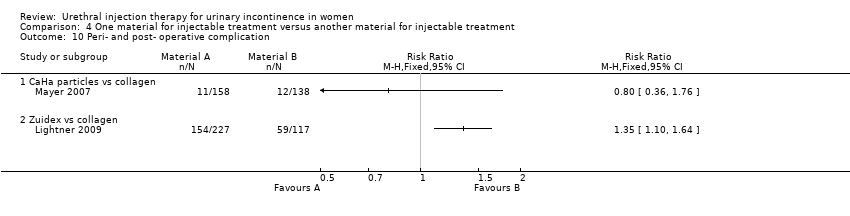
Comparison 4 One material for injectable treatment versus another material for injectable treatment, Outcome 10 Peri‐ and post‐ operative complication.

Comparison 4 One material for injectable treatment versus another material for injectable treatment, Outcome 11 Voiding difficulties postoperatively and long‐term (hypercontinence).

Comparison 4 One material for injectable treatment versus another material for injectable treatment, Outcome 12 New urinary symptoms (urge incontinence).

Comparison 4 One material for injectable treatment versus another material for injectable treatment, Outcome 13 Injection site complications.

Comparison 5 One route of injection versus another route of injection, Outcome 1 Number not cured (worse, unchanged or improved) within first year.

Comparison 5 One route of injection versus another route of injection, Outcome 2 Urinary retention.
| Outcome or subgroup title | No. of studies | No. of participants | Statistical method | Effect size |
| 1 Number not improved (worse or unchanged) within first year Show forest plot | 1 | Risk Ratio (M‐H, Fixed, 95% CI) | Totals not selected | |
| 1.1 periurethral autologous fat vs saline | 1 | Risk Ratio (M‐H, Fixed, 95% CI) | 0.0 [0.0, 0.0] | |
| 2 Pad weight test Show forest plot | 1 | Mean Difference (IV, Fixed, 95% CI) | Totals not selected | |
| 2.1 periurethral autologous fat vs saline | 1 | Mean Difference (IV, Fixed, 95% CI) | 0.0 [0.0, 0.0] | |
| 3 Disease‐specific measures Show forest plot | 1 | Mean Difference (IV, Fixed, 95% CI) | Totals not selected | |
| 3.1 periurethral autologous fat vs saline | 1 | Mean Difference (IV, Fixed, 95% CI) | 0.0 [0.0, 0.0] | |
| 4 Number of patients requiring more than 1 treatment to achieve maximum benefit Show forest plot | 1 | Risk Ratio (M‐H, Fixed, 95% CI) | Totals not selected | |
| 4.1 periurethral autologous fat vs saline | 1 | Risk Ratio (M‐H, Fixed, 95% CI) | 0.0 [0.0, 0.0] | |
| 5 Peri‐ and postoperative complication Show forest plot | 1 | Risk Ratio (M‐H, Fixed, 95% CI) | Totals not selected | |
| 5.1 periurethral autologous fat vs saline | 1 | Risk Ratio (M‐H, Fixed, 95% CI) | 0.0 [0.0, 0.0] | |
| 6 Serious morbidity (such as pulmonary embolism) or mortality Show forest plot | 1 | Risk Ratio (M‐H, Fixed, 95% CI) | Totals not selected | |
| 6.1 periurethral autologous fat vs saline | 1 | Risk Ratio (M‐H, Fixed, 95% CI) | 0.0 [0.0, 0.0] | |
| Outcome or subgroup title | No. of studies | No. of participants | Statistical method | Effect size |
| 1 Number not cured (worse, unchanged or improved) at 3 months Show forest plot | 1 | Risk Ratio (M‐H, Fixed, 95% CI) | Totals not selected | |
| 2 Number not improved (worse or unchanged) at 3 months Show forest plot | 1 | Risk Ratio (M‐H, Fixed, 95% CI) | Totals not selected | |
| 3 Disease‐specific measures Show forest plot | 1 | Mean Difference (IV, Fixed, 95% CI) | Totals not selected | |
| 4 Peri‐ and postoperative complication Show forest plot | 1 | Risk Ratio (M‐H, Fixed, 95% CI) | Totals not selected | |
| 4.1 retention | 1 | Risk Ratio (M‐H, Fixed, 95% CI) | 0.0 [0.0, 0.0] | |
| Outcome or subgroup title | No. of studies | No. of participants | Statistical method | Effect size |
| 1 Number not cured (subjectively) within first year Show forest plot | 1 | Risk Ratio (M‐H, Fixed, 95% CI) | Totals not selected | |
| 1.1 macroplastique vs pubovaginal sling | 1 | Risk Ratio (M‐H, Fixed, 95% CI) | 0.0 [0.0, 0.0] | |
| 2 Number not cured (objectively) within first year Show forest plot | 2 | Risk Ratio (M‐H, Fixed, 95% CI) | Totals not selected | |
| 2.1 collagen vs surgery | 1 | Risk Ratio (M‐H, Fixed, 95% CI) | 0.0 [0.0, 0.0] | |
| 2.2 macroplastique vs pubovaginal sling | 1 | Risk Ratio (M‐H, Fixed, 95% CI) | 0.0 [0.0, 0.0] | |
| 3 Presence of urinary urgency and urge incontinence Show forest plot | 1 | Risk Ratio (M‐H, Fixed, 95% CI) | Totals not selected | |
| 3.1 collagen vs surgery | 1 | Risk Ratio (M‐H, Fixed, 95% CI) | 0.0 [0.0, 0.0] | |
| 4 Disease‐specific measures Show forest plot | 1 | Mean Difference (IV, Fixed, 95% CI) | Totals not selected | |
| 4.1 collagen vs surgery | 1 | Mean Difference (IV, Fixed, 95% CI) | 0.0 [0.0, 0.0] | |
| 5 Numbers not satisfied Show forest plot | 2 | Risk Ratio (M‐H, Fixed, 95% CI) | Totals not selected | |
| 5.1 collagen vs surgery | 1 | Risk Ratio (M‐H, Fixed, 95% CI) | 0.0 [0.0, 0.0] | |
| 5.2 macroplastique vs pubovaginal sling | 1 | Risk Ratio (M‐H, Fixed, 95% CI) | 0.0 [0.0, 0.0] | |
| Outcome or subgroup title | No. of studies | No. of participants | Statistical method | Effect size |
| 1 Number not cured (worse, unchanged ) within first year Show forest plot | 5 | Risk Ratio (M‐H, Fixed, 95% CI) | Totals not selected | |
| 1.1 carbon particles vs collagen | 1 | Risk Ratio (M‐H, Fixed, 95% CI) | 0.0 [0.0, 0.0] | |
| 1.2 Silicone particles vs collagen | 1 | Risk Ratio (M‐H, Fixed, 95% CI) | 0.0 [0.0, 0.0] | |
| 1.3 Ethylene vinyl alcohol copolymer vs collagen | 1 | Risk Ratio (M‐H, Fixed, 95% CI) | 0.0 [0.0, 0.0] | |
| 1.4 Permacol vs silicone particles | 1 | Risk Ratio (M‐H, Fixed, 95% CI) | 0.0 [0.0, 0.0] | |
| 1.5 Dextranomer/hyaluronic acid versus collagen <2g leakage on pad test | 1 | Risk Ratio (M‐H, Fixed, 95% CI) | 0.0 [0.0, 0.0] | |
| 2 Number not cured (worse, unchanged ) after first year Show forest plot | 2 | Risk Ratio (M‐H, Fixed, 95% CI) | Totals not selected | |
| 2.1 Carbon particles versus collagen | 1 | Risk Ratio (M‐H, Fixed, 95% CI) | 0.0 [0.0, 0.0] | |
| 2.2 CaHa versus collagen | 1 | Risk Ratio (M‐H, Fixed, 95% CI) | 0.0 [0.0, 0.0] | |
| 3 Number not improved (worse or unchanged) within first year Show forest plot | 3 | Risk Ratio (M‐H, Fixed, 95% CI) | Totals not selected | |
| 3.1 silicone particles vs collagen | 1 | Risk Ratio (M‐H, Fixed, 95% CI) | 0.0 [0.0, 0.0] | |
| 3.2 calcium hydroxylapatite versus collagen | 0 | Risk Ratio (M‐H, Fixed, 95% CI) | 0.0 [0.0, 0.0] | |
| 3.3 Permacol vs silicone at 6 months using stamey grade | 1 | Risk Ratio (M‐H, Fixed, 95% CI) | 0.0 [0.0, 0.0] | |
| 3.4 permacol vs silicone at 6 months using KCQ | 1 | Risk Ratio (M‐H, Fixed, 95% CI) | 0.0 [0.0, 0.0] | |
| 3.5 Zuidex versus Contigen using 50% reduction in leak on provocation | 1 | Risk Ratio (M‐H, Fixed, 95% CI) | 0.0 [0.0, 0.0] | |
| 3.6 Zuidex vs collagen improvement of one or more Stamey grade | 1 | Risk Ratio (M‐H, Fixed, 95% CI) | 0.0 [0.0, 0.0] | |
| 4 Number not improved (worse or unchanged) after first year Show forest plot | 2 | Risk Ratio (M‐H, Fixed, 95% CI) | Totals not selected | |
| 4.1 Carbon particles versus collagen | 1 | Risk Ratio (M‐H, Fixed, 95% CI) | 0.0 [0.0, 0.0] | |
| 4.2 CaHa versus collagen ‐ improved | 1 | Risk Ratio (M‐H, Fixed, 95% CI) | 0.0 [0.0, 0.0] | |
| 4.3 CaHa versus collagen ‐ significant improvement | 1 | Risk Ratio (M‐H, Fixed, 95% CI) | 0.0 [0.0, 0.0] | |
| 5 Presence of urge incontinence Show forest plot | 1 | Risk Ratio (M‐H, Fixed, 95% CI) | Totals not selected | |
| 5.1 Permacol vs silicone particles | 1 | Risk Ratio (M‐H, Fixed, 95% CI) | 0.0 [0.0, 0.0] | |
| 6 Pad weight test Show forest plot | 4 | Mean Difference (IV, Fixed, 95% CI) | Totals not selected | |
| 6.1 carbon particles vs collagen | 1 | Mean Difference (IV, Fixed, 95% CI) | 0.0 [0.0, 0.0] | |
| 6.2 CaHa versus collagen | 1 | Mean Difference (IV, Fixed, 95% CI) | 0.0 [0.0, 0.0] | |
| 6.3 Silicone particles vs collagen | 1 | Mean Difference (IV, Fixed, 95% CI) | 0.0 [0.0, 0.0] | |
| 6.4 Dexranomer/hyaluronic acid versus collagen | 1 | Mean Difference (IV, Fixed, 95% CI) | 0.0 [0.0, 0.0] | |
| 7 Number of treatment required to achieve maximum benefit Show forest plot | 2 | 699 | Mean Difference (IV, Fixed, 95% CI) | 0.0 [0.0, 0.0] |
| 7.1 carbon particles vs collagen | 1 | 355 | Mean Difference (IV, Fixed, 95% CI) | 0.0 [0.0, 0.0] |
| 7.2 Zuidex vs collagen | 1 | 344 | Mean Difference (IV, Fixed, 95% CI) | 0.0 [0.0, 0.0] |
| 8 Number of patients requiring more than 1 treatment to achieve maximum benefit Show forest plot | 2 | Risk Ratio (M‐H, Fixed, 95% CI) | Totals not selected | |
| 8.1 silicone particles vs collagen | 1 | Risk Ratio (M‐H, Fixed, 95% CI) | 0.0 [0.0, 0.0] | |
| 8.2 Zuidex versus collagen | 1 | Risk Ratio (M‐H, Fixed, 95% CI) | 0.0 [0.0, 0.0] | |
| 9 Total volume injected Show forest plot | 2 | Mean Difference (IV, Fixed, 95% CI) | Totals not selected | |
| 9.1 Silicon vs collagen | 1 | Mean Difference (IV, Fixed, 95% CI) | 0.0 [0.0, 0.0] | |
| 9.2 Zuidex vs collagen | 1 | Mean Difference (IV, Fixed, 95% CI) | 0.0 [0.0, 0.0] | |
| 10 Peri‐ and post‐ operative complication Show forest plot | 2 | Risk Ratio (M‐H, Fixed, 95% CI) | Totals not selected | |
| 10.1 CaHa particles vs collagen | 1 | Risk Ratio (M‐H, Fixed, 95% CI) | 0.0 [0.0, 0.0] | |
| 10.2 Zuidex vs collagen | 1 | Risk Ratio (M‐H, Fixed, 95% CI) | 0.0 [0.0, 0.0] | |
| 11 Voiding difficulties postoperatively and long‐term (hypercontinence) Show forest plot | 2 | Risk Ratio (M‐H, Fixed, 95% CI) | Totals not selected | |
| 11.1 CaHa versus collagen | 1 | Risk Ratio (M‐H, Fixed, 95% CI) | 0.0 [0.0, 0.0] | |
| 11.2 permacol vs silicone particles | 1 | Risk Ratio (M‐H, Fixed, 95% CI) | 0.0 [0.0, 0.0] | |
| 12 New urinary symptoms (urge incontinence) Show forest plot | 1 | Risk Ratio (M‐H, Fixed, 95% CI) | Totals not selected | |
| 12.1 CaHa vs collagen | 1 | Risk Ratio (M‐H, Fixed, 95% CI) | 0.0 [0.0, 0.0] | |
| 13 Injection site complications Show forest plot | 1 | Risk Ratio (M‐H, Fixed, 95% CI) | Totals not selected | |
| 13.1 Zuidex versus collagen | 1 | Risk Ratio (M‐H, Fixed, 95% CI) | 0.0 [0.0, 0.0] | |
| Outcome or subgroup title | No. of studies | No. of participants | Statistical method | Effect size |
| 1 Number not cured (worse, unchanged or improved) within first year Show forest plot | 2 | Risk Ratio (M‐H, Fixed, 95% CI) | Totals not selected | |
| 1.1 periurethral injection vs transurethral injection | 1 | Risk Ratio (M‐H, Fixed, 95% CI) | 0.0 [0.0, 0.0] | |
| 1.2 bladder neck versus mid‐urethral | 1 | Risk Ratio (M‐H, Fixed, 95% CI) | 0.0 [0.0, 0.0] | |
| 2 Urinary retention Show forest plot | 2 | Risk Ratio (M‐H, Random, 95% CI) | Totals not selected | |
| 2.1 periurethral vs transurethral injection | 1 | Risk Ratio (M‐H, Random, 95% CI) | 0.0 [0.0, 0.0] | |
| 2.2 bladder neck vs mid‐urethral | 1 | Risk Ratio (M‐H, Random, 95% CI) | 0.0 [0.0, 0.0] | |