Scolaris Content Display Scolaris Content Display

Comparison 1 Emdogain versus Control: 1 year, Outcome 1 Tooth Loss.
Figuras y tablas -
Analysis 1.1

Comparison 1 Emdogain versus Control: 1 year, Outcome 1 Tooth Loss.

Comparison 1 Emdogain versus Control: 1 year, Outcome 2 PAL.
Figuras y tablas -
Analysis 1.2

Comparison 1 Emdogain versus Control: 1 year, Outcome 2 PAL.

Comparison 1 Emdogain versus Control: 1 year, Outcome 3 PAL < 2 mm.
Figuras y tablas -
Analysis 1.3

Comparison 1 Emdogain versus Control: 1 year, Outcome 3 PAL < 2 mm.

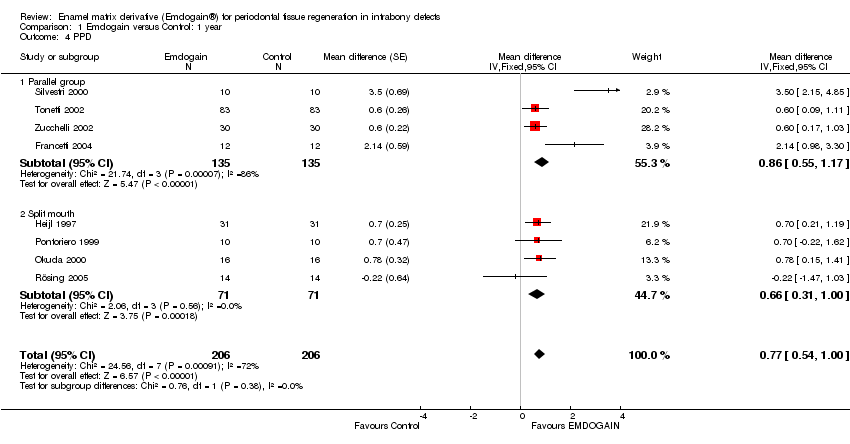
Comparison 1 Emdogain versus Control: 1 year, Outcome 4 PPD.
Figuras y tablas -
Analysis 1.4

Comparison 1 Emdogain versus Control: 1 year, Outcome 4 PPD.

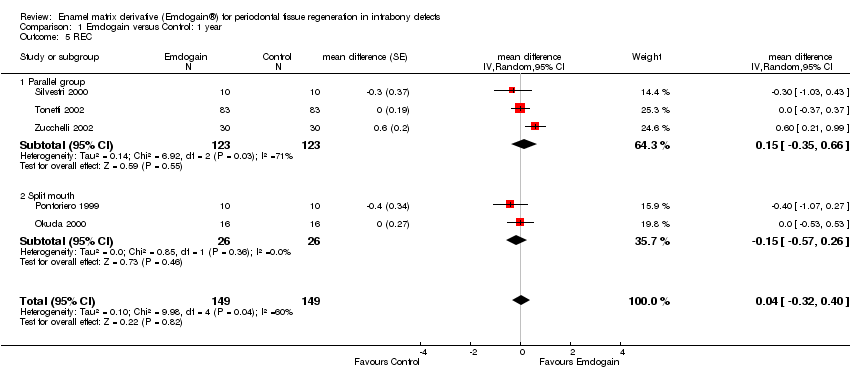
Comparison 1 Emdogain versus Control: 1 year, Outcome 5 REC.
Figuras y tablas -
Analysis 1.5

Comparison 1 Emdogain versus Control: 1 year, Outcome 5 REC.

Comparison 1 Emdogain versus Control: 1 year, Outcome 6 Marginal bone level.
Figuras y tablas -
Analysis 1.6

Comparison 1 Emdogain versus Control: 1 year, Outcome 6 Marginal bone level.

Comparison 1 Emdogain versus Control: 1 year, Outcome 7 Postoperative infection.
Figuras y tablas -
Analysis 1.7

Comparison 1 Emdogain versus Control: 1 year, Outcome 7 Postoperative infection.

Comparison 1 Emdogain versus Control: 1 year, Outcome 8 Aesthetics.
Figuras y tablas -
Analysis 1.8

Comparison 1 Emdogain versus Control: 1 year, Outcome 8 Aesthetics.

Comparison 2 Emdogain versus GTR: 1 year, Outcome 1 Tooth loss.
Figuras y tablas -
Analysis 2.1

Comparison 2 Emdogain versus GTR: 1 year, Outcome 1 Tooth loss.

Comparison 2 Emdogain versus GTR: 1 year, Outcome 2 PAL.
Figuras y tablas -
Analysis 2.2

Comparison 2 Emdogain versus GTR: 1 year, Outcome 2 PAL.

Comparison 2 Emdogain versus GTR: 1 year, Outcome 3 PPD.
Figuras y tablas -
Analysis 2.3

Comparison 2 Emdogain versus GTR: 1 year, Outcome 3 PPD.

Comparison 2 Emdogain versus GTR: 1 year, Outcome 4 REC.
Figuras y tablas -
Analysis 2.4

Comparison 2 Emdogain versus GTR: 1 year, Outcome 4 REC.

Comparison 2 Emdogain versus GTR: 1 year, Outcome 5 Postoperative infection.
Figuras y tablas -
Analysis 2.5

Comparison 2 Emdogain versus GTR: 1 year, Outcome 5 Postoperative infection.

Comparison 2 Emdogain versus GTR: 1 year, Outcome 6 Postoperative complications.
Figuras y tablas -
Analysis 2.6

Comparison 2 Emdogain versus GTR: 1 year, Outcome 6 Postoperative complications.

Table 1. Results of quality assessment after correspondence with authors

Study

Allocation

Blinding of assessor

Withdrawals

Risk of bias

Heijl 1997

Adequate

Yes

Yes

A

Pontoriero 1999

Unclear

Yes

Yes

B

Okuda 2000

Unclear

Yes

Yes

B

Silvestri 2000

Inadequate

No

Yes

B

Tonetti 2002

Adequate

No

Yes

B

Zucchelli 2002

Unclear

Yes

Yes

B

Silvestri 2003

Unclear

No

Yes

B

Francetti 2004

Adequate

No

Yes

B

Sanz 2004

Adequate

No

No

B

Rösing 2005

Adequate

Yes

Yes

A

Figuras y tablas -
Table 1. Results of quality assessment after correspondence with authors
Table 2. Random‐effects metaregression analysis of outcomes PAL, PPD, REC

Characteristic

Outcome

No. studies

Slope estimate (SE)

95% CI

Slope

P‐value

Parallel versus split mouth

PAL

8

‐0.95 (0.55)

(‐2.02, 0.13)

Emdogain in parallel group trials has higher effect

0.08

Parallel versus split mouth

PPD

8

‐0.94 (0.66)

(‐2.24, 0.36)

Emdogain in parallel group trials has higher effect

0.16

Parallel versus split mouth

REC

5

‐0.33 (0.38)

(‐1.09, 0.41)

Emdogain in parallel group trials has higher effect

0.38

Figuras y tablas -
Table 2. Random‐effects metaregression analysis of outcomes PAL, PPD, REC
Comparison 1. Emdogain versus Control: 1 year

Outcome or subgroup title

No. of studies

No. of participants

Statistical method

Effect size

1 Tooth Loss Show forest plot

8

418

risk ratio (Random, 95% CI)

0.0 [0.0, 0.0]

1.1 Parallel group

4

270

risk ratio (Random, 95% CI)

0.0 [0.0, 0.0]

1.2 Split mouth

4

148

risk ratio (Random, 95% CI)

0.0 [0.0, 0.0]

2 PAL Show forest plot

8

412

mean difference (Random, 95% CI)

1.20 [0.71, 1.69]

2.1 Parallel group

4

270

mean difference (Random, 95% CI)

1.72 [0.81, 2.62]

2.2 Split mouth

4

142

mean difference (Random, 95% CI)

0.76 [0.48, 1.04]

3 PAL < 2 mm Show forest plot

5

332

risk ratio (Random, 95% CI)

0.48 [0.29, 0.80]

4 PPD Show forest plot

8

412

Mean difference (Fixed, 95% CI)

0.77 [0.54, 1.00]

4.1 Parallel group

4

270

Mean difference (Fixed, 95% CI)

0.86 [0.55, 1.17]

4.2 Split mouth

4

142

Mean difference (Fixed, 95% CI)

0.66 [0.31, 1.00]

5 REC Show forest plot

5

298

mean difference (Random, 95% CI)

0.04 [‐0.32, 0.40]

5.1 Parallel group

3

246

mean difference (Random, 95% CI)

0.15 [‐0.35, 0.66]

5.2 Split mouth

2

52

mean difference (Random, 95% CI)

‐0.15 [‐0.57, 0.26]

6 Marginal bone level Show forest plot

2

90

mean difference (Random, 95% CI)

1.08 [‐0.72, 2.89]

6.1 Parallel group

0

0

mean difference (Random, 95% CI)

0.0 [0.0, 0.0]

6.2 Split mouth

2

90

mean difference (Random, 95% CI)

1.08 [‐0.72, 2.89]

7 Postoperative infection Show forest plot

7

388

risk ratio (Random, 95% CI)

0.0 [0.0, 0.0]

7.1 Parallel group

4

270

risk ratio (Random, 95% CI)

0.0 [0.0, 0.0]

7.2 Split mouth

3

118

risk ratio (Random, 95% CI)

0.0 [0.0, 0.0]

8 Aesthetics Show forest plot

1

Mean Difference (IV, Random, 95% CI)

Totals not selected

8.1 Parallel group

1

Mean Difference (IV, Random, 95% CI)

0.0 [0.0, 0.0]

Figuras y tablas -
Comparison 1. Emdogain versus Control: 1 year
Comparison 2. Emdogain versus GTR: 1 year

Outcome or subgroup title

No. of studies

No. of participants

Statistical method

Effect size

1 Tooth loss Show forest plot

4

216

risk ratio (Random, 95% CI)

0.0 [0.0, 0.0]

1.1 Parallel group

4

216

risk ratio (Random, 95% CI)

0.0 [0.0, 0.0]

1.2 Split mouth

0

0

risk ratio (Random, 95% CI)

0.0 [0.0, 0.0]

2 PAL Show forest plot

5

263

mean difference (Fixed, 95% CI)

‐0.20 [‐0.59, 0.20]

2.1 Parallel group

5

263

mean difference (Fixed, 95% CI)

‐0.20 [‐0.59, 0.20]

2.2 Split mouth

0

0

mean difference (Fixed, 95% CI)

0.0 [0.0, 0.0]

3 PPD Show forest plot

5

263

mean difference (Random, 95% CI)

‐0.49 [‐1.23, 0.26]

3.1 Parallel group

5

263

mean difference (Random, 95% CI)

‐0.49 [‐1.23, 0.26]

3.2 Split mouth

0

0

mean difference (Random, 95% CI)

0.0 [0.0, 0.0]

4 REC Show forest plot

4

167

mean difference (Random, 95% CI)

0.39 [0.13, 0.66]

4.1 Parallel group

4

167

mean difference (Random, 95% CI)

0.39 [0.13, 0.66]

4.2 Split mouth

0

0

mean difference (Random, 95% CI)

0.0 [0.0, 0.0]

5 Postoperative infection Show forest plot

4

218

risk ratio (Random, 95% CI)

0.20 [0.01, 4.09]

5.1 Parallel group

4

218

risk ratio (Random, 95% CI)

0.20 [0.01, 4.09]

5.2 Split mouth

0

0

risk ratio (Random, 95% CI)

0.0 [0.0, 0.0]

6 Postoperative complications Show forest plot

1

64

Risk Ratio (M‐H, Fixed, 95% CI)

0.08 [0.02, 0.25]

6.1 Parallel group

1

64

Risk Ratio (M‐H, Fixed, 95% CI)

0.08 [0.02, 0.25]

Figuras y tablas -
Comparison 2. Emdogain versus GTR: 1 year