Scolaris Content Display Scolaris Content Display

Searching flow diagram
Figuras y tablas -
Figure 1

Searching flow diagram

Methodological quality graph: review authors' judgements about each methodological quality item presented as percentages across all included studies.
Figuras y tablas -
Figure 2

Methodological quality graph: review authors' judgements about each methodological quality item presented as percentages across all included studies.

Methodological quality summary: review authors' judgements about each methodological quality item for each included study.
Figuras y tablas -
Figure 3

Methodological quality summary: review authors' judgements about each methodological quality item for each included study.

Funnel plot of comparison: bispectral index versus clinical signs on the requirement of propofol infusion rate (mg/kg/hr).
Figuras y tablas -
Figure 4

Funnel plot of comparison: bispectral index versus clinical signs on the requirement of propofol infusion rate (mg/kg/hr).

Funnel plot of comparison: bispectral index versus clinical signs on requirement of volatile anaesthetic (minimal alveolar concentration equivalents, MAC equivalents).
Figuras y tablas -
Figure 5

Funnel plot of comparison: bispectral index versus clinical signs on requirement of volatile anaesthetic (minimal alveolar concentration equivalents, MAC equivalents).

Comparison 1 Bispectral index versus standard practice (risk of awareness in surgical patients with high risk of awareness), Outcome 1 awareness in surgical patients with high risk of recall awareness.
Figuras y tablas -
Analysis 1.1

Comparison 1 Bispectral index versus standard practice (risk of awareness in surgical patients with high risk of awareness), Outcome 1 awareness in surgical patients with high risk of recall awareness.

Comparison 2 Bispectral index versus clinical signs (recovery profiles), Outcome 1 Time to eyes opening (minutes).
Figuras y tablas -
Analysis 2.1

Comparison 2 Bispectral index versus clinical signs (recovery profiles), Outcome 1 Time to eyes opening (minutes).

Comparison 2 Bispectral index versus clinical signs (recovery profiles), Outcome 2 Time to respond to verbal command (minutes).
Figuras y tablas -
Analysis 2.2

Comparison 2 Bispectral index versus clinical signs (recovery profiles), Outcome 2 Time to respond to verbal command (minutes).

Comparison 2 Bispectral index versus clinical signs (recovery profiles), Outcome 3 Time to extubation (minutes).
Figuras y tablas -
Analysis 2.3

Comparison 2 Bispectral index versus clinical signs (recovery profiles), Outcome 3 Time to extubation (minutes).

Comparison 2 Bispectral index versus clinical signs (recovery profiles), Outcome 4 Time to orientation (minutes).
Figuras y tablas -
Analysis 2.4

Comparison 2 Bispectral index versus clinical signs (recovery profiles), Outcome 4 Time to orientation (minutes).

Comparison 2 Bispectral index versus clinical signs (recovery profiles), Outcome 5 PACU stay (minutes).
Figuras y tablas -
Analysis 2.5

Comparison 2 Bispectral index versus clinical signs (recovery profiles), Outcome 5 PACU stay (minutes).

Comparison 2 Bispectral index versus clinical signs (recovery profiles), Outcome 6 Time to home readiness (minutes).
Figuras y tablas -
Analysis 2.6

Comparison 2 Bispectral index versus clinical signs (recovery profiles), Outcome 6 Time to home readiness (minutes).

Comparison 3 Bispectral index versus clinical signs (requirement of anaesthetics), Outcome 1 Normalized propofol infusion rate (mg/kg/hr).
Figuras y tablas -
Analysis 3.1

Comparison 3 Bispectral index versus clinical signs (requirement of anaesthetics), Outcome 1 Normalized propofol infusion rate (mg/kg/hr).

Comparison 3 Bispectral index versus clinical signs (requirement of anaesthetics), Outcome 2 Volatile anaesthetic requirement, minimal alveolar concentration equivalents (MAC equivalents).
Figuras y tablas -
Analysis 3.2

Comparison 3 Bispectral index versus clinical signs (requirement of anaesthetics), Outcome 2 Volatile anaesthetic requirement, minimal alveolar concentration equivalents (MAC equivalents).

Comparison 4 Bispectral index versus clinical signs (requirement of narcotics), Outcome 1 Total dose of fentanyl (microgramme).
Figuras y tablas -
Analysis 4.1

Comparison 4 Bispectral index versus clinical signs (requirement of narcotics), Outcome 1 Total dose of fentanyl (microgramme).

Comparison 4 Bispectral index versus clinical signs (requirement of narcotics), Outcome 2 average normalized remifentanil infusion rates ( microgramme/kg/min).
Figuras y tablas -
Analysis 4.2

Comparison 4 Bispectral index versus clinical signs (requirement of narcotics), Outcome 2 average normalized remifentanil infusion rates ( microgramme/kg/min).

Summary of findings for the main comparison. Bispectral index versus standard practice for reducing risk of intraoperative awareness in surgical patients with high risk of awareness

Bispectral index versus standard practice for reducing risk of intraoperative awareness in surgical patients with high risk of awareness

Patient or population: surgical patients with high risk of recall awareness
Settings: surgical patients with high risk of intraoperative awareness
Intervention: bispectral index
Comparison: standard practice

Outcomes

Illustrative comparative risks* (95% CI)

Relative effect
(95% CI)

No of Participants
(studies)

Quality of the evidence
(GRADE)

Comments

Assumed risk

Corresponding risk

standard practice

bispectral index

awareness in studies using clinical signs as a guide in the standard practice

Study population

OR 0.24
(0.08 to 0.69)

2493
(2 studies)

⊕⊕⊕⊕
high

10 per 1000

2 per 1000
(1 to 7)

Medium risk population

36 per 1000

9 per 1000
(3 to 25)

awareness in studies using end‐tidal gas as a guide in the standard practice

Study population

OR 1.01
(0.14 to 7.16)

1981
(2 studies)

⊕⊕⊕⊝
moderate1

2 per 1000

2 per 1000
(0 to 14)

Medium risk population

1 per 1000

1 per 1000
(0 to 7)

*The basis for the assumed risk (e.g. the median control group risk across studies) is provided in footnotes. The corresponding risk (and its 95% confidence interval) is based on the assumed risk in the comparison group and the relative effect of the intervention (and its 95% CI).
CI: Confidence interval; OR: Odds ratio;

GRADE Working Group grades of evidence
High quality: Further research is very unlikely to change our confidence in the estimate of effect.
Moderate quality: Further research is likely to have an important impact on our confidence in the estimate of effect and may change the estimate.
Low quality: Further research is very likely to have an important impact on our confidence in the estimate of effect and is likely to change the estimate.
Very low quality: We are very uncertain about the estimate.

1 wide 95% confidence intervals

Figuras y tablas -
Summary of findings for the main comparison. Bispectral index versus standard practice for reducing risk of intraoperative awareness in surgical patients with high risk of awareness
Table 1. Anaesthetic technique and strategy in management of inadequate analgesia

Study

Anaesthetic technique

Titrating strategies

Ahmad 2003

Endotracheal GA. Induction: sevoflurane
Maintenance: sevoflurane‐sufentanil‐nitrous oxide‐a relaxant

Sevoflurane/sufentanil titrated for increased blood pressure/heart rate > 20%, despite a BIS value of 50‐60 or end tidal sevoflurane concentration 2%

Aime 2006

Endotracheal GA, Induction: propofol‐sufentanil

Intubation: atracurium

Maintenance: sevoflurane and nitrous oxide in oxygen, sufentanil, atracurium

BIS group: intermittent bolus dose of sufentanil despite BIS or Entropy values within the recommended range

Control group (CS group): increased sevoflurane concentration or intermittent bolus doses of intravenous sufentanil for signs of inadequate anaesthesia, i.e. hypertension and bradycardia

Anez 2001

LMA GA. Induction: propofol‐alfentanil
Maintenance: propofol‐rocuronium

NA

Assare 2002

LMA GA. Induction: propofol‐fentanyl
Lidocaine infiltration prior to incision
Maintenance: sevoflurane‐nitrous oxide (no muscle relaxant)

NA

Basar 2003

Endotracheal GA. Induction: fentanyl‐thiopentone
Intubation: rocuronium
Maintenance: sevoflurane‐nitrous oxide

Inadequate analgesia in both groups managed by increased concentration of sevoflurane (no supplemental fentanyl)

Boztug 2006

Endotracheal GA. Induction: fentanyl‐thiopentone
Intubation: cis‐atracurium
Maintenance: 50% O2/air mixture and 0.8%–1.5% sevoflurane, fentanyl, and cis‐atracurium

BIS group: additional fentanyl was administered in 0.1mg doses when the BIS value rose to 55. With inadequate decreases in the haemodynamic values, sevoflurane concentration was increased by 20%.

Control (CS) group: fentanyl was also administered in 0.1‐mg doses if MAP increased by 20% from baseline values, and in the event of inadequate decreases in the haemodynamic values, the sevoflurane concentration was increased by 20%.

Bruhn 2005

Endotracheal GA. Induction: remifentanil‐propofol
Intubation: cis‐atracurium
Maintenance: desflurane in O2/air mixture and remifentanil (no more neuromuscular blocking agents)

BIS group: desflurane during maintenance was continuously adjusted according to a target value of ‘50’. In case anaesthesia was judged inadequate despite the BIS target value, the infusion rate of remifentanil could be increased.
Control (CS) group: if anaesthesia was inadequate, the desflurane concentration was increased in steps of 0.5 vol%. If this was judged insufficient, the infusion rate of remifentanil could be increased.

Chiu 2007

Endotracheal GA. Induction: fentanyl‐propofol
Intubation:rocuronium
Maintenance: Before cardiopulmonary bypass
‐sevoflurane (end tidal concentration 0.5‐1.5%) with oxygen in air + infusion atracurium: during cardiopulmonary bypass
‐propofol starting TCI from 2 µg/ml in both arms

BIS group: adjustment of the propofol infusion to achieve BIS 40 to 50
Control (CS) group: titrating of TCI propofol according to perfusion pressure (70 to 90 mmHg)

Gan 1997

Endotracheal/LMA anaesthesia
Induction: propofol alfentanil
Maintenance: 50%nitrous in oxygen‐propofol‐alfentanil‐relaxants

BIS group: increasing alfentanil if BIS was within the recommended range (45‐60)
SP group: increasing doses of either propofol, alfentanil or antihypertensive agents

Hachero 2001

Endotracheal GA. Induction: propofol
Intubation: mivacurium

Maintenance: propofol‐fentanyl‐mivacurium

Signs of inadequate anaesthesia managed in both groups by fentanyl

Ibraheim 2008

Endotracheal GA. Induction: fentanyl‐propofol Intubation: succinylcholine. Maintenance: sevoflurane, nitrous oxide in oxygen, fentanyl, and atracurium

Any instances of inadequate anaesthesia were managed by increasing the concentration of sevoflurane

Kreuer 2003

Endotracheal GA. Induction: propofol‐remifentanil
Intubation: cisatracurium. Maintenance: propofol (TCI)‐ remifentanil (constant infusion)

Remifentanil infusion was given in both groups for signs of inadequate anaesthesia despite achieving propofol target concentration or a target value of 50 for BIS

Kreuer 2005

Endotracheal GA, Induction: propofol‐remifentanil
Intubation: cis‐atracurium
Maintenance: desflurane in O2/air mixture and remifentanil ( no more neuromuscular blocking agents)

BIS group: desflurane during maintenance was continuously adjusted according to a target value of ‘50’. In case anaesthesia was judged inadequate despite the BIS target value, the infusion rate of remifentanil could be increased.
Control (CS) group: if anaesthesia was inadequate, the desflurane concentration was increased in steps of 0.5 vol%. If this was judged insufficient, the infusion rate of remifentanil could be increased.

Leslie 2005a

Relaxant general anaesthesia. Induction: midazolam‐propofol or thiopentone Intubation: nondepolarizing muscle relaxants. Maintenance: propofol or volatiles‐nitrous oxide‐opioids. Hypnotic drugs. Combined general and regional anaesthesia

Narcotic analgesics on the discretion of the attending anaesthesiologists

Luginbuhl 2003

Endotracheal GA
Induction: propofol and fentanyl. Intubation: vecuronium
Maintenance: propofol‐fentanyl or desflurane‐fentanyl

BIS group: propofol or desflurane to keep BIS 45‐55 and opioids according clinical criteria
CS group: propofol or desflurane and opioids according to haemodynamic and vital sign criteria (within 20% of the baseline value)

Masuda 2002

Endotracheal GA
Induction: propofol‐fentanyl
Intubation: vecuronium
Maintenance: propofol‐nitrous oxide ‐ fentanyl‐vecuronium

NA

Mayer 2007

Endotracheal anaesthesia combined with thoracic epidural analgesia Induction: propofol 2 mg/kg, fentanyl 1–2 g/kg Intubation: cisatracurium 0.15 mg/kg Maintenance: propofol‐cisatracurium‐thoracic epidural rovivacaine and sufentanil

BIS group: additional epidural ropivacaine/sufentanil mixture plus intravenous fentanyl (a small bolus dose) for increased blood pressure despite adequate hypnosis.

Control group (CS group): increased propofol infusion for increased blood pressure, and a small fentanyl bolus along with an additional epidural bolus injection of ropivacaine/sufentanil for insufficient blood pressure control by propofol.

Morimoto 2002

Endotracheal GA
Induction:thiopentone, Intubation: vecuronium
Maintenance: sevoflurane‐nitrous oxide‐ fentanyl‐vecuronium

Managed by fentanyl 50‐100 µg, despite 2% in sevoflurane in both groups.
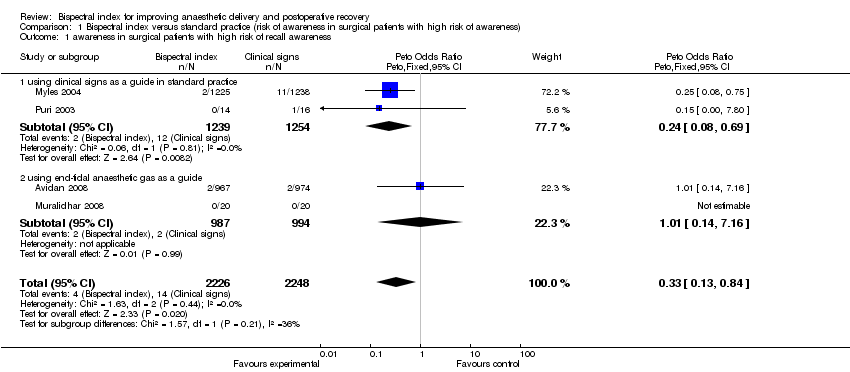
Myles 2004

Relaxant general anaesthesia. Induction: midazolam‐propofol or thiopentone Intubation: nondepolarizing muscle relaxants. Maintenance: Propofol or volatiles‐nitrous oxide‐opioids. Hypnotic drugs. Combined general and regional anaesthesia

Narcotic analgesics on the discretion of the attending anaesthesiologists

Nelskyla 2001

Endotracheal GA. Induction:propofol Intubation: rocuronium
Maintenance: Sevoflurane (0.94%‐1.4%)‐Nitrous oxide‐rocuronium

Supplemental alfentanil given for haemodynamic variables >25% of the preanaesthetic value, despite BIS of 50‐60 in BIS group or sevoflurane concentration of 1.4% in CP group

Paventi 2001

Endotracheal GA. Induction: remifentanil ‐ thiopentone

Intubation: vecuronium Maintenance: sevoflurane‐nitrous oxide‐remifentanil‐vecuronium.

Remifentanil infusion (0.4 µg/kg/min) for both groups

Puri 2003

Endotracheal GA. Induction: midazolam‐morphine‐thiopentone
Intubation:vecuronium. Maintenance: isoflurane‐nitrous oxide‐morphine

Signs of inadequate analgesia (tachycardia, hypertension, sweating, lacrimation etc) in both groups managed by morphine before vasodilators or beta‐blocker

Recart 2003

Endotracheal GA Premedication: Induction: propofol‐fentanyl
Intubation: rocuronium Maintenance: desflurane‐fentanyl

Intermittent intravenous fentanyl 0.5 mg/kg as needed to maintain haemodynamic variables within 15% of the baseline value
Labetalol to control sympathetic responses as needed (in the presence of adequate hypnotic and analgesic states)
Intermittent intravenous fentanyl 0.5 mg/kg as needed to maintain haemodynamic variables within 15% of the baseline value
Labetalol to control sympathetic responses as needed (in the presence of adequate hypnotic and analgesic states)

Song 1997

Endotracheal GA. Induction: fentanyl‐propofol. Intubation:succinylcholine Maintenance: desflurane or sevoflurane‐nitrous‐fentanyl‐mivacurium (at least 1‐2 TOF)

Inadequate analgesia (haemodynamic variables >20%of baseline) managed by supplemental doses of fentanyl (25‐30 µg)

Struys 2001

Endotracheal GA. Induction: remifentanil, propofol .Intubation: rocuronium. Maintenance: remifentanil infusion (0.5 µg/kg/min)‐propofol infusion

Remifentanil infusion

Tufano 2000

Endotracheal GA. Induction: Propofol. Intubation: Cis‐atracurium. Maintenance: propofol infusion or sevoflurane‐nitrous oxide‐cisatracurium‐fentanyl

NA

White 2004

Endotracheal GA. Induction: propofol and fentanyl Intubation: succinylcholine. Maintenance: desflurane‐nitrous‐cisatracurium

Esmolol to treat sustained increased heart rate

Wong 2002

Endotracheal GA. Induction: propofol‐fentanyl‐midazolam
Intubation: rocuronium. Maintenance: isoflurane‐nitrous oxide‐fentanyl‐rocuronium‐fentanyl

BIS group: BIS > 60 increasing isoflurane concentration; BIS = 50‐60 giving supplemental fentanyl; BIS < 50 decreasing isoflurane concentration and supplementing fentanyl (signs of inadequate anaesthesia) or labetalol (no sign of inadequate anaesthesia)
Control(CS) group: increasing isoflurane concentration or supplemental fentanyl or labetalol for management of hypertension (>25%) or tachycardia (>90 beats per minute).

Zohar 2006

LMA GA. Induction: propofol‐fentanyl
Maintenance: sevoflurane‐nitrous oxide (no muscle relaxant)

In both groups, the sevoflurane concentration was increased in response to signs of an inadequate “depth of anaesthesia” (e.g. movement in response to surgical stimulation).

GA = general anaesthesia, LMA = laryngeal mask airway, TCI = target controlled infusion

NA = not available

Figuras y tablas -
Table 1. Anaesthetic technique and strategy in management of inadequate analgesia
Table 2. BIS value during anaesthesia

Trial

Outcome

Value

BIS group

CS group

Note

Ahmad 2003

Bispectral index (BIS) during operation

Mean

Not applicable

Not applicable

Data not available

Basar 2003

BIS during operation

Mean

n = 30; mean = 44.9; SD (standard deviation) = 5.15

n = 30; mean = 40.5; SD =4.53

Boztug 2006

BIS index during maintenance

Mean

n = 24; mean = 54 ; SD =4

n = 23; mean=46; SD=5

Bruhn 2005

BIS index during maintenance

Mean

Data presented as a graph showing comparable BIS values between BIS and control (CS) groups at various point of anaesthesia.

Chiu 2007

BIS index during cardiopulmonary by pass

Mean

Gan 1997

BIS index during maintenance

Mean

Not applicable

Not applicable

Data presented as a graph showing BIS values at various points of anaesthesia in BIS group > in SP group

Hachero 2001

BIS index during maintenance

Median

n = 20; mean = 46.4; 95% confidence interval (CI ) = 44.4 to 44.8

n = 20; mean = 42.2; 95% CI = 40.1 to 44.2

Data presented as a graph showing BIS values at various points during cardiopulmonary bypass in BIS group > in SP group

Ibraheim 2008

BIS index during maintenance

Mean

Not applicable

Not applicable

Data : not available

Kreuer 2003

BIS index during maintenance

Mean

Not applicable

Not applicable

Data presented as a graph showing BIS values at various points of anaesthesia in BIS group >in SP group

Kreuer 2005

BIS index during maintenance and at the end of surgery

Mean

Data presented as a graph showing comparable BIS values between BIS and control (CS) groups at various point during operation. At the end of surgery, BIS values were significantly higher in the BIS group.

Masuda 2002

BIS index during skin incision

Mean

n = 20; mean = 46; SD = 6

n = 19; mean =47; SD =10

BIS 10 minutes before end of surgery

Mean

n = 20; mean = 59; SD = 6

n =19; mean = 52; SD = 9

BIS at end of surgery

Mean

n = 20; mean = 69; SD = 12

n = 19; mean = 60; SD = 9

BIS at end of anaesthesia

Mean

n = 20; mean = 92; SD = 6

n = 19; mean = 88; SD =6

Mayer 2007

BIS value during maintenance

not applicable

not applicable

Data not available

Morimoto 2002

BIS index during maintenance

Mean

Not applicable

Not applicable

Data presented as graph showed BIS values at various points of anaesthesia in BIS group < in SP group

Nelskyla 2001

BIS during surgery

Median

n = 32; median = 54; min‐max = 49‐61

n = 30; median = 55; min‐max.=30‐65

Paventi 2001

BIS during surgery

Median

n = 45; median = 46; min‐max = 36‐67

n = 45; median = 42; min‐max = 39‐61

BIS after skin closure

Median

n = 45; median = 62; min‐max = 43‐98

n = 45; median = 54; min‐max = 34‐99

Recart 2003

BIS index during maintenance

Mean

n = 30; mean = 49; SD =13

n = 30; mean = 40; SD =11

BIS during emergence from anaesthesia

Mean

n = 30; mean = 88; SD =11

n = 30; mean = 88; SD =12

At the time of eye opening before removal of endotracheal tube

Song 1997

BIS index during operation

Mean

n = 15; mean = 60; SD = 4

n = 15; mean = 44; SD =11

BIS during operation

Mean

n = 15; mean = 62; SD =3

n = 15; mean = 42; SD = 8

White 2004

BIS index during maintenance

Mean

n = 20; mean = 57; SD =12

n = 20; mean = 41; SD .=10

Wong 2002

BIS index during operation

Mean

n = 29; mean = 51; SD = 4.9

n = 31; mean = 44.3; SD = 8.8

BIS index at discontinuation of anaesthesia

Mean

n = 29; mean = 68; SD =13

n = 31; mean = 64; SD = 13

Zohar 2006

BIS index during operation

Mean

n = 25, mean= 57; SD = 10

n = 25, mean = 59; SD =10

BIS index upon discontinuation of sevoflurane

Mean

n = 25, mean= 57; SD = 17

n = 25, mean = 58; SD = 18

BIS index upon removal of airway device

Mean

n = 25, mean = 78; SD = 13

n = 25, mean = 81; SD = 14

Figuras y tablas -
Table 2. BIS value during anaesthesia
Comparison 1. Bispectral index versus standard practice (risk of awareness in surgical patients with high risk of awareness)

Outcome or subgroup title

No. of studies

No. of participants

Statistical method

Effect size

1 awareness in surgical patients with high risk of recall awareness Show forest plot

4

4474

Peto Odds Ratio (Peto, Fixed, 95% CI)

0.33 [0.13, 0.84]

1.1 using clinical signs as a guide in standard practice

2

2493

Peto Odds Ratio (Peto, Fixed, 95% CI)

0.24 [0.08, 0.69]

1.2 using end‐tidal anaesthetic gas as a guide

2

1981

Peto Odds Ratio (Peto, Fixed, 95% CI)

1.01 [0.14, 7.16]

Figuras y tablas -
Comparison 1. Bispectral index versus standard practice (risk of awareness in surgical patients with high risk of awareness)
Comparison 2. Bispectral index versus clinical signs (recovery profiles)

Outcome or subgroup title

No. of studies

No. of participants

Statistical method

Effect size

1 Time to eyes opening (minutes) Show forest plot

18

2446

Mean Difference (IV, Random, 95% CI)

‐2.14 [‐2.99, ‐1.29]

1.1 propofol

6

498

Mean Difference (IV, Random, 95% CI)

‐4.36 [‐5.17, ‐3.56]

1.2 desflurane

4

322

Mean Difference (IV, Random, 95% CI)

‐0.51 [‐1.44, 0.42]

1.3 isoflurane

1

60

Mean Difference (IV, Random, 95% CI)

‐0.90 [‐2.32, 0.52]

1.4 sevoflurane

7

473

Mean Difference (IV, Random, 95% CI)

‐1.63 [‐2.85, ‐0.41]

1.5 propofol/volatile anaesthetics

1

1093

Mean Difference (IV, Random, 95% CI)

‐1.73 [‐1.00, ‐0.46]

2 Time to respond to verbal command (minutes) Show forest plot

12

777

Mean Difference (IV, Random, 95% CI)

‐2.73 [‐3.92, ‐1.54]

2.1 propofol

3

359

Mean Difference (IV, Random, 95% CI)

‐4.88 [‐7.57, ‐2.20]

2.2 desflurane

3

130

Mean Difference (IV, Random, 95% CI)

‐3.38 [‐4.68, ‐2.07]

2.3 isoflurane

2

90

Mean Difference (IV, Random, 95% CI)

‐3.86 [‐11.87, 4.15]

2.4 sevoflurane

4

198

Mean Difference (IV, Random, 95% CI)

‐1.30 [‐3.06, 0.46]

3 Time to extubation (minutes) Show forest plot

18

1488

Mean Difference (IV, Random, 95% CI)

‐2.87 [‐3.74, ‐1.99]

3.1 propofol

7

583

Mean Difference (IV, Random, 95% CI)

‐4.63 [‐5.44, ‐3.83]

3.2 desflurane

6

432

Mean Difference (IV, Random, 95% CI)

‐1.64 [‐2.97, ‐0.32]

3.3 isoflurane

0

0

Mean Difference (IV, Random, 95% CI)

0.0 [0.0, 0.0]

3.4 sevoflurane

8

473

Mean Difference (IV, Random, 95% CI)

‐2.58 [‐3.50, ‐1.67]

4 Time to orientation (minutes) Show forest plot

6

316

Mean Difference (IV, Fixed, 95% CI)

‐2.57 [‐3.30, ‐1.85]

4.1 propofol

1

20

Mean Difference (IV, Fixed, 95% CI)

‐2.19 [‐8.19, 3.81]

4.2 desflurane

2

70

Mean Difference (IV, Fixed, 95% CI)

‐2.60 [‐4.23, ‐0.97]

4.3 isoflurane

1

44

Mean Difference (IV, Fixed, 95% CI)

‐3.6 [‐5.92, ‐1.28]

4.4 sevoflurane

3

182

Mean Difference (IV, Fixed, 95% CI)

‐2.43 [‐3.30, ‐1.55]

5 PACU stay (minutes) Show forest plot

12

1940

Mean Difference (IV, Random, 95% CI)

‐7.63 [‐12.50, ‐2.76]

5.1 propofol

4

362

Mean Difference (IV, Random, 95% CI)

‐11.68 [‐23.73, 0.38]

5.2 desflurane

4

272

Mean Difference (IV, Random, 95% CI)

‐14.76 [‐29.61, 0.09]

5.3 isoflurane

1

60

Mean Difference (IV, Random, 95% CI)

‐14.00 [‐34.12, 6.12]

5.4 sevoflurane

3

123

Mean Difference (IV, Random, 95% CI)

‐3.22 [‐9.06, 2.63]

5.5 propofol/volatile anaesthetics

1

1123

Mean Difference (IV, Random, 95% CI)

‐3.41 [‐9.72, 2.90]

6 Time to home readiness (minutes) Show forest plot

6

329

Mean Difference (IV, Random, 95% CI)

‐7.01 [‐30.11, 16.09]

6.1 propofol

1

39

Mean Difference (IV, Random, 95% CI)

‐5.36 [‐33.01, 22.29]

6.2 isoflurane

0

0

Mean Difference (IV, Random, 95% CI)

0.0 [0.0, 0.0]

6.3 desflurane

2

70

Mean Difference (IV, Random, 95% CI)

‐30.93 [‐107.35, 45.48]

6.4 sevoflurane

4

220

Mean Difference (IV, Random, 95% CI)

8.93 [‐4.49, 22.35]

Figuras y tablas -
Comparison 2. Bispectral index versus clinical signs (recovery profiles)
Comparison 3. Bispectral index versus clinical signs (requirement of anaesthetics)

Outcome or subgroup title

No. of studies

No. of participants

Statistical method

Effect size

1 Normalized propofol infusion rate (mg/kg/hr) Show forest plot

10

662

Mean Difference (IV, Random, 95% CI)

‐1.44 [‐1.95, ‐0.93]

2 Volatile anaesthetic requirement, minimal alveolar concentration equivalents (MAC equivalents) Show forest plot

13

928

Mean Difference (IV, Random, 95% CI)

‐0.14 [‐0.22, ‐0.05]

2.1 desflurane

5

352

Mean Difference (IV, Random, 95% CI)

‐0.11 [‐0.25, 0.03]

2.2 isoflurane

1

60

Mean Difference (IV, Random, 95% CI)

‐0.12 [‐0.29, 0.05]

2.3 sevoflurane

8

516

Mean Difference (IV, Random, 95% CI)

‐0.16 [‐0.29, ‐0.04]

Figuras y tablas -
Comparison 3. Bispectral index versus clinical signs (requirement of anaesthetics)
Comparison 4. Bispectral index versus clinical signs (requirement of narcotics)

Outcome or subgroup title

No. of studies

No. of participants

Statistical method

Effect size

1 Total dose of fentanyl (microgramme) Show forest plot

6

276

Mean Difference (IV, Random, 95% CI)

18.02 [‐25.16, 61.20]

2 average normalized remifentanil infusion rates ( microgramme/kg/min) Show forest plot

2

222

Mean Difference (IV, Fixed, 95% CI)

‐0.01 [‐0.03, 0.01]

Figuras y tablas -
Comparison 4. Bispectral index versus clinical signs (requirement of narcotics)