Blood pressure‐lowering efficacy of loop diuretics for primary hypertension
Abstract
Background
Antihypertensive drugs from the thiazide diuretic drug class have been shown to reduce mortality and cardiovascular morbidity. Loop diuretics are indicated and used to treat hypertension, but a systematic review of their blood pressure‐lowering efficacy or effectiveness in terms of reducing cardiovascular mortality or morbidity from randomized controlled trial (RCT) evidence has not been conducted.
Objectives
To determine the dose‐related decrease in systolic or diastolic blood pressure, or both, as well as adverse events leading to participant withdrawal and adverse biochemical effects (serum potassium, uric acid, creatinine, glucose and lipids profile) due to loop diuretics versus placebo control in the treatment of people with primary hypertension.
Search methods
We searched the Cochrane Hypertension Group Specialised Register, the Cochrane Central Register of Controlled Trials (CENTRAL, 2014, Issue 9), MEDLINE, MEDLINE In‐Process, EMBASE, and ClinicalTrials.gov to 27 October 2014.
Selection criteria
We included double‐blind randomized placebo‐controlled trials of at least three weeks duration comparing loop diuretic with a placebo in people with primary hypertension defined as blood pressure greater than 140/90 mmHg at baseline.
Data collection and analysis
Two review authors independently assessed the risk of bias and extracted data. We used weighted mean difference and a fixed effects model to combine continuous outcome data. We analysed the drop outs due to adverse effects using relative risk ratio.
Main results
Nine trials evaluated the dose‐related blood pressure‐lowering efficacy of five drugs within the loop diuretics class (furosemide 40 mg to 60 mg, cicletanine 100 mg to 150 mg, piretanide 3 mg to 6 mg, indacrinone enantiomer ‐2.5 mg to ‐10.0/+80 mg, and etozolin 200 mg) in 460 people with baseline blood pressure of 162/103 mmHg for a mean duration of 8.8 weeks. The best estimate of systolic/diastolic blood pressure‐lowering efficacy of loop diuretics was ‐7.9 (‐10.4 to ‐5.4) mmHg/ ‐4.4 (‐5.9 to ‐2.8) mmHg. Withdrawals due to adverse effects and serum biochemical changes did not show a significant difference.
We performed additional searches in 2012 and 2014, which found no additional trials meeting the minimum inclusion criteria.
Authors' conclusions
Based on the limited number of published RCTs, the systolic/diastolic blood pressure‐lowering effect of loop diuretics is ‐8/‐4 mmHg, which is likely an overestimate. We graded the quality of evidence for both systolic and diastolic blood pressure estimates as "low" due to the high risk of bias of included studies and the high likelihood of publication bias. We found no clinically meaningful blood pressure‐lowering differences between different drugs within the loop diuretic class. The dose‐ranging effects of loop diuretics could not be evaluated. The review did not provide a good estimate of the incidence of harms associated with loop diuretics because of the short duration of the trials and the lack of reporting of adverse effects in many of the trials.
PICO
Plain language summary
Loop diuretics cause modest blood pressure lowering
While more commonly used to reduce water retention, loop diuretics are are also indicated for lowering elevated blood pressure. We asked to what degree this drug class lowers blood pressure, whether individual drugs within the class produce different effects, and what the estimate of harms is associated with this class of drugs. We searched the available scientific literature to find all the trials that had addressed these questions. We found 9 trials studying the blood pressure‐lowering ability of 5 different loop diuretics (furosemide, cicletanine, piretanide, indacrinone and etozolin) in 460 participants. The blood pressure‐lowering effect was modest, with systolic pressure lowered by 8 mmHg and diastolic pressure by 4 mmHg. No loop diuretic drug appears to be any better or worse than others in terms of blood pressure‐lowering ability. Due to lack of reporting and the short duration of included trials, this review could not provide an estimate of the harms associated with loop diuretics.
Authors' conclusions
Summary of findings
| Loop diuretics compared with placebo for primary hypertension | ||||
| Patient or population: People with primary hypertension Settings: Outpatient Intervention: Loop diuretics at various doses Comparison: Placebo control | ||||
| Outcomes | MD with (95% CI) | No. of Participants | Quality of the evidence | Comments |
| Decrease in SBP mmHg mean duration 8.8 weeks | ‐7.9(‐10.4 to ‐5.4) | 460 (9) | ⊕⊕⊝⊝ | Not significantly different from thiazides, angiotensin‐converting enzyme inhibitors, angiotensin receptor blockers, or renin inhibitors. |
| Decrease in DBP mmHg mean duration 8.8 weeks | ‐4.4(‐5.9 to ‐2.8) | 460 (9) | ⊕⊕⊝⊝ | Not significantly different from thiazides, angiotensin‐converting enzyme inhibitors, angiotensin receptor blockers, or renin inhibitors. |
| CI: confidence interval; MD: mean difference | ||||
| GRADE Working Group grades of evidence | ||||
| 1. Wide confidence intervals 2. High risk of bias including publication bias | ||||
Background
Loop diuretics are indicated as pharmacological agents for the treatment of hypertension. Of all known diuretics they are the most powerful, capable of causing the excretion of 15% to 25% of filtered sodium. Loop diuretics include furosemide (formerly frusemide), bumetanide, torsemide, piretanide, azosemide, ethacrynic acid, indacrinone, muzolimine, ozolinone, xipamide, and tienilic acid.
The first loop diuretics were mercurial agents, which are of historic interest only. In 1959 chemists synthesized furosemide, which was active orally and soon became the loop diuretic of choice. Additional loop diuretics have since been developed; the differences between them is in their pharmacokinetics.
Loop diuretics act from the lumen side of the nephron, hence urinary, rather than serum amounts, are the major determinants of response. Since they are extensively bound to serum protein albumin, they cannot enter the tubular lumen by glomerular filtration and reach this site by active secretion by the organic acid transport pump at the straight segment of the loop of Henle. These drugs are rapidly absorbed, with peak serum concentration attained within 0.5 to 2 hours. The onset of action of furosemide after oral dosing is slower than that of other loop diuretics because its absorption rate is slower than the rate of elimination (Seldin 1997).
The bioavailability of loop diuretics varies, with that of azosemide being 10%; bumetanide and torsemide 80% to 100%; and furosemide 40% to 60%, with a half‐life of 1 to 2 hours. Muzolimine, xipamide, and ozolinone (the active metabolite of etozolin) have longer half‐lives of 6 to 15 hours, and elimination is unchanged in people with renal insufficiency or congestive heart failure. The route of elimination varies. About half of intravenous furosemide is eliminated unchanged in the urine and most of the remainder is glucuronidated in the kidney itself. By contrast, nonrenal elimination of bumetanide and torsemide is in the liver.
Loop diuretics act primarily on the thick ascending limb of the loop of Henle, inhibiting the transport of sodium chloride out of the tubule into the interstitial tissue by inhibiting the Na+/K+/2Cl‐ cotransporter on the apical membrane. Furosemide and bumetanide have a direct inhibiting effect on the carrier, acting on the chloride binding site while ethacrynic acid forms a complex with cysteine, the complex being active form of the drug (Materson 1983). They lower blood pressure acutely because of their potent natriuretic effect and consequently fall in circulating blood volume. However, when used alone, loop diuretics may not have useful long‐term antihypertensive effect.
Another group of diuretics, the thiazides, inhibit Na+/Cl‐ reabsorption in the early part of distal tubule. Thiazide and thiazide‐related drugs include hydrochlorothiazide, bendroflumethiazide, chlorothiazide, methyclothiazide, trichlormethiazide, cyclothiazide, and chlorthalidone.
It is currently unknown whether the blood pressure‐lowering efficacy of either thiazide or loop diuretics is due solely to their diuretic effect. Diuretics were originally prescribed in starting doses that exceed the average prescribed dose that is used today.
Although the aim of antihypertensive drug therapy is to reduce systolic as well as diastolic blood pressure, the ultimate clinical goal is to lower the risk of cardiovascular‐related mortality and morbidity. A systematic review based on 19 RCTs in 39,713 participants has shown proven benefit in terms of reduced mortality (risk ratio (RR) 0.89, 95% confidence interval (CI) 0.83 to 0.96), stroke (RR 0.63, 95% CI 0.57 to 0.71), coronary heart disease (RR 0.84, 95% CI 0.75 to 0.95), and cardiovascular morbidity (RR 0.70, 95% CI 0.66 to 0.76). Low‐dose thiazides reduced coronary heart disease (RR 0.72, 95% CI 0.61 to 0.84), but high‐dose thiazides (11 RCTs) did not (RR 1.01, 95% CI 0.85 to 1.20) (Wright 2009). In the same systematic review, first‐line low‐dose thiazide decreased blood pressure by 13 mmHg (99% CI 12 to 14)/5 (99% CI 4 to 6) as compared to placebo or no treatment, and first‐line high‐dose thiazide decreased blood pressure by 14 mmHg (99% CI 13 to 15)/7 (99% CI 6 to 8) (Wright 2009).
No systematic review of loop diuretics has been identified that measured either their blood pressure‐lowering efficacy or effectiveness in lowering cardiovascular mortality or morbidity in the treatment of primary hypertension. It is also important to establish whether loop diuretics lower blood pressure to the same degree as thiazide diuretics and other classes of antihypertensive drugs, and to know the blood pressure‐lowering dose response relationship to other effects of loop diuretics, such as the adverse metabolic effects. Individual drugs within the diuretic drug class might have differing dose‐related blood pressure‐lowering efficacy and adverse effects.
The aims of this systematic review were to:
-
determine the lowest dose with the maximum blood pressure‐lowering efficacy for each drug within the loop diuretic class.
-
establish dose equivalencies of different drugs within the loop diuretic family.
The information derived from this review should facilitate future reviews of head‐to‐head comparisons with other drug classes and assist clinicians in determining when to choose a loop diuretic and what dose to use.
Objectives
Primary objective
To determine the dose‐related decrease in systolic or diastolic blood pressure, or both, due to loop diuretics versus placebo control in the treatment of people with primary hypertension.
Secondary objectives
To determine the dose‐related adverse events leading to participant withdrawal and adverse biochemical effects including serum potassium, uric acid, creatinine, glucose, and lipids profile.
Methods
Criteria for considering studies for this review
Types of studies
Study design had to meet the following criteria: double‐blind placebo‐controlled trials; random allocation to loop diuretic group and parallel placebo group; duration of follow‐up of at least 3 weeks; blood pressure measurement at baseline (following washout) and at 1 or more time points between 3 to 12 weeks after starting treatment.
Types of participants
Participants had to have a baseline systolic blood pressure (SBP) of at least 140 mmHg and/or diastolic blood pressure (DBP) of at least 90 mmHg, measured in a standard way. We excluded from the analysis people with significant renal insufficiency and a documented serum creatinine level greater than 1.5 times the normal values. We did not restrict participants by age, gender, baseline risk, or any other comorbid conditions.
Types of interventions
Monotherapy with any loop diuretic, including: furosemide, bumetanide, piretanide, torsemide, azosemide, ethacrynic acid, tripamide, phenoxybenzoic acid, muzolimine, indacrinone, etozolin, ozolinone, cicletanine, tienilic acid (ticrynafen), and tizolemide.
Data from trials in which titration to a higher dose was based on blood pressure response were not eligible. Stepped‐up therapy given only to nonresponders would bias the results and therefore was not included in the analysis. Potassium supplementation was allowed in people with low serum potassium levels.
Types of outcome measures
Primary outcomes
Change in systolic and diastolic blood pressure compared to placebo. If blood pressure measurements were available at more than one time during the 24‐hour period, we used the trough measurement. Peak level was defined as blood pressure measurement within 12 hours of the dose, and trough level was defined as blood pressure measurements between 12 and 24 hours. If blood pressure measurements were available at more than 1 week within the 3‐ to 12‐week window, the weighted means of blood pressure measurement was calculated and used as the best estimate of the treatment effect.
Secondary outcomes
-
The number of participant withdrawals due to adverse events compared to placebo.
-
Change in the levels of serum potassium, uric acid, creatinine, glucose, and lipids compared to placebo. If measurements were available at more than one time within the acceptable window, then the weighted mean data was calculated and used as the best estimate of the treatment effect.
Search methods for identification of studies
We searched the following databases for primary studies: the Cochrane Hypertension Group Specialised Register (all years to 27 October 2014), the Cochrane Central Register of Controlled Trials (CENTRAL, 2014, Issue 9) via the Cochrane Register of Studies Online, Ovid MEDLINE (1946 to 27 October 2014), Ovid EMBASE (1974 to 27 October 2014), and ClinicalTrials.gov (all years to 27 October 2014). We searched the Database of Abstracts of Reviews of Effects (DARE, 2014 Issue 9) for related reviews.
The Cochrane Hypertension Group Specialised Register includes controlled trials from searches of AGRICOLA, Allied and Complementary Medicine (AMED), BIOSIS, CAB Abstracts, CINAHL, Cochrane Central Register of Controlled Trials (CENTRAL), EMBASE, Food Science and Technology Abstracts (FSTA), Global Health, International Pharmaceutical Abstracts (IPA), LILACS, MEDLINE, ProQuest Dissertations & Theses Database, PsycINFO, Scirus, Web of Science, and the World Health Organization International Clinical Trials Registry Platform (ICTRP).
We searched electronic databases using a strategy combining the Cochrane Highly Sensitive Search Strategy for identifying randomized trials in MEDLINE: sensitivity‐maximizing version (2008 revision) with selected MeSH terms and free text terms relating to loop diuretics and hypertension. We used no language restrictions. We translated the MEDLINE search strategy (Appendix 1) into EMBASE (Appendix 2), CENTRAL (Appendix 3), and the Cochrane Hypertension Group Specialised Register (Appendix 4) using the appropriate controlled vocabulary as applicable. Previous search strategies are in Appendix 5.
Searching other resources
-
We identified reference lists of all papers and relevant reviews.
-
We contacted authors of trials reporting incomplete information for the missing information.
Data collection and analysis
Selection of studies
Two review authors (VM, CJ) independently screened the titles and abstracts identified as a result of the search strategies prior to January 2009. Two review authors (VM, PR) independently screened the titles and the abstracts identified as a result of the search strategies from January 2009 to February 2012. Two review authors (PR, CJ) independently screened the titles and the abstracts identified as a result of the search strategies from February 2012 to October 2014. We rejected articles on initial screen if we were able to determine from the title or the abstract that the article was not a report of a randomized placebo‐controlled trial or did not meet the inclusion criteria. We then retrieved the full text of the remaining articles. We searched the bibliographies of pertinent articles, reviews, and texts for additional citations. Two review authors independently assessed the eligibility of the trials using a trial selection form. Any discrepancies were resolved by JMW and KB.
Data extraction and management
Two review authors (VM, CJ) abstracted data independently using a standard form and then cross‐checked. If data were presented numerically (in tables or text) and graphically (in figures), the numeric data were preferred because of possible measurement error when estimating from graphs. A second review author confirmed all numeric calculations and extractions from graphs or figures. We resolved any discrepancies by consensus.
Assessment of risk of bias in included studies
Two review authors (VM, CJ) checked the methodological quality of the included studies according to The Cochrane Collaboration's recommended tool. We based the risk of bias within each included study on the six domains: sequence generation, allocation concealment, blinding, incomplete outcome data, and selective outcome reporting, with ratings of Yes (low risk of bias); No (high risk of bias); and Unclear (uncertain risk of bias). Refer to the ‘Risk of bias’ table for each study. Also see Figure 1 and Figure 2 for a graphical representation of our assessment of the risk of bias in the included studies.
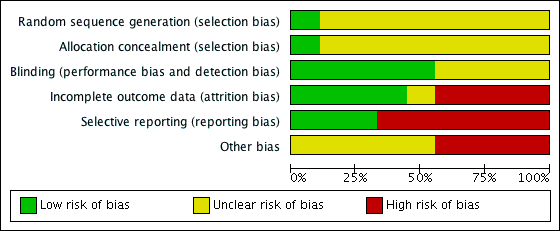
Methodological quality graph: review authors' judgements about each methodological quality item presented as percentages across all included studies.

Methodological quality summary: review authors' judgements about each methodological quality item for each included study.
Measures of treatment effect
The position of the patient during blood pressure measurement can affect the blood pressure‐lowering effect. However, so as not to lose valuable data if only one position was reported, we included data from that position. When blood pressure measurement data in more than one position was available, sitting blood pressure was the first preference. If standing and supine blood pressure measurements were available, we used standing blood pressure.
Unit of analysis issues
Each trial is a unit in the systematic review analysis. For each trial, the placebo control group or the loop diuretic therapy group were compared to each other only within that trial and not with participants in any other trial.
Dealing with missing data
In case of missing information in the included studies, we contacted investigators through email, letter, and/or fax to obtain the missing information. Where missing information was not available, we included the best estimate based on information in the same trial or from other trials using the same dose.
In case of missing standard deviation (SD) of the change in blood pressure, we imputed the SD based on information in the same trial or from other trials using the same dose. We used the following hierarchy (listed from high to low preference) to impute SD values:
-
SD of change in blood pressure from a different position than that of the blood pressure data used
-
SD of blood pressure at the end of treatment
-
SD of blood pressure at the end of treatment measured from a different position than that of the blood pressure data used
-
SD of blood pressure at baseline, unless this measure was used for entry criteria (Musini 2009)
-
mean SD of change in blood pressure from other trials using the same drug and dose
-
mean weighted SD of change available from all other trials meeting the inclusion criteria
Most trials reported end‐of‐treatment SD, which we imputed as SD of change from baseline for SBP as well as DBP. For the two piretanide trials (Homuth 1993, Verho 1986), since the end‐of‐treatment SD was not reported, the baseline SD of the SBP or DBP could be used if it was not the entry criteria for inclusion in the study. Homuth 1993 did not report the criteria for inclusion (states as hypertensive patients), and Verho 1986 included patients based on DBP but did not report the baseline SD values for both SBP and DBP. We therefore calculated the mean weighted SD at the end of treatment across all trials and imputed it as SD of change. It was calculated as 13.7 mmHg for SBP in the treatment group and 15.9 mmHg for the placebo group, and 8.3 mmHg for DBP in the treatment group and 8.8 mmHg for the placebo group.
Data synthesis
We processed data in accordance with the Cochrane Handbook for Systematic Reviews of Interventions (2011 edition). We used Review Manager 5.3 (RevMan 2014) software to perform data synthesis and analyses. We expressed data for changes in blood pressure as well as serum levels of potassium, uric acid, creatinine, glucose, and lipids profile as the mean (±SD) change from baseline to follow‐up and combined using a mean difference method. We expressed withdrawals due to adverse effects (dichotomous outcome) for each comparison as risk ratios (RR) with 95% confidence intervals (CI). If there was a statistically significant RR difference, we also calculated the associated number needed to treat for an additional beneficial outcome/harmful outcome.
Subgroup analysis and investigation of heterogeneity
We planned subgroup analyses according to age, gender, race, comorbid conditions, and baseline severity of hypertension (mild, moderate, or severe), but these were not possible due to insufficient data.
We performed test for heterogeneity of treatment effect between the trials using a standard Chi2 statistic for heterogeneity as mentioned in RevMan (RevMan 2014). We applied the fixed‐effect model to obtain summary statistics of pooled trials, unless significant between‐study heterogeneity was present, in which case we used the random‐effects model.
We used the funnel plot to examine publication bias.
Sensitivity analysis
We were to test the robustness of the results using several sensitivity analyses including:
-
trials of high quality versus poor quality
-
fixed‐effect versus random‐effects model
-
trials with blood pressure data measured in sitting position versus other measurements
-
trials with peak blood pressure measurements versus trials with trough blood pressure measurements
-
trials with published SDs of blood pressure change versus imputed SDs
-
trials that are industry sponsored versus non‐industry sponsored
However, due to lack of sufficient data it was not possible to perform any sensitivity analyses.
Results
Description of studies
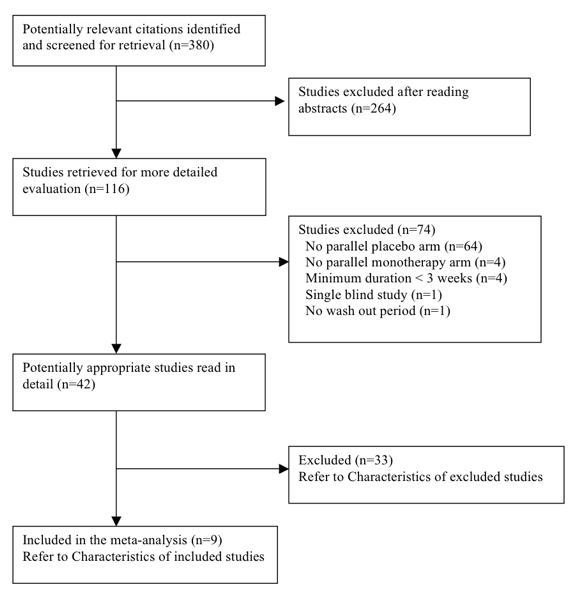
The original search (Appendix 5) led to 380 citations, of which 264 (69.5%) were excluded after reading the abstract because they did not meet the minimum inclusion criteria. Of the remaining 116 citations, 74 (25.6%) were excluded after retrieving the trials and reading the detailed methodology. We considered 42 (11.0%) potentially appropriate studies for inclusion, of which 33 studies had to be excluded for various documented reasons (see Characteristics of excluded studies).
We ran the search again with an updated search strategy from January 2009 to February 2012 (Appendix 5). This led to 400 additional citations, of which no new studies met the minimum inclusion criteria.
We ran the search a third time with an updated search strategy on 27 October 2014 (Appendix 1; Appendix 2; Appendix 3; Appendix 4), which led to 721 additional citations. After removal of duplicates, we were left with 364 additional citations. 360 citations were not relevant to this review. The remaining four did not meet the minimum inclusion criteria for this review and were excluded.
Nine double‐blind RCTs out of the 1144 citations (0.8%) met the minimum inclusion criteria. These trials included 460 participants with mean age of 54.4 years (see Characteristics of included studies).
A complete account of the studies identified is presented in the study flow diagrams (Figure 3, Figure 4, Figure 5).

QUOROM Diagram ‐ Search: until January 2009

Updated PRISMA diagram ‐ Search updated from Jan 2009 to February 2012

Updated PRISMA diagram ‐ Search updated on 27 October 2014
Placebo control was compared to cicletanine 100 mg in one trial (Gotzen 1994) and 150 mg in one trial (Bodak 1989); to furosemide 40 mg in two trials (Perola 1985, Wertheimer 1973) and to furosemide 60 mg in one trial (Vadasz 1982); to piretanide 3 mg in one trial (Homuth 1993) and to piretanide 6 mg in two trials (Homuth 1993, Verho 1986); to indacrinone at doses of ‐2.5/+80 mg, ‐5.0/+80 mg, or ‐10/+80 mg in one trial (Jain 1984); and to etozolin 200 mg in one trial (Licata 1989).
Refer to Characteristics of included studies for details on baseline characteristics.
The earliest study evaluating the antihypertensive efficacy of loop diuretic monotherapy using office blood pressure measurements was published in 1973. The other eight studies were published during the 1980s and early 1990s. Since 1994 no further studies have been published. Of the nine included studies, seven were published in English, one in German (Gotzen 1994), and one in French (Bodak 1989). One of the included studies was industry sponsored (Jain 1984); the remaining eight studies did not report the source of funding.
Since the number of trials meeting the inclusion criteria was very limited, to maximize data inclusion we included data in the Bodak 1989 trial at the end of 6 months, although the publication did not report data between 3 and 12 weeks. All other trials ranged from 4 to 12 weeks duration. The mean weighted duration of treatment across all trials was 8.8 weeks. Including or excluding this trial from the analysis showed no significant difference in SBP or DBP MD. The mean weighted baseline SBP/DBP across all nine trials was 162.3/103.4 mmHg.
Risk of bias in included studies
Refer to Figure 1 and Figure 2 for the overall 'Risk of bias' assessment.
Only Wertheimer 1973 and Gotzen 1994reported random sequence generation and allocation concealment, respectively. Five of the nine trials (55% of included studies) reported blinding adequately. Four of the nine trials (44%) reported incomplete outcome data. Only two of the nine trials (22%) reported all outcome data. Four of the nine trials (44%) had high risk of other bias, and in the remaining five trials it was unclear if other risk was present. In summary, the effect size reported in this review could be an overestimate due to the potential for high risk of bias.
Another source of bias likely to have a significant impact on this review is the selective publication of trials. Since it only included and appraised published trial evidence, this review was evaluated for the existence of publication bias. In the absence of bias, the funnel plot should resemble a symmetrical inverted funnel. The most common way to investigate whether or not a review is subject to publication bias is to examine for funnel plot asymmetry, as smaller studies with null results remained unpublished. Refer to Figure 6 and Figure 7, which show that publication bias was detected.

Funnel plot of comparison: 1 Loop diuretics vs placebo, outcome: 1.1 SBP.

Funnel plot of comparison: 1 Loop diuretics vs placebo, outcome: 1.2 DBP.
Effects of interventions
See: Summary of findings for the main comparison
Systolic blood pressure
-
Furosemide 40 mg did not show a significant reduction in SBP (mean difference (MD) ‐5.80, 95% CI ‐13.0 to 1.4) mmHg. Furosemide 60 mg showed a significant reduction in SBP (MD ‐10.0, 95% CI ‐15.8 to ‐4.2), see Analysis 1.1. Combined doses of furosemide 40 mg and 60 mg showed a significant reduction in SBP (MD ‐8.4, 95% CI ‐12.8 to ‐3.9) mmHg.
-
Cicletanine 100 mg did not show a significant reduction in SBP (MD ‐7.00, 95% CI ‐16.2 to 2.2). Cicletanine 150 mg showed a significant reduction in SBP (MD ‐9.1, 95% CI ‐15.5 to ‐2.7) mmHg, see Analysis 1.1. Combined doses of cicletanine 100 mg and 150 mg showed a significant reduction of SBP (MD ‐8.4, 95% CI ‐13.7 to ‐3.1) mmHg.
-
Piretanide 3 mg as well as 6 mg did not show a significant reduction in SBP (MD ‐2.2, 95% CI ‐10.0 to 5.6) mmHg and (MD ‐4.7, 95% CI ‐10.0 to 0.7) mmHg, see Analysis 1.1. Combined doses of piretanide 3 mg and 6 mg did not achieve statistical significance (MD ‐3.9, 95% CI ‐8.3 to 0.6) mmHg.
-
Indacrinone enantiomers ‐2.5/+80 mg and ‐5.0/+80 mg did not show a significant reduction in SBP (MD ‐14.9, 95% CI ‐31.2 to 1.4) mmHg and (MD ‐11.7, 95% CI ‐25.4 to 2.0) mmHg, respectively. Indacrinone ‐10.0/+80 mg showed a significant reduction in SBP (MD ‐19.1, 95% CI ‐36.0 to ‐2.3) mmHg, see Analysis 1.1. Combined doses of the indacrinone enantiomers showed significant reduction in SBP (MD ‐14.7, 95% CI ‐23.1 to 5.8) mmHg.
-
Etozolin 200 mg reduced SBP (MD ‐14.3, 95% CI ‐23.1 to ‐5.6) mmHg, see Analysis 1.1.
The 95% CI of SBP reduction across all individual drugs within the loop diuretics class as well as doses were wide and overlapped with each other. The heterogeneity was not significant P = 0.51 and I2 = 0%; test for subgroup differences was not significant P = 0.41 and I2 = 2.7%.
The best estimate of SBP‐lowering efficacy of all nine trials comparing loop diuretics to placebo control is (MD ‐7.9, 95% CI ‐10.4 to ‐5.4) mmHg for a mean duration of 8.8 weeks, see Analysis 1.1.
Diastolic blood pressure
-
Furosemide 40 mg as well as 60 mg did not show a significant reduction in DBP (MD ‐3.5, 95% CI ‐7.3 to 0.2) mmHg and (MD ‐3.0, 95% CI ‐7.3 to 1.3) mmHg, respectively, see Analysis 1.2. Combined doses of 40 mg and 60 mg showed a significant decrease in DBP (MD ‐3.3, 95% CI ‐6.1 to ‐0.5) mmHg.
-
Cicletanine 100 mg did not show a significant reduction in DBP (MD ‐3.3, 95% CI ‐9.5 to 2.9) mmHg. Cicletanine 150 mg showed a significant reduction in DBP (MD ‐11.3, 95% CI ‐15.3 to ‐7.3) mmHg, see Analysis 1.2. Combined doses of cicletanine 100 mg and 150 mg showed a significant reduction in DBP (MD ‐8.9, 95% CI ‐12.3 to ‐5.6) mmHg.
-
Piretanide 3 mg as well as 6 mg did not show a significant reduction in DBP (MD ‐0.8, 95% CI ‐5.4 to 3.8) mmHg and (MD ‐2.3, 95% CI ‐5.5 to 0.8) mmHg, see Analysis 1.2. Combined doses of piretanide 3 mg and 6 mg did not achieve statistical significance (MD ‐1.8, 95% CI ‐45.5 to 0.8) mmHg.
-
Indacrinone enantiomers ‐2.5/+80 mg, ‐5.0/+80 mg, and ‐10.0/+80 mg did not show a significant reduction in DBP (MD ‐7.1, 95% CI ‐15.2 to 0.9) mmHg, (MD ‐3.4, 95% CI ‐11.6 to 4.8) mmHg and (MD ‐3.4, 95% CI ‐11.6 to 4.8) mmHg, respectively, see Analysis 1.2. Combined doses of the indacrinone enantiomers also did not show a significant reduction in DBP (MD ‐4.6, 95% CI ‐9.3 to 0.01) mmHg.
-
Etozolin 200 mg showed a significant reduction in DBP (MD ‐7.3, 95% CI ‐13.2 to ‐1.4) mmHg, see Analysis 1.2.
The 95% CI of DBP reduction across all individual drugs within the loop diuretics class were significant for cicletanine 150 mg and etozolin 200 mg. The heterogeneity was significant P = 0.07 and I2 = 41%; test for subgroup differences was significant P = 0.04 and I2 = 48.9%. However, excluding the cicletanine 150 mg DBP lowering effect in the Bodak 1989 trial from the overall estimate, both the heterogeneity and subgroup differences became nonsignificant with I2 = 0%. Refer to Figure 7 showing that the Bodak 1989 trial is an outlier with the DBP effect size outside the 95% CI of the overall effect size.
The best estimate of DBP‐lowering efficacy of all nine trials comparing loop diuretics to placebo control is (MD ‐4.4, 95% CI ‐5.9 to ‐2.8) mmHg for a mean duration of 8.8 weeks, see Analysis 1.2. Excluding the Bodak 1989 trial, the estimate of DBP lowering is decreased to (MD ‐3.2, 95% CI ‐4.8 to ‐1.6) mmHg.
Withdrawals due to adverse effects
Withdrawals due to adverse effects were reported in 6 of the 9 trials in 331 participants and were not statistically significant; risk ratio with 95% CI using fixed‐effect model was 1.9 (0.3 to 10.8), see Analysis 1.3.
Biochemical changes
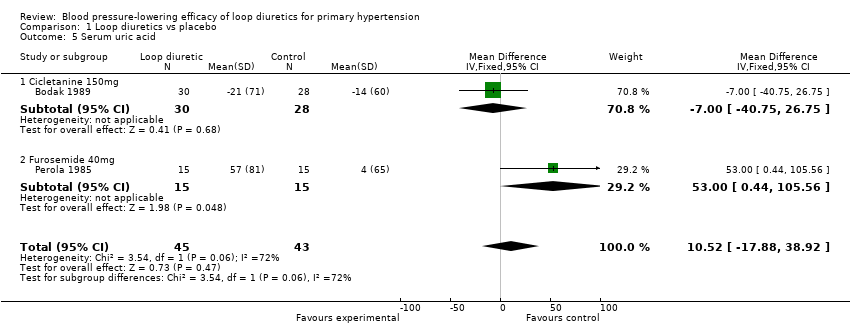
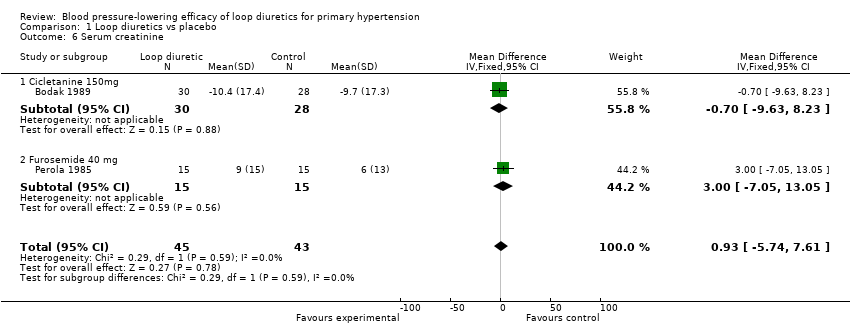
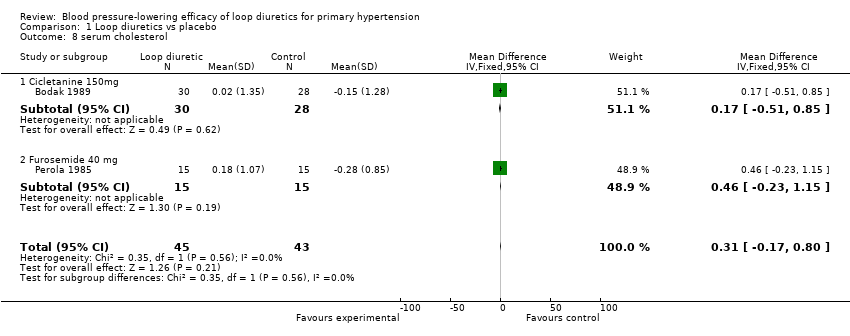
Two of the nine trials reported data for changes in serum levels of potassium, uric acid, creatinine, blood glucose, serum cholesterol, and triglycerides as compared to placebo control (Bodak 1989, Perola 1985). Based on available data in 88 participants for a mean duration of 20 weeks, there was no statistically significant difference in any parameter, see Analysis 1.4, Analysis 1.5, Analysis 1.6, Analysis 1.7, Analysis 1.8 and Analysis 1.9.
Discussion
We found the paucity of data available in the public domain to evaluate the dose ranging effects of loop diuretics in the treatment of primary hypertension shocking and surprising, and suspect that there are trials meeting our inclusion criteria that have not been published. We hoped in 2009 that as a result of the publication of this systematic review trialists would contact us to provide us with more data. However, this has not happened. We continued to hope for this following the publication of this systematic review's 2012 update, but no additional data has been made available to date. The results of this systematic review emphasize the need for all studies, regardless of the findings, to be published and accessible for secondary analysis.
Only 9 trials with a mean duration of 8.8 weeks at a fixed dose of loop diuretics met the pre‐specified inclusion criteria. These trials reported data on 460 participants (242 treated with loop diuretics and 198 with placebo) with a weighted mean age of 54.4 years and a weighted mean baseline blood pressure of 162/103 mmHg. The best estimate at this time of the overall SBP‐ and DBP‐lowering efficacy of this drug class is 8/4 mmHg as compared to placebo control, based on double‐blind RCTs. However, we have graded this result as low‐quality evidence based on too few participants, high risk of bias of included studies, presence of publication bias, and the wide 95% confidence intervals, ranging from 5 mmHg to 11 mmHg systolic (summary of findings Table for the main comparison). Considering the currently available data, the effect is not significantly different from thiazides, angiotensin‐converting enzyme inhibitors, angiotensin receptor blockers, or renin inhibitors. (Chen 2009, Heran 2008a, Heran 2008b, Musini 2008).
Due to the limited number of published studies, there is insufficient evidence for the various loop diuretics to generate dose‐response curves for systolic and diastolic blood pressure reduction. At any given dose of loop diuretics, there were only one or two studies contributing blood pressure data.
Given the limited data available, it is impossible with this analysis to be certain of any blood pressure‐lowering differences between one or more of the drugs. To assess whether or not there are differences between different drugs and evaluate the dose equivalence between drugs within the loop diuretic class would require head‐to‐head trials of different loop diuretics. However, at the present time, given that all the drugs within the loop diuretic class work by the same mechanism of action and the overlapping of the 95% CI in the blood pressure‐lowering effect, it is most likely that the blood pressure‐lowering effect of the different loop diuretics at equivalent doses is the same.

Methodological quality graph: review authors' judgements about each methodological quality item presented as percentages across all included studies.

Methodological quality summary: review authors' judgements about each methodological quality item for each included study.
QUOROM Diagram ‐ Search: until January 2009

Updated PRISMA diagram ‐ Search updated from Jan 2009 to February 2012

Updated PRISMA diagram ‐ Search updated on 27 October 2014

Funnel plot of comparison: 1 Loop diuretics vs placebo, outcome: 1.1 SBP.

Funnel plot of comparison: 1 Loop diuretics vs placebo, outcome: 1.2 DBP.

Comparison 1 Loop diuretics vs placebo, Outcome 1 SBP.

Comparison 1 Loop diuretics vs placebo, Outcome 2 DBP.

Comparison 1 Loop diuretics vs placebo, Outcome 3 Withdrawals due to adverse events.

Comparison 1 Loop diuretics vs placebo, Outcome 4 Serum potassium.
Comparison 1 Loop diuretics vs placebo, Outcome 5 Serum uric acid.
Comparison 1 Loop diuretics vs placebo, Outcome 6 Serum creatinine.

Comparison 1 Loop diuretics vs placebo, Outcome 7 Blood glucose.
Comparison 1 Loop diuretics vs placebo, Outcome 8 serum cholesterol.

Comparison 1 Loop diuretics vs placebo, Outcome 9 Serum triglyceride.
| Loop diuretics compared with placebo for primary hypertension | ||||
| Patient or population: People with primary hypertension Settings: Outpatient Intervention: Loop diuretics at various doses Comparison: Placebo control | ||||
| Outcomes | MD with (95% CI) | No. of Participants | Quality of the evidence | Comments |
| Decrease in SBP mmHg mean duration 8.8 weeks | ‐7.9(‐10.4 to ‐5.4) | 460 (9) | ⊕⊕⊝⊝ | Not significantly different from thiazides, angiotensin‐converting enzyme inhibitors, angiotensin receptor blockers, or renin inhibitors. |
| Decrease in DBP mmHg mean duration 8.8 weeks | ‐4.4(‐5.9 to ‐2.8) | 460 (9) | ⊕⊕⊝⊝ | Not significantly different from thiazides, angiotensin‐converting enzyme inhibitors, angiotensin receptor blockers, or renin inhibitors. |
| CI: confidence interval; MD: mean difference | ||||
| GRADE Working Group grades of evidence | ||||
| 1. Wide confidence intervals 2. High risk of bias including publication bias | ||||
| Outcome or subgroup title | No. of studies | No. of participants | Statistical method | Effect size |
| 1 SBP Show forest plot | 9 | 460 | Mean Difference (IV, Fixed, 95% CI) | ‐7.92 [‐10.40, ‐5.44] |
| 1.1 Furosemide 40mg versus placebo | 2 | 90 | Mean Difference (IV, Fixed, 95% CI) | ‐5.80 [‐12.96, 1.36] |
| 1.2 Furosemide 60mg versus placebo | 1 | 26 | Mean Difference (IV, Fixed, 95% CI) | ‐10.0 [‐15.77, ‐4.23] |
| 1.3 Cicletanine 100mg versus placebo | 1 | 39 | Mean Difference (IV, Fixed, 95% CI) | ‐7.0 [‐16.18, 2.18] |
| 1.4 Cicletanine 150mg versus placebo | 1 | 60 | Mean Difference (IV, Fixed, 95% CI) | ‐9.10 [‐15.54, ‐2.66] |
| 1.5 Piretanide 3mg versus placebo | 1 | 60 | Mean Difference (IV, Fixed, 95% CI) | ‐2.2 [‐9.97, 5.57] |
| 1.6 Piretanide 6mg versus placebo | 2 | 120 | Mean Difference (IV, Fixed, 95% CI) | ‐4.65 [‐10.01, 0.71] |
| 1.7 Indacrinone enantiomer ‐2.5 /+ 80mg versus placebo | 1 | 12 | Mean Difference (IV, Fixed, 95% CI) | ‐14.90 [‐31.15, 1.35] |
| 1.8 Indacrinone ‐5.0 /+ 80mg versus placebo | 1 | 12 | Mean Difference (IV, Fixed, 95% CI) | ‐11.70 [‐25.37, 1.97] |
| 1.9 Indacrinone ‐10.0 /+ 80 mg versus placebo | 1 | 13 | Mean Difference (IV, Fixed, 95% CI) | ‐19.1 [‐35.95, ‐2.25] |
| 1.10 Etozolin 200mg versus placebo | 1 | 28 | Mean Difference (IV, Fixed, 95% CI) | ‐14.30 [‐23.05, ‐5.55] |
| 2 DBP Show forest plot | 9 | 460 | Mean Difference (IV, Fixed, 95% CI) | ‐4.36 [‐5.87, ‐2.84] |
| 2.1 Furosemide 40mg versus placebo | 2 | 90 | Mean Difference (IV, Fixed, 95% CI) | ‐3.53 [‐7.28, 0.23] |
| 2.2 Furosemide 60mg versus placebo | 1 | 26 | Mean Difference (IV, Fixed, 95% CI) | ‐3.00 [‐7.26, 1.26] |
| 2.3 Cicletanine 100mg versus placebo | 1 | 39 | Mean Difference (IV, Fixed, 95% CI) | ‐3.30 [‐9.48, 2.88] |
| 2.4 Cicletanine 150mg versus placebo | 1 | 60 | Mean Difference (IV, Fixed, 95% CI) | ‐11.3 [‐15.30, ‐7.30] |
| 2.5 Piretanide 3mg versus placebo | 1 | 60 | Mean Difference (IV, Fixed, 95% CI) | ‐0.80 [‐5.44, 3.84] |
| 2.6 Piretanide 6mg versus placebo | 2 | 120 | Mean Difference (IV, Fixed, 95% CI) | ‐2.32 [‐5.48, 0.84] |
| 2.7 Indacrinone enantiomer ‐2.5 /+ 80mg versus placebo | 1 | 12 | Mean Difference (IV, Fixed, 95% CI) | ‐7.1 [‐15.16, 0.96] |
| 2.8 Indacrinone ‐5.0 /+ 80mg versus placebo | 1 | 12 | Mean Difference (IV, Fixed, 95% CI) | ‐3.40 [‐11.24, 4.44] |
| 2.9 Indacrinone ‐10.0 /+ 80 mg versus placebo | 1 | 13 | Mean Difference (IV, Fixed, 95% CI) | ‐3.40 [‐11.61, 4.81] |
| 2.10 Etozolin 200mg versus placebo | 1 | 28 | Mean Difference (IV, Fixed, 95% CI) | ‐7.30 [‐13.22, ‐1.38] |
| 3 Withdrawals due to adverse events Show forest plot | 6 | 331 | Risk Ratio (M‐H, Fixed, 95% CI) | 1.93 [0.34, 10.81] |
| 4 Serum potassium Show forest plot | 2 | 88 | Mean Difference (IV, Fixed, 95% CI) | ‐0.12 [‐0.36, 0.12] |
| 4.1 Cicletanine 150mg | 1 | 58 | Mean Difference (IV, Fixed, 95% CI) | ‐0.12 [‐0.36, 0.12] |
| 4.2 Furosemide 40mg | 1 | 30 | Mean Difference (IV, Fixed, 95% CI) | 0.0 [0.0, 0.0] |
| 5 Serum uric acid Show forest plot | 2 | 88 | Mean Difference (IV, Fixed, 95% CI) | 10.52 [‐17.88, 38.92] |
| 5.1 Cicletanine 150mg | 1 | 58 | Mean Difference (IV, Fixed, 95% CI) | ‐7.0 [‐40.75, 26.75] |
| 5.2 Furosemide 40mg | 1 | 30 | Mean Difference (IV, Fixed, 95% CI) | 53.00 [0.44, 105.56] |
| 6 Serum creatinine Show forest plot | 2 | 88 | Mean Difference (IV, Fixed, 95% CI) | 0.93 [‐5.74, 7.61] |
| 6.1 Cicletanine 150mg | 1 | 58 | Mean Difference (IV, Fixed, 95% CI) | ‐0.70 [‐9.63, 8.23] |
| 6.2 Furosemide 40 mg | 1 | 30 | Mean Difference (IV, Fixed, 95% CI) | 3.0 [‐7.05, 13.05] |
| 7 Blood glucose Show forest plot | 2 | 88 | Mean Difference (IV, Fixed, 95% CI) | 0.06 [‐0.19, 0.31] |
| 7.1 Cicletanine 150mg | 1 | 58 | Mean Difference (IV, Fixed, 95% CI) | ‐0.01 [‐0.40, 0.38] |
| 7.2 Furosemide 40mg | 1 | 30 | Mean Difference (IV, Fixed, 95% CI) | 0.1 [‐0.22, 0.42] |
| 8 serum cholesterol Show forest plot | 2 | 88 | Mean Difference (IV, Fixed, 95% CI) | 0.31 [‐0.17, 0.80] |
| 8.1 Cicletanine 150mg | 1 | 58 | Mean Difference (IV, Fixed, 95% CI) | 0.17 [‐0.51, 0.85] |
| 8.2 Furosemide 40 mg | 1 | 30 | Mean Difference (IV, Fixed, 95% CI) | 0.46 [‐0.23, 1.15] |
| 9 Serum triglyceride Show forest plot | 2 | 88 | Mean Difference (IV, Fixed, 95% CI) | ‐0.02 [‐0.35, 0.31] |
| 9.1 Cicletanine 150mg | 1 | 58 | Mean Difference (IV, Fixed, 95% CI) | ‐0.16 [‐0.54, 0.22] |
| 9.2 Furosemide 40 mg | 1 | 30 | Mean Difference (IV, Fixed, 95% CI) | 0.36 [‐0.27, 0.99] |