Blood pressure‐lowering efficacy of loop diuretics for primary hypertension
Information
- DOI:
- https://doi.org/10.1002/14651858.CD003825.pub4Copy DOI

- Database:
-
- Cochrane Database of Systematic Reviews
- Version published:
-
- 22 May 2015see what's new
- Type:
-
- Intervention
- Stage:
-
- Review
- Cochrane Editorial Group:
-
Cochrane Hypertension Group
- Copyright:
-
- Copyright © 2015 The Cochrane Collaboration. Published by John Wiley & Sons, Ltd.
Article metrics
Altmetric:
Cited by:
Authors
Contributions of authors
James Wright and Vijaya Musini formulated the idea for the review and developed the basis for the protocol.
Vijaya Musini designed the search strategy, undertook the initial and updated search, screened search results, collected data for the review, screened retrieved papers against eligibility criteria, appraised the risk of bias of papers, extracted data from papers, entered data into RevMan, analyzed and interpreted data, and wrote the review. Vijaya Musini also conducted the second search update until 17 December 2013 and screened all new titles and abstracts to determine if they met the minimum inclusion criteria.
Ciprian Jauca was the second author, identified trials meeting inclusion criteria, translated two non‐English studies (one in French and one in German), assessed risk of bias of all included studies, and performed data abstraction. For the 2012 and 2014 updates, Ciprian Jauca helped screen new titles and abstracts, retrieved the full text of potential articles, screened new citations to determine if they met the minimum inclusion criteria, and contributed minor edits to the final version of the updated review.
James Wright confirmed accuracy of data and was the third author to settle any discrepancies in inclusion criteria or data abstraction.
Ken Bassett confirmed accuracy of data and was the third author to settle any discrepancies in inclusion criteria or data abstraction.
Pouria Rezapour joined the review author team for the updates in 2012 and 2014, performed updated searches in 2012 and 2014, screened new titles and abstracts, retrieved the full text of potential articles, screened new citations to determine if they met the minimum inclusion criteria, and contributed minor edits to the final version of the updated review.
Sources of support
Internal sources
-
Department of Anesthesiology, Pharmacology & Therapeutics, University of British Columbia, Canada.
External sources
-
Canadian Institutes of Health Research, Canada.
grant to the Hypertension Review Group.
Declarations of interest
Vijaya Musini: nothing to declare.
Pouria Rezapour: nothing to declare.
James Wright: nothing to declare.
Ken Bassett: nothing to declare.
Ciprian Jauca: nothing to declare.
Acknowledgements
The review authors would like to acknowledge the help provided by the Cochrane Hypertension Group. We would like to thank Doug Salzwedel, the Trials Search Co‐ordinator of the Cochrane Hypertension Group, for conducting the updated searches; Stephen Adams for sorting search findings in Reference Manager and retrieving articles to complete this review; and Dr. Balraj Heran for extracting data from the graph of the Homuth 1993 trial.
Version history
| Published | Title | Stage | Authors | Version |
| 2015 May 22 | Blood pressure‐lowering efficacy of loop diuretics for primary hypertension | Review | Vijaya M Musini, Pouria Rezapour, James M Wright, Ken Bassett, Ciprian D Jauca | |
| 2012 Aug 15 | Blood pressure lowering efficacy of loop diuretics for primary hypertension | Review | Vijaya M Musini, Pouria Rezapour, James M Wright, Ken Bassett, Ciprian D Jauca | |
| 2009 Oct 07 | Blood pressure lowering efficacy of loop diuretics for primary hypertension | Review | Vijaya M Musini, James M Wright, Ken Bassett, Ciprian D Jauca | |
| 2009 Jul 08 | Blood pressure lowering efficacy of loop diuretics for primary hypertension | Protocol | Vijaya M Musini, James M Wright, Ken Bassett, Ciprian D Jauca | |
Differences between protocol and review
In the second update the search was run until February 2012. In order to maximize data inclusion, we also included trials that reported data after 12 weeks in the meta‐analysis. The second update in October 2014 followed the same methods as the 2012 update, but no new trials met the minimum inclusion criteria.
Keywords
MeSH
Medical Subject Headings (MeSH) Keywords
- Antihypertensive Agents [*administration & dosage, adverse effects];
- Blood Pressure [*drug effects];
- Dose‐Response Relationship, Drug;
- Furosemide [administration & dosage, adverse effects];
- Hypertension [*drug therapy];
- Indans [administration & dosage, adverse effects];
- Pyridines [administration & dosage, adverse effects];
- Randomized Controlled Trials as Topic;
- Sodium Potassium Chloride Symporter Inhibitors [*administration & dosage, adverse effects];
- Sulfonamides [administration & dosage, adverse effects];
- Thiazoles [administration & dosage, adverse effects];
Medical Subject Headings Check Words
Humans;
PICOs
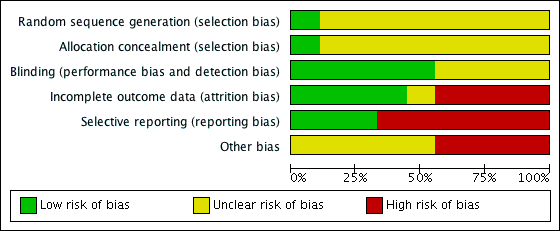
Methodological quality graph: review authors' judgements about each methodological quality item presented as percentages across all included studies.

Methodological quality summary: review authors' judgements about each methodological quality item for each included study.

QUOROM Diagram ‐ Search: until January 2009

Updated PRISMA diagram ‐ Search updated from Jan 2009 to February 2012

Updated PRISMA diagram ‐ Search updated on 27 October 2014

Funnel plot of comparison: 1 Loop diuretics vs placebo, outcome: 1.1 SBP.

Funnel plot of comparison: 1 Loop diuretics vs placebo, outcome: 1.2 DBP.

Comparison 1 Loop diuretics vs placebo, Outcome 1 SBP.

Comparison 1 Loop diuretics vs placebo, Outcome 2 DBP.

Comparison 1 Loop diuretics vs placebo, Outcome 3 Withdrawals due to adverse events.

Comparison 1 Loop diuretics vs placebo, Outcome 4 Serum potassium.

Comparison 1 Loop diuretics vs placebo, Outcome 5 Serum uric acid.

Comparison 1 Loop diuretics vs placebo, Outcome 6 Serum creatinine.

Comparison 1 Loop diuretics vs placebo, Outcome 7 Blood glucose.

Comparison 1 Loop diuretics vs placebo, Outcome 8 serum cholesterol.

Comparison 1 Loop diuretics vs placebo, Outcome 9 Serum triglyceride.
| Loop diuretics compared with placebo for primary hypertension | ||||
| Patient or population: People with primary hypertension Settings: Outpatient Intervention: Loop diuretics at various doses Comparison: Placebo control | ||||
| Outcomes | MD with (95% CI) | No. of Participants | Quality of the evidence | Comments |
| Decrease in SBP mmHg mean duration 8.8 weeks | ‐7.9(‐10.4 to ‐5.4) | 460 (9) | ⊕⊕⊝⊝ | Not significantly different from thiazides, angiotensin‐converting enzyme inhibitors, angiotensin receptor blockers, or renin inhibitors. |
| Decrease in DBP mmHg mean duration 8.8 weeks | ‐4.4(‐5.9 to ‐2.8) | 460 (9) | ⊕⊕⊝⊝ | Not significantly different from thiazides, angiotensin‐converting enzyme inhibitors, angiotensin receptor blockers, or renin inhibitors. |
| CI: confidence interval; MD: mean difference | ||||
| GRADE Working Group grades of evidence | ||||
| 1. Wide confidence intervals 2. High risk of bias including publication bias | ||||
| Outcome or subgroup title | No. of studies | No. of participants | Statistical method | Effect size |
| 1 SBP Show forest plot | 9 | 460 | Mean Difference (IV, Fixed, 95% CI) | ‐7.92 [‐10.40, ‐5.44] |
| 1.1 Furosemide 40mg versus placebo | 2 | 90 | Mean Difference (IV, Fixed, 95% CI) | ‐5.80 [‐12.96, 1.36] |
| 1.2 Furosemide 60mg versus placebo | 1 | 26 | Mean Difference (IV, Fixed, 95% CI) | ‐10.0 [‐15.77, ‐4.23] |
| 1.3 Cicletanine 100mg versus placebo | 1 | 39 | Mean Difference (IV, Fixed, 95% CI) | ‐7.0 [‐16.18, 2.18] |
| 1.4 Cicletanine 150mg versus placebo | 1 | 60 | Mean Difference (IV, Fixed, 95% CI) | ‐9.10 [‐15.54, ‐2.66] |
| 1.5 Piretanide 3mg versus placebo | 1 | 60 | Mean Difference (IV, Fixed, 95% CI) | ‐2.2 [‐9.97, 5.57] |
| 1.6 Piretanide 6mg versus placebo | 2 | 120 | Mean Difference (IV, Fixed, 95% CI) | ‐4.65 [‐10.01, 0.71] |
| 1.7 Indacrinone enantiomer ‐2.5 /+ 80mg versus placebo | 1 | 12 | Mean Difference (IV, Fixed, 95% CI) | ‐14.90 [‐31.15, 1.35] |
| 1.8 Indacrinone ‐5.0 /+ 80mg versus placebo | 1 | 12 | Mean Difference (IV, Fixed, 95% CI) | ‐11.70 [‐25.37, 1.97] |
| 1.9 Indacrinone ‐10.0 /+ 80 mg versus placebo | 1 | 13 | Mean Difference (IV, Fixed, 95% CI) | ‐19.1 [‐35.95, ‐2.25] |
| 1.10 Etozolin 200mg versus placebo | 1 | 28 | Mean Difference (IV, Fixed, 95% CI) | ‐14.30 [‐23.05, ‐5.55] |
| 2 DBP Show forest plot | 9 | 460 | Mean Difference (IV, Fixed, 95% CI) | ‐4.36 [‐5.87, ‐2.84] |
| 2.1 Furosemide 40mg versus placebo | 2 | 90 | Mean Difference (IV, Fixed, 95% CI) | ‐3.53 [‐7.28, 0.23] |
| 2.2 Furosemide 60mg versus placebo | 1 | 26 | Mean Difference (IV, Fixed, 95% CI) | ‐3.00 [‐7.26, 1.26] |
| 2.3 Cicletanine 100mg versus placebo | 1 | 39 | Mean Difference (IV, Fixed, 95% CI) | ‐3.30 [‐9.48, 2.88] |
| 2.4 Cicletanine 150mg versus placebo | 1 | 60 | Mean Difference (IV, Fixed, 95% CI) | ‐11.3 [‐15.30, ‐7.30] |
| 2.5 Piretanide 3mg versus placebo | 1 | 60 | Mean Difference (IV, Fixed, 95% CI) | ‐0.80 [‐5.44, 3.84] |
| 2.6 Piretanide 6mg versus placebo | 2 | 120 | Mean Difference (IV, Fixed, 95% CI) | ‐2.32 [‐5.48, 0.84] |
| 2.7 Indacrinone enantiomer ‐2.5 /+ 80mg versus placebo | 1 | 12 | Mean Difference (IV, Fixed, 95% CI) | ‐7.1 [‐15.16, 0.96] |
| 2.8 Indacrinone ‐5.0 /+ 80mg versus placebo | 1 | 12 | Mean Difference (IV, Fixed, 95% CI) | ‐3.40 [‐11.24, 4.44] |
| 2.9 Indacrinone ‐10.0 /+ 80 mg versus placebo | 1 | 13 | Mean Difference (IV, Fixed, 95% CI) | ‐3.40 [‐11.61, 4.81] |
| 2.10 Etozolin 200mg versus placebo | 1 | 28 | Mean Difference (IV, Fixed, 95% CI) | ‐7.30 [‐13.22, ‐1.38] |
| 3 Withdrawals due to adverse events Show forest plot | 6 | 331 | Risk Ratio (M‐H, Fixed, 95% CI) | 1.93 [0.34, 10.81] |
| 4 Serum potassium Show forest plot | 2 | 88 | Mean Difference (IV, Fixed, 95% CI) | ‐0.12 [‐0.36, 0.12] |
| 4.1 Cicletanine 150mg | 1 | 58 | Mean Difference (IV, Fixed, 95% CI) | ‐0.12 [‐0.36, 0.12] |
| 4.2 Furosemide 40mg | 1 | 30 | Mean Difference (IV, Fixed, 95% CI) | 0.0 [0.0, 0.0] |
| 5 Serum uric acid Show forest plot | 2 | 88 | Mean Difference (IV, Fixed, 95% CI) | 10.52 [‐17.88, 38.92] |
| 5.1 Cicletanine 150mg | 1 | 58 | Mean Difference (IV, Fixed, 95% CI) | ‐7.0 [‐40.75, 26.75] |
| 5.2 Furosemide 40mg | 1 | 30 | Mean Difference (IV, Fixed, 95% CI) | 53.00 [0.44, 105.56] |
| 6 Serum creatinine Show forest plot | 2 | 88 | Mean Difference (IV, Fixed, 95% CI) | 0.93 [‐5.74, 7.61] |
| 6.1 Cicletanine 150mg | 1 | 58 | Mean Difference (IV, Fixed, 95% CI) | ‐0.70 [‐9.63, 8.23] |
| 6.2 Furosemide 40 mg | 1 | 30 | Mean Difference (IV, Fixed, 95% CI) | 3.0 [‐7.05, 13.05] |
| 7 Blood glucose Show forest plot | 2 | 88 | Mean Difference (IV, Fixed, 95% CI) | 0.06 [‐0.19, 0.31] |
| 7.1 Cicletanine 150mg | 1 | 58 | Mean Difference (IV, Fixed, 95% CI) | ‐0.01 [‐0.40, 0.38] |
| 7.2 Furosemide 40mg | 1 | 30 | Mean Difference (IV, Fixed, 95% CI) | 0.1 [‐0.22, 0.42] |
| 8 serum cholesterol Show forest plot | 2 | 88 | Mean Difference (IV, Fixed, 95% CI) | 0.31 [‐0.17, 0.80] |
| 8.1 Cicletanine 150mg | 1 | 58 | Mean Difference (IV, Fixed, 95% CI) | 0.17 [‐0.51, 0.85] |
| 8.2 Furosemide 40 mg | 1 | 30 | Mean Difference (IV, Fixed, 95% CI) | 0.46 [‐0.23, 1.15] |
| 9 Serum triglyceride Show forest plot | 2 | 88 | Mean Difference (IV, Fixed, 95% CI) | ‐0.02 [‐0.35, 0.31] |
| 9.1 Cicletanine 150mg | 1 | 58 | Mean Difference (IV, Fixed, 95% CI) | ‐0.16 [‐0.54, 0.22] |
| 9.2 Furosemide 40 mg | 1 | 30 | Mean Difference (IV, Fixed, 95% CI) | 0.36 [‐0.27, 0.99] |