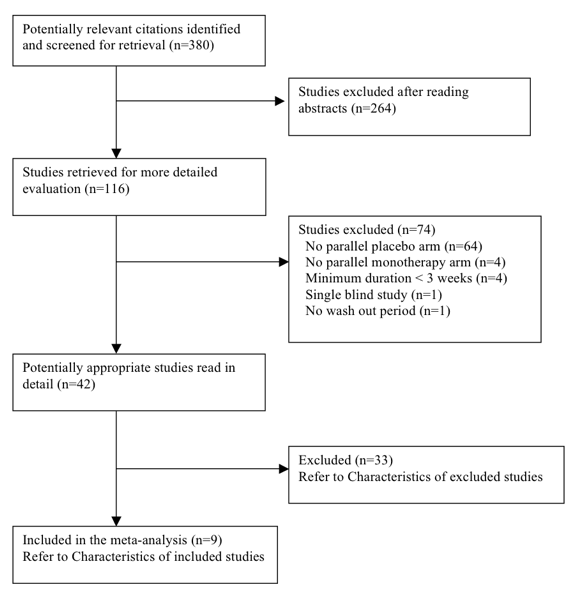
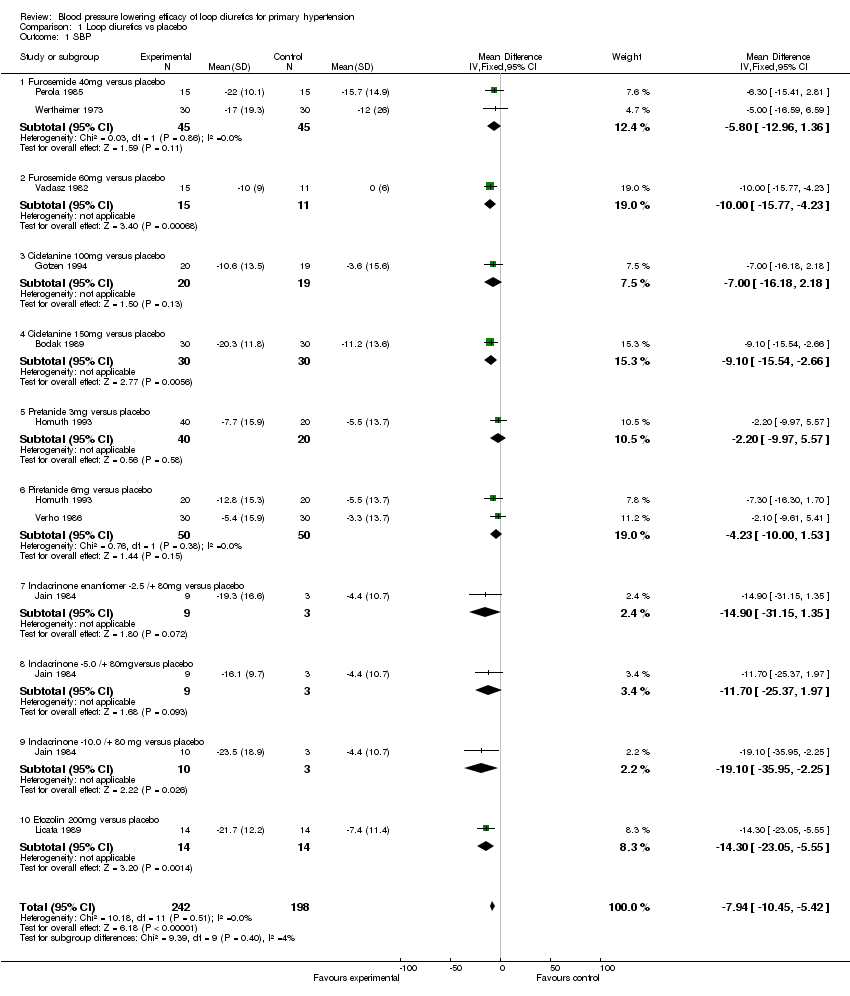
| 1 SBP Show forest plot | 9 | 440 | Mean Difference (IV, Fixed, 95% CI) | ‐7.94 [‐10.45, ‐5.42] |
|
| 1.1 Furosemide 40mg versus placebo | 2 | 90 | Mean Difference (IV, Fixed, 95% CI) | ‐5.80 [‐12.96, 1.36] |
| 1.2 Furosemide 60mg versus placebo | 1 | 26 | Mean Difference (IV, Fixed, 95% CI) | ‐10.0 [‐15.77, ‐4.23] |
| 1.3 Cicletanine 100mg versus placebo | 1 | 39 | Mean Difference (IV, Fixed, 95% CI) | ‐7.0 [‐16.18, 2.18] |
| 1.4 Cicletanine 150mg versus placebo | 1 | 60 | Mean Difference (IV, Fixed, 95% CI) | ‐9.10 [‐15.54, ‐2.66] |
| 1.5 Pretanide 3mg versus placebo | 1 | 60 | Mean Difference (IV, Fixed, 95% CI) | ‐2.2 [‐9.97, 5.57] |
| 1.6 Piretanide 6mg versus placebo | 2 | 100 | Mean Difference (IV, Fixed, 95% CI) | ‐4.23 [‐10.00, 1.53] |
| 1.7 Indacrinone enantiomer ‐2.5 /+ 80mg versus placebo | 1 | 12 | Mean Difference (IV, Fixed, 95% CI) | ‐14.90 [‐31.15, 1.35] |
| 1.8 Indacrinone ‐5.0 /+ 80mgversus placebo | 1 | 12 | Mean Difference (IV, Fixed, 95% CI) | ‐11.70 [‐25.37, 1.97] |
| 1.9 Indacrinone ‐10.0 /+ 80 mg versus placebo | 1 | 13 | Mean Difference (IV, Fixed, 95% CI) | ‐19.1 [‐35.95, ‐2.25] |
| 1.10 Etozolin 200mg versus placebo | 1 | 28 | Mean Difference (IV, Fixed, 95% CI) | ‐14.30 [‐23.05, ‐5.55] |
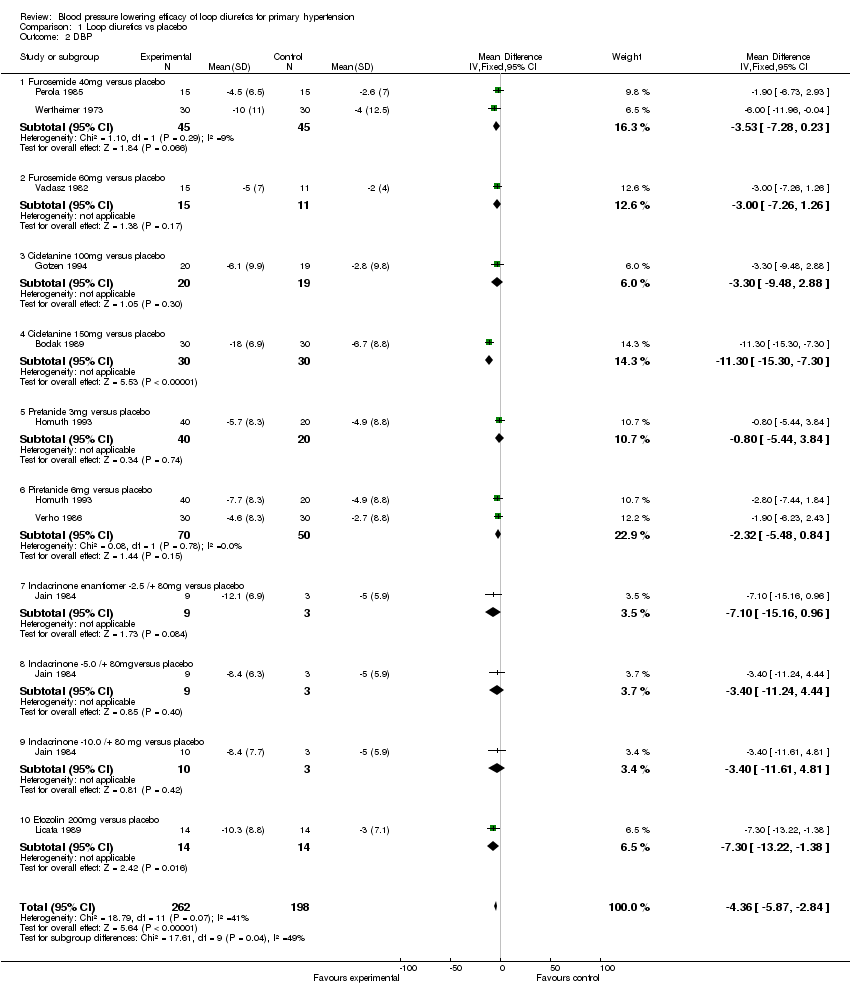
| 2 DBP Show forest plot | 9 | 460 | Mean Difference (IV, Fixed, 95% CI) | ‐4.36 [‐5.87, ‐2.84] |
|
| 2.1 Furosemide 40mg versus placebo | 2 | 90 | Mean Difference (IV, Fixed, 95% CI) | ‐3.53 [‐7.28, 0.23] |
| 2.2 Furosemide 60mg versus placebo | 1 | 26 | Mean Difference (IV, Fixed, 95% CI) | ‐3.00 [‐7.26, 1.26] |
| 2.3 Cicletanine 100mg versus placebo | 1 | 39 | Mean Difference (IV, Fixed, 95% CI) | ‐3.30 [‐9.48, 2.88] |
| 2.4 Cicletanine 150mg versus placebo | 1 | 60 | Mean Difference (IV, Fixed, 95% CI) | ‐11.3 [‐15.30, ‐7.30] |
| 2.5 Pretanide 3mg versus placebo | 1 | 60 | Mean Difference (IV, Fixed, 95% CI) | ‐0.80 [‐5.44, 3.84] |
| 2.6 Piretanide 6mg versus placebo | 2 | 120 | Mean Difference (IV, Fixed, 95% CI) | ‐2.32 [‐5.48, 0.84] |
| 2.7 Indacrinone enantiomer ‐2.5 /+ 80mg versus placebo | 1 | 12 | Mean Difference (IV, Fixed, 95% CI) | ‐7.1 [‐15.16, 0.96] |
| 2.8 Indacrinone ‐5.0 /+ 80mgversus placebo | 1 | 12 | Mean Difference (IV, Fixed, 95% CI) | ‐3.40 [‐11.24, 4.44] |
| 2.9 Indacrinone ‐10.0 /+ 80 mg versus placebo | 1 | 13 | Mean Difference (IV, Fixed, 95% CI) | ‐3.40 [‐11.61, 4.81] |
| 2.10 Etozolin 200mg versus placebo | 1 | 28 | Mean Difference (IV, Fixed, 95% CI) | ‐7.30 [‐13.22, ‐1.38] |
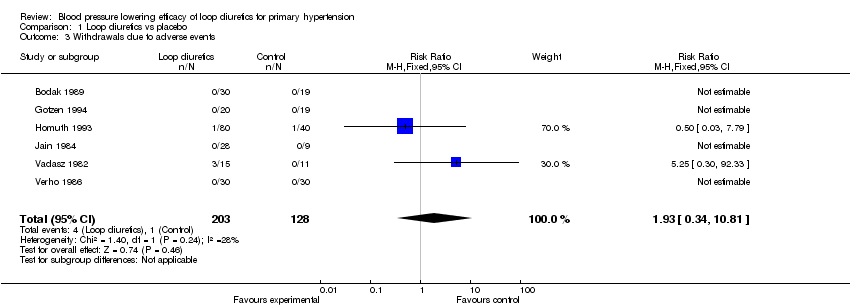
| 3 Withdrawals due to adverse events Show forest plot | 6 | 331 | Risk Ratio (M‐H, Fixed, 95% CI) | 1.93 [0.34, 10.81] |
|
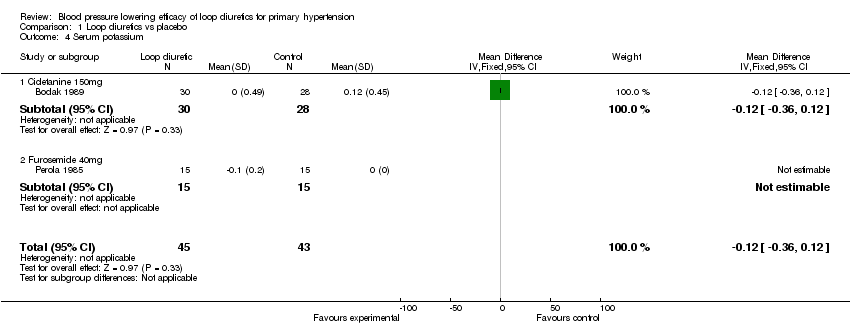
| 4 Serum potassium Show forest plot | 2 | 88 | Mean Difference (IV, Fixed, 95% CI) | ‐0.12 [‐0.36, 0.12] |
|
| 4.1 Cicletanine 150mg | 1 | 58 | Mean Difference (IV, Fixed, 95% CI) | ‐0.12 [‐0.36, 0.12] |
| 4.2 Furosemide 40mg | 1 | 30 | Mean Difference (IV, Fixed, 95% CI) | 0.0 [0.0, 0.0] |
| 5 Serum uric acid Show forest plot | 2 | 88 | Mean Difference (IV, Fixed, 95% CI) | 10.52 [‐17.88, 38.92] |
|
| 5.1 Cicletanine 150mg | 1 | 58 | Mean Difference (IV, Fixed, 95% CI) | ‐7.0 [‐40.75, 26.75] |
| 5.2 Furosemide 40mg | 1 | 30 | Mean Difference (IV, Fixed, 95% CI) | 53.00 [0.44, 105.56] |
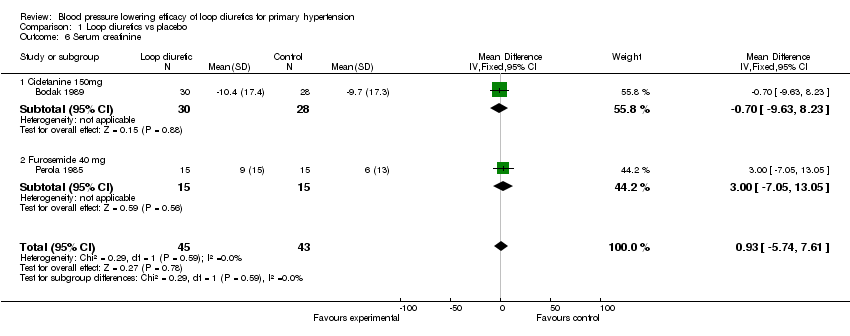
| 6 Serum creatinine Show forest plot | 2 | 88 | Mean Difference (IV, Fixed, 95% CI) | 0.93 [‐5.74, 7.61] |
|
| 6.1 Cicletanine 150mg | 1 | 58 | Mean Difference (IV, Fixed, 95% CI) | ‐0.70 [‐9.63, 8.23] |
| 6.2 Furosemide 40 mg | 1 | 30 | Mean Difference (IV, Fixed, 95% CI) | 3.0 [‐7.05, 13.05] |
| 7 Blood glucose Show forest plot | 2 | 88 | Mean Difference (IV, Fixed, 95% CI) | 0.06 [‐0.19, 0.31] |
|
| 7.1 Cicletanine 150mg | 1 | 58 | Mean Difference (IV, Fixed, 95% CI) | ‐0.01 [‐0.40, 0.38] |
| 7.2 Furosemide 40mg | 1 | 30 | Mean Difference (IV, Fixed, 95% CI) | 0.1 [‐0.22, 0.42] |
| 8 serum cholesterol Show forest plot | 2 | 88 | Mean Difference (IV, Fixed, 95% CI) | 0.31 [‐0.17, 0.80] |
|
| 8.1 Cicletanine 150mg | 1 | 58 | Mean Difference (IV, Fixed, 95% CI) | 0.17 [‐0.51, 0.85] |
| 8.2 Furosemide 40 mg | 1 | 30 | Mean Difference (IV, Fixed, 95% CI) | 0.46 [‐0.23, 1.15] |
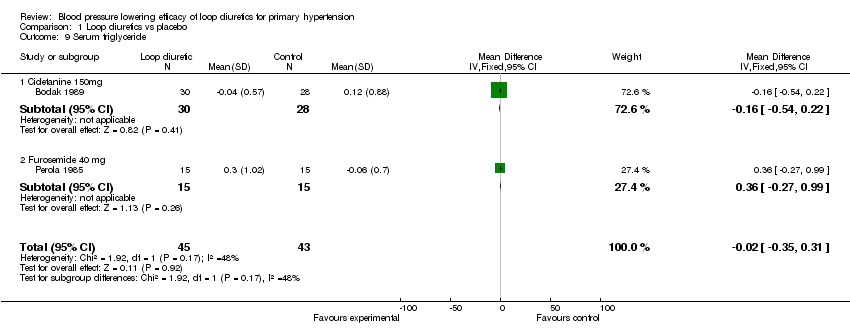
| 9 Serum triglyceride Show forest plot | 2 | 88 | Mean Difference (IV, Fixed, 95% CI) | ‐0.02 [‐0.35, 0.31] |
|
| 9.1 Cicletanine 150mg | 1 | 58 | Mean Difference (IV, Fixed, 95% CI) | ‐0.16 [‐0.54, 0.22] |
| 9.2 Furosemide 40 mg | 1 | 30 | Mean Difference (IV, Fixed, 95% CI) | 0.36 [‐0.27, 0.99] |