Quimioterapia más rituximab versus quimioterapia sola para el linfoma no Hodgkin de células B
Referencias
Referencias de los estudios incluidos en esta revisión
Referencias de los estudios excluidos de esta revisión
Referencias de los estudios en curso
Referencias adicionales
Referencias de otras versiones publicadas de esta revisión
Characteristics of studies
Characteristics of included studies [ordered by study ID]
| Methods | Randomised | |
| Participants | Relapsed or refractory indolent and mantle cell lymphoma | |
| Interventions | 4 x R‐FCM vs 4 x FCM | |
| Outcomes | Overall survival | |
| Notes | Second randomisation for maintenance 4xRituximab month 3 and months 9 vs observation | |
| Risk of bias | ||
| Bias | Authors' judgement | Support for judgement |
| Allocation concealment? | Low risk | A ‐ Adequate |
| Methods | Randomised | |
| Participants | Untreated indolent and mantle cell lymphoma | |
| Interventions | 6 x R‐MCP vs 6 x MCP | |
| Outcomes | Overall survival | |
| Notes | Interferon maintenance therapy for follicular lymphoma | |
| Risk of bias | ||
| Bias | Authors' judgement | Support for judgement |
| Allocation concealment? | Low risk | A ‐ Adequate |
| Methods | Randomised | |
| Participants | Untreated indolent and mantle cell lymphoma | |
| Interventions | 6‐8 R‐CHOP vs 6‐8 CHOP | |
| Outcomes | Overall survival | |
| Notes | Second randomisation for patients < 60 years for PBSCT vs Interferon maintenance | |
| Risk of bias | ||
| Bias | Authors' judgement | Support for judgement |
| Allocation concealment? | Low risk | A ‐ Adequate |
| Methods | Randomised | |
| Participants | Untreated mantle cell lymphoma | |
| Interventions | 6 x R‐CHOP vs 6 x CHOP | |
| Outcomes | Overall survival | |
| Notes | Second randomisation for patients < 65 years for PBSCT vs Interferon maintenance plus 2 cycles of conventional chemotherapy | |
| Risk of bias | ||
| Bias | Authors' judgement | Support for judgement |
| Allocation concealment? | Low risk | A ‐ Adequate |
| Methods | Randomised | |
| Participants | Untreated indolent lymphoma | |
| Interventions | 8 x R‐CVP vs 8 x CVP | |
| Outcomes | Overall survival | |
| Notes | Restaging were done after 4 cycles and patients with stable disease were taken off study | |
| Risk of bias | ||
| Bias | Authors' judgement | Support for judgement |
| Allocation concealment? | Low risk | A ‐ Adequate |
| Methods | Randomised | |
| Participants | Untreated indolent lymphoma | |
| Interventions | R‐CNOP vs CNOP vs R | |
| Outcomes | Overall survival | |
| Notes | subgroups of indolent lymphoma are not specified. Three arm study. Patients with R only are not included in the meta‐analysis | |
| Risk of bias | ||
| Bias | Authors' judgement | Support for judgement |
| Allocation concealment? | Unclear risk | B ‐ Unclear |
| Methods | Randomised | |
| Participants | Relapsed or refractory indolent lymphoma | |
| Interventions | 6 x R‐CHOP vs 6 x CHOP | |
| Outcomes | Overall survival | |
| Notes | Second randomisation for maintenance therapy with rituximab every 2 month until 2 years vs observation | |
| Risk of bias | ||
| Bias | Authors' judgement | Support for judgement |
| Allocation concealment? | Low risk | A ‐ Adequate |
Characteristics of excluded studies [ordered by study ID]
| Study | Reason for exclusion |
| Comparison of concurrent vs sequential treatment with rituximab | |
| Rituximab Konsolidationtherapy | |
| Non randomised study | |
| Non randomised study | |
| Study focused on rapid clearence of circulating lymphoma cells but had no outcome analysis | |
| Monotherapy R and maintenance rituximab | |
| Konsoldiationtherapy with Rituximab | |
| No identical chemotherapy and furthermore rituximab monotherapy as induction followed by R‐CVP or R‐CHOP | |
| rituximab maintenance therapy | |
| Non randomised study | |
| Sequential vs concurrent therapy with rituximab | |
| Non randomised study | |
| Standard chemotherapy with rituximab vs high dose therapy with rituximab and no identical chemotherapy in both arms | |
| Rituximab maintenance therapy and ongoing trial | |
| Treatment outcome was minimal residual disease | |
| Non randomised study and ongoing trial | |
| No identical chemotherapy schedule. | |
| Rituximab monotherapy | |
| Rituximab concurrent vs sequential | |
| Rituximab consolidationtherapy | |
| Rituximab mono | |
| Konsolidationtherapy with rituximab after 6 x Fludara + Mitoxantrone vs 6 x R‐CHOP. |
Characteristics of ongoing studies [ordered by study ID]
| Trial name or title | |
| Methods | |
| Participants | |
| Interventions | |
| Outcomes | |
| Starting date | |
| Contact information | |
| Notes |
| Trial name or title | Combination Chemotherapy Plus Filgrastim With or Without Rituximab in Treating Older Patients With Non‐Hodgkin's Lymphoma |
| Methods | |
| Participants | Adult Diffuse Large Cell Lymphoma |
| Interventions | Compare the efficacy of cyclophosphamide, doxorubicin, vincristine, prednisone (CHOP), and filgrastim (G‐CSF) with or without rituximab on event‐free survival of elderly patients with intermediate or high‐risk non‐Hodgkin's lymphoma. |
| Outcomes | Compare the complete remission rate, overall survival, and disease‐free survival of patients treated with these regimens. |
| Starting date | January 2002 |
| Contact information | Sponsored by: Commissie Voor Klinisch Toegepast Onderzoek |
| Notes |
Data and analyses
| Outcome or subgroup title | No. of studies | No. of participants | Statistical method | Effect size |
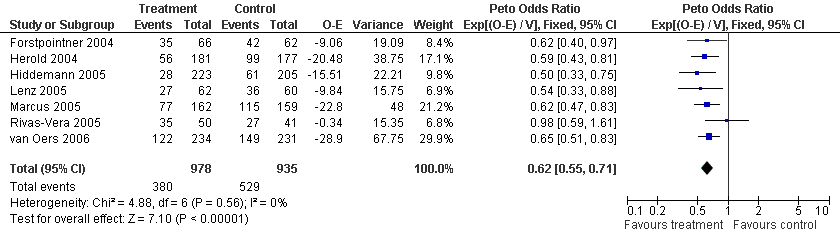
| 1 Overall survival Total group Show forest plot | 7 | 1943 | Peto Odds Ratio (95% CI) | 0.65 [0.54, 0.78] |
| Analysis 1.1  Comparison 1 Overall survival, Outcome 1 Overall survival Total group. | ||||
| 2 Overall survival FL vs MCL Show forest plot | 6 | 1740 | Peto Odds Ratio (95% CI) | 0.63 [0.51, 0.77] |
| Analysis 1.2  Comparison 1 Overall survival, Outcome 2 Overall survival FL vs MCL. | ||||
| 2.1 Follicular lymphoma | 5 | 1480 | Peto Odds Ratio (95% CI) | 0.63 [0.51, 0.79] |
| 2.2 Mantlecell lymphoma | 3 | 260 | Peto Odds Ratio (95% CI) | 0.60 [0.37, 0.98] |
| 3 Sensitivity: attrition bias Show forest plot | 7 | 1943 | Peto Odds Ratio (95% CI) | 0.65 [0.54, 0.78] |
| Analysis 1.3  Comparison 1 Overall survival, Outcome 3 Sensitivity: attrition bias. | ||||
| 3.1 Less than 10% excluded from analysis | 5 | 1694 | Peto Odds Ratio (95% CI) | 0.68 [0.55, 0.83] |
| 3.2 More than 10% excluded from analysis | 2 | 249 | Peto Odds Ratio (95% CI) | 0.50 [0.30, 0.83] |
| 4 Overall survival_Doxorubicin vs Mitoxantrone Show forest plot | 6 | 1622 | Peto Odds Ratio (95% CI) | 0.64 [0.52, 0.79] |
| Analysis 1.4  Comparison 1 Overall survival, Outcome 4 Overall survival_Doxorubicin vs Mitoxantrone. | ||||
| 4.1 Doxorubicin based regimen | 3 | 1015 | Peto Odds Ratio (95% CI) | 0.70 [0.54, 0.91] |
| 4.2 Mitoxantrone based regimen | 3 | 607 | Peto Odds Ratio (95% CI) | 0.56 [0.40, 0.77] |
| 5 Overall survival untreated vs treated patients Show forest plot | 7 | 1943 | Peto Odds Ratio (95% CI) | 0.65 [0.54, 0.78] |
| Analysis 1.5  Comparison 1 Overall survival, Outcome 5 Overall survival untreated vs treated patients. | ||||
| 5.1 Untreated patients | 5 | 1350 | Peto Odds Ratio (95% CI) | 0.66 [0.52, 0.84] |
| 5.2 Treated patients | 2 | 593 | Peto Odds Ratio (95% CI) | 0.63 [0.46, 0.86] |
| 6 Overall survival_Anthracylin vs no‐Anthracylin treatment Show forest plot | 7 | 1943 | Peto Odds Ratio (95% CI) | 0.65 [0.54, 0.78] |
| Analysis 1.6  Comparison 1 Overall survival, Outcome 6 Overall survival_Anthracylin vs no‐Anthracylin treatment. | ||||
| 6.1 Anthracyclin based regimen | 6 | 1622 | Peto Odds Ratio (95% CI) | 0.64 [0.52, 0.79] |
| 6.2 No anthracylin based regimen | 1 | 321 | Peto Odds Ratio (95% CI) | 0.70 [0.40, 1.23] |
| 7 Overall survival_Full Text vs Abstract Publication Show forest plot | 7 | 1943 | Peto Odds Ratio (95% CI) | 0.65 [0.54, 0.78] |
| Analysis 1.7  Comparison 1 Overall survival, Outcome 7 Overall survival_Full Text vs Abstract Publication. | ||||
| 7.1 Full‐text | 5 | 1464 | Peto Odds Ratio (95% CI) | 0.65 [0.52, 0.81] |
| 7.2 Abstract Form | 2 | 479 | Peto Odds Ratio (95% CI) | 0.64 [0.43, 0.94] |
| 8 Overall survival_Alloc. concealment Show forest plot | 7 | 1943 | Peto Odds Ratio (95% CI) | 0.65 [0.54, 0.78] |
| Analysis 1.8  Comparison 1 Overall survival, Outcome 8 Overall survival_Alloc. concealment. | ||||
| 8.1 Adaequate | 6 | 1822 | Peto Odds Ratio (95% CI) | 0.64 [0.53, 0.78] |
| 8.2 Not adaequate | 1 | 121 | Peto Odds Ratio (95% CI) | 0.96 [0.32, 2.91] |
| 9 Overall Survival _with or without second randomisation Show forest plot | 7 | 1943 | Peto Odds Ratio (95% CI) | 0.65 [0.54, 0.78] |
| Analysis 1.9  Comparison 1 Overall survival, Outcome 9 Overall Survival _with or without second randomisation. | ||||
| 9.1 No second randomisation | 3 | 800 | Peto Odds Ratio (95% CI) | 0.66 [0.48, 0.91] |
| 9.2 Second randomisation | 4 | 1143 | Peto Odds Ratio (95% CI) | 0.64 [0.51, 0.81] |
| Outcome or subgroup title | No. of studies | No. of participants | Statistical method | Effect size |
| 1 FFS Total group Show forest plot | 7 | 1913 | Peto Odds Ratio (95% CI) | 0.62 [0.55, 0.71] |
| Analysis 2.1  Comparison 2 Disease Control, Outcome 1 FFS Total group. | ||||
| 2 FFS_FL vs MCL Show forest plot | 5 | 1537 | Peto Odds Ratio (95% CI) | 0.58 [0.50, 0.67] |
| Analysis 2.2  Comparison 2 Disease Control, Outcome 2 FFS_FL vs MCL. | ||||
| 2.1 Follicular lymphoma | 4 | 1415 | Peto Odds Ratio (95% CI) | 0.58 [0.50, 0.68] |
| 2.2 Mantlecell lymphoma | 1 | 122 | Peto Odds Ratio (95% CI) | 0.54 [0.33, 0.88] |
| 3 FFS_Sensitivity: attrition bias Show forest plot | 7 | 1913 | Peto Odds Ratio (95% CI) | 0.62 [0.55, 0.71] |
| Analysis 2.3  Comparison 2 Disease Control, Outcome 3 FFS_Sensitivity: attrition bias. | ||||
| 3.1 Less than 10% excluded from analysis | 5 | 1694 | Peto Odds Ratio (95% CI) | 0.60 [0.52, 0.69] |
| 3.2 More than 10% excluded from analysis | 2 | 219 | Peto Odds Ratio (95% CI) | 0.76 [0.55, 1.06] |
| 4 Disease control_Doxorubicin vs Mitoxantrone Show forest plot | 6 | 1592 | Peto Odds Ratio (95% CI) | 0.62 [0.54, 0.72] |
| Analysis 2.4  Comparison 2 Disease Control, Outcome 4 Disease control_Doxorubicin vs Mitoxantrone. | ||||
| 4.1 Doxorubicin based regimen | 3 | 1015 | Peto Odds Ratio (95% CI) | 0.60 [0.49, 0.72] |
| 4.2 Mitoxantrone based regimen | 3 | 577 | Peto Odds Ratio (95% CI) | 0.66 [0.53, 0.84] |
| 5 Disease control_untreated vs treated patients Show forest plot | 7 | 1913 | Peto Odds Ratio (95% CI) | 0.62 [0.55, 0.71] |
| Analysis 2.5  Comparison 2 Disease Control, Outcome 5 Disease control_untreated vs treated patients. | ||||
| 5.1 Untreated patients | 5 | 1320 | Peto Odds Ratio (95% CI) | 0.61 [0.52, 0.72] |
| 5.2 Treated patients | 2 | 593 | Peto Odds Ratio (95% CI) | 0.65 [0.52, 0.80] |
| 6 Disease control_Anthracylin vs no‐Anthracylin treatment Show forest plot | 7 | 1913 | Peto Odds Ratio (95% CI) | 0.62 [0.55, 0.71] |
| Analysis 2.6  Comparison 2 Disease Control, Outcome 6 Disease control_Anthracylin vs no‐Anthracylin treatment. | ||||
| 6.1 Anthracyclin based regimen | 6 | 1592 | Peto Odds Ratio (95% CI) | 0.62 [0.54, 0.72] |
| 6.2 No anthracylin based regimen | 1 | 321 | Peto Odds Ratio (95% CI) | 0.62 [0.47, 0.83] |
| 7 Disease control_Full text vs abstract publication Show forest plot | 7 | 1913 | Peto Odds Ratio (95% CI) | 0.62 [0.55, 0.71] |
| Analysis 2.7  Comparison 2 Disease Control, Outcome 7 Disease control_Full text vs abstract publication. | ||||
| 7.1 Full ‐Text | 5 | 1464 | Peto Odds Ratio (95% CI) | 0.61 [0.52, 0.71] |
| 7.2 Abstract form | 2 | 449 | Peto Odds Ratio (95% CI) | 0.68 [0.52, 0.89] |
| 8 FFS_Sensitivity: Alloc. concealment Show forest plot | 7 | 1913 | Peto Odds Ratio (95% CI) | 0.62 [0.55, 0.71] |
| Analysis 2.8  Comparison 2 Disease Control, Outcome 8 FFS_Sensitivity: Alloc. concealment. | ||||
| 8.1 Allocation concealment adaequate | 6 | 1822 | Peto Odds Ratio (95% CI) | 0.60 [0.53, 0.69] |
| 8.2 Not adaequate | 1 | 91 | Peto Odds Ratio (95% CI) | 0.98 [0.59, 1.61] |
| 9 FFS_Endpoints according to start of measurement Show forest plot | 6 | 1785 | Peto Odds Ratio (95% CI) | 0.62 [0.55, 0.72] |
| Analysis 2.9  Comparison 2 Disease Control, Outcome 9 FFS_Endpoints according to start of measurement. | ||||
| 9.1 Start of treatment | 5 | 1427 | Peto Odds Ratio (95% CI) | 0.63 [0.54, 0.74] |
| 9.2 End of treatment | 1 | 358 | Peto Odds Ratio (95% CI) | 0.59 [0.43, 0.81] |
| 10 FFS_Endpoints TTP, EFS, TTF, PFS Show forest plot | 6 | Peto Odds Ratio (95% CI) | Subtotals only | |
| Analysis 2.10  Comparison 2 Disease Control, Outcome 10 FFS_Endpoints TTP, EFS, TTF, PFS. | ||||
| 10.1 Time to progression | 2 | 412 | Peto Odds Ratio (95% CI) | 0.69 [0.54, 0.89] |
| 10.2 Progression free survival | 2 | 587 | Peto Odds Ratio (95% CI) | 0.63 [0.51, 0.78] |
| 10.3 Time to treatment failure | 2 | 550 | Peto Odds Ratio (95% CI) | 0.51 [0.37, 0.70] |
| 10.4 Event free survival | 1 | 201 | Peto Odds Ratio (95% CI) | 0.41 [0.26, 0.64] |
| Outcome or subgroup title | No. of studies | No. of participants | Statistical method | Effect size |
| 1 Overall Response Total Group Show forest plot | 7 | 1914 | Risk Ratio (M‐H, Fixed, 95% CI) | 1.21 [1.16, 1.27] |
| Analysis 3.1  Comparison 3 Overall Response, Outcome 1 Overall Response Total Group. | ||||
| 2 Overall Response FL vs MCL Show forest plot | 7 | 1830 | Risk Ratio (M‐H, Fixed, 95% CI) | 1.19 [1.14, 1.24] |
| Analysis 3.2  Comparison 3 Overall Response, Outcome 2 Overall Response FL vs MCL. | ||||
| 2.1 follicular | 6 | 1570 | Risk Ratio (M‐H, Fixed, 95% CI) | 1.19 [1.13, 1.24] |
| 2.2 Mantle cell | 3 | 260 | Risk Ratio (M‐H, Fixed, 95% CI) | 1.22 [1.05, 1.42] |
| 3 Sensitivity: attrition bias Show forest plot | 7 | 1914 | Odds Ratio (M‐H, Fixed, 95% CI) | 2.76 [2.17, 3.51] |
| Analysis 3.3  Comparison 3 Overall Response, Outcome 3 Sensitivity: attrition bias. | ||||
| 3.1 Less than 10% excluded from analysis | 5 | 1693 | Odds Ratio (M‐H, Fixed, 95% CI) | 2.88 [2.22, 3.74] |
| 3.2 More than 10% excluded from analysis | 2 | 221 | Odds Ratio (M‐H, Fixed, 95% CI) | 2.10 [1.10, 4.01] |
| 4 Overall Response_Doxorubicin vs Mitoxantrone Show forest plot | 6 | 1593 | Odds Ratio (M‐H, Fixed, 95% CI) | 2.63 [1.99, 3.46] |
| Analysis 3.4  Comparison 3 Overall Response, Outcome 4 Overall Response_Doxorubicin vs Mitoxantrone. | ||||
| 4.1 Doxorubicin based regimen | 3 | 1014 | Odds Ratio (M‐H, Fixed, 95% CI) | 2.58 [1.76, 3.76] |
| 4.2 Mitoxantrone based regimen | 3 | 579 | Odds Ratio (M‐H, Fixed, 95% CI) | 2.69 [1.80, 4.03] |
| 5 Overall Response_untreated vs treated patients Show forest plot | 7 | 1914 | Risk Ratio (M‐H, Fixed, 95% CI) | 1.21 [1.16, 1.27] |
| Analysis 3.5  Comparison 3 Overall Response, Outcome 5 Overall Response_untreated vs treated patients. | ||||
| 5.1 Untreated patients | 5 | 1319 | Risk Ratio (M‐H, Fixed, 95% CI) | 1.21 [1.15, 1.28] |
| 5.2 Treated patients | 2 | 595 | Risk Ratio (M‐H, Fixed, 95% CI) | 1.20 [1.10, 1.32] |
| 6 Overall response_Anthracyclin vs no‐Anthracyclin treatment Show forest plot | 7 | 1914 | Odds Ratio (M‐H, Fixed, 95% CI) | 2.76 [2.17, 3.51] |
| Analysis 3.6  Comparison 3 Overall Response, Outcome 6 Overall response_Anthracyclin vs no‐Anthracyclin treatment. | ||||
| 6.1 Anthracyclin based regimen | 6 | 1593 | Odds Ratio (M‐H, Fixed, 95% CI) | 2.63 [1.99, 3.46] |
| 6.2 No Anthracyclin based regimen | 1 | 321 | Odds Ratio (M‐H, Fixed, 95% CI) | 3.24 [1.96, 5.35] |
| 7 Overall Response_Full text vs Abstract publication Show forest plot | 7 | 1914 | Risk Ratio (M‐H, Fixed, 95% CI) | 1.21 [1.16, 1.27] |
| Analysis 3.7  Comparison 3 Overall Response, Outcome 7 Overall Response_Full text vs Abstract publication. | ||||
| 7.1 Full Text | 5 | 1465 | Risk Ratio (M‐H, Fixed, 95% CI) | 1.20 [1.14, 1.26] |
| 7.2 Abstract form | 2 | 449 | Risk Ratio (M‐H, Fixed, 95% CI) | 1.24 [1.12, 1.38] |
| 8 Overall Response Allocation concealment Show forest plot | 7 | 1914 | Risk Ratio (M‐H, Fixed, 95% CI) | 1.21 [1.16, 1.27] |
| Analysis 3.8  Comparison 3 Overall Response, Outcome 8 Overall Response Allocation concealment. | ||||
| 8.1 Adaequate | 6 | 1823 | Risk Ratio (M‐H, Fixed, 95% CI) | 1.22 [1.16, 1.28] |
| 8.2 Not adaequate | 1 | 91 | Risk Ratio (M‐H, Fixed, 95% CI) | 1.05 [0.90, 1.23] |
| Outcome or subgroup title | No. of studies | No. of participants | Statistical method | Effect size |
| 1 Complete Response Total Group Show forest plot | 7 | 1914 | Risk Ratio (M‐H, Fixed, 95% CI) | 2.03 [1.71, 2.40] |
| Analysis 4.1  Comparison 4 Complete Response, Outcome 1 Complete Response Total Group. | ||||
| 2 Complete Response FL vs MCL Show forest plot | 6 | 2043 | Risk Ratio (M‐H, Fixed, 95% CI) | 2.26 [1.89, 2.71] |
| Analysis 4.2  Comparison 4 Complete Response, Outcome 2 Complete Response FL vs MCL. | ||||
| 2.1 Follicula lymphoma | 5 | 1701 | Risk Ratio (M‐H, Fixed, 95% CI) | 2.16 [1.77, 2.63] |
| 2.2 Mantle cell lymphoma | 3 | 342 | Risk Ratio (M‐H, Fixed, 95% CI) | 2.90 [1.80, 4.67] |
| 3 Complete Response_Doxorubicine vs Mitoxantrone Show forest plot | 6 | 1593 | Risk Ratio (M‐H, Fixed, 95% CI) | 1.85 [1.55, 2.21] |
| Analysis 4.3  Comparison 4 Complete Response, Outcome 3 Complete Response_Doxorubicine vs Mitoxantrone. | ||||
| 3.1 Mitixantrone based regimen | 3 | 579 | Risk Ratio (M‐H, Fixed, 95% CI) | 2.02 [1.58, 2.59] |
| 3.2 Doxorubicine based regimen | 3 | 1014 | Risk Ratio (M‐H, Fixed, 95% CI) | 1.71 [1.33, 2.21] |
| 4 Complete Response_anthracycline vs no anthracyclin treatment Show forest plot | 7 | 1914 | Risk Ratio (M‐H, Fixed, 95% CI) | 2.03 [1.71, 2.40] |
| Analysis 4.4  Comparison 4 Complete Response, Outcome 4 Complete Response_anthracycline vs no anthracyclin treatment. | ||||
| 4.1 Anthracyclin based regimen | 6 | 1593 | Risk Ratio (M‐H, Fixed, 95% CI) | 1.85 [1.55, 2.21] |
| 4.2 No Anthracyclin based regimen | 1 | 321 | Risk Ratio (M‐H, Fixed, 95% CI) | 4.01 [2.22, 7.25] |
| 5 Complete Response _untreated vs treated patients Show forest plot | 7 | 1914 | Risk Ratio (M‐H, Fixed, 95% CI) | 2.03 [1.71, 2.40] |
| Analysis 4.5  Comparison 4 Complete Response, Outcome 5 Complete Response _untreated vs treated patients. | ||||
| 5.1 Complete remission untreated patients | 5 | 1319 | Risk Ratio (M‐H, Fixed, 95% CI) | 2.03 [1.66, 2.48] |
| 5.2 Complete remission_treated patients | 2 | 595 | Risk Ratio (M‐H, Fixed, 95% CI) | 2.01 [1.45, 2.77] |
| Outcome or subgroup title | No. of studies | No. of participants | Statistical method | Effect size |
| 1 Adverse events (number of patients) Show forest plot | 4 | Risk Ratio (M‐H, Fixed, 95% CI) | Subtotals only | |
| Analysis 5.1  Comparison 5 Toxicity Grade 3/4, Outcome 1 Adverse events (number of patients). | ||||
| 1.1 Infection | 4 | 1267 | Risk Ratio (M‐H, Fixed, 95% CI) | 1.05 [0.74, 1.48] |
| 1.2 Fever | 2 | 481 | Risk Ratio (M‐H, Fixed, 95% CI) | 3.79 [1.47, 9.78] |
| 1.3 Leukocytopenia | 2 | 681 | Risk Ratio (M‐H, Fixed, 95% CI) | 1.31 [1.11, 1.55] |
| 1.4 Thrombocytopenia | 4 | 1267 | Risk Ratio (M‐H, Fixed, 95% CI) | 1.14 [0.76, 1.72] |
| 1.5 Granulocytopenia | 3 | 907 | Risk Ratio (M‐H, Fixed, 95% CI) | 1.18 [1.00, 1.38] |

Forest plot of comparison: 1 Overall survival, outcome: 1.1 Overall survival Total group.

Forest plot of comparison: 1 Overall survival, outcome: 1.5 Overall survival untreated vs treated patients.

Forest plot of comparison: 1 Overall survival, outcome: 1.8 Overall survival_Alloc. concealment.

Forest plot of comparison: 1 Overall survival, outcome: 1.3 Sensitivity: attrition bias.

Forest plot of comparison: 1 Overall survival, outcome: 1.7 Overall survival_Full Text vs Abstract Publication.

Forest plot of comparison: 1 Overall survival, outcome: 1.2 Overall survival FL vs MCL.
Forest plot of comparison: 2 Disease Control, outcome: 2.1 FFS Total group.

Forest plot of comparison: 2 Disease Control, outcome: 2.9 FFS_Endpoints according to start of measurement.

Forest plot of comparison: 2 Disease Control, outcome: 2.2 FFS_FL vs MCL.
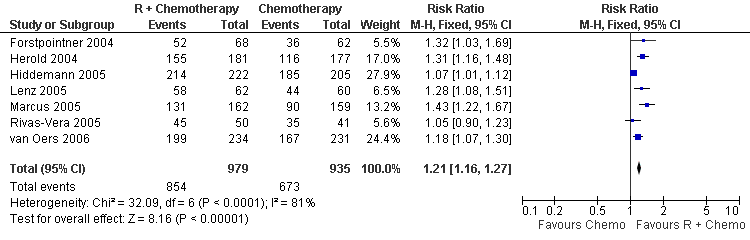
Forest plot of comparison: 3 Overall Response, outcome: 3.1 Overall Response Total Group.

Forest plot of comparison: 4 Complete Response, outcome: 4.1 Complete Response Total Group.

Forest plot of comparison: 3 Overall Response, outcome: 3.2 Overall Response FL vs MCL.
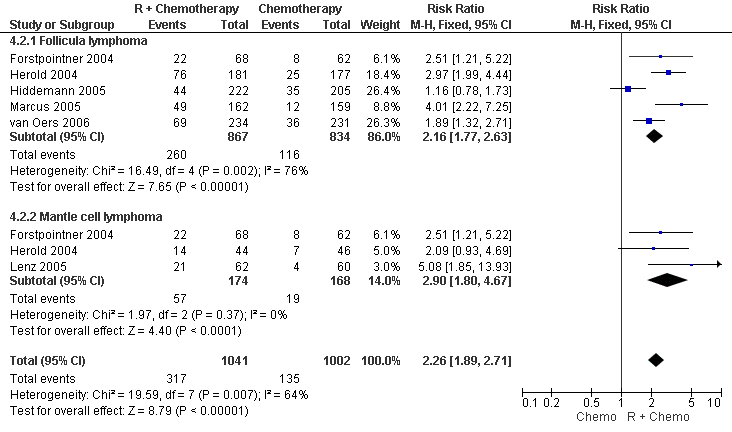
Forest plot of comparison: 4 Complete Response, outcome: 4.2 Complete Response FL vs MCL.
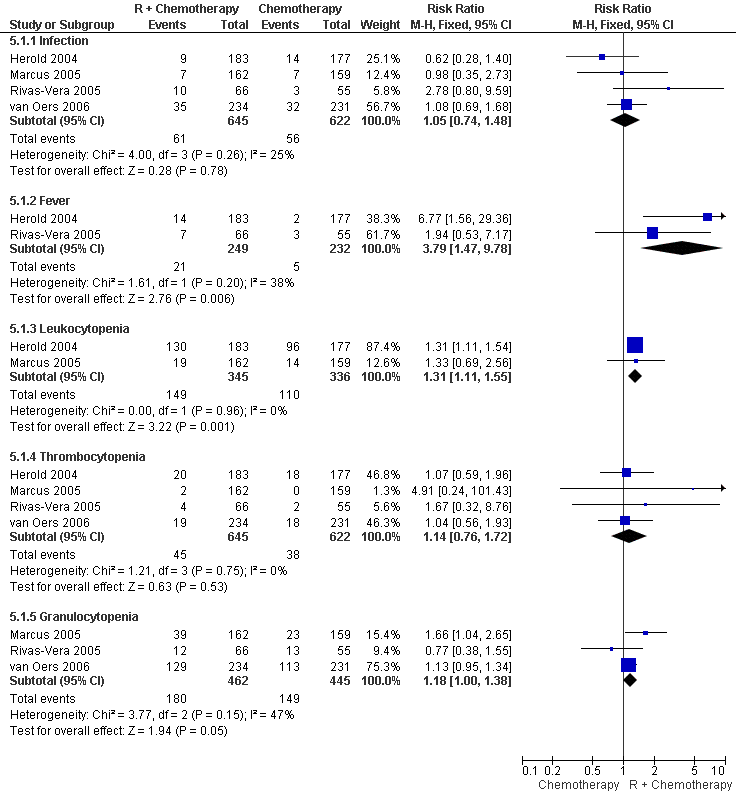
Forest plot of comparison: 5 Toxicity Grade 3/4, outcome: 5.1 Adverse events (number of patients).

Comparison 1 Overall survival, Outcome 1 Overall survival Total group.

Comparison 1 Overall survival, Outcome 2 Overall survival FL vs MCL.

Comparison 1 Overall survival, Outcome 3 Sensitivity: attrition bias.

Comparison 1 Overall survival, Outcome 4 Overall survival_Doxorubicin vs Mitoxantrone.
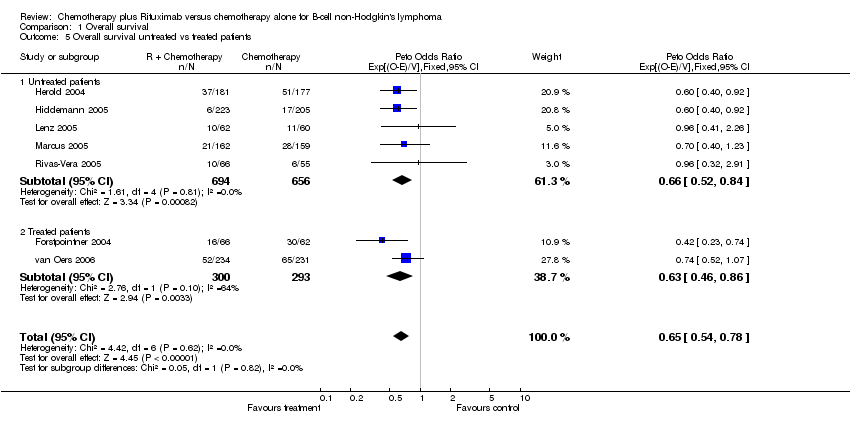
Comparison 1 Overall survival, Outcome 5 Overall survival untreated vs treated patients.

Comparison 1 Overall survival, Outcome 6 Overall survival_Anthracylin vs no‐Anthracylin treatment.
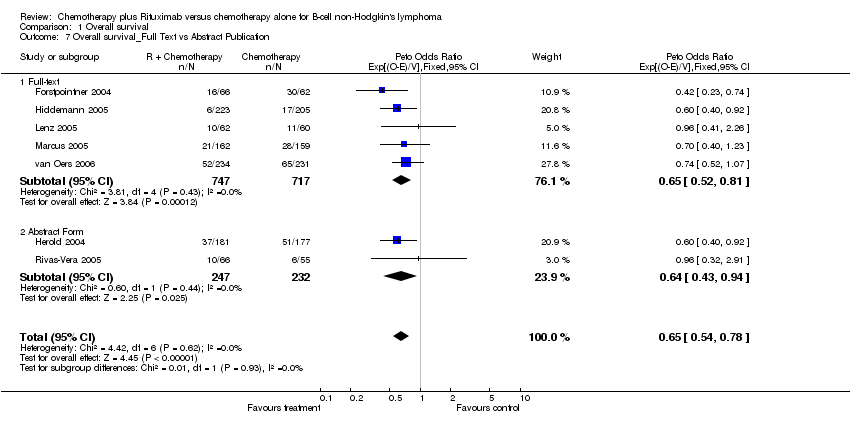
Comparison 1 Overall survival, Outcome 7 Overall survival_Full Text vs Abstract Publication.

Comparison 1 Overall survival, Outcome 8 Overall survival_Alloc. concealment.
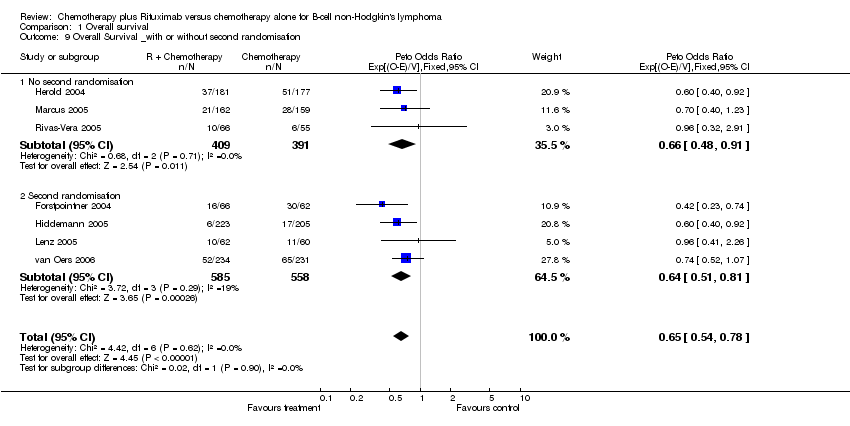
Comparison 1 Overall survival, Outcome 9 Overall Survival _with or without second randomisation.

Comparison 2 Disease Control, Outcome 1 FFS Total group.

Comparison 2 Disease Control, Outcome 2 FFS_FL vs MCL.

Comparison 2 Disease Control, Outcome 3 FFS_Sensitivity: attrition bias.

Comparison 2 Disease Control, Outcome 4 Disease control_Doxorubicin vs Mitoxantrone.

Comparison 2 Disease Control, Outcome 5 Disease control_untreated vs treated patients.

Comparison 2 Disease Control, Outcome 6 Disease control_Anthracylin vs no‐Anthracylin treatment.

Comparison 2 Disease Control, Outcome 7 Disease control_Full text vs abstract publication.
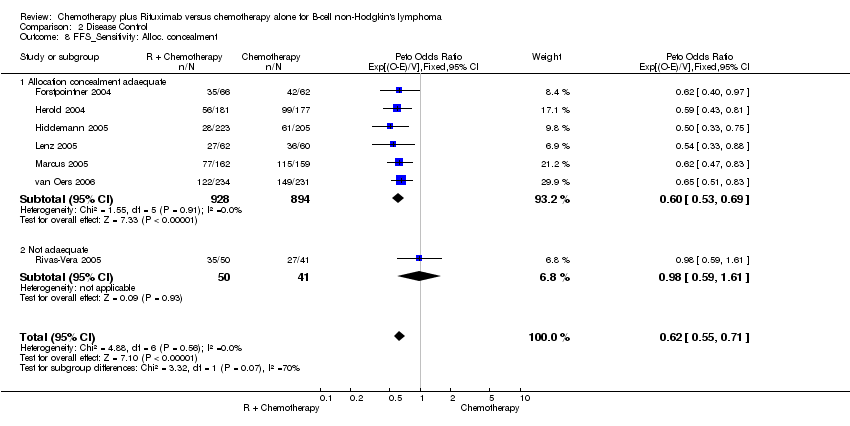
Comparison 2 Disease Control, Outcome 8 FFS_Sensitivity: Alloc. concealment.

Comparison 2 Disease Control, Outcome 9 FFS_Endpoints according to start of measurement.

Comparison 2 Disease Control, Outcome 10 FFS_Endpoints TTP, EFS, TTF, PFS.

Comparison 3 Overall Response, Outcome 1 Overall Response Total Group.

Comparison 3 Overall Response, Outcome 2 Overall Response FL vs MCL.
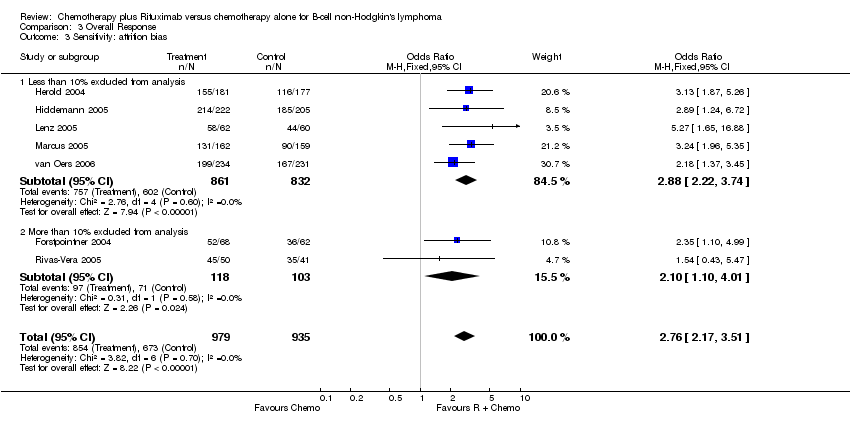
Comparison 3 Overall Response, Outcome 3 Sensitivity: attrition bias.

Comparison 3 Overall Response, Outcome 4 Overall Response_Doxorubicin vs Mitoxantrone.

Comparison 3 Overall Response, Outcome 5 Overall Response_untreated vs treated patients.

Comparison 3 Overall Response, Outcome 6 Overall response_Anthracyclin vs no‐Anthracyclin treatment.

Comparison 3 Overall Response, Outcome 7 Overall Response_Full text vs Abstract publication.

Comparison 3 Overall Response, Outcome 8 Overall Response Allocation concealment.

Comparison 4 Complete Response, Outcome 1 Complete Response Total Group.

Comparison 4 Complete Response, Outcome 2 Complete Response FL vs MCL.

Comparison 4 Complete Response, Outcome 3 Complete Response_Doxorubicine vs Mitoxantrone.

Comparison 4 Complete Response, Outcome 4 Complete Response_anthracycline vs no anthracyclin treatment.

Comparison 4 Complete Response, Outcome 5 Complete Response _untreated vs treated patients.

Comparison 5 Toxicity Grade 3/4, Outcome 1 Adverse events (number of patients).
| Author | Total Group (N) | FL (N) | MCL (N) | Unspecified lymphoma |
| Forstpointner 2004 | 128 | 65 | 48 | 15 |
| Herold 2004 | 358 | 201 | 90 | 67 |
| Hiddemann 2005 | 428 | 428 | not included | none |
| Lenz 2005 | 122 | none | 122 | none |
| Marcus 2005 | 321 | 321 | none | none |
| Rivas‐Vera 2005 | 121 | not applicable | not applicable | 121 |
| van Oers 2006 | 465 | 465 | none | none |
| Total amount | 1943 | 1480 | 260 | 203 |
| Author | Therapy | Previous therapy | Ann Arbor stage | High FLIPI risk | Observation time |
| Forstpointner 2004 | 4 x R‐FCM vs 4 x FCM | Yes | III/IV | not applicable | 18 months |
| Herold 2004 | 8 x R‐MCP vs 8 x MCP | No | III/IV | 55% | 36 months |
| Hiddemann 2005 | 6‐8 x R‐CHOP vs 6 to 8 x CHOP | No | III/IV | 45% | 36 months |
| Lenz 2005 | 6 x R‐CHOP vs 6 x CHOP | No | III/IV | 35 % (IPI high and high‐intermediate risk) | 18 months |
| Marcus 2005 | 8 x R‐CVP vs 8 CVP | No | III/IV | 45% | 18 months |
| Rivas‐Vera 2005 | 6 x R‐CNOP vs 6 x CNOP vs 6 x R | No | III/IV | not applicable | 24 months |
| van Oers 2006 | 8 x R‐CHOP vs 8 x CHOP | Yes | III/IV | 37% | 39 months |
| Author | ITT‐ Analysis | Allocation concealed | Drop outs | Source of data |
| Forstpointner 2004 | Yes | Yes | 13% | Full text |
| Herold 2004 | Yes | Yes | 0 | Abstract |
| Hiddemann 2005 | Yes | Yes | 0 | Full text |
| Lenz 2005 | Yes | Yes | 5% | Full text |
| Marcus 2005 | Yes | Yes | 1% | Full text |
| Rivas‐Vera 2005 | No | No | 13% | Abstract |
| van Oers 2006 | Yes | Yes | 0 | Full text |
| Outcome or subgroup title | No. of studies | No. of participants | Statistical method | Effect size |
| 1 Overall survival Total group Show forest plot | 7 | 1943 | Peto Odds Ratio (95% CI) | 0.65 [0.54, 0.78] |
| 2 Overall survival FL vs MCL Show forest plot | 6 | 1740 | Peto Odds Ratio (95% CI) | 0.63 [0.51, 0.77] |
| 2.1 Follicular lymphoma | 5 | 1480 | Peto Odds Ratio (95% CI) | 0.63 [0.51, 0.79] |
| 2.2 Mantlecell lymphoma | 3 | 260 | Peto Odds Ratio (95% CI) | 0.60 [0.37, 0.98] |
| 3 Sensitivity: attrition bias Show forest plot | 7 | 1943 | Peto Odds Ratio (95% CI) | 0.65 [0.54, 0.78] |
| 3.1 Less than 10% excluded from analysis | 5 | 1694 | Peto Odds Ratio (95% CI) | 0.68 [0.55, 0.83] |
| 3.2 More than 10% excluded from analysis | 2 | 249 | Peto Odds Ratio (95% CI) | 0.50 [0.30, 0.83] |
| 4 Overall survival_Doxorubicin vs Mitoxantrone Show forest plot | 6 | 1622 | Peto Odds Ratio (95% CI) | 0.64 [0.52, 0.79] |
| 4.1 Doxorubicin based regimen | 3 | 1015 | Peto Odds Ratio (95% CI) | 0.70 [0.54, 0.91] |
| 4.2 Mitoxantrone based regimen | 3 | 607 | Peto Odds Ratio (95% CI) | 0.56 [0.40, 0.77] |
| 5 Overall survival untreated vs treated patients Show forest plot | 7 | 1943 | Peto Odds Ratio (95% CI) | 0.65 [0.54, 0.78] |
| 5.1 Untreated patients | 5 | 1350 | Peto Odds Ratio (95% CI) | 0.66 [0.52, 0.84] |
| 5.2 Treated patients | 2 | 593 | Peto Odds Ratio (95% CI) | 0.63 [0.46, 0.86] |
| 6 Overall survival_Anthracylin vs no‐Anthracylin treatment Show forest plot | 7 | 1943 | Peto Odds Ratio (95% CI) | 0.65 [0.54, 0.78] |
| 6.1 Anthracyclin based regimen | 6 | 1622 | Peto Odds Ratio (95% CI) | 0.64 [0.52, 0.79] |
| 6.2 No anthracylin based regimen | 1 | 321 | Peto Odds Ratio (95% CI) | 0.70 [0.40, 1.23] |
| 7 Overall survival_Full Text vs Abstract Publication Show forest plot | 7 | 1943 | Peto Odds Ratio (95% CI) | 0.65 [0.54, 0.78] |
| 7.1 Full‐text | 5 | 1464 | Peto Odds Ratio (95% CI) | 0.65 [0.52, 0.81] |
| 7.2 Abstract Form | 2 | 479 | Peto Odds Ratio (95% CI) | 0.64 [0.43, 0.94] |
| 8 Overall survival_Alloc. concealment Show forest plot | 7 | 1943 | Peto Odds Ratio (95% CI) | 0.65 [0.54, 0.78] |
| 8.1 Adaequate | 6 | 1822 | Peto Odds Ratio (95% CI) | 0.64 [0.53, 0.78] |
| 8.2 Not adaequate | 1 | 121 | Peto Odds Ratio (95% CI) | 0.96 [0.32, 2.91] |
| 9 Overall Survival _with or without second randomisation Show forest plot | 7 | 1943 | Peto Odds Ratio (95% CI) | 0.65 [0.54, 0.78] |
| 9.1 No second randomisation | 3 | 800 | Peto Odds Ratio (95% CI) | 0.66 [0.48, 0.91] |
| 9.2 Second randomisation | 4 | 1143 | Peto Odds Ratio (95% CI) | 0.64 [0.51, 0.81] |
| Outcome or subgroup title | No. of studies | No. of participants | Statistical method | Effect size |
| 1 FFS Total group Show forest plot | 7 | 1913 | Peto Odds Ratio (95% CI) | 0.62 [0.55, 0.71] |
| 2 FFS_FL vs MCL Show forest plot | 5 | 1537 | Peto Odds Ratio (95% CI) | 0.58 [0.50, 0.67] |
| 2.1 Follicular lymphoma | 4 | 1415 | Peto Odds Ratio (95% CI) | 0.58 [0.50, 0.68] |
| 2.2 Mantlecell lymphoma | 1 | 122 | Peto Odds Ratio (95% CI) | 0.54 [0.33, 0.88] |
| 3 FFS_Sensitivity: attrition bias Show forest plot | 7 | 1913 | Peto Odds Ratio (95% CI) | 0.62 [0.55, 0.71] |
| 3.1 Less than 10% excluded from analysis | 5 | 1694 | Peto Odds Ratio (95% CI) | 0.60 [0.52, 0.69] |
| 3.2 More than 10% excluded from analysis | 2 | 219 | Peto Odds Ratio (95% CI) | 0.76 [0.55, 1.06] |
| 4 Disease control_Doxorubicin vs Mitoxantrone Show forest plot | 6 | 1592 | Peto Odds Ratio (95% CI) | 0.62 [0.54, 0.72] |
| 4.1 Doxorubicin based regimen | 3 | 1015 | Peto Odds Ratio (95% CI) | 0.60 [0.49, 0.72] |
| 4.2 Mitoxantrone based regimen | 3 | 577 | Peto Odds Ratio (95% CI) | 0.66 [0.53, 0.84] |
| 5 Disease control_untreated vs treated patients Show forest plot | 7 | 1913 | Peto Odds Ratio (95% CI) | 0.62 [0.55, 0.71] |
| 5.1 Untreated patients | 5 | 1320 | Peto Odds Ratio (95% CI) | 0.61 [0.52, 0.72] |
| 5.2 Treated patients | 2 | 593 | Peto Odds Ratio (95% CI) | 0.65 [0.52, 0.80] |
| 6 Disease control_Anthracylin vs no‐Anthracylin treatment Show forest plot | 7 | 1913 | Peto Odds Ratio (95% CI) | 0.62 [0.55, 0.71] |
| 6.1 Anthracyclin based regimen | 6 | 1592 | Peto Odds Ratio (95% CI) | 0.62 [0.54, 0.72] |
| 6.2 No anthracylin based regimen | 1 | 321 | Peto Odds Ratio (95% CI) | 0.62 [0.47, 0.83] |
| 7 Disease control_Full text vs abstract publication Show forest plot | 7 | 1913 | Peto Odds Ratio (95% CI) | 0.62 [0.55, 0.71] |
| 7.1 Full ‐Text | 5 | 1464 | Peto Odds Ratio (95% CI) | 0.61 [0.52, 0.71] |
| 7.2 Abstract form | 2 | 449 | Peto Odds Ratio (95% CI) | 0.68 [0.52, 0.89] |
| 8 FFS_Sensitivity: Alloc. concealment Show forest plot | 7 | 1913 | Peto Odds Ratio (95% CI) | 0.62 [0.55, 0.71] |
| 8.1 Allocation concealment adaequate | 6 | 1822 | Peto Odds Ratio (95% CI) | 0.60 [0.53, 0.69] |
| 8.2 Not adaequate | 1 | 91 | Peto Odds Ratio (95% CI) | 0.98 [0.59, 1.61] |
| 9 FFS_Endpoints according to start of measurement Show forest plot | 6 | 1785 | Peto Odds Ratio (95% CI) | 0.62 [0.55, 0.72] |
| 9.1 Start of treatment | 5 | 1427 | Peto Odds Ratio (95% CI) | 0.63 [0.54, 0.74] |
| 9.2 End of treatment | 1 | 358 | Peto Odds Ratio (95% CI) | 0.59 [0.43, 0.81] |
| 10 FFS_Endpoints TTP, EFS, TTF, PFS Show forest plot | 6 | Peto Odds Ratio (95% CI) | Subtotals only | |
| 10.1 Time to progression | 2 | 412 | Peto Odds Ratio (95% CI) | 0.69 [0.54, 0.89] |
| 10.2 Progression free survival | 2 | 587 | Peto Odds Ratio (95% CI) | 0.63 [0.51, 0.78] |
| 10.3 Time to treatment failure | 2 | 550 | Peto Odds Ratio (95% CI) | 0.51 [0.37, 0.70] |
| 10.4 Event free survival | 1 | 201 | Peto Odds Ratio (95% CI) | 0.41 [0.26, 0.64] |
| Outcome or subgroup title | No. of studies | No. of participants | Statistical method | Effect size |
| 1 Overall Response Total Group Show forest plot | 7 | 1914 | Risk Ratio (M‐H, Fixed, 95% CI) | 1.21 [1.16, 1.27] |
| 2 Overall Response FL vs MCL Show forest plot | 7 | 1830 | Risk Ratio (M‐H, Fixed, 95% CI) | 1.19 [1.14, 1.24] |
| 2.1 follicular | 6 | 1570 | Risk Ratio (M‐H, Fixed, 95% CI) | 1.19 [1.13, 1.24] |
| 2.2 Mantle cell | 3 | 260 | Risk Ratio (M‐H, Fixed, 95% CI) | 1.22 [1.05, 1.42] |
| 3 Sensitivity: attrition bias Show forest plot | 7 | 1914 | Odds Ratio (M‐H, Fixed, 95% CI) | 2.76 [2.17, 3.51] |
| 3.1 Less than 10% excluded from analysis | 5 | 1693 | Odds Ratio (M‐H, Fixed, 95% CI) | 2.88 [2.22, 3.74] |
| 3.2 More than 10% excluded from analysis | 2 | 221 | Odds Ratio (M‐H, Fixed, 95% CI) | 2.10 [1.10, 4.01] |
| 4 Overall Response_Doxorubicin vs Mitoxantrone Show forest plot | 6 | 1593 | Odds Ratio (M‐H, Fixed, 95% CI) | 2.63 [1.99, 3.46] |
| 4.1 Doxorubicin based regimen | 3 | 1014 | Odds Ratio (M‐H, Fixed, 95% CI) | 2.58 [1.76, 3.76] |
| 4.2 Mitoxantrone based regimen | 3 | 579 | Odds Ratio (M‐H, Fixed, 95% CI) | 2.69 [1.80, 4.03] |
| 5 Overall Response_untreated vs treated patients Show forest plot | 7 | 1914 | Risk Ratio (M‐H, Fixed, 95% CI) | 1.21 [1.16, 1.27] |
| 5.1 Untreated patients | 5 | 1319 | Risk Ratio (M‐H, Fixed, 95% CI) | 1.21 [1.15, 1.28] |
| 5.2 Treated patients | 2 | 595 | Risk Ratio (M‐H, Fixed, 95% CI) | 1.20 [1.10, 1.32] |
| 6 Overall response_Anthracyclin vs no‐Anthracyclin treatment Show forest plot | 7 | 1914 | Odds Ratio (M‐H, Fixed, 95% CI) | 2.76 [2.17, 3.51] |
| 6.1 Anthracyclin based regimen | 6 | 1593 | Odds Ratio (M‐H, Fixed, 95% CI) | 2.63 [1.99, 3.46] |
| 6.2 No Anthracyclin based regimen | 1 | 321 | Odds Ratio (M‐H, Fixed, 95% CI) | 3.24 [1.96, 5.35] |
| 7 Overall Response_Full text vs Abstract publication Show forest plot | 7 | 1914 | Risk Ratio (M‐H, Fixed, 95% CI) | 1.21 [1.16, 1.27] |
| 7.1 Full Text | 5 | 1465 | Risk Ratio (M‐H, Fixed, 95% CI) | 1.20 [1.14, 1.26] |
| 7.2 Abstract form | 2 | 449 | Risk Ratio (M‐H, Fixed, 95% CI) | 1.24 [1.12, 1.38] |
| 8 Overall Response Allocation concealment Show forest plot | 7 | 1914 | Risk Ratio (M‐H, Fixed, 95% CI) | 1.21 [1.16, 1.27] |
| 8.1 Adaequate | 6 | 1823 | Risk Ratio (M‐H, Fixed, 95% CI) | 1.22 [1.16, 1.28] |
| 8.2 Not adaequate | 1 | 91 | Risk Ratio (M‐H, Fixed, 95% CI) | 1.05 [0.90, 1.23] |
| Outcome or subgroup title | No. of studies | No. of participants | Statistical method | Effect size |
| 1 Complete Response Total Group Show forest plot | 7 | 1914 | Risk Ratio (M‐H, Fixed, 95% CI) | 2.03 [1.71, 2.40] |
| 2 Complete Response FL vs MCL Show forest plot | 6 | 2043 | Risk Ratio (M‐H, Fixed, 95% CI) | 2.26 [1.89, 2.71] |
| 2.1 Follicula lymphoma | 5 | 1701 | Risk Ratio (M‐H, Fixed, 95% CI) | 2.16 [1.77, 2.63] |
| 2.2 Mantle cell lymphoma | 3 | 342 | Risk Ratio (M‐H, Fixed, 95% CI) | 2.90 [1.80, 4.67] |
| 3 Complete Response_Doxorubicine vs Mitoxantrone Show forest plot | 6 | 1593 | Risk Ratio (M‐H, Fixed, 95% CI) | 1.85 [1.55, 2.21] |
| 3.1 Mitixantrone based regimen | 3 | 579 | Risk Ratio (M‐H, Fixed, 95% CI) | 2.02 [1.58, 2.59] |
| 3.2 Doxorubicine based regimen | 3 | 1014 | Risk Ratio (M‐H, Fixed, 95% CI) | 1.71 [1.33, 2.21] |
| 4 Complete Response_anthracycline vs no anthracyclin treatment Show forest plot | 7 | 1914 | Risk Ratio (M‐H, Fixed, 95% CI) | 2.03 [1.71, 2.40] |
| 4.1 Anthracyclin based regimen | 6 | 1593 | Risk Ratio (M‐H, Fixed, 95% CI) | 1.85 [1.55, 2.21] |
| 4.2 No Anthracyclin based regimen | 1 | 321 | Risk Ratio (M‐H, Fixed, 95% CI) | 4.01 [2.22, 7.25] |
| 5 Complete Response _untreated vs treated patients Show forest plot | 7 | 1914 | Risk Ratio (M‐H, Fixed, 95% CI) | 2.03 [1.71, 2.40] |
| 5.1 Complete remission untreated patients | 5 | 1319 | Risk Ratio (M‐H, Fixed, 95% CI) | 2.03 [1.66, 2.48] |
| 5.2 Complete remission_treated patients | 2 | 595 | Risk Ratio (M‐H, Fixed, 95% CI) | 2.01 [1.45, 2.77] |
| Outcome or subgroup title | No. of studies | No. of participants | Statistical method | Effect size |
| 1 Adverse events (number of patients) Show forest plot | 4 | Risk Ratio (M‐H, Fixed, 95% CI) | Subtotals only | |
| 1.1 Infection | 4 | 1267 | Risk Ratio (M‐H, Fixed, 95% CI) | 1.05 [0.74, 1.48] |
| 1.2 Fever | 2 | 481 | Risk Ratio (M‐H, Fixed, 95% CI) | 3.79 [1.47, 9.78] |
| 1.3 Leukocytopenia | 2 | 681 | Risk Ratio (M‐H, Fixed, 95% CI) | 1.31 [1.11, 1.55] |
| 1.4 Thrombocytopenia | 4 | 1267 | Risk Ratio (M‐H, Fixed, 95% CI) | 1.14 [0.76, 1.72] |
| 1.5 Granulocytopenia | 3 | 907 | Risk Ratio (M‐H, Fixed, 95% CI) | 1.18 [1.00, 1.38] |