Corticosteroides y agonistas beta2 de acción prolongada combinados en un solo inhalador versus placebo para la enfermedad pulmonar obstructiva crónica
Appendices
Appendix 1. Sources and search methods for the Cochrane Airways Group Specialised Register (CAGR)
Electronic searches: core databases
| Database | Frequency of search |
| CENTRAL (The Cochrane Library) | Monthly |
| MEDLINE (Ovid) | Weekly |
| EMBASE (Ovid) | Weekly |
| PsycINFO (Ovid) | Monthly |
| CINAHL (EBSCO) | Monthly |
| AMED (EBSCO) | Monthly |
Handsearches: core respiratory conference abstracts
| Conference | Years searched |
| American Academy of Allergy, Asthma and Immunology (AAAAI) | 2001 onwards |
| American Thoracic Society (ATS) | 2001 onwards |
| Asia Pacific Society of Respirology (APSR) | 2004 onwards |
| British Thoracic Society Winter Meeting (BTS) | 2000 onwards |
| Chest Meeting | 2003 onwards |
| European Respiratory Society (ERS) | 1992, 1994, 2000 onwards |
| International Primary Care Respiratory Group Congress (IPCRG) | 2002 onwards |
| Thoracic Society of Australia and New Zealand (TSANZ) | 1999 onwards |
MEDLINE search strategy used to identify trials for the CAGR
COPD search
1. Lung Diseases, Obstructive/
2. exp Pulmonary Disease, Chronic Obstructive/
3. emphysema$.mp.
4. (chronic$ adj3 bronchiti$).mp.
5. (obstruct$ adj3 (pulmonary or lung$ or airway$ or airflow$ or bronch$ or respirat$)).mp.
6. COPD.mp.
7. COAD.mp.
8. COBD.mp.
9. AECB.mp.
10. or/1‐9
Filter to identify RCTs
1. exp "clinical trial (publication type)"/
2. (randomised or randomised).ab,ti.
3. placebo.ab,ti.
4. dt.fs.
5. randomly.ab,ti.
6. trial.ab,ti.
7. groups.ab,ti.
8. or/1‐7
9. Animals/
10. Humans/
11. 9 not (9 and 10)
12. 8 not 11
The MEDLINE strategy and the RCT filter are adapted to identify trials in other electronic databases.
Appendix 2. Definitions of exacerbations
| Study ID | Definition of exacerbation |
| No definition found | |
| No definition found | |
| Mild exacerbations = number of days with intake of four or more puffs of rescue medication Severe exacerbation = intake of a course of oral steroids and/or antibiotics and/or hospitalisation due to respiratory symptoms | |
| Mild exacerbation = requiring increased use of salbutamol prn by > 2 occasions/24 hour period on two or more consecutive days compared with the baseline mean of last seven days of run‐in period Moderate exacerbation = requiring treatment with antibiotics and/or oral corticosteroids Severe exacerbation = requiring emergency hospital treatment and/or hospitalisation | |
| Mild exacerbation = clinically judged deterioration of COPD symptoms (managed with increased short‐acting bronchodilator use: ≥ 12 inhalations/d of SABA/short‐acting anticholinergic, or ≥ 2 nebulized treatments/d of 2.5 mg SABA/short‐acting anticholinergic) on any two consecutive days Moderate exacerbation = clinically judged deterioration of COPD with an acute change in symptoms that required antibiotic and/or oral steroid treatment for lower airway disease Severe exacerbation = deterioration of COPD that resulted in emergency treatment or hospitalisation due to COPD | |
| Moderate exacerbation = requiring treatment with antibiotics and/or corticosteroids Severe exacerbation = requiring hospitalisation | |
| No definition found | |
| “exacerbations defined by treatment”—no further details | |
| No definition found | |
| “a course of oral steroids and/or hospitalisation due to a worsening of COPD” | |
| No definition found | |
| No definition found | |
| “Exacerbations were defined as worsening of COPD symptoms leading to hospitalisation, a visit to the emergency room, or use of an antimicrobial agent and/or systemic corticosteroids as an outpatient” | |
| Mild exacerbations = a day with ≥ 4 inhalations of reliever medication above the mean run‐in use Severe exacerbation = use of oral steroids and/or antibiotics and/or hospitalisation due to respiratory symptoms | |
| “Worsening of COPD symptoms that required treatment with oral corticosteroids and/or hospitalisation” | |
| Mild exacerbation = clinically judged deterioration of COPD symptoms (managed with increased short‐acting bronchodilator use: ≥ 12 inhalations/d of SABA/short‐acting anticholinergic, or ≥ 2 nebulized treatments/d of 2.5 mg SABA/short‐acting anticholinergic) on any two consecutive days Moderate exacerbation = clinically judged deterioration of COPD with an acute change in symptoms that required antibiotic and/or oral steroid treatment for lower airway disease Severe exacerbation = deterioration of COPD that resulted in emergency treatment or hospitalisation due to COPD | |
| “A symptomatic deterioration requiring treatment with antibiotic agents, systemic corticosteroids, hospitalisation, or a combination of these” | |
| “Exacerbations were defined a priori as a worsening of COPD symptoms that required treatment with antibiotics, oral corticosteroids, or both. Episodes that required corticosteroid treatment or hospital admission were noted separately” | |
| “A worsening of symptoms that required treatment with antibiotics or oral corticosteroids and/or hospitalisation” (analysed separately as those requiring antibiotics, those requiring corticosteroids, those requiring hospitalisation) |
Appendix 3. Definitions of pneumonia
| Study ID | Definition of pneumonia |
| No definition found | |
| No definition found | |
| No definition found | |
| No definition found | |
| “Including the AE terms of pneumonia, pneumonia viral, pneumonia aspiration, and lobar pneumonia” | |
| No definition found | |
| No definition found | |
| No definition found | |
| No definition found | |
| “Pneumonia events were reported by physicians based on the Medical Dictionary for Regulatory Activities (version 10.0) pneumonia‐related preferred terms (pneumonia, bronchopneumonia, lobar pneumonia or pneumonia staphylococcal)” | |
| No definition found | |
| No definition found | |
| No definition found | |
| No definition found | |
| “Diagnosis of pneumonia was generally based on clinical judgment, without radiological confirmation in all cases” | |
| “Including the AE terms of pneumonia, pneumonia viral, pneumonia aspiration, and lobar pneumonia” | |
| “Since the finding was unexpected, there was no prospective definition of pneumonia in the study protocol (e.g. confirmation on chest radiography)” | |
| No definition found | |
| No definition found |

Methodological quality summary: review authors' judgements about each methodological quality item for each included study.

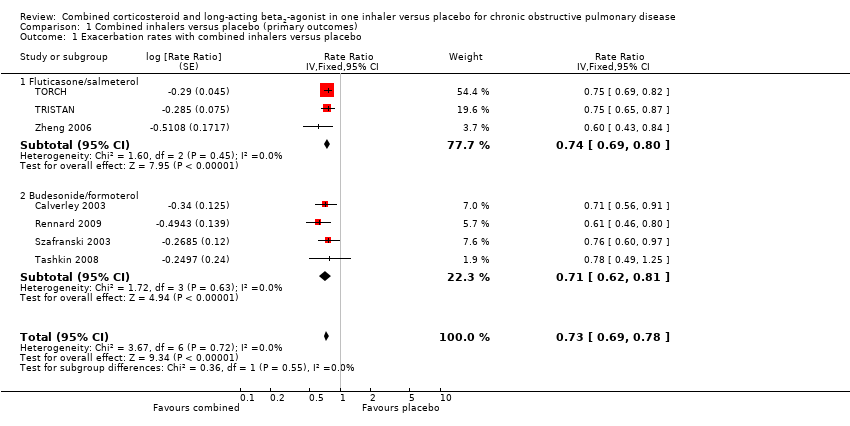
Forest plot of comparison: 1 Combined inhalers versus placebo (primary outcomes), outcome: 1.1 Exacerbation rates with combined inhalers versus placebo.

Forest plot of comparison: 1 Combined inhalers versus placebo (primary outcomes), outcome: 1.2 Mortality.

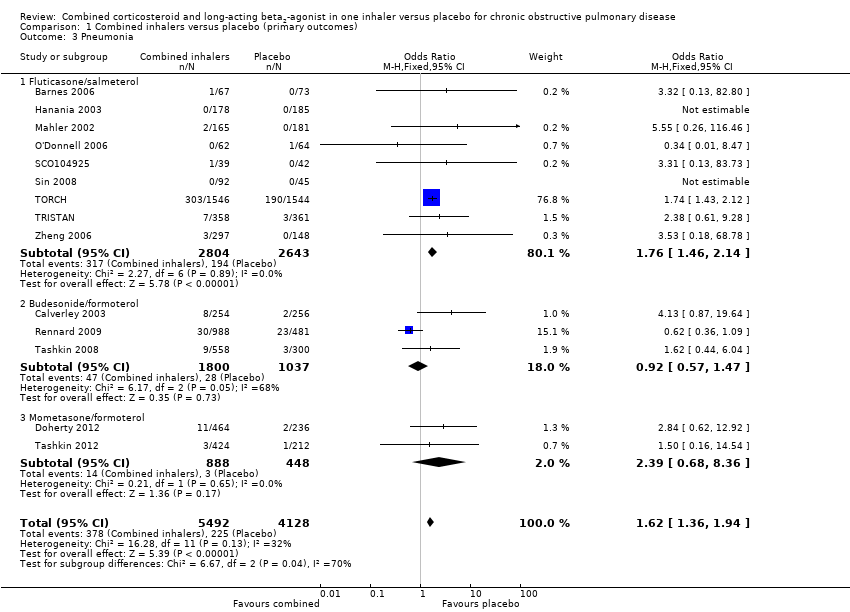
Forest plot of comparison: 1 Combined inhalers versus placebo (primary outcomes), outcome: 1.3 Pneumonia.
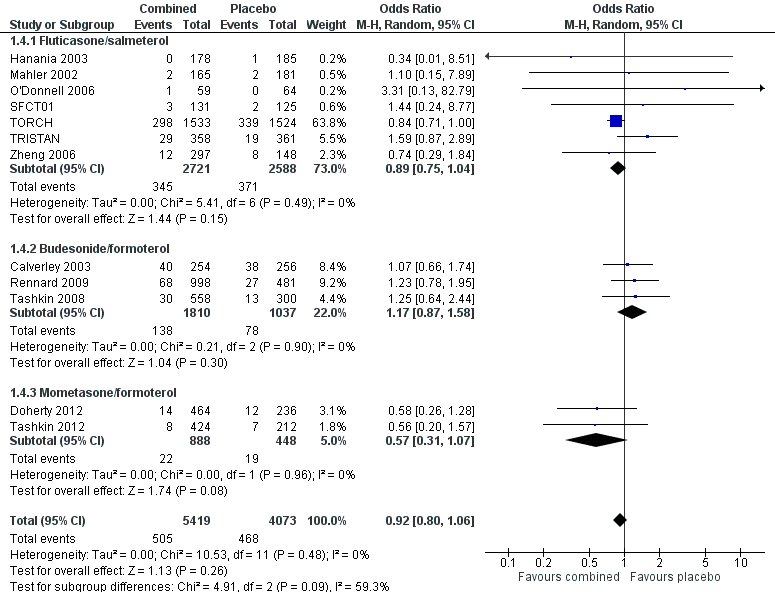
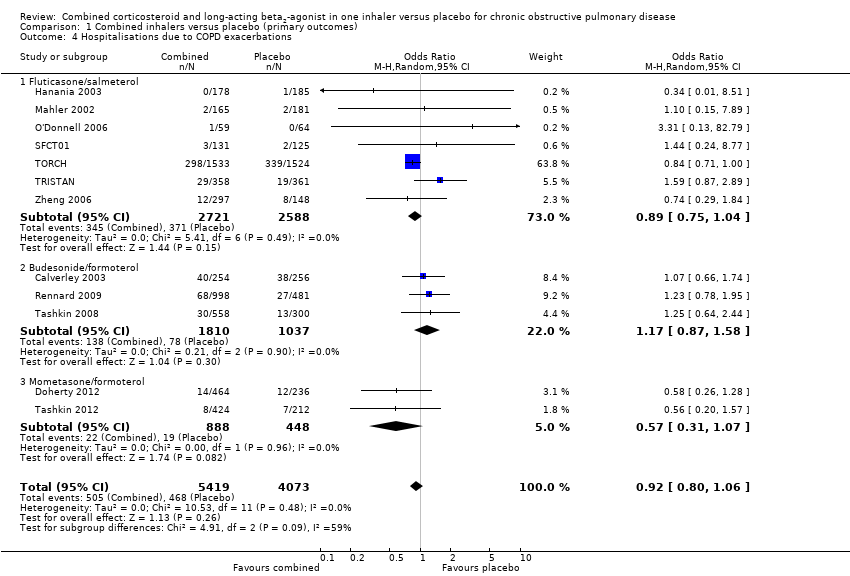
Forest plot of comparison: 1 Combined inhalers versus placebo (primary outcomes), outcome: 1.4 Hospitalisations due to COPD exacerbations.

Funnel plot of comparison: 1 Combined inhalers versus placebo (primary outcomes), outcome: 1.2 Mortality.
Comparison 1 Combined inhalers versus placebo (primary outcomes), Outcome 1 Exacerbation rates with combined inhalers versus placebo.

Comparison 1 Combined inhalers versus placebo (primary outcomes), Outcome 2 Mortality.
Comparison 1 Combined inhalers versus placebo (primary outcomes), Outcome 3 Pneumonia.
Comparison 1 Combined inhalers versus placebo (primary outcomes), Outcome 4 Hospitalisations due to COPD exacerbations.

Comparison 1 Combined inhalers versus placebo (primary outcomes), Outcome 5 Number of participants with at least one exacerbation.

Comparison 2 Fluticasone/salmeterol (FPS) versus placebo (PLA), Outcome 1 Exacerbations.

Comparison 2 Fluticasone/salmeterol (FPS) versus placebo (PLA), Outcome 2 Number of participants with at least one exacerbation.

Comparison 2 Fluticasone/salmeterol (FPS) versus placebo (PLA), Outcome 3 Participants with at least one exacerbation by type.
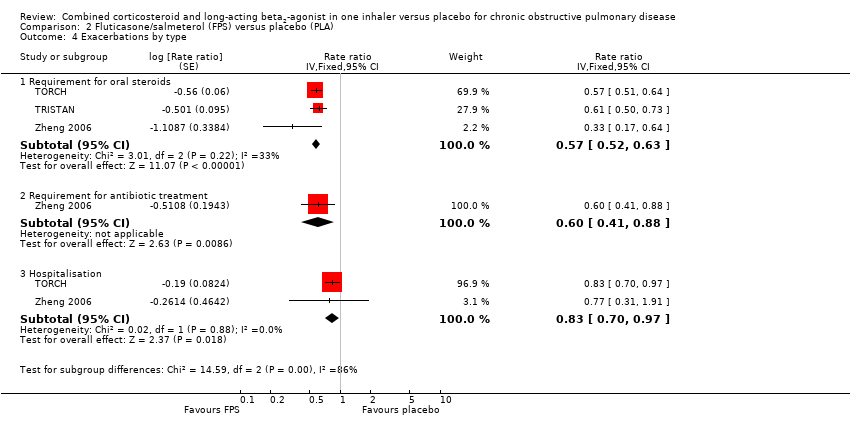
Comparison 2 Fluticasone/salmeterol (FPS) versus placebo (PLA), Outcome 4 Exacerbations by type.

Comparison 2 Fluticasone/salmeterol (FPS) versus placebo (PLA), Outcome 5 Mortality.
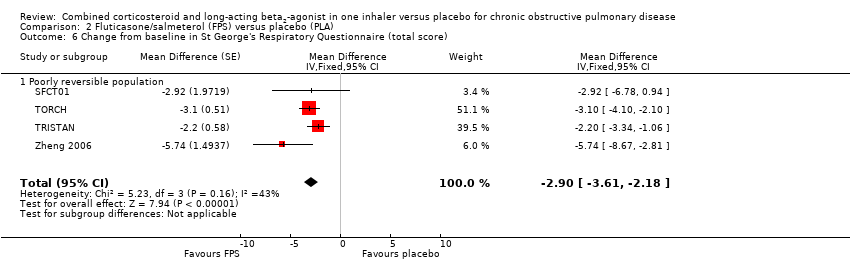
Comparison 2 Fluticasone/salmeterol (FPS) versus placebo (PLA), Outcome 6 Change from baseline in St George's Respiratory Questionnaire (total score).

Comparison 2 Fluticasone/salmeterol (FPS) versus placebo (PLA), Outcome 7 Change from baseline in Chronic Respiratory Disease Questionnaire scores.

Comparison 2 Fluticasone/salmeterol (FPS) versus placebo (PLA), Outcome 8 Change from baseline in Transitional Dyspnoea Index (TDI) scores.

Comparison 2 Fluticasone/salmeterol (FPS) versus placebo (PLA), Outcome 9 Change from baseline in predose FEV1.

Comparison 2 Fluticasone/salmeterol (FPS) versus placebo (PLA), Outcome 10 Change from baseline in postdose FEV1.
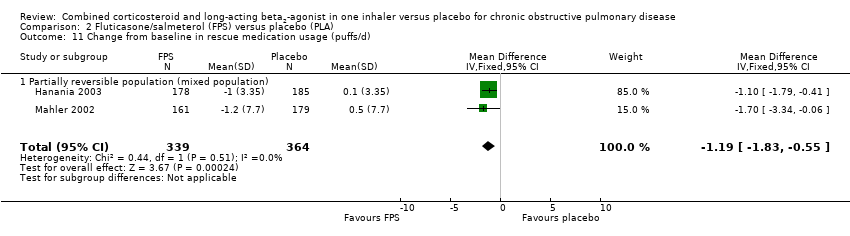
Comparison 2 Fluticasone/salmeterol (FPS) versus placebo (PLA), Outcome 11 Change from baseline in rescue medication usage (puffs/d).
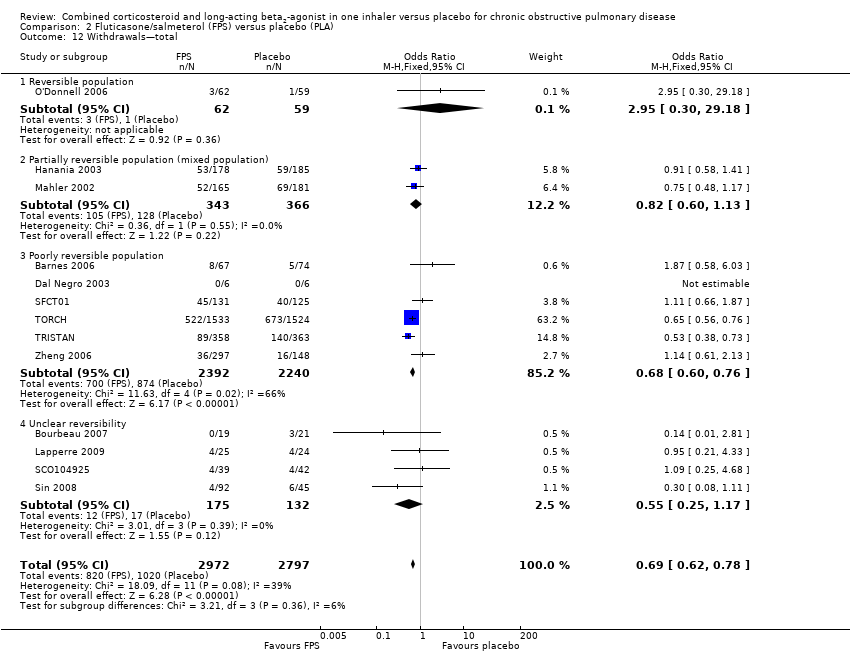
Comparison 2 Fluticasone/salmeterol (FPS) versus placebo (PLA), Outcome 12 Withdrawals—total.

Comparison 2 Fluticasone/salmeterol (FPS) versus placebo (PLA), Outcome 13 Withdrawals due to adverse events.

Comparison 2 Fluticasone/salmeterol (FPS) versus placebo (PLA), Outcome 14 Withdrawals due to lack of efficacy.
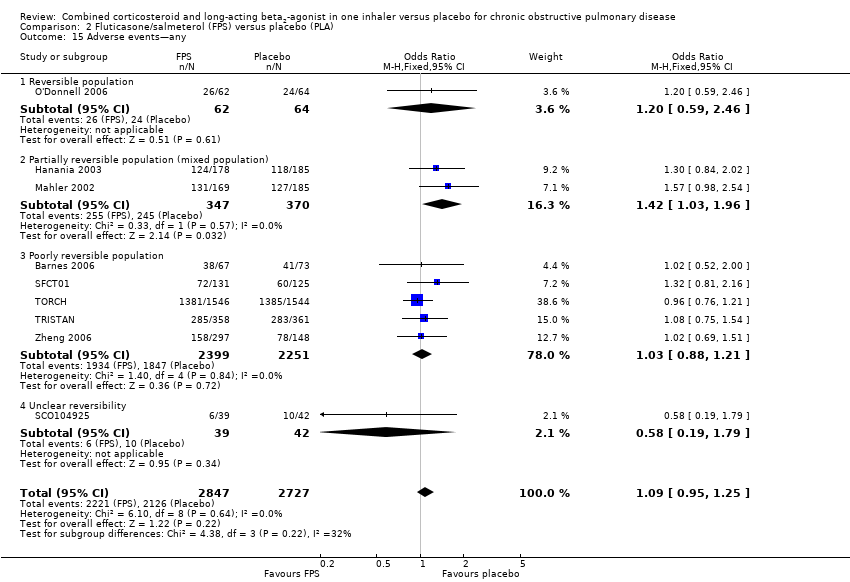
Comparison 2 Fluticasone/salmeterol (FPS) versus placebo (PLA), Outcome 15 Adverse events—any.

Comparison 2 Fluticasone/salmeterol (FPS) versus placebo (PLA), Outcome 16 Adverse events—'serious'.
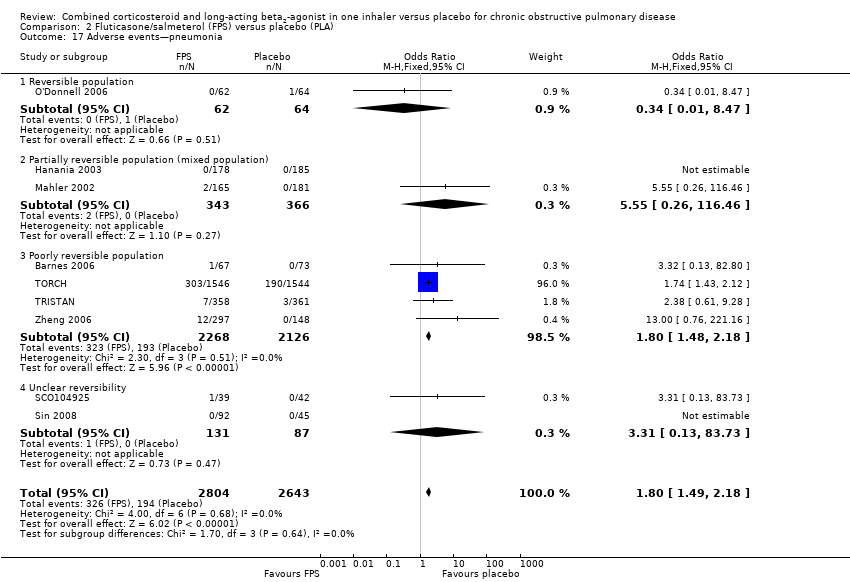
Comparison 2 Fluticasone/salmeterol (FPS) versus placebo (PLA), Outcome 17 Adverse events—pneumonia.

Comparison 2 Fluticasone/salmeterol (FPS) versus placebo (PLA), Outcome 18 Adverse events—candidiasis.

Comparison 2 Fluticasone/salmeterol (FPS) versus placebo (PLA), Outcome 19 Adverse events—hoarseness.

Comparison 2 Fluticasone/salmeterol (FPS) versus placebo (PLA), Outcome 20 Adverse events—palpitations.

Comparison 2 Fluticasone/salmeterol (FPS) versus placebo (PLA), Outcome 21 Adverse events—blood glucose increased.

Comparison 2 Fluticasone/salmeterol (FPS) versus placebo (PLA), Outcome 22 Adverse event—skin bruising.
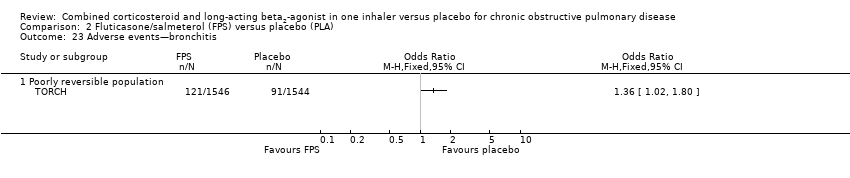
Comparison 2 Fluticasone/salmeterol (FPS) versus placebo (PLA), Outcome 23 Adverse events—bronchitis.

Comparison 2 Fluticasone/salmeterol (FPS) versus placebo (PLA), Outcome 24 Adverse events—upper respiratory tract infection.

Comparison 2 Fluticasone/salmeterol (FPS) versus placebo (PLA), Outcome 25 Adverse events—nasopharyngitis.

Comparison 2 Fluticasone/salmeterol (FPS) versus placebo (PLA), Outcome 26 Adverse events—cough.

Comparison 2 Fluticasone/salmeterol (FPS) versus placebo (PLA), Outcome 27 Adverse events—headache.

Comparison 3 Budesonide/formoterol (BDF) versus placebo (PLA), Outcome 1 Severe exacerbations.

Comparison 3 Budesonide/formoterol (BDF) versus placebo (PLA), Outcome 2 Mean severe exacerbation rates per participant per year.
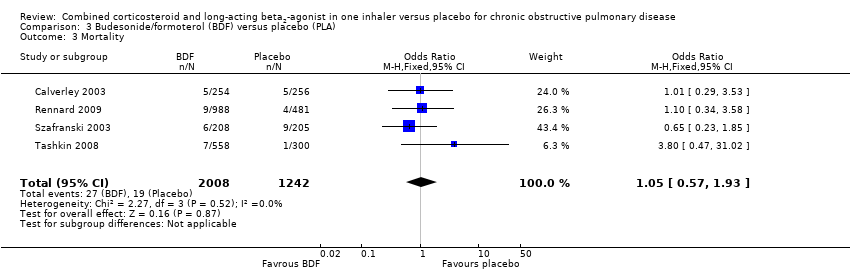
Comparison 3 Budesonide/formoterol (BDF) versus placebo (PLA), Outcome 3 Mortality.
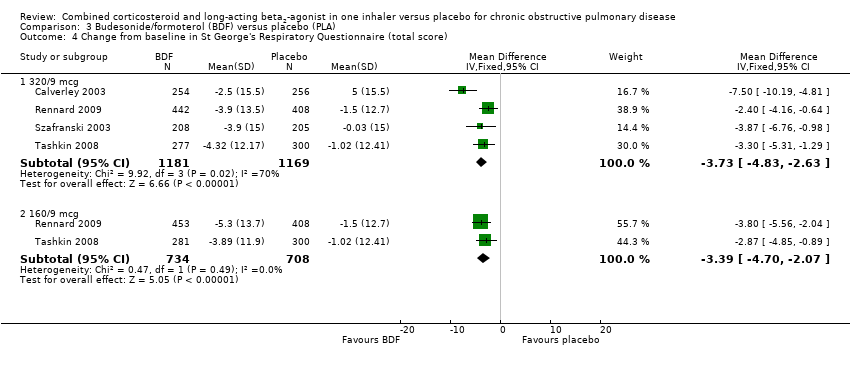
Comparison 3 Budesonide/formoterol (BDF) versus placebo (PLA), Outcome 4 Change from baseline in St George's Respiratory Questionnaire (total score).

Comparison 3 Budesonide/formoterol (BDF) versus placebo (PLA), Outcome 5 Quality of life—change scores.

Comparison 3 Budesonide/formoterol (BDF) versus placebo (PLA), Outcome 6 Symptoms (change scores).

Comparison 3 Budesonide/formoterol (BDF) versus placebo (PLA), Outcome 7 Breathlessness, cough and sputum score (BCSS) change from baseline—average over treatment period.
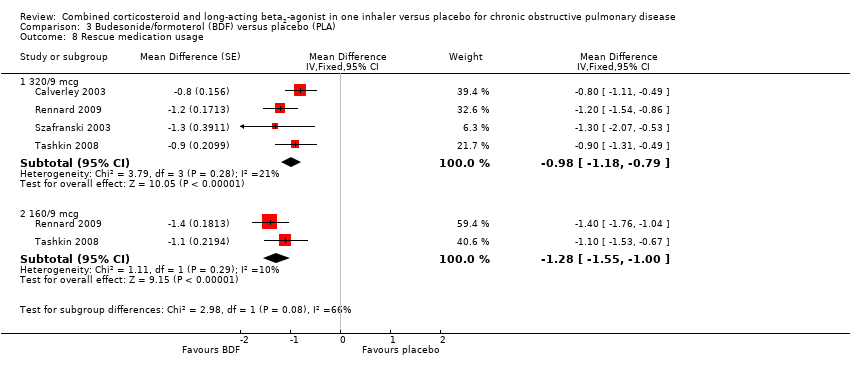
Comparison 3 Budesonide/formoterol (BDF) versus placebo (PLA), Outcome 8 Rescue medication usage.

Comparison 3 Budesonide/formoterol (BDF) versus placebo (PLA), Outcome 9 Mean FEV1 (% change from baseline).

Comparison 3 Budesonide/formoterol (BDF) versus placebo (PLA), Outcome 10 Average 12‐hour FEV1 change from baseline—end of treatment (L).
![Comparison 3 Budesonide/formoterol (BDF) versus placebo (PLA), Outcome 11 Predose FEV1 [L] change from baseline to the average over the randomised treatment period.](/es/cdsr/doi/10.1002/14651858.CD003794.pub4/media/CDSR/CD003794/image_n/nCD003794-CMP-003-11.png)
Comparison 3 Budesonide/formoterol (BDF) versus placebo (PLA), Outcome 11 Predose FEV1 [L] change from baseline to the average over the randomised treatment period.
![Comparison 3 Budesonide/formoterol (BDF) versus placebo (PLA), Outcome 12 1 Hour postdose FEV1 [L] change from baseline to the average over the randomised treatment period.](/es/cdsr/doi/10.1002/14651858.CD003794.pub4/media/CDSR/CD003794/image_n/nCD003794-CMP-003-12.png)
Comparison 3 Budesonide/formoterol (BDF) versus placebo (PLA), Outcome 12 1 Hour postdose FEV1 [L] change from baseline to the average over the randomised treatment period.

Comparison 3 Budesonide/formoterol (BDF) versus placebo (PLA), Outcome 13 FEV1 at 12‐hour change from baseline—end of treatment (L).

Comparison 3 Budesonide/formoterol (BDF) versus placebo (PLA), Outcome 14 Morning PEFR change from baseline, average over treatment period (L/min).

Comparison 3 Budesonide/formoterol (BDF) versus placebo (PLA), Outcome 15 Evening PEFR mean change from baseline, average over treatment period (L/min).

Comparison 3 Budesonide/formoterol (BDF) versus placebo (PLA), Outcome 16 Withdrawals—total.

Comparison 3 Budesonide/formoterol (BDF) versus placebo (PLA), Outcome 17 Withdrawals due to adverse events.
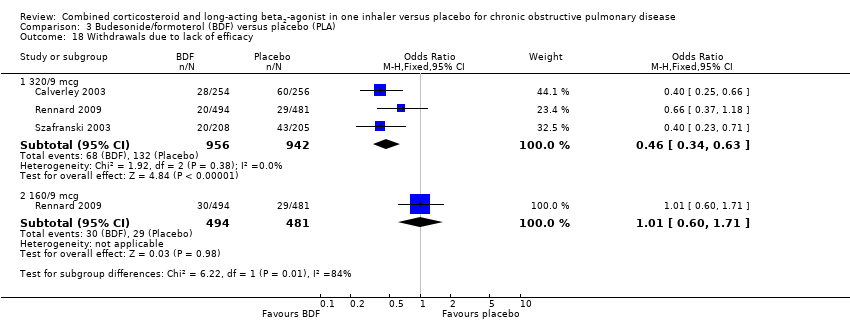
Comparison 3 Budesonide/formoterol (BDF) versus placebo (PLA), Outcome 18 Withdrawals due to lack of efficacy.

Comparison 3 Budesonide/formoterol (BDF) versus placebo (PLA), Outcome 19 Adverse event—any.

Comparison 3 Budesonide/formoterol (BDF) versus placebo (PLA), Outcome 20 Adverse events—'serious'.

Comparison 3 Budesonide/formoterol (BDF) versus placebo (PLA), Outcome 21 Adverse events—pneumonia.
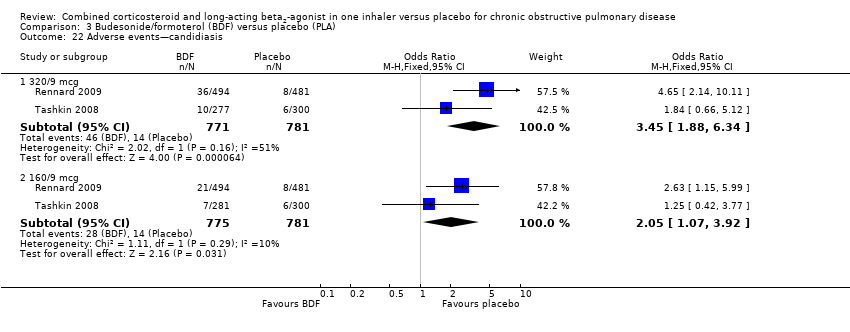
Comparison 3 Budesonide/formoterol (BDF) versus placebo (PLA), Outcome 22 Adverse events—candidiasis.

Comparison 3 Budesonide/formoterol (BDF) versus placebo (PLA), Outcome 23 Adverse events—dysphonia.

Comparison 3 Budesonide/formoterol (BDF) versus placebo (PLA), Outcome 24 Adverse events—cataracts.

Comparison 3 Budesonide/formoterol (BDF) versus placebo (PLA), Outcome 25 Adverse events—COPD.
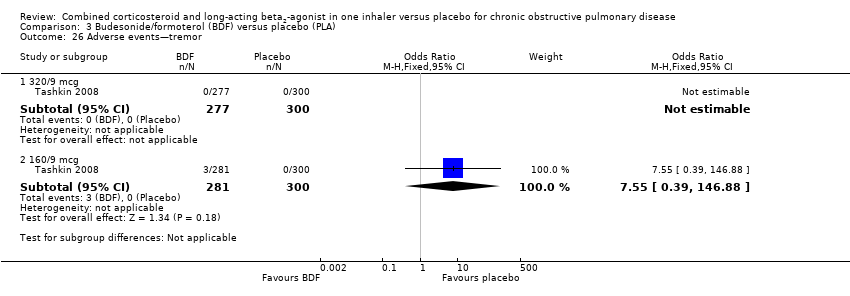
Comparison 3 Budesonide/formoterol (BDF) versus placebo (PLA), Outcome 26 Adverse events—tremor.
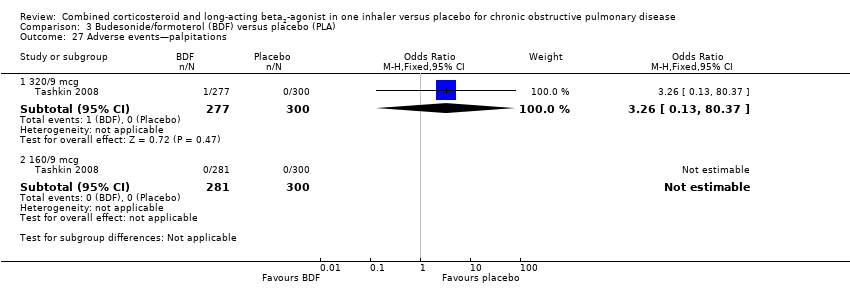
Comparison 3 Budesonide/formoterol (BDF) versus placebo (PLA), Outcome 27 Adverse events—palpitations.
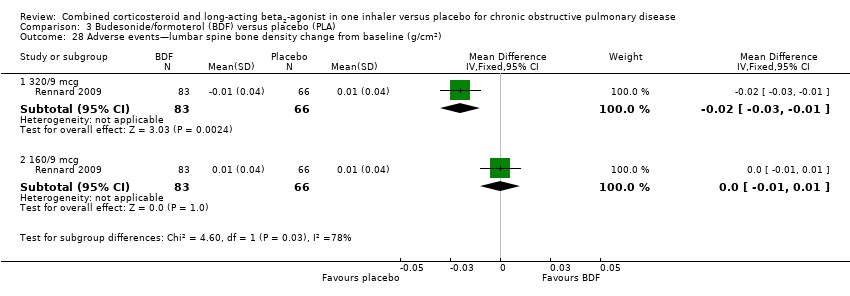
Comparison 3 Budesonide/formoterol (BDF) versus placebo (PLA), Outcome 28 Adverse events—lumbar spine bone density change from baseline (g/cm2).
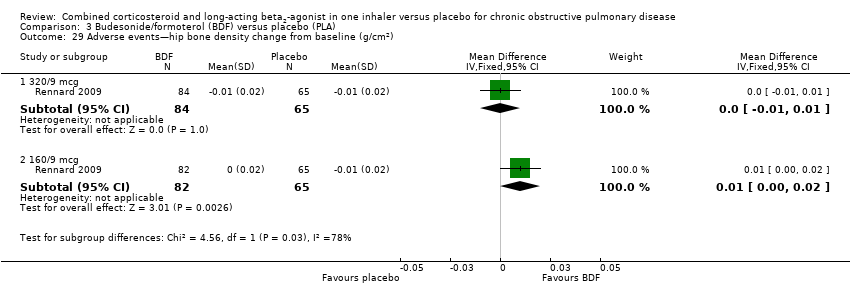
Comparison 3 Budesonide/formoterol (BDF) versus placebo (PLA), Outcome 29 Adverse events—hip bone density change from baseline (g/cm2).

Comparison 4 Mometasone/formoterol (MF/F) versus placebo, Outcome 1 Number of participants with at least one exacerbation.

Comparison 4 Mometasone/formoterol (MF/F) versus placebo, Outcome 2 Number of participants having at least one moderate or severe exacerbation.

Comparison 4 Mometasone/formoterol (MF/F) versus placebo, Outcome 3 Mortality.

Comparison 4 Mometasone/formoterol (MF/F) versus placebo, Outcome 4 Change from baseline in St George's Respiratory Questionnaire (total score).

Comparison 4 Mometasone/formoterol (MF/F) versus placebo, Outcome 5 Change from baseline in FEV1 AUC0–12 hours (mL)—week 13.

Comparison 4 Mometasone/formoterol (MF/F) versus placebo, Outcome 6 Mean change from baseline AM predose FEV1 at 13 weeks (mL).
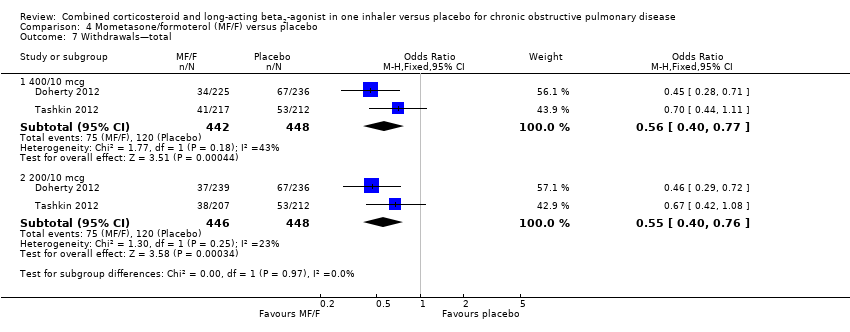
Comparison 4 Mometasone/formoterol (MF/F) versus placebo, Outcome 7 Withdrawals—total.
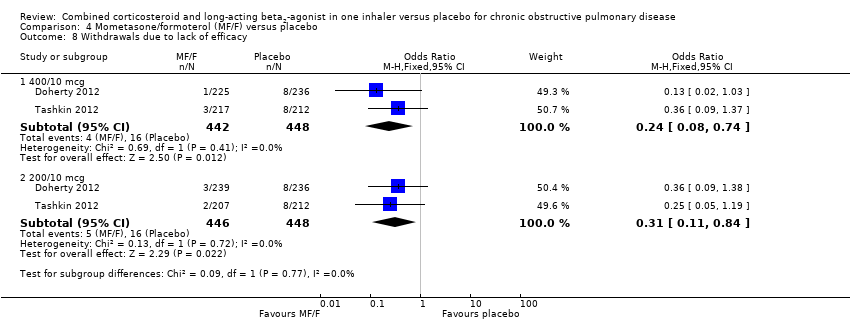
Comparison 4 Mometasone/formoterol (MF/F) versus placebo, Outcome 8 Withdrawals due to lack of efficacy.
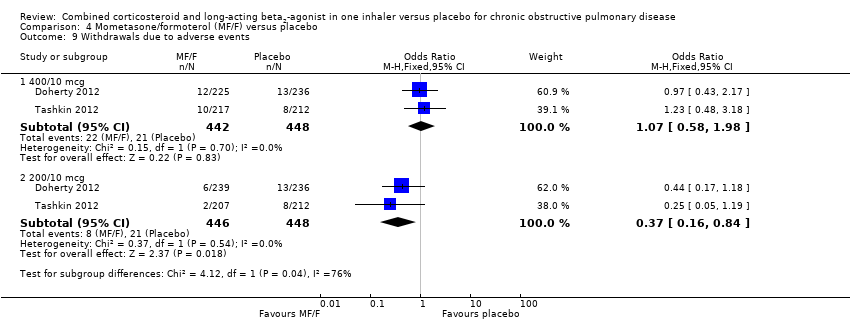
Comparison 4 Mometasone/formoterol (MF/F) versus placebo, Outcome 9 Withdrawals due to adverse events.

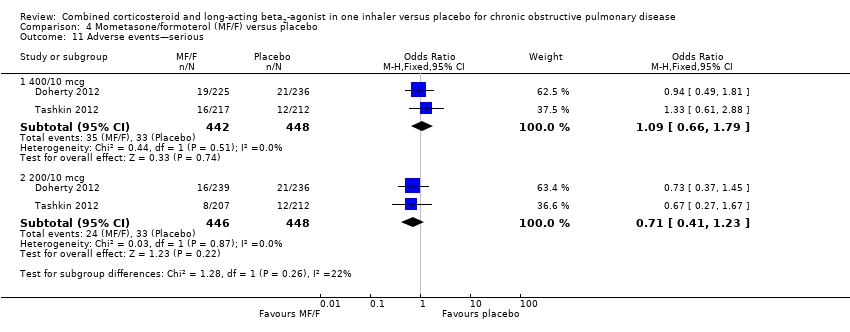
Comparison 4 Mometasone/formoterol (MF/F) versus placebo, Outcome 10 Adverse events—any.
Comparison 4 Mometasone/formoterol (MF/F) versus placebo, Outcome 11 Adverse events—serious.

Comparison 4 Mometasone/formoterol (MF/F) versus placebo, Outcome 12 Adverse events—pneumonia.
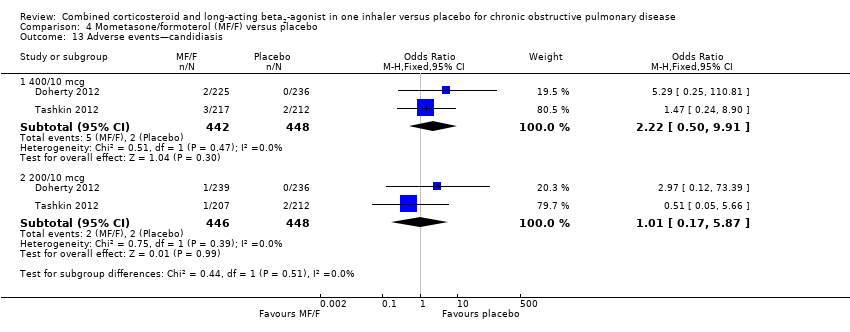
Comparison 4 Mometasone/formoterol (MF/F) versus placebo, Outcome 13 Adverse events—candidiasis.

Comparison 4 Mometasone/formoterol (MF/F) versus placebo, Outcome 14 Adverse events—dysphonia.

Comparison 4 Mometasone/formoterol (MF/F) versus placebo, Outcome 15 Adverse events—cataract.

Comparison 4 Mometasone/formoterol (MF/F) versus placebo, Outcome 16 Adverse events—COPD requiring hospitalisation.
| Combined inhalers versus placebo (primary outcomes) for chronic obstructive pulmonary disease (COPD) | ||||||
| Patient or population: patients with COPD Comparison: placebo | ||||||
| Outcomes | Illustrative comparative risks* (95% CI) | Relative effect | No of participants | Quality of the evidence | Comments | |
| Assumed risk | Corresponding risk | |||||
| Control | Combined inhalers versus placebo (primary outcomes) | |||||
| Annual exacerbation rates | 1.35 | 0.99 (0.93 to 1.05) | Rate ratio 0.73 (0.69 to 0.78) | 7473 (seven studies) | ⊕⊕⊕⊝ | |
| Participants with at least one exacerbation Duration of six months3 | 301 per 1000 | 251 per 1000 (221 to 286) | OR 0.78 | 3141 (eight studies) | ⊕⊕⊕⊝ | |
| Mortality Duration of 18 months3 | 60 per 1000 | 50 per 1000 | OR 0.82 | 10129 | ⊕⊕⊕⊝ | |
| Pneumonia Duration of 18 months3 | 55 per 1000 | 85 per 1000 | OR 1.62 | 9620 | ⊕⊕⊕⊝ | |
| Hospitalisations due to COPD exacerbations Duration of 18 months3 | 115 per 1000 | 108 per 1000 | OR 0.93 | 9492 | ⊕⊕⊝⊝ | |
| *The basis for the assumed risk (e.g. the median control group risk across studies) is provided in footnotes. The corresponding risk (and its 95% confidence interval) is based on the assumed risk in the comparison group and the relative effect of the intervention (and its 95% CI). | ||||||
| GRADE Working Group grades of evidence. | ||||||
| 1Downgraded because of risk of attrition bias. 2Concerns have been raised about the analysis of the largest study, TORCH. We note that the protocol was published after the trial had recruited (See Feedback 1, Feedback 2). No downgrade. 3Weighted mean duration. 4Downgraded because of imprecision. 5Downgraded because of risk of attrition bias and imprecision. | ||||||
| Fluticasone/salmeterol (FPS) versus placebo for COPD | ||||||
| Patient or population: patients with COPD Comparison: placebo | ||||||
| Outcomes | Illustrative comparative risks* (95% CI) | Relative effect | No of participants | Quality of the evidence | Comments | |
| Assumed risk | Corresponding risk | |||||
| Control | Fluticasone/salmeterol (FPS) versus placebo (PLA) | |||||
| Adverse events—any Duration of two years1 | 780 per 1000 | 794 per 1000 | OR 1.09 | 5574 | ⊕⊕⊝⊝ | |
| Adverse events—'serious' Duration of two years1 | 271 per 1000 | 287 per 1000 | OR 1.08 | 5531 | ⊕⊕⊝⊝ | |
| *The basis for the assumed risk (e.g. the median control group risk across studies) is provided in footnotes. The corresponding risk (and its 95% confidence interval) is based on the assumed risk in the comparison group and the relative effect of the intervention (and its 95% CI). | ||||||
| GRADE Working Group grades of evidence. | ||||||
| 1Weighted mean duration. 2Downgraded because of risk of attrition bias and imprecision. 3Concerns have been raised about the analysis of the largest study, TORCH. We note that the protocol was published after the trial had recruited (See Feedback 1, Feedback 2). | ||||||
| Budesonide/formoterol (BDF) versus placebo for COPD | ||||||
| Patient or population: patients with COPD Comparison: placebo | ||||||
| Outcomes | Illustrative comparative risks* (95% CI) | Relative effect | No of participants | Quality of the evidence | Comments | |
| Assumed risk | Corresponding risk | |||||
| Control | Budesonide/formoterol (BDF) versus placebo | |||||
| Adverse event—any—320/94 Duration of nine months 3 | 538 per 1000 | 623 per 1000 | OR 1.42 | 1552 | ⊕⊕⊝⊝ | |
| Adverse event—any—160/94 Duration of nine months 3 | 538 per 1000 | 606 per 1000 | OR 1.32 | 1556 | ⊕⊕⊝⊝ | |
| Adverse events—'serious'—320/94 Duration of 10 months3 | 162 per 1000 | 184 per 1000 | OR 1.17 | 2476 | ⊕⊕⊝⊝ | |
| Adverse events—'serious'—160/94 Duration of nine months 3 | 113 per 1000 | 132 per 1000 | OR 1.2 | 1556 | ⊕⊕⊝⊝ | |
| *The basis for the assumed risk (e.g. the median control group risk across studies) is provided in footnotes. The corresponding risk (and its 95% confidence interval) is based on the assumed risk in the comparison group and the relative effect of the intervention (and its 95% CI). | ||||||
| GRADE Working Group grades of evidence. | ||||||
| 1Downgraded because of risk of attrition bias and imprecision and heterogeneity. 3Weighted mean duration. 4Delivered dose. | ||||||
| Mometasone/formoterol (MF/F) versus placebo for COPD | ||||||
| Patient or population: patients with chronic obstructive pulmonary disease Comparison: placebo | ||||||
| Outcomes | Illustrative comparative risks* (95% CI) | Relative effect | No of participants | Quality of the evidence | Comments | |
| Assumed risk | Corresponding risk | |||||
| Control | Mometasone/formoterol (MF/F) versus placebo | |||||
| Adverse event—any—400/103 Duration of six months | 362 per 1000 | 357 per 1000 | OR 0.98 | 890 | ⊕⊕⊝⊝ | |
| Adverse event—any—200/103 Duration of six months | 362 per 1000 | 317 per 1000 | OR 0.82 | 894 | ⊕⊕⊝⊝ | |
| Adverse events—serious—400/103 Duration of six months | 74 per 1000 | 80 per 1000 | OR 1.09 | 890 | ⊕⊕⊝⊝ | |
| Adverse events—serious—200/103 Duration of six months | 74 per 1000 | 53 per 1000 | OR 0.71 | 894 | ⊕⊕⊝⊝ | |
| *The basis for the assumed risk (e.g. the median control group risk across studies) is provided in footnotes. The corresponding risk (and its 95% confidence interval) is based on the assumed risk in the comparison group and the relative effect of the intervention (and its 95% CI). | ||||||
| GRADE Working Group grades of evidence. | ||||||
| 1Downgraded because of risk of attrition bias, imprecision and heterogeneity. 3Delivered dose. | ||||||
| Version | Detail |
| First published version—Issue 4, 2003 (all years to April 2002) | References identified: 34 |
| Second published version—Issue 3, 2004 (April 2003 to April 2004) | References identified: 12 |
| Third published version—Issue 3, 2005 (April 2004 to April 2005) | References identified: 52 |
| Fourth published version (April 2005 to April 2007) | References identified: 66 |
| Fifth published version (April 2007 to June 2013) | References identified: 129 New unique studies identified: eight (ongoing studies: zero) New studies included: eight Total studies included: 19 |
| Study ID | Study duration | Placebo rate (%) mortality | NNTB for mortality | Placebo rate (%) pneumonia | NNTH for pneumonia |
| 156 weeks | 15.2 | 42 (24 to 775) | 12.3 | 17 (27 to 12) | |
| 52 weeks | 1.94 | 292 (164 to 5256) | 0.83 | 197 (339 to 131) | |
| 52 weeks | 1.95 | 249 (149 to 1307) | 3.6 | 48 (82 to 32) | |
| 52 weeks | 4.5 | 110 (66 to 581) | 0 | N/A | |
| 52 weeks | 0.83 | 674 (379 to 12,149) | 4.78 | 37 (63 to 25) | |
| 26 weeks | 0.33 | 1689 (950 to 30,403) | 1 | 164 (282 to 109) | |
| 26 weeks | 0.85 | 659 (370 to 11,865) | 0.85 | 193 (331 to 128) | |
| 26 weeks | 0.47 | 1187 (668 to 21,377) | 0.47 | 346 (595 to 229) | |
| 24 weeks | 1.66 | 340 (191 to 6125) | 0 | N/A | |
| 8 weeks | 0 | N/A | 1.56 | 107 (182 to 71) |
| Outcome or subgroup title | No. of studies | No. of participants | Statistical method | Effect size |
| 1 Exacerbation rates with combined inhalers versus placebo Show forest plot | 7 | Rate Ratio (Fixed, 95% CI) | 0.73 [0.69, 0.78] | |
| 1.1 Fluticasone/salmeterol | 3 | Rate Ratio (Fixed, 95% CI) | 0.74 [0.69, 0.80] | |
| 1.2 Budesonide/formoterol | 4 | Rate Ratio (Fixed, 95% CI) | 0.71 [0.62, 0.81] | |
| 2 Mortality Show forest plot | 16 | 10129 | Odds Ratio (M‐H, Fixed, 95% CI) | 0.82 [0.68, 0.99] |
| 2.1 Fluticasone/salmeterol | 10 | 5543 | Odds Ratio (M‐H, Fixed, 95% CI) | 0.79 [0.65, 0.97] |
| 2.2 Budesonide/formoterol | 4 | 3250 | Odds Ratio (M‐H, Fixed, 95% CI) | 1.05 [0.57, 1.93] |
| 2.3 Mometasone/formoterol | 2 | 1336 | Odds Ratio (M‐H, Fixed, 95% CI) | 1.35 [0.36, 5.13] |
| 3 Pneumonia Show forest plot | 14 | 9620 | Odds Ratio (M‐H, Fixed, 95% CI) | 1.62 [1.36, 1.94] |
| 3.1 Fluticasone/salmeterol | 9 | 5447 | Odds Ratio (M‐H, Fixed, 95% CI) | 1.76 [1.46, 2.14] |
| 3.2 Budesonide/formoterol | 3 | 2837 | Odds Ratio (M‐H, Fixed, 95% CI) | 0.92 [0.57, 1.47] |
| 3.3 Mometasone/formoterol | 2 | 1336 | Odds Ratio (M‐H, Fixed, 95% CI) | 2.39 [0.68, 8.36] |
| 4 Hospitalisations due to COPD exacerbations Show forest plot | 12 | 9492 | Odds Ratio (M‐H, Random, 95% CI) | 0.92 [0.80, 1.06] |
| 4.1 Fluticasone/salmeterol | 7 | 5309 | Odds Ratio (M‐H, Random, 95% CI) | 0.89 [0.75, 1.04] |
| 4.2 Budesonide/formoterol | 3 | 2847 | Odds Ratio (M‐H, Random, 95% CI) | 1.17 [0.87, 1.58] |
| 4.3 Mometasone/formoterol | 2 | 1336 | Odds Ratio (M‐H, Random, 95% CI) | 0.57 [0.31, 1.07] |
| 5 Number of participants with at least one exacerbation Show forest plot | 9 | 3141 | Odds Ratio (M‐H, Fixed, 95% CI) | 0.78 [0.66, 0.93] |
| 5.1 Fluticasone/salmeterol | 7 | 1817 | Odds Ratio (M‐H, Fixed, 95% CI) | 0.83 [0.64, 1.07] |
| 5.2 Mometasone/formoterol | 2 | 1324 | Odds Ratio (M‐H, Fixed, 95% CI) | 0.74 [0.58, 0.94] |
| Outcome or subgroup title | No. of studies | No. of participants | Statistical method | Effect size |
| 1 Exacerbations Show forest plot | 3 | 3777 | Rate ratio (Fixed, 95% CI) | 0.74 [0.69, 0.80] |
| 1.1 Poorly reversible population | 3 | 3777 | Rate ratio (Fixed, 95% CI) | 0.74 [0.69, 0.80] |
| 2 Number of participants with at least one exacerbation Show forest plot | 7 | 1817 | Odds Ratio (M‐H, Fixed, 95% CI) | 0.83 [0.64, 1.07] |
| 2.1 Reversible population | 1 | 126 | Odds Ratio (M‐H, Fixed, 95% CI) | 0.32 [0.06, 1.66] |
| 2.2 Partially reversible population (mixed population) | 2 | 713 | Odds Ratio (M‐H, Fixed, 95% CI) | 1.00 [0.69, 1.44] |
| 2.3 Poorly reversible population | 3 | 841 | Odds Ratio (M‐H, Fixed, 95% CI) | 0.79 [0.54, 1.15] |
| 2.4 Unclear reversibility | 1 | 137 | Odds Ratio (M‐H, Fixed, 95% CI) | 0.31 [0.09, 1.05] |
| 3 Participants with at least one exacerbation by type Show forest plot | 2 | Odds Ratio (M‐H, Fixed, 95% CI) | Subtotals only | |
| 3.1 Requirement for oral steroids | 2 | 417 | Odds Ratio (M‐H, Fixed, 95% CI) | 1.01 [0.61, 1.68] |
| 3.2 Requirement for antibiotic treatment | 1 | 140 | Odds Ratio (M‐H, Fixed, 95% CI) | 0.80 [0.26, 2.44] |
| 3.3 Requirement for oral steroid or antibiotic treatment | 1 | 140 | Odds Ratio (M‐H, Fixed, 95% CI) | 3.32 [0.13, 82.80] |
| 3.4 Hospitalisation | 1 | 140 | Odds Ratio (M‐H, Fixed, 95% CI) | 3.32 [0.13, 82.80] |
| 4 Exacerbations by type Show forest plot | 3 | Rate ratio (Fixed, 95% CI) | Subtotals only | |
| 4.1 Requirement for oral steroids | 3 | Rate ratio (Fixed, 95% CI) | 0.57 [0.52, 0.63] | |
| 4.2 Requirement for antibiotic treatment | 1 | Rate ratio (Fixed, 95% CI) | 0.60 [0.41, 0.88] | |
| 4.3 Hospitalisation | 2 | Rate ratio (Fixed, 95% CI) | 0.83 [0.70, 0.97] | |
| 5 Mortality Show forest plot | 10 | 5543 | Odds Ratio (M‐H, Fixed, 95% CI) | 0.79 [0.65, 0.97] |
| 5.1 Mortality: three‐year data | 1 | 3057 | Odds Ratio (M‐H, Fixed, 95% CI) | 0.81 [0.66, 0.99] |
| 5.2 Mortality: one‐year data | 3 | 987 | Odds Ratio (M‐H, Fixed, 95% CI) | 0.46 [0.13, 1.65] |
| 5.3 Mortality: six‐month data | 3 | 1154 | Odds Ratio (M‐H, Fixed, 95% CI) | 0.54 [0.11, 2.75] |
| 5.4 Mortality: three‐month data | 3 | 345 | Odds Ratio (M‐H, Fixed, 95% CI) | 0.0 [0.0, 0.0] |
| 6 Change from baseline in St George's Respiratory Questionnaire (total score) Show forest plot | 4 | Mean Difference (Fixed, 95% CI) | ‐2.90 [‐3.61, ‐2.18] | |
| 6.1 Poorly reversible population | 4 | Mean Difference (Fixed, 95% CI) | ‐2.90 [‐3.61, ‐2.18] | |
| 7 Change from baseline in Chronic Respiratory Disease Questionnaire scores Show forest plot | 2 | 712 | Mean Difference (IV, Fixed, 95% CI) | 5.0 [2.48, 7.52] |
| 7.1 Partially reversible population (mixed population) | 2 | 712 | Mean Difference (IV, Fixed, 95% CI) | 5.0 [2.48, 7.52] |
| 8 Change from baseline in Transitional Dyspnoea Index (TDI) scores Show forest plot | 2 | 707 | Mean Difference (IV, Fixed, 95% CI) | 1.04 [0.56, 1.53] |
| 8.1 Partially reversible population (mixed population) | 2 | 707 | Mean Difference (IV, Fixed, 95% CI) | 1.04 [0.56, 1.53] |
| 9 Change from baseline in predose FEV1 Show forest plot | 5 | Mean Difference (Fixed, 95% CI) | 0.16 [0.14, 0.19] | |
| 9.1 Reversible population | 3 | Mean Difference (Fixed, 95% CI) | 0.19 [0.15, 0.24] | |
| 9.2 Poorly reversible population | 4 | Mean Difference (Fixed, 95% CI) | 0.15 [0.11, 0.18] | |
| 10 Change from baseline in postdose FEV1 Show forest plot | 2 | Mean Difference (Fixed, 95% CI) | 0.09 [0.07, 0.11] | |
| 10.1 Poorly reversible population | 2 | Mean Difference (Fixed, 95% CI) | 0.09 [0.07, 0.11] | |
| 11 Change from baseline in rescue medication usage (puffs/d) Show forest plot | 2 | 703 | Mean Difference (IV, Fixed, 95% CI) | ‐1.19 [‐1.83, ‐0.55] |
| 11.1 Partially reversible population (mixed population) | 2 | 703 | Mean Difference (IV, Fixed, 95% CI) | ‐1.19 [‐1.83, ‐0.55] |
| 12 Withdrawals—total Show forest plot | 13 | 5769 | Odds Ratio (M‐H, Fixed, 95% CI) | 0.69 [0.62, 0.78] |
| 12.1 Reversible population | 1 | 121 | Odds Ratio (M‐H, Fixed, 95% CI) | 2.95 [0.30, 29.18] |
| 12.2 Partially reversible population (mixed population) | 2 | 709 | Odds Ratio (M‐H, Fixed, 95% CI) | 0.82 [0.60, 1.13] |
| 12.3 Poorly reversible population | 6 | 4632 | Odds Ratio (M‐H, Fixed, 95% CI) | 0.68 [0.60, 0.76] |
| 12.4 Unclear reversibility | 4 | 307 | Odds Ratio (M‐H, Fixed, 95% CI) | 0.55 [0.25, 1.17] |
| 13 Withdrawals due to adverse events Show forest plot | 11 | 5491 | Odds Ratio (M‐H, Fixed, 95% CI) | 0.74 [0.64, 0.86] |
| 13.1 Reversible population | 1 | 123 | Odds Ratio (M‐H, Fixed, 95% CI) | 0.36 [0.01, 8.90] |
| 13.2 Partially reversible population (mixed population) | 1 | 354 | Odds Ratio (M‐H, Fixed, 95% CI) | 0.69 [0.31, 1.51] |
| 13.3 Poorly reversible population | 6 | 4630 | Odds Ratio (M‐H, Fixed, 95% CI) | 0.76 [0.65, 0.89] |
| 13.4 Unclear reversibility | 4 | 384 | Odds Ratio (M‐H, Fixed, 95% CI) | 0.31 [0.11, 0.93] |
| 14 Withdrawals due to lack of efficacy Show forest plot | 8 | 5115 | Odds Ratio (M‐H, Fixed, 95% CI) | 0.30 [0.22, 0.41] |
| 14.1 Partially reversible population (mixed population) | 1 | 346 | Odds Ratio (M‐H, Fixed, 95% CI) | 0.29 [0.08, 1.04] |
| 14.2 Poorly reversible population | 6 | 4632 | Odds Ratio (M‐H, Fixed, 95% CI) | 0.30 [0.21, 0.42] |
| 14.3 Unclear reversibility | 1 | 137 | Odds Ratio (M‐H, Fixed, 95% CI) | 0.30 [0.08, 1.11] |
| 15 Adverse events—any Show forest plot | 9 | 5574 | Odds Ratio (M‐H, Fixed, 95% CI) | 1.09 [0.95, 1.25] |
| 15.1 Reversible population | 1 | 126 | Odds Ratio (M‐H, Fixed, 95% CI) | 1.20 [0.59, 2.46] |
| 15.2 Partially reversible population (mixed population) | 2 | 717 | Odds Ratio (M‐H, Fixed, 95% CI) | 1.42 [1.03, 1.96] |
| 15.3 Poorly reversible population | 5 | 4650 | Odds Ratio (M‐H, Fixed, 95% CI) | 1.03 [0.88, 1.21] |
| 15.4 Unclear reversibility | 1 | 81 | Odds Ratio (M‐H, Fixed, 95% CI) | 0.58 [0.19, 1.79] |
| 16 Adverse events—'serious' Show forest plot | 9 | 5531 | Odds Ratio (M‐H, Fixed, 95% CI) | 1.08 [0.95, 1.23] |
| 16.1 Reversible population | 1 | 123 | Odds Ratio (M‐H, Fixed, 95% CI) | 0.53 [0.05, 6.05] |
| 16.2 Partially reversible population | 2 | 709 | Odds Ratio (M‐H, Fixed, 95% CI) | 0.71 [0.38, 1.35] |
| 16.3 Poorly reversible population | 6 | 4699 | Odds Ratio (M‐H, Fixed, 95% CI) | 1.10 [0.97, 1.26] |
| 17 Adverse events—pneumonia Show forest plot | 9 | 5447 | Odds Ratio (M‐H, Fixed, 95% CI) | 1.80 [1.49, 2.18] |
| 17.1 Reversible population | 1 | 126 | Odds Ratio (M‐H, Fixed, 95% CI) | 0.34 [0.01, 8.47] |
| 17.2 Partially reversible population (mixed population) | 2 | 709 | Odds Ratio (M‐H, Fixed, 95% CI) | 5.55 [0.26, 116.46] |
| 17.3 Poorly reversible population | 4 | 4394 | Odds Ratio (M‐H, Fixed, 95% CI) | 1.80 [1.48, 2.18] |
| 17.4 Unclear reversibility | 2 | 218 | Odds Ratio (M‐H, Fixed, 95% CI) | 3.31 [0.13, 83.73] |
| 18 Adverse events—candidiasis Show forest plot | 7 | 2039 | Odds Ratio (M‐H, Fixed, 95% CI) | 5.73 [3.07, 10.67] |
| 18.1 Reversible population | 1 | 126 | Odds Ratio (M‐H, Fixed, 95% CI) | 1.03 [0.06, 16.88] |
| 18.2 Partially reversible population (mixed population) | 2 | 717 | Odds Ratio (M‐H, Fixed, 95% CI) | 11.13 [3.36, 36.90] |
| 18.3 Poorly reversible population | 3 | 1115 | Odds Ratio (M‐H, Fixed, 95% CI) | 4.40 [2.01, 9.62] |
| 18.4 Unclear reversibility | 1 | 81 | Odds Ratio (M‐H, Fixed, 95% CI) | 0.0 [0.0, 0.0] |
| 19 Adverse events—hoarseness Show forest plot | 2 | 585 | Odds Ratio (M‐H, Fixed, 95% CI) | 1.61 [0.61, 4.26] |
| 19.1 Poorly reversible population | 2 | 585 | Odds Ratio (M‐H, Fixed, 95% CI) | 1.61 [0.61, 4.26] |
| 20 Adverse events—palpitations Show forest plot | 1 | Odds Ratio (M‐H, Fixed, 95% CI) | Totals not selected | |
| 20.1 Poorly reversible population | 1 | Odds Ratio (M‐H, Fixed, 95% CI) | 0.0 [0.0, 0.0] | |
| 21 Adverse events—blood glucose increased Show forest plot | 1 | Odds Ratio (M‐H, Fixed, 95% CI) | Totals not selected | |
| 21.1 Poorly reversible population | 1 | Odds Ratio (M‐H, Fixed, 95% CI) | 0.0 [0.0, 0.0] | |
| 22 Adverse event—skin bruising Show forest plot | 1 | 445 | Odds Ratio (M‐H, Fixed, 95% CI) | 0.0 [0.0, 0.0] |
| 22.1 Poorly reversible population | 1 | 445 | Odds Ratio (M‐H, Fixed, 95% CI) | 0.0 [0.0, 0.0] |
| 23 Adverse events—bronchitis Show forest plot | 1 | Odds Ratio (M‐H, Fixed, 95% CI) | Totals not selected | |
| 23.1 Poorly reversible population | 1 | Odds Ratio (M‐H, Fixed, 95% CI) | 0.0 [0.0, 0.0] | |
| 24 Adverse events—upper respiratory tract infection Show forest plot | 5 | 4963 | Odds Ratio (M‐H, Fixed, 95% CI) | 1.23 [1.04, 1.47] |
| 24.1 Partially reversible population (mixed population) | 2 | 709 | Odds Ratio (M‐H, Fixed, 95% CI) | 1.25 [0.81, 1.92] |
| 24.2 Poorly reversible population | 3 | 4254 | Odds Ratio (M‐H, Fixed, 95% CI) | 1.23 [1.02, 1.48] |
| 25 Adverse events—nasopharyngitis Show forest plot | 2 | 3535 | Odds Ratio (M‐H, Fixed, 95% CI) | 1.28 [1.05, 1.56] |
| 25.1 Poorly reversible population | 2 | 3535 | Odds Ratio (M‐H, Fixed, 95% CI) | 1.28 [1.05, 1.56] |
| 26 Adverse events—cough Show forest plot | 3 | 612 | Odds Ratio (M‐H, Fixed, 95% CI) | 0.55 [0.23, 1.27] |
| 26.1 Reversible population | 1 | 126 | Odds Ratio (M‐H, Fixed, 95% CI) | 3.15 [0.13, 78.72] |
| 26.2 Partially reversible population (mixed population) | 1 | 346 | Odds Ratio (M‐H, Fixed, 95% CI) | 0.49 [0.18, 1.31] |
| 26.3 Poorly reversible population | 1 | 140 | Odds Ratio (M‐H, Fixed, 95% CI) | 0.35 [0.04, 3.48] |
| 27 Adverse events—headache Show forest plot | 4 | 3922 | Odds Ratio (M‐H, Fixed, 95% CI) | 1.05 [0.84, 1.31] |
| 27.1 Reversible population | 1 | 123 | Odds Ratio (M‐H, Fixed, 95% CI) | 0.22 [0.02, 2.01] |
| 27.2 Partially reversible population (mixed population) | 2 | 709 | Odds Ratio (M‐H, Fixed, 95% CI) | 1.38 [0.91, 2.10] |
| 27.3 Poorly reversible population | 1 | 3090 | Odds Ratio (M‐H, Fixed, 95% CI) | 0.96 [0.73, 1.26] |
| Outcome or subgroup title | No. of studies | No. of participants | Statistical method | Effect size |
| 1 Severe exacerbations Show forest plot | 2 | Rate ratio (Fixed, 95% CI) | 0.74 [0.62, 0.88] | |
| 1.1 Poorly reversible | 2 | Rate ratio (Fixed, 95% CI) | 0.74 [0.62, 0.88] | |
| 2 Mean severe exacerbation rates per participant per year Show forest plot | 2 | Mean Difference (IV, Fixed, 95% CI) | Totals not selected | |
| 2.1 Poorly reversible population | 2 | Mean Difference (IV, Fixed, 95% CI) | 0.0 [0.0, 0.0] | |
| 3 Mortality Show forest plot | 4 | 3250 | Odds Ratio (M‐H, Fixed, 95% CI) | 1.05 [0.57, 1.93] |
| 4 Change from baseline in St George's Respiratory Questionnaire (total score) Show forest plot | 4 | Mean Difference (IV, Fixed, 95% CI) | Subtotals only | |
| 4.1 320/9 mcg | 4 | 2350 | Mean Difference (IV, Fixed, 95% CI) | ‐3.73 [‐4.83, ‐2.63] |
| 4.2 160/9 mcg | 2 | 1442 | Mean Difference (IV, Fixed, 95% CI) | ‐3.39 [‐4.70, ‐2.07] |
| 5 Quality of life—change scores Show forest plot | 2 | SGRQ (Fixed, 95% CI) | ‐6.06 [‐7.90, ‐4.22] | |
| 5.1 Poorly reversible | 2 | SGRQ (Fixed, 95% CI) | ‐6.06 [‐7.90, ‐4.22] | |
| 6 Symptoms (change scores) Show forest plot | 2 | Symptom scale (Fixed, 95% CI) | ‐0.63 [‐0.90, ‐0.37] | |
| 6.1 Poorly reversible | 2 | Symptom scale (Fixed, 95% CI) | ‐0.63 [‐0.90, ‐0.37] | |
| 7 Breathlessness, cough and sputum score (BCSS) change from baseline—average over treatment period Show forest plot | 2 | Mean Difference (IV, Fixed, 95% CI) | Subtotals only | |
| 7.1 320/9 mcg | 2 | 1533 | Mean Difference (IV, Fixed, 95% CI) | ‐0.43 [‐0.59, ‐0.26] |
| 7.2 160/9 mcg | 2 | 1536 | Mean Difference (IV, Fixed, 95% CI) | ‐0.44 [‐0.60, ‐0.28] |
| 8 Rescue medication usage Show forest plot | 4 | Mean Difference (Fixed, 95% CI) | Subtotals only | |
| 8.1 320/9 mcg | 4 | Mean Difference (Fixed, 95% CI) | ‐0.98 [‐1.18, ‐0.79] | |
| 8.2 160/9 mcg | 2 | Mean Difference (Fixed, 95% CI) | ‐1.28 [‐1.55, ‐1.00] | |
| 9 Mean FEV1 (% change from baseline) Show forest plot | 2 | Mean Difference (Fixed, 95% CI) | 14.40 [11.91, 16.90] | |
| 9.1 Poorly reversible | 2 | Mean Difference (Fixed, 95% CI) | 14.40 [11.91, 16.90] | |
| 10 Average 12‐hour FEV1 change from baseline—end of treatment (L) Show forest plot | 1 | Mean Difference (IV, Fixed, 95% CI) | Subtotals only | |
| 10.1 320/9 mcg | 1 | 246 | Mean Difference (IV, Fixed, 95% CI) | 0.19 [0.12, 0.26] |
| 10.2 160/9 mcg | 1 | 245 | Mean Difference (IV, Fixed, 95% CI) | 0.16 [0.10, 0.22] |
| 11 Predose FEV1 [L] change from baseline to the average over the randomised treatment period Show forest plot | 1 | Mean Difference (IV, Fixed, 95% CI) | Subtotals only | |
| 11.1 320/9 mcg | 1 | 577 | Mean Difference (IV, Fixed, 95% CI) | 0.08 [0.04, 0.12] |
| 11.2 160/9 mcg | 1 | 581 | Mean Difference (IV, Fixed, 95% CI) | 0.06 [0.03, 0.09] |
| 12 1 Hour postdose FEV1 [L] change from baseline to the average over the randomised treatment period Show forest plot | 1 | Mean Difference (IV, Fixed, 95% CI) | Subtotals only | |
| 12.1 320/9 mcg | 1 | 577 | Mean Difference (IV, Fixed, 95% CI) | 0.17 [0.14, 0.20] |
| 12.2 160/9 mcg | 1 | 581 | Mean Difference (IV, Fixed, 95% CI) | 0.16 [0.13, 0.19] |
| 13 FEV1 at 12‐hour change from baseline—end of treatment (L) Show forest plot | 1 | Mean Difference (IV, Fixed, 95% CI) | Subtotals only | |
| 13.1 320/9 mcg | 1 | 246 | Mean Difference (IV, Fixed, 95% CI) | 0.1 [0.03, 0.17] |
| 13.2 160/9 mcg | 1 | 245 | Mean Difference (IV, Fixed, 95% CI) | 0.07 [0.00, 0.14] |
| 14 Morning PEFR change from baseline, average over treatment period (L/min) Show forest plot | 2 | Mean Difference (IV, Fixed, 95% CI) | Subtotals only | |
| 14.1 320/9 mcg | 2 | 1530 | Mean Difference (IV, Fixed, 95% CI) | 19.12 [15.69, 22.55] |
| 14.2 160/9 mcg | 2 | 1535 | Mean Difference (IV, Fixed, 95% CI) | 14.63 [11.47, 17.80] |
| 15 Evening PEFR mean change from baseline, average over treatment period (L/min) Show forest plot | 2 | Mean Difference (IV, Fixed, 95% CI) | Subtotals only | |
| 15.1 320/9 mcg | 2 | 1529 | Mean Difference (IV, Fixed, 95% CI) | 16.09 [12.61, 19.57] |
| 15.2 160/9 mcg | 2 | 1531 | Mean Difference (IV, Fixed, 95% CI) | 12.74 [9.56, 15.91] |
| 16 Withdrawals—total Show forest plot | 4 | Odds Ratio (M‐H, Fixed, 95% CI) | Subtotals only | |
| 16.1 320/9 mcg | 4 | 2475 | Odds Ratio (M‐H, Fixed, 95% CI) | 0.57 [0.48, 0.68] |
| 16.2 160/9 mcg | 2 | 1556 | Odds Ratio (M‐H, Fixed, 95% CI) | 0.62 [0.50, 0.78] |
| 17 Withdrawals due to adverse events Show forest plot | 4 | Odds Ratio (M‐H, Fixed, 95% CI) | Subtotals only | |
| 17.1 320/9 mcg | 4 | 2475 | Odds Ratio (M‐H, Fixed, 95% CI) | 0.79 [0.61, 1.01] |
| 17.2 160/9 mcg | 2 | 1556 | Odds Ratio (M‐H, Fixed, 95% CI) | 0.95 [0.70, 1.30] |
| 18 Withdrawals due to lack of efficacy Show forest plot | 3 | Odds Ratio (M‐H, Fixed, 95% CI) | Subtotals only | |
| 18.1 320/9 mcg | 3 | 1898 | Odds Ratio (M‐H, Fixed, 95% CI) | 0.46 [0.34, 0.63] |
| 18.2 160/9 mcg | 1 | 975 | Odds Ratio (M‐H, Fixed, 95% CI) | 1.01 [0.60, 1.71] |
| 19 Adverse event—any Show forest plot | 2 | Odds Ratio (M‐H, Fixed, 95% CI) | Subtotals only | |
| 19.1 320/9 mcg | 2 | 1552 | Odds Ratio (M‐H, Fixed, 95% CI) | 1.42 [1.16, 1.74] |
| 19.2 160/9 mcg | 2 | 1556 | Odds Ratio (M‐H, Fixed, 95% CI) | 1.32 [1.08, 1.61] |
| 20 Adverse events—'serious' Show forest plot | 4 | Odds Ratio (M‐H, Fixed, 95% CI) | Subtotals only | |
| 20.1 320/9 mcg | 4 | 2476 | Odds Ratio (M‐H, Fixed, 95% CI) | 1.17 [0.95, 1.45] |
| 20.2 160/9 mcg | 2 | 1556 | Odds Ratio (M‐H, Fixed, 95% CI) | 1.20 [0.89, 1.63] |
| 21 Adverse events—pneumonia Show forest plot | 3 | Odds Ratio (M‐H, Fixed, 95% CI) | Subtotals only | |
| 21.1 320/9 mcg | 3 | 2062 | Odds Ratio (M‐H, Fixed, 95% CI) | 0.89 [0.52, 1.52] |
| 21.2 160/9 mcg | 2 | 1556 | Odds Ratio (M‐H, Fixed, 95% CI) | 0.80 [0.45, 1.42] |
| 22 Adverse events—candidiasis Show forest plot | 2 | Odds Ratio (M‐H, Fixed, 95% CI) | Subtotals only | |
| 22.1 320/9 mcg | 2 | 1552 | Odds Ratio (M‐H, Fixed, 95% CI) | 3.45 [1.88, 6.34] |
| 22.2 160/9 mcg | 2 | 1556 | Odds Ratio (M‐H, Fixed, 95% CI) | 2.05 [1.07, 3.92] |
| 23 Adverse events—dysphonia Show forest plot | 2 | Odds Ratio (M‐H, Fixed, 95% CI) | Subtotals only | |
| 23.1 320/9 mcg | 2 | 1552 | Odds Ratio (M‐H, Fixed, 95% CI) | 4.07 [1.52, 10.90] |
| 23.2 160/9 mcg | 2 | 1556 | Odds Ratio (M‐H, Fixed, 95% CI) | 1.17 [0.37, 3.67] |
| 24 Adverse events—cataracts Show forest plot | 1 | Odds Ratio (M‐H, Fixed, 95% CI) | Subtotals only | |
| 24.1 320/9 mcg | 1 | 975 | Odds Ratio (M‐H, Fixed, 95% CI) | 0.32 [0.01, 7.97] |
| 24.2 160/9 mcg | 1 | 975 | Odds Ratio (M‐H, Fixed, 95% CI) | 1.95 [0.18, 21.59] |
| 25 Adverse events—COPD Show forest plot | 2 | Odds Ratio (M‐H, Fixed, 95% CI) | Subtotals only | |
| 25.1 320/9 mcg | 2 | 1552 | Odds Ratio (M‐H, Fixed, 95% CI) | 0.92 [0.69, 1.22] |
| 25.2 160/9 mcg | 2 | 1556 | Odds Ratio (M‐H, Fixed, 95% CI) | 1.16 [0.88, 1.53] |
| 26 Adverse events—tremor Show forest plot | 1 | Odds Ratio (M‐H, Fixed, 95% CI) | Subtotals only | |
| 26.1 320/9 mcg | 1 | 577 | Odds Ratio (M‐H, Fixed, 95% CI) | 0.0 [0.0, 0.0] |
| 26.2 160/9 mcg | 1 | 581 | Odds Ratio (M‐H, Fixed, 95% CI) | 7.55 [0.39, 146.88] |
| 27 Adverse events—palpitations Show forest plot | 1 | Odds Ratio (M‐H, Fixed, 95% CI) | Subtotals only | |
| 27.1 320/9 mcg | 1 | 577 | Odds Ratio (M‐H, Fixed, 95% CI) | 3.26 [0.13, 80.37] |
| 27.2 160/9 mcg | 1 | 581 | Odds Ratio (M‐H, Fixed, 95% CI) | 0.0 [0.0, 0.0] |
| 28 Adverse events—lumbar spine bone density change from baseline (g/cm2) Show forest plot | 1 | Mean Difference (IV, Fixed, 95% CI) | Subtotals only | |
| 28.1 320/9 mcg | 1 | 149 | Mean Difference (IV, Fixed, 95% CI) | ‐0.02 [‐0.03, ‐0.01] |
| 28.2 160/9 mcg | 1 | 149 | Mean Difference (IV, Fixed, 95% CI) | 0.0 [‐0.01, 0.01] |
| 29 Adverse events—hip bone density change from baseline (g/cm2) Show forest plot | 1 | Mean Difference (IV, Fixed, 95% CI) | Subtotals only | |
| 29.1 320/9 mcg | 1 | 149 | Mean Difference (IV, Fixed, 95% CI) | 0.0 [‐0.01, 0.01] |
| 29.2 160/9 mcg | 1 | 147 | Mean Difference (IV, Fixed, 95% CI) | 0.01 [0.00, 0.02] |
| Outcome or subgroup title | No. of studies | No. of participants | Statistical method | Effect size |
| 1 Number of participants with at least one exacerbation Show forest plot | 2 | Odds Ratio (M‐H, Fixed, 95% CI) | Subtotals only | |
| 1.1 400/10 mcg | 2 | 882 | Odds Ratio (M‐H, Fixed, 95% CI) | 0.72 [0.54, 0.95] |
| 1.2 200/10 mcg | 2 | 886 | Odds Ratio (M‐H, Fixed, 95% CI) | 0.76 [0.58, 1.01] |
| 2 Number of participants having at least one moderate or severe exacerbation Show forest plot | 2 | Odds Ratio (M‐H, Fixed, 95% CI) | Subtotals only | |
| 2.1 400/10 mcg | 2 | 882 | Odds Ratio (M‐H, Fixed, 95% CI) | 0.57 [0.38, 0.86] |
| 2.2 200/10 mcg | 2 | 886 | Odds Ratio (M‐H, Fixed, 95% CI) | 0.62 [0.42, 0.92] |
| 3 Mortality Show forest plot | 2 | Odds Ratio (M‐H, Fixed, 95% CI) | Subtotals only | |
| 3.1 400/10 mcg | 2 | 890 | Odds Ratio (M‐H, Fixed, 95% CI) | 1.72 [0.41, 7.25] |
| 3.2 200/10 mcg | 2 | 894 | Odds Ratio (M‐H, Fixed, 95% CI) | 1.00 [0.20, 4.98] |
| 4 Change from baseline in St George's Respiratory Questionnaire (total score) Show forest plot | 2 | Mean Difference (Fixed, 95% CI) | Subtotals only | |
| 4.1 400/10 mcg | 2 | 866 | Mean Difference (Fixed, 95% CI) | ‐3.80 [‐5.75, ‐1.86] |
| 4.2 200/10 mcg | 2 | 869 | Mean Difference (Fixed, 95% CI) | ‐3.91 [‐6.01, ‐1.81] |
| 5 Change from baseline in FEV1 AUC0–12 hours (mL)—week 13 Show forest plot | 2 | Mean Difference (IV, Fixed, 95% CI) | Subtotals only | |
| 5.1 400/10 mcg | 2 | 862 | Mean Difference (IV, Fixed, 95% CI) | 162.04 [126.54, 197.53] |
| 5.2 200/10 mcg | 2 | 869 | Mean Difference (IV, Fixed, 95% CI) | 122.01 [86.64, 157.39] |
| 6 Mean change from baseline AM predose FEV1 at 13 weeks (mL) Show forest plot | 2 | Mean Difference (IV, Fixed, 95% CI) | Subtotals only | |
| 6.1 400/10 mcg | 2 | 856 | Mean Difference (IV, Fixed, 95% CI) | 114.64 [77.79, 151.50] |
| 6.2 200/10 mcg | 2 | 859 | Mean Difference (IV, Fixed, 95% CI) | 70.43 [33.63, 107.23] |
| 7 Withdrawals—total Show forest plot | 2 | Odds Ratio (M‐H, Fixed, 95% CI) | Subtotals only | |
| 7.1 400/10 mcg | 2 | 890 | Odds Ratio (M‐H, Fixed, 95% CI) | 0.56 [0.40, 0.77] |
| 7.2 200/10 mcg | 2 | 894 | Odds Ratio (M‐H, Fixed, 95% CI) | 0.55 [0.40, 0.76] |
| 8 Withdrawals due to lack of efficacy Show forest plot | 2 | Odds Ratio (M‐H, Fixed, 95% CI) | Subtotals only | |
| 8.1 400/10 mcg | 2 | 890 | Odds Ratio (M‐H, Fixed, 95% CI) | 0.24 [0.08, 0.74] |
| 8.2 200/10 mcg | 2 | 894 | Odds Ratio (M‐H, Fixed, 95% CI) | 0.31 [0.11, 0.84] |
| 9 Withdrawals due to adverse events Show forest plot | 2 | Odds Ratio (M‐H, Fixed, 95% CI) | Subtotals only | |
| 9.1 400/10 mcg | 2 | 890 | Odds Ratio (M‐H, Fixed, 95% CI) | 1.07 [0.58, 1.98] |
| 9.2 200/10 mcg | 2 | 894 | Odds Ratio (M‐H, Fixed, 95% CI) | 0.37 [0.16, 0.84] |
| 10 Adverse events—any Show forest plot | 2 | Odds Ratio (M‐H, Fixed, 95% CI) | Subtotals only | |
| 10.1 400/10 mcg | 2 | 890 | Odds Ratio (M‐H, Fixed, 95% CI) | 0.98 [0.75, 1.30] |
| 10.2 200/10 mcg | 2 | 894 | Odds Ratio (M‐H, Fixed, 95% CI) | 0.82 [0.62, 1.09] |
| 11 Adverse events—serious Show forest plot | 2 | Odds Ratio (M‐H, Fixed, 95% CI) | Subtotals only | |
| 11.1 400/10 mcg | 2 | 890 | Odds Ratio (M‐H, Fixed, 95% CI) | 1.09 [0.66, 1.79] |
| 11.2 200/10 mcg | 2 | 894 | Odds Ratio (M‐H, Fixed, 95% CI) | 0.71 [0.41, 1.23] |
| 12 Adverse events—pneumonia Show forest plot | 2 | Odds Ratio (M‐H, Fixed, 95% CI) | Subtotals only | |
| 12.1 400/10 mcg | 2 | 890 | Odds Ratio (M‐H, Fixed, 95% CI) | 3.14 [0.84, 11.65] |
| 12.2 200/10 mcg | 2 | 894 | Odds Ratio (M‐H, Fixed, 95% CI) | 1.67 [0.40, 7.04] |
| 13 Adverse events—candidiasis Show forest plot | 2 | Odds Ratio (M‐H, Fixed, 95% CI) | Subtotals only | |
| 13.1 400/10 mcg | 2 | 890 | Odds Ratio (M‐H, Fixed, 95% CI) | 2.22 [0.50, 9.91] |
| 13.2 200/10 mcg | 2 | 894 | Odds Ratio (M‐H, Fixed, 95% CI) | 1.01 [0.17, 5.87] |
| 14 Adverse events—dysphonia Show forest plot | 1 | Odds Ratio (M‐H, Fixed, 95% CI) | Subtotals only | |
| 14.1 400/10 mcg | 1 | 461 | Odds Ratio (M‐H, Fixed, 95% CI) | 2.11 [0.19, 23.41] |
| 14.2 200/10 mcg | 1 | 475 | Odds Ratio (M‐H, Fixed, 95% CI) | 1.98 [0.18, 22.02] |
| 15 Adverse events—cataract Show forest plot | 1 | Odds Ratio (M‐H, Fixed, 95% CI) | Subtotals only | |
| 15.1 400/10 mcg | 1 | 429 | Odds Ratio (M‐H, Fixed, 95% CI) | 0.98 [0.06, 15.72] |
| 15.2 200/10 mcg | 1 | 419 | Odds Ratio (M‐H, Fixed, 95% CI) | 1.02 [0.06, 16.48] |
| 16 Adverse events—COPD requiring hospitalisation Show forest plot | 2 | Odds Ratio (M‐H, Fixed, 95% CI) | Subtotals only | |
| 16.1 400/10 mcg | 2 | 890 | Odds Ratio (M‐H, Fixed, 95% CI) | 0.80 [0.40, 1.60] |
| 16.2 200/10 mcg | 2 | 894 | Odds Ratio (M‐H, Fixed, 95% CI) | 0.36 [0.15, 0.86] |