| 1 Number of participants with one or more exacerbation Show forest plot | 5 | 1235 | Odds Ratio (M‐H, Fixed, 95% CI) | 0.88 [0.67, 1.15] |
|
| 1.1 Reversible population | 1 | 126 | Odds Ratio (M‐H, Fixed, 95% CI) | 0.32 [0.06, 1.66] |
| 1.2 Partially reversible population (mixed population) | 2 | 713 | Odds Ratio (M‐H, Fixed, 95% CI) | 1.00 [0.69, 1.44] |
| 1.3 Poorly reversible population | 2 | 396 | Odds Ratio (M‐H, Fixed, 95% CI) | 0.80 [0.53, 1.21] |
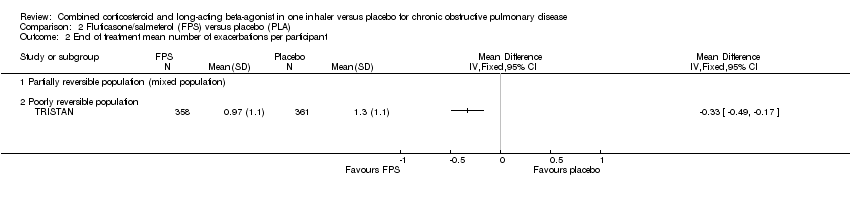
| 2 End of treatment mean number of exacerbations per participant Show forest plot | 1 | | Mean Difference (IV, Fixed, 95% CI) | Totals not selected |
|
| 2.1 Partially reversible population (mixed population) | 0 | | Mean Difference (IV, Fixed, 95% CI) | 0.0 [0.0, 0.0] |
| 2.2 Poorly reversible population | 1 | | Mean Difference (IV, Fixed, 95% CI) | 0.0 [0.0, 0.0] |
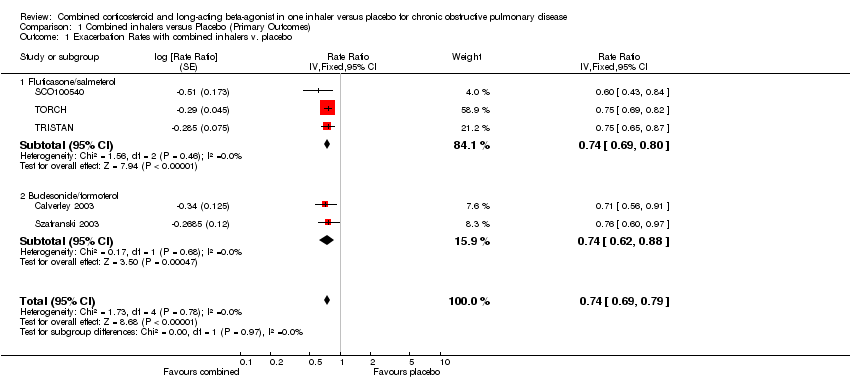
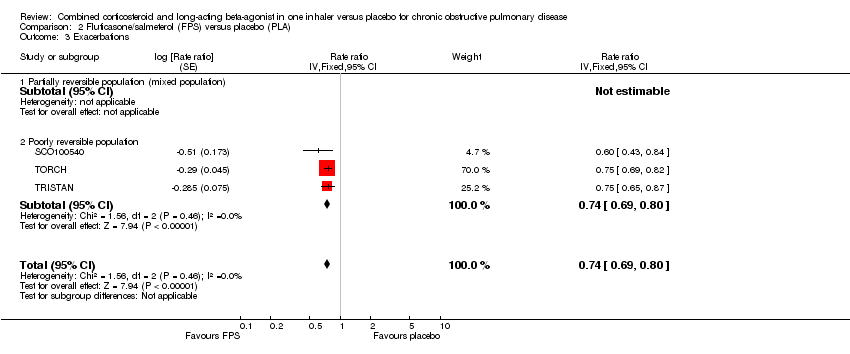
| 3 Exacerbations Show forest plot | 3 | | Rate ratio (Fixed, 95% CI) | 0.74 [0.69, 0.80] |
|
| 3.1 Partially reversible population (mixed population) | 0 | | Rate ratio (Fixed, 95% CI) | 0.0 [0.0, 0.0] |
| 3.2 Poorly reversible population | 3 | | Rate ratio (Fixed, 95% CI) | 0.74 [0.69, 0.80] |
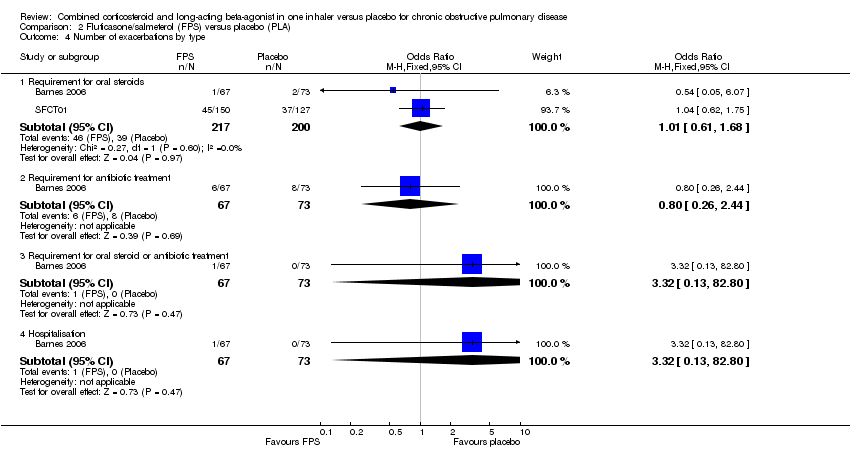
| 4 Number of exacerbations by type Show forest plot | 2 | | Odds Ratio (M‐H, Fixed, 95% CI) | Subtotals only |
|
| 4.1 Requirement for oral steroids | 2 | 417 | Odds Ratio (M‐H, Fixed, 95% CI) | 1.01 [0.61, 1.68] |
| 4.2 Requirement for antibiotic treatment | 1 | 140 | Odds Ratio (M‐H, Fixed, 95% CI) | 0.80 [0.26, 2.44] |
| 4.3 Requirement for oral steroid or antibiotic treatment | 1 | 140 | Odds Ratio (M‐H, Fixed, 95% CI) | 3.32 [0.13, 82.80] |
| 4.4 Hospitalisation | 1 | 140 | Odds Ratio (M‐H, Fixed, 95% CI) | 3.32 [0.13, 82.80] |
| 5 Exacerbations by type Show forest plot | 3 | | Rate ratio (Fixed, 95% CI) | Subtotals only |
|
| 5.1 Requirement for oral steroids | 3 | | Rate ratio (Fixed, 95% CI) | 0.57 [0.52, 0.63] |
| 5.2 Requirement for antibiotic treatment | 1 | | Rate ratio (Fixed, 95% CI) | 0.60 [0.43, 0.84] |
| 5.3 Requirement for oral steroid or antibiotic treatment | 0 | | Rate ratio (Fixed, 95% CI) | 0.0 [0.0, 0.0] |
| 5.4 Hospitalisation | 2 | | Rate ratio (Fixed, 95% CI) | 0.83 [0.70, 0.97] |
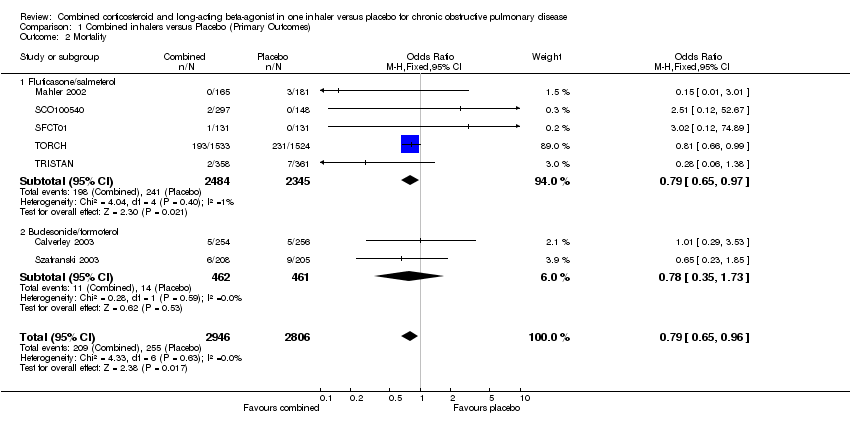
| 6 Mortality Show forest plot | 5 | 4829 | Odds Ratio (M‐H, Fixed, 95% CI) | 0.79 [0.65, 0.97] |
|
| 6.1 Mortality: three year data | 1 | 3057 | Odds Ratio (M‐H, Fixed, 95% CI) | 0.81 [0.66, 0.99] |
| 6.2 Mortality: >one and <three year data | 0 | 0 | Odds Ratio (M‐H, Fixed, 95% CI) | 0.0 [0.0, 0.0] |
| 6.3 Mortality: one year data | 3 | 1426 | Odds Ratio (M‐H, Fixed, 95% CI) | 0.63 [0.21, 1.90] |
| 6.4 Mortality: 6 month data | 1 | 346 | Odds Ratio (M‐H, Fixed, 95% CI) | 0.15 [0.01, 3.01] |
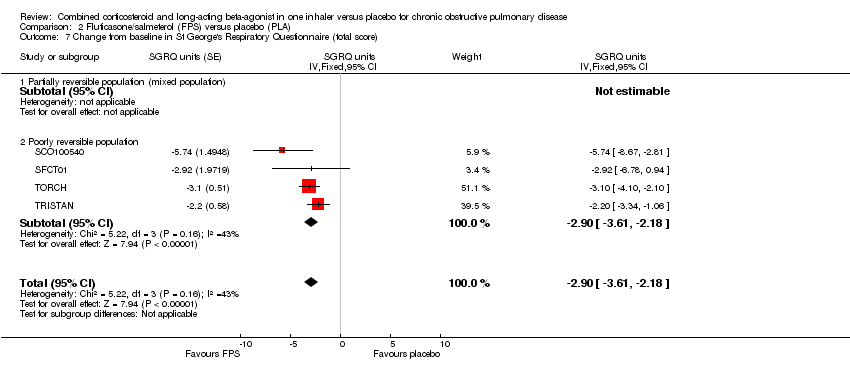
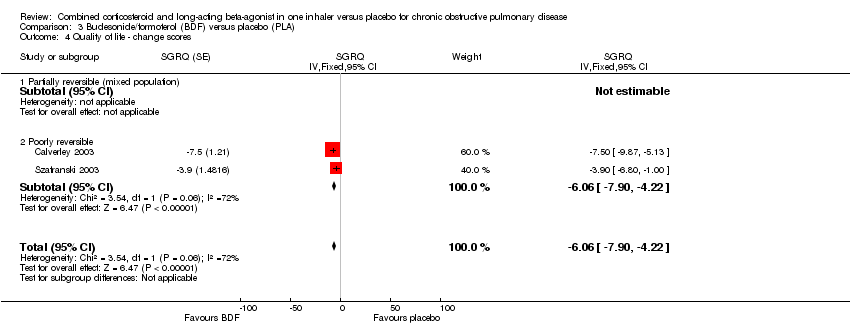
| 7 Change from baseline in St George's Respiratory Questionnaire (total score) Show forest plot | 4 | | SGRQ units (Fixed, 95% CI) | ‐2.90 [‐3.61, ‐2.18] |
|
| 7.1 Partially reversible population (mixed population) | 0 | | SGRQ units (Fixed, 95% CI) | 0.0 [0.0, 0.0] |
| 7.2 Poorly reversible population | 4 | | SGRQ units (Fixed, 95% CI) | ‐2.90 [‐3.61, ‐2.18] |
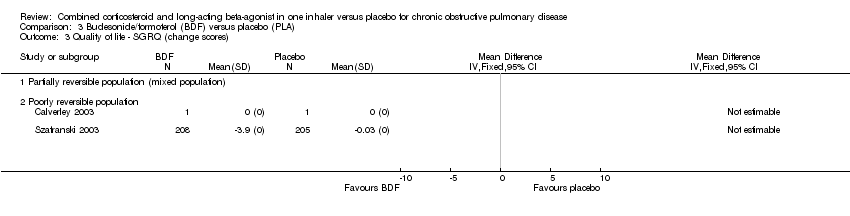
| 8 Change from baseline in St George's Respiratory Questionnaire (domain ‐ symptoms) Show forest plot | 1 | | SGRQ units (Fixed, 95% CI) | Totals not selected |
|
| 8.1 Partially reversible population (mixed population) | 0 | | SGRQ units (Fixed, 95% CI) | 0.0 [0.0, 0.0] |
| 8.2 Poorly reversible population | 1 | | SGRQ units (Fixed, 95% CI) | 0.0 [0.0, 0.0] |
| 9 Change from baseline in St George's Respiratory Questionnaire (domain ‐ activity) Show forest plot | 1 | | SGRQ units (Fixed, 95% CI) | Totals not selected |
|
| 9.1 Partially reversible population (mixed population) | 0 | | SGRQ units (Fixed, 95% CI) | 0.0 [0.0, 0.0] |
| 9.2 Poorly reversible population | 1 | | SGRQ units (Fixed, 95% CI) | 0.0 [0.0, 0.0] |
| 10 Change from baseline in St George's Respiratory Questionnaire (domain ‐ impact) Show forest plot | 1 | | SGRQ units (Fixed, 95% CI) | Totals not selected |
|
| 10.1 Partially reversible population (mixed population) | 0 | | SGRQ units (Fixed, 95% CI) | 0.0 [0.0, 0.0] |
| 10.2 Poorly reversible population | 1 | | SGRQ units (Fixed, 95% CI) | 0.0 [0.0, 0.0] |
| 11 End of treatment St George's Respiratory Questionnaire scores (total score) Show forest plot | 1 | | Mean Difference (IV, Fixed, 95% CI) | Totals not selected |
|
| 11.1 Partially reversible population (mixed population) | 0 | | Mean Difference (IV, Fixed, 95% CI) | 0.0 [0.0, 0.0] |
| 11.2 Poorly reversible population | 1 | | Mean Difference (IV, Fixed, 95% CI) | 0.0 [0.0, 0.0] |
| 12 End of treatment St George's Respiratory Questionnaire scores (domain ‐ breathlessness) Show forest plot | 1 | | Mean Difference (IV, Fixed, 95% CI) | Totals not selected |
|
| 12.1 Partially reversible population (mixed population) | 0 | | Mean Difference (IV, Fixed, 95% CI) | 0.0 [0.0, 0.0] |
| 12.2 Poorly reversible population | 1 | | Mean Difference (IV, Fixed, 95% CI) | 0.0 [0.0, 0.0] |
| 13 Change from baseline in Canadian Respiratory Disease Questionnaire scores Show forest plot | 2 | 712 | Mean Difference (IV, Fixed, 95% CI) | 5.0 [2.48, 7.52] |
|
| 13.1 Partially reversible population (mixed population) | 2 | 712 | Mean Difference (IV, Fixed, 95% CI) | 5.0 [2.48, 7.52] |
| 13.2 Poorly reversible population | 0 | 0 | Mean Difference (IV, Fixed, 95% CI) | 0.0 [0.0, 0.0] |
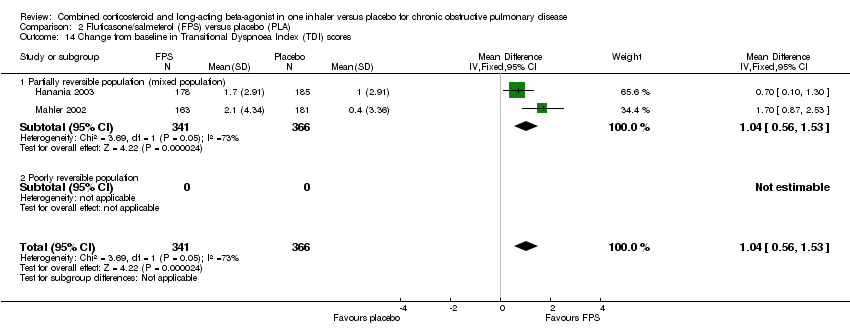
| 14 Change from baseline in Transitional Dyspnoea Index (TDI) scores Show forest plot | 2 | 707 | Mean Difference (IV, Fixed, 95% CI) | 1.04 [0.56, 1.53] |
|
| 14.1 Partially reversible population (mixed population) | 2 | 707 | Mean Difference (IV, Fixed, 95% CI) | 1.04 [0.56, 1.53] |
| 14.2 Poorly reversible population | 0 | 0 | Mean Difference (IV, Fixed, 95% CI) | 0.0 [0.0, 0.0] |
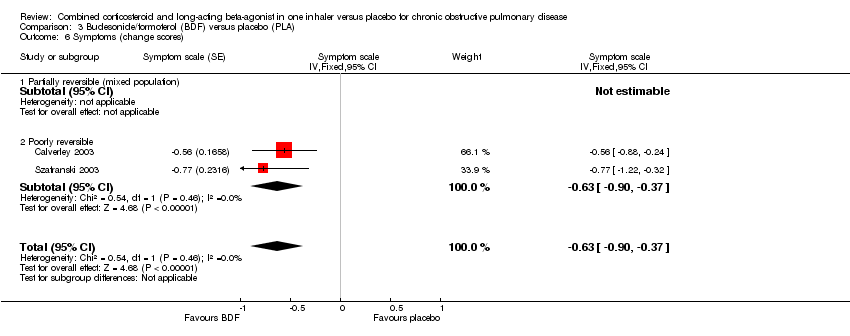
| 15 End of treatment symptom scores Show forest plot | 1 | | Mean Difference (IV, Fixed, 95% CI) | Totals not selected |
|
| 15.1 Partially reversible population (mixed population) | 0 | | Mean Difference (IV, Fixed, 95% CI) | 0.0 [0.0, 0.0] |
| 15.2 Poorly reversible population | 1 | | Mean Difference (IV, Fixed, 95% CI) | 0.0 [0.0, 0.0] |
| 16 Change from baseline in predose FEV1 Show forest plot | 5 | | Litres (Fixed, 95% CI) | 0.16 [0.14, 0.19] |
|
| 16.1 Reversible population | 3 | | Litres (Fixed, 95% CI) | 0.19 [0.15, 0.24] |
| 16.2 Partially reversible population (mixed population) | 0 | | Litres (Fixed, 95% CI) | 0.0 [0.0, 0.0] |
| 16.3 Poorly reversible population | 4 | | Litres (Fixed, 95% CI) | 0.15 [0.11, 0.18] |
| 16.4 Unclear reversibility | 0 | | Litres (Fixed, 95% CI) | 0.0 [0.0, 0.0] |
| 17 Change from baseline in postdose FEV1 Show forest plot | 1 | | Litres (Fixed, 95% CI) | Totals not selected |
|
| 17.1 Reversible population | 0 | | Litres (Fixed, 95% CI) | 0.0 [0.0, 0.0] |
| 17.2 Partially reversible population (mixed population) | 0 | | Litres (Fixed, 95% CI) | 0.0 [0.0, 0.0] |
| 17.3 Poorly reversible population | 1 | | Litres (Fixed, 95% CI) | 0.0 [0.0, 0.0] |
| 17.4 Unclear reversibility | 0 | | Litres (Fixed, 95% CI) | 0.0 [0.0, 0.0] |
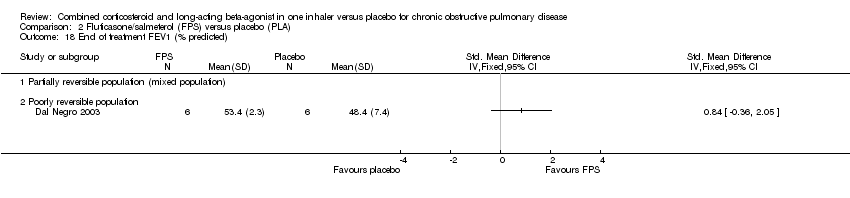
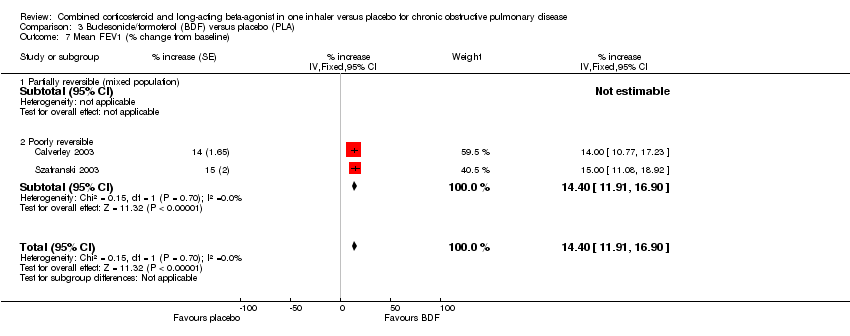
| 18 End of treatment FEV1 (% predicted) Show forest plot | 1 | | Std. Mean Difference (IV, Fixed, 95% CI) | Totals not selected |
|
| 18.1 Partially reversible population (mixed population) | 0 | | Std. Mean Difference (IV, Fixed, 95% CI) | 0.0 [0.0, 0.0] |
| 18.2 Poorly reversible population | 1 | | Std. Mean Difference (IV, Fixed, 95% CI) | 0.0 [0.0, 0.0] |
| 19 End of treatment FEV1 (Litres) Show forest plot | 2 | | Litres (Fixed, 95% CI) | 0.13 [0.10, 0.16] |
|
| 19.1 Partially reversible population (mixed population) | 0 | | Litres (Fixed, 95% CI) | 0.0 [0.0, 0.0] |
| 19.2 Poorly reversible population | 2 | | Litres (Fixed, 95% CI) | 0.13 [0.10, 0.16] |
| 20 End of treatment am PEF (L/min) Show forest plot | 1 | | L/min (Fixed, 95% CI) | Totals not selected |
|
| 20.1 Partially reversible population (mixed population) | 0 | | L/min (Fixed, 95% CI) | 0.0 [0.0, 0.0] |
| 20.2 Poorly reversible population | 1 | | L/min (Fixed, 95% CI) | 0.0 [0.0, 0.0] |
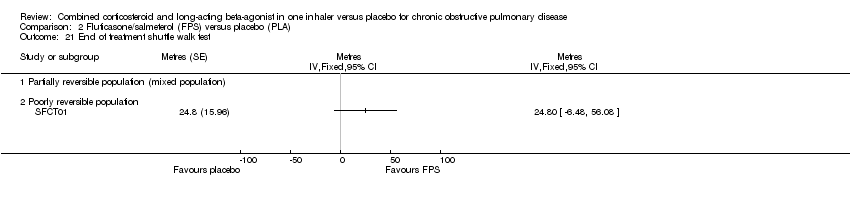
| 21 End of treatment shuttle walk test Show forest plot | 1 | | Metres (Fixed, 95% CI) | Totals not selected |
|
| 21.1 Partially reversible population (mixed population) | 0 | | Metres (Fixed, 95% CI) | 0.0 [0.0, 0.0] |
| 21.2 Poorly reversible population | 1 | | Metres (Fixed, 95% CI) | 0.0 [0.0, 0.0] |
| 22 End of treatment rescue medication usage (puffs/day) Show forest plot | 1 | | Mean Difference (IV, Fixed, 95% CI) | Totals not selected |
|
| 22.1 Partially reversible population (mixed population) | 0 | | Mean Difference (IV, Fixed, 95% CI) | 0.0 [0.0, 0.0] |
| 22.2 Poorly reversible population | 1 | | Mean Difference (IV, Fixed, 95% CI) | 0.0 [0.0, 0.0] |
| 23 Change from baseline in rescue medication usage (puffs/day) Show forest plot | 2 | 703 | Mean Difference (IV, Fixed, 95% CI) | ‐1.19 [‐1.83, ‐0.55] |
|
| 23.1 Partially reversible population (mixed population) | 2 | 703 | Mean Difference (IV, Fixed, 95% CI) | ‐1.19 [‐1.83, ‐0.55] |
| 23.2 Poorly reversible population | 0 | 0 | Mean Difference (IV, Fixed, 95% CI) | 0.0 [0.0, 0.0] |
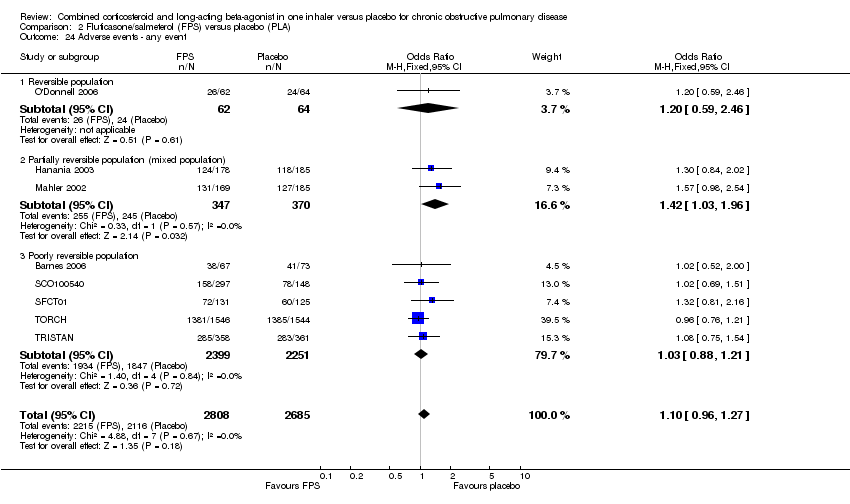
| 24 Adverse events ‐ any event Show forest plot | 8 | 5493 | Odds Ratio (M‐H, Fixed, 95% CI) | 1.10 [0.96, 1.27] |
|
| 24.1 Reversible population | 1 | 126 | Odds Ratio (M‐H, Fixed, 95% CI) | 1.20 [0.59, 2.46] |
| 24.2 Partially reversible population (mixed population) | 2 | 717 | Odds Ratio (M‐H, Fixed, 95% CI) | 1.42 [1.03, 1.96] |
| 24.3 Poorly reversible population | 5 | 4650 | Odds Ratio (M‐H, Fixed, 95% CI) | 1.03 [0.88, 1.21] |
| 25 Adverse events ‐ candidiasis Show forest plot | 6 | 1958 | Odds Ratio (M‐H, Fixed, 95% CI) | 5.73 [3.07, 10.67] |
|
| 25.1 Reversible population | 1 | 126 | Odds Ratio (M‐H, Fixed, 95% CI) | 1.03 [0.06, 16.88] |
| 25.2 Partially reversible population (mixed population) | 2 | 717 | Odds Ratio (M‐H, Fixed, 95% CI) | 11.13 [3.36, 36.90] |
| 25.3 Poorly reversible population | 3 | 1115 | Odds Ratio (M‐H, Fixed, 95% CI) | 4.40 [2.01, 9.62] |
| 25.4 Unclear reversibility | 0 | 0 | Odds Ratio (M‐H, Fixed, 95% CI) | 0.0 [0.0, 0.0] |
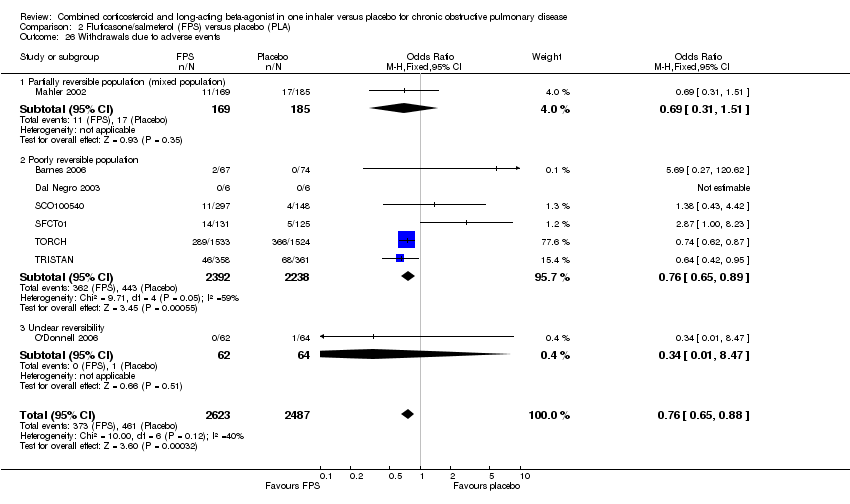
| 26 Withdrawals due to adverse events Show forest plot | 8 | 5110 | Odds Ratio (M‐H, Fixed, 95% CI) | 0.76 [0.65, 0.88] |
|
| 26.1 Partially reversible population (mixed population) | 1 | 354 | Odds Ratio (M‐H, Fixed, 95% CI) | 0.69 [0.31, 1.51] |
| 26.2 Poorly reversible population | 6 | 4630 | Odds Ratio (M‐H, Fixed, 95% CI) | 0.76 [0.65, 0.89] |
| 26.3 Unclear reversibility | 1 | 126 | Odds Ratio (M‐H, Fixed, 95% CI) | 0.34 [0.01, 8.47] |
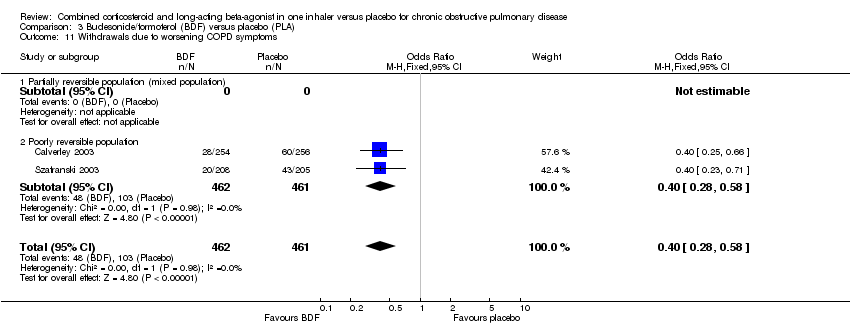
| 27 Withdrawals due to lack of efficacy/exacerbations Show forest plot | 5 | 4620 | Odds Ratio (M‐H, Fixed, 95% CI) | 0.30 [0.21, 0.42] |
|
| 27.1 Partially reversible population (mixed population) | 0 | 0 | Odds Ratio (M‐H, Fixed, 95% CI) | 0.0 [0.0, 0.0] |
| 27.2 Poorly reversible population | 5 | 4620 | Odds Ratio (M‐H, Fixed, 95% CI) | 0.30 [0.21, 0.42] |
| 27.3 Unclear reversibility | 0 | 0 | Odds Ratio (M‐H, Fixed, 95% CI) | 0.0 [0.0, 0.0] |
| 28 Withdrawals Show forest plot | 8 | 5450 | Odds Ratio (M‐H, Fixed, 95% CI) | 0.70 [0.62, 0.78] |
|
| 28.1 Reversible population | 1 | 121 | Odds Ratio (M‐H, Fixed, 95% CI) | 2.95 [0.30, 29.18] |
| 28.2 Partially reversible population (mixed population) | 2 | 709 | Odds Ratio (M‐H, Fixed, 95% CI) | 0.82 [0.60, 1.13] |
| 28.3 Poorly reversible population | 5 | 4620 | Odds Ratio (M‐H, Fixed, 95% CI) | 0.68 [0.60, 0.76] |
| 28.4 Unclear reversibility | 0 | 0 | Odds Ratio (M‐H, Fixed, 95% CI) | 0.0 [0.0, 0.0] |
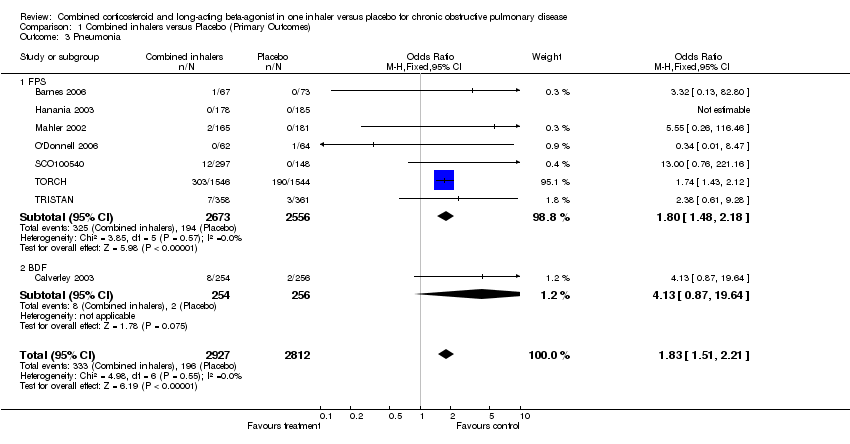
| 29 Adverse events ‐ pneumonia Show forest plot | 7 | 5229 | Odds Ratio (M‐H, Fixed, 95% CI) | 1.80 [1.48, 2.18] |
|
| 29.1 Reversible population | 1 | 126 | Odds Ratio (M‐H, Fixed, 95% CI) | 0.34 [0.01, 8.47] |
| 29.2 Partially reversible population (mixed population) | 2 | 709 | Odds Ratio (M‐H, Fixed, 95% CI) | 5.55 [0.26, 116.46] |
| 29.3 Poorly reversible population | 4 | 4394 | Odds Ratio (M‐H, Fixed, 95% CI) | 1.80 [1.48, 2.18] |
| 29.4 Unclear reversibility | 0 | 0 | Odds Ratio (M‐H, Fixed, 95% CI) | 0.0 [0.0, 0.0] |
| 30 Adverse events ‐ nasopharyngitis Show forest plot | 2 | 3535 | Odds Ratio (M‐H, Fixed, 95% CI) | 1.28 [1.05, 1.56] |
|
| 30.1 Partially reversible population (mixed population) | 0 | 0 | Odds Ratio (M‐H, Fixed, 95% CI) | 0.0 [0.0, 0.0] |
| 30.2 Poorly reversible population | 2 | 3535 | Odds Ratio (M‐H, Fixed, 95% CI) | 1.28 [1.05, 1.56] |
| 30.3 Unclear reversibility | 0 | 0 | Odds Ratio (M‐H, Fixed, 95% CI) | 0.0 [0.0, 0.0] |
| 31 Adverse events ‐ pharyngolaryngeal pain Show forest plot | 1 | | Odds Ratio (M‐H, Fixed, 95% CI) | Totals not selected |
|
| 31.1 Partially reversible population (mixed population) | 0 | | Odds Ratio (M‐H, Fixed, 95% CI) | 0.0 [0.0, 0.0] |
| 31.2 Poorly reversible population | 1 | | Odds Ratio (M‐H, Fixed, 95% CI) | 0.0 [0.0, 0.0] |
| 31.3 Unclear reversibility | 0 | | Odds Ratio (M‐H, Fixed, 95% CI) | 0.0 [0.0, 0.0] |
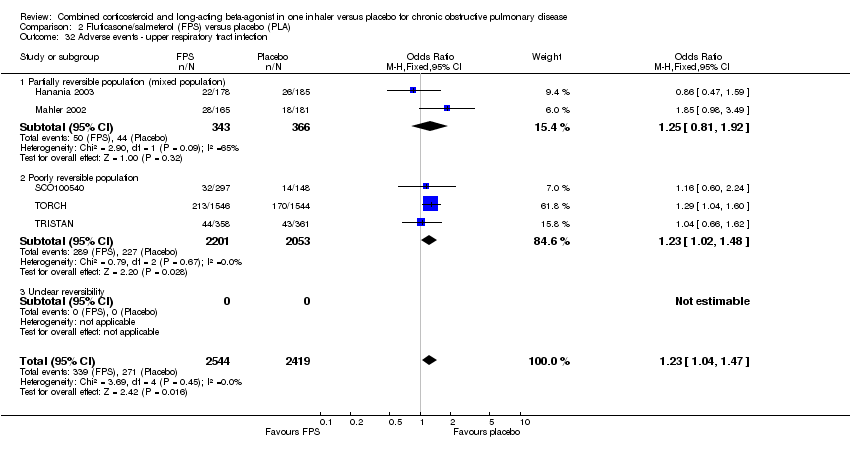
| 32 Adverse events ‐ upper respiratory tract infection Show forest plot | 5 | 4963 | Odds Ratio (M‐H, Fixed, 95% CI) | 1.23 [1.04, 1.47] |
|
| 32.1 Partially reversible population (mixed population) | 2 | 709 | Odds Ratio (M‐H, Fixed, 95% CI) | 1.25 [0.81, 1.92] |
| 32.2 Poorly reversible population | 3 | 4254 | Odds Ratio (M‐H, Fixed, 95% CI) | 1.23 [1.02, 1.48] |
| 32.3 Unclear reversibility | 0 | 0 | Odds Ratio (M‐H, Fixed, 95% CI) | 0.0 [0.0, 0.0] |
| 33 Adverse events ‐ headache Show forest plot | 5 | 4367 | Odds Ratio (M‐H, Fixed, 95% CI) | 1.06 [0.85, 1.32] |
|
| 33.1 Reversible population | 1 | 123 | Odds Ratio (M‐H, Fixed, 95% CI) | 0.22 [0.02, 2.01] |
| 33.2 Partially reversible population (mixed population) | 2 | 709 | Odds Ratio (M‐H, Fixed, 95% CI) | 1.38 [0.91, 2.10] |
| 33.3 Poorly reversible population | 2 | 3535 | Odds Ratio (M‐H, Fixed, 95% CI) | 0.97 [0.75, 1.27] |
| 33.4 Unclear reversibility | 0 | 0 | Odds Ratio (M‐H, Fixed, 95% CI) | 0.0 [0.0, 0.0] |
| 34 Adverse events ‐ hoarseness Show forest plot | 2 | 585 | Odds Ratio (M‐H, Fixed, 95% CI) | 8.79 [1.11, 69.62] |
|
| 34.1 Partially reversible population (mixed population) | 0 | 0 | Odds Ratio (M‐H, Fixed, 95% CI) | 0.0 [0.0, 0.0] |
| 34.2 Poorly reversible population | 2 | 585 | Odds Ratio (M‐H, Fixed, 95% CI) | 8.79 [1.11, 69.62] |
| 34.3 Unclear reversibility | 0 | 0 | Odds Ratio (M‐H, Fixed, 95% CI) | 0.0 [0.0, 0.0] |
| 35 Adverse events ‐ pyrexia Show forest plot | 1 | | Odds Ratio (M‐H, Fixed, 95% CI) | Totals not selected |
|
| 35.1 Partially reversible population (mixed population) | 0 | | Odds Ratio (M‐H, Fixed, 95% CI) | 0.0 [0.0, 0.0] |
| 35.2 Poorly reversible population | 1 | | Odds Ratio (M‐H, Fixed, 95% CI) | 0.0 [0.0, 0.0] |
| 35.3 Unclear reversibility | 0 | | Odds Ratio (M‐H, Fixed, 95% CI) | 0.0 [0.0, 0.0] |
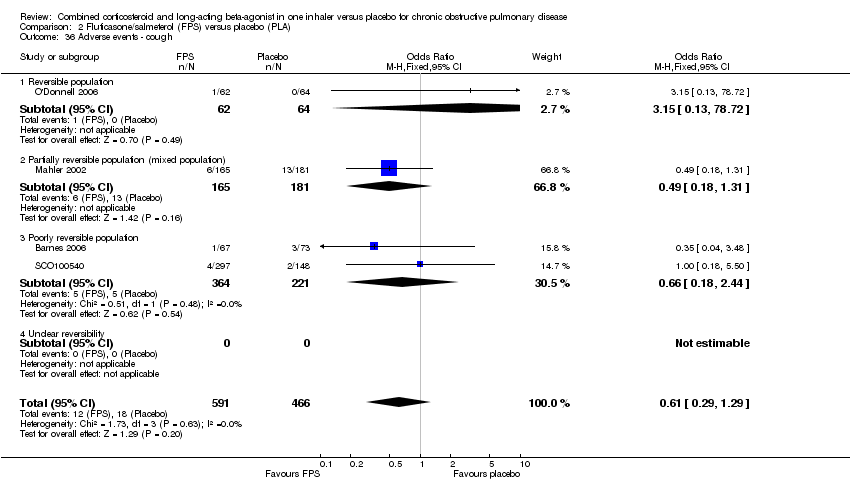
| 36 Adverse events ‐ cough Show forest plot | 4 | 1057 | Odds Ratio (M‐H, Fixed, 95% CI) | 0.61 [0.29, 1.29] |
|
| 36.1 Reversible population | 1 | 126 | Odds Ratio (M‐H, Fixed, 95% CI) | 3.15 [0.13, 78.72] |
| 36.2 Partially reversible population (mixed population) | 1 | 346 | Odds Ratio (M‐H, Fixed, 95% CI) | 0.49 [0.18, 1.31] |
| 36.3 Poorly reversible population | 2 | 585 | Odds Ratio (M‐H, Fixed, 95% CI) | 0.66 [0.18, 2.44] |
| 36.4 Unclear reversibility | 0 | 0 | Odds Ratio (M‐H, Fixed, 95% CI) | 0.0 [0.0, 0.0] |
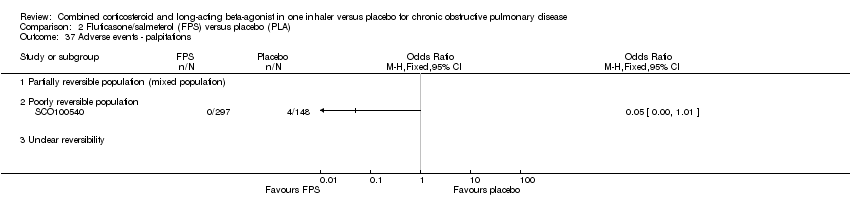
| 37 Adverse events ‐ palpitations Show forest plot | 1 | | Odds Ratio (M‐H, Fixed, 95% CI) | Totals not selected |
|
| 37.1 Partially reversible population (mixed population) | 0 | | Odds Ratio (M‐H, Fixed, 95% CI) | 0.0 [0.0, 0.0] |
| 37.2 Poorly reversible population | 1 | | Odds Ratio (M‐H, Fixed, 95% CI) | 0.0 [0.0, 0.0] |
| 37.3 Unclear reversibility | 0 | | Odds Ratio (M‐H, Fixed, 95% CI) | 0.0 [0.0, 0.0] |
| 38 Adverse events ‐ mouth ulceration Show forest plot | 1 | | Odds Ratio (M‐H, Fixed, 95% CI) | Totals not selected |
|
| 38.1 Partially reversible population (mixed population) | 0 | | Odds Ratio (M‐H, Fixed, 95% CI) | 0.0 [0.0, 0.0] |
| 38.2 Poorly reversible population | 1 | | Odds Ratio (M‐H, Fixed, 95% CI) | 0.0 [0.0, 0.0] |
| 38.3 Unclear reversibility | 0 | | Odds Ratio (M‐H, Fixed, 95% CI) | 0.0 [0.0, 0.0] |
| 39 Adverse events ‐ toothache Show forest plot | 1 | | Odds Ratio (M‐H, Fixed, 95% CI) | Totals not selected |
|
| 39.1 Partially reversible population (mixed population) | 0 | | Odds Ratio (M‐H, Fixed, 95% CI) | 0.0 [0.0, 0.0] |
| 39.2 Poorly reversible population | 1 | | Odds Ratio (M‐H, Fixed, 95% CI) | 0.0 [0.0, 0.0] |
| 39.3 Unclear reversibility | 0 | | Odds Ratio (M‐H, Fixed, 95% CI) | 0.0 [0.0, 0.0] |
| 40 Adverse events ‐ urinary tract infection Show forest plot | 1 | | Odds Ratio (M‐H, Fixed, 95% CI) | Totals not selected |
|
| 40.1 Partially reversible population (mixed population) | 0 | | Odds Ratio (M‐H, Fixed, 95% CI) | 0.0 [0.0, 0.0] |
| 40.2 Poorly reversible population | 1 | | Odds Ratio (M‐H, Fixed, 95% CI) | 0.0 [0.0, 0.0] |
| 40.3 Unclear reversibility | 0 | | Odds Ratio (M‐H, Fixed, 95% CI) | 0.0 [0.0, 0.0] |
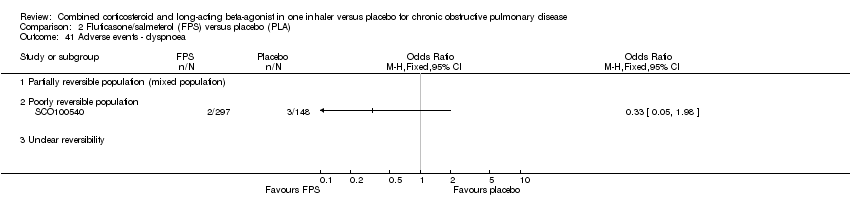
| 41 Adverse events ‐ dyspnoea Show forest plot | 1 | | Odds Ratio (M‐H, Fixed, 95% CI) | Totals not selected |
|
| 41.1 Partially reversible population (mixed population) | 0 | | Odds Ratio (M‐H, Fixed, 95% CI) | 0.0 [0.0, 0.0] |
| 41.2 Poorly reversible population | 1 | | Odds Ratio (M‐H, Fixed, 95% CI) | 0.0 [0.0, 0.0] |
| 41.3 Unclear reversibility | 0 | | Odds Ratio (M‐H, Fixed, 95% CI) | 0.0 [0.0, 0.0] |
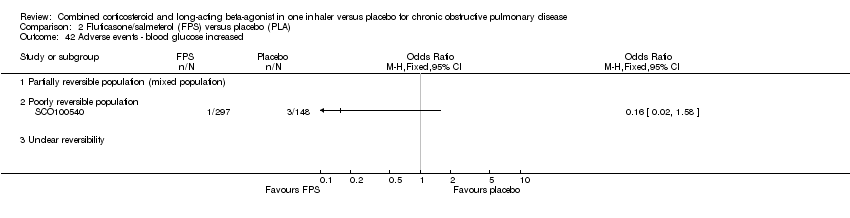
| 42 Adverse events ‐ blood glucose increased Show forest plot | 1 | | Odds Ratio (M‐H, Fixed, 95% CI) | Totals not selected |
|
| 42.1 Partially reversible population (mixed population) | 0 | | Odds Ratio (M‐H, Fixed, 95% CI) | 0.0 [0.0, 0.0] |
| 42.2 Poorly reversible population | 1 | | Odds Ratio (M‐H, Fixed, 95% CI) | 0.0 [0.0, 0.0] |
| 42.3 Unclear reversibility | 0 | | Odds Ratio (M‐H, Fixed, 95% CI) | 0.0 [0.0, 0.0] |
| 43 Adverse events ‐ insomnia Show forest plot | 1 | | Odds Ratio (M‐H, Fixed, 95% CI) | Totals not selected |
|
| 43.1 Partially reversible population (mixed population) | 0 | | Odds Ratio (M‐H, Fixed, 95% CI) | 0.0 [0.0, 0.0] |
| 43.2 Poorly reversible population | 1 | | Odds Ratio (M‐H, Fixed, 95% CI) | 0.0 [0.0, 0.0] |
| 43.3 Unclear reversibility | 0 | | Odds Ratio (M‐H, Fixed, 95% CI) | 0.0 [0.0, 0.0] |
| 44 Adverse events ‐ bronchitis Show forest plot | 1 | | Odds Ratio (M‐H, Fixed, 95% CI) | Totals not selected |
|
| 44.1 Partially reversible population (mixed population) | 0 | | Odds Ratio (M‐H, Fixed, 95% CI) | 0.0 [0.0, 0.0] |
| 44.2 Poorly reversible population | 1 | | Odds Ratio (M‐H, Fixed, 95% CI) | 0.0 [0.0, 0.0] |
| 44.3 Unclear reversibility | 0 | | Odds Ratio (M‐H, Fixed, 95% CI) | 0.0 [0.0, 0.0] |