Continuous support for women during childbirth
Información
- DOI:
- https://doi.org/10.1002/14651858.CD003766.pub5Copiar DOI

- Base de datos:
-
- Cochrane Database of Systematic Reviews
- Versión publicada:
-
- 15 julio 2013see what's new
- Tipo:
-
- Intervention
- Etapa:
-
- Review
- Grupo Editorial Cochrane:
-
Grupo Cochrane de Embarazo y parto
- Copyright:
-
- Copyright © 2013 The Cochrane Collaboration. Published by John Wiley & Sons, Ltd.
Cifras del artículo
Altmetric:
Citado por:
Autores
Contributions of authors
Ellen Hodnett wrote the initial draft of the protocol. Carol Sakala wrote the initial draft of the Discussion in the previous version of the review. Simon Gates wrote the initial draft of the statistical methods and provided statistical advice for the protocol and each update of the review. All review authors participated in all aspects of the preparation of the protocol and in writing the text of the review. All authors participated in the updates of the review.
Sources of support
Internal sources
-
University of Toronto, Canada.
-
University of the Witwatersrand, South Africa.
-
Fort Hare University, South Africa.
-
East London Hospital Complex, South Africa.
-
National Perinatal Epidemiology Unit, Oxford, UK.
-
Childbirth Connection (formerly Maternity Center Association), USA.
-
Warwick Clinical Trials Unit, University of Warwick, UK.
External sources
-
National Institute for Health Research, UK.
NIHR Programme of centrally‐managed pregnancy and childbirth systematic reviews of priority to the NHS and users of the NHS:10/4001/02
Declarations of interest
Ellen Hodnett was the principal investigator for two labour support trials. Justus Hofmeyr was the principal investigator for one labour support trial.
Acknowledgements
We are very grateful to the investigators who provided additional information: O Bruggemann, D Campbell, R Cogan, A Gagnon, E Hemminki, M Kashanian, J Kennell, M Klaus, A Langer, B Madi, S McGrath, G Trueba, E Kopplin, and S Yuengong. We thank Agnes Cho, Qian Xu and Jiang Huangye for translation of Chinese publications, and Qian Xu for contacting the trial author for additional details. Ellen Hodnett and Justus Hofmeyr also provided additional information about their trials. Tanya Webb performed the second data entry on the earlier version of the review, contacted trial authors for additional information and provided secretarial support. The Consumer Panel of the Pregnancy and Childbirth Group (of which Carol Sakala is a member) provided many helpful suggestions for both the protocol and earlier versions of the review.
The National Institute for Health Research (NIHR) is the largest single funder of the Cochrane Pregnancy and Childbirth Group. The views and opinions expressed therein are those of the authors and do not necessarily reflect those of the NIHR, NHS or the Department of Health.
Version history
| Published | Title | Stage | Authors | Version |
| 2017 Jul 06 | Continuous support for women during childbirth | Review | Meghan A Bohren, G Justus Hofmeyr, Carol Sakala, Rieko K Fukuzawa, Anna Cuthbert | |
| 2013 Jul 15 | Continuous support for women during childbirth | Review | Ellen D Hodnett, Simon Gates, G Justus Hofmeyr, Carol Sakala | |
| 2012 Oct 17 | Continuous support for women during childbirth | Review | Ellen D Hodnett, Simon Gates, G Justus Hofmeyr, Carol Sakala | |
| 2011 Feb 16 | Continuous support for women during childbirth | Review | Ellen D Hodnett, Simon Gates, G Justus Hofmeyr, Carol Sakala, Julie Weston | |
| 2007 Jul 18 | Continuous support for women during childbirth | Review | Ellen D Hodnett, Simon Gates, G Justus Hofmeyr, Carol Sakala | |
| 2003 Jul 21 | Continuous support for women during childbirth | Review | Ellen D Hodnett, Simon Gates, J Hofmeyr G, Carol Sakala, G Justus Hofmeyr | |
Keywords
MeSH
Medical Subject Headings (MeSH) Keywords
Medical Subject Headings Check Words
Female; Humans; Pregnancy;
PICO
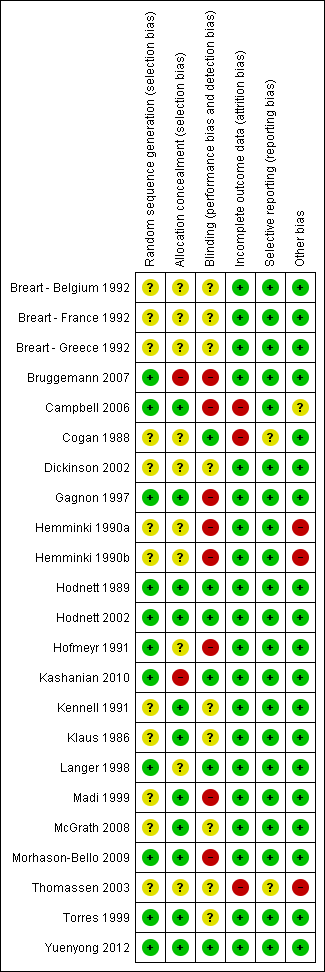
Methodological quality summary: review authors' judgements about each methodological quality item for each included study.
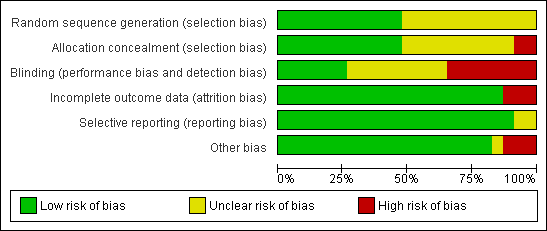
Methodological quality graph: review authors' judgements about each methodological quality item presented as percentages across all included studies

Comparison 1 Continuous support versus usual care ‐ all trials, Outcome 1 Any analgesia/anaesthesia.
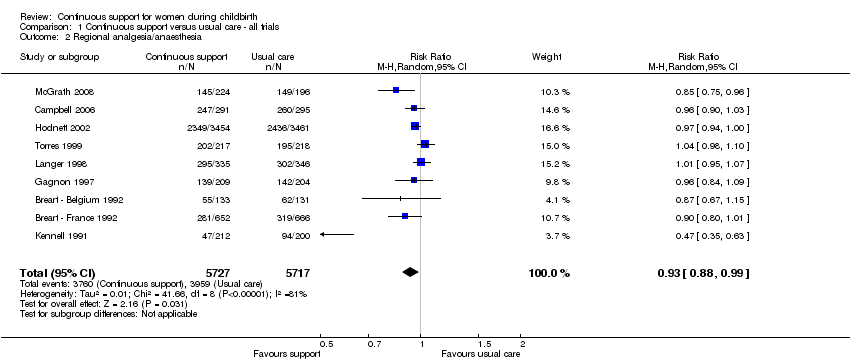
Comparison 1 Continuous support versus usual care ‐ all trials, Outcome 2 Regional analgesia/anaesthesia.
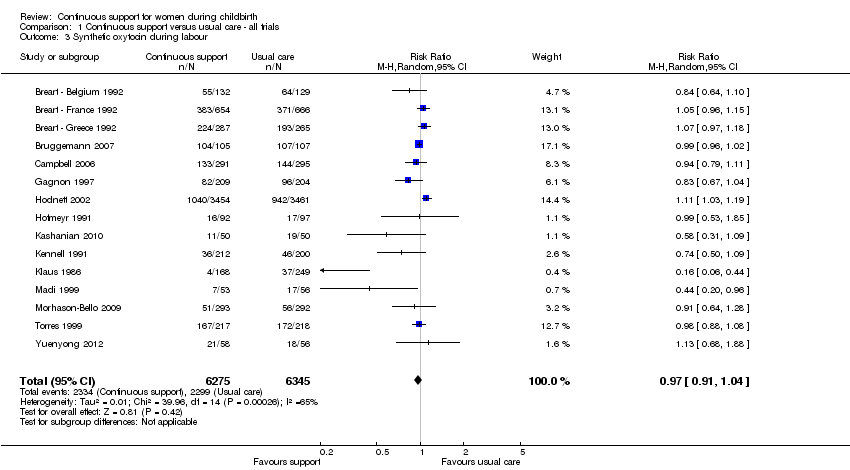
Comparison 1 Continuous support versus usual care ‐ all trials, Outcome 3 Synthetic oxytocin during labour.
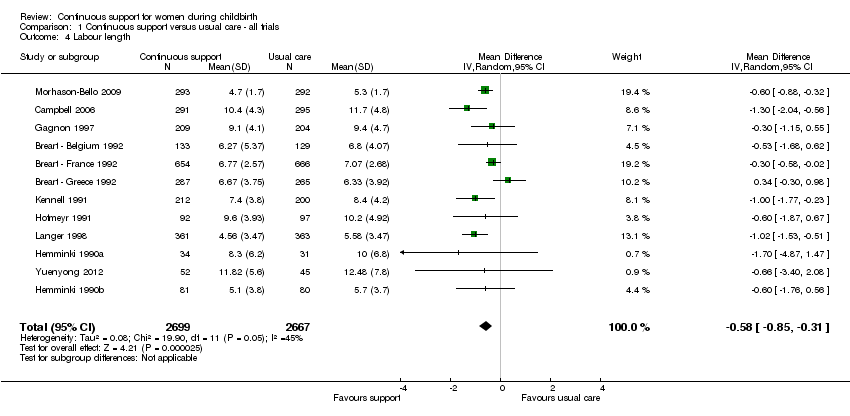
Comparison 1 Continuous support versus usual care ‐ all trials, Outcome 4 Labour length.
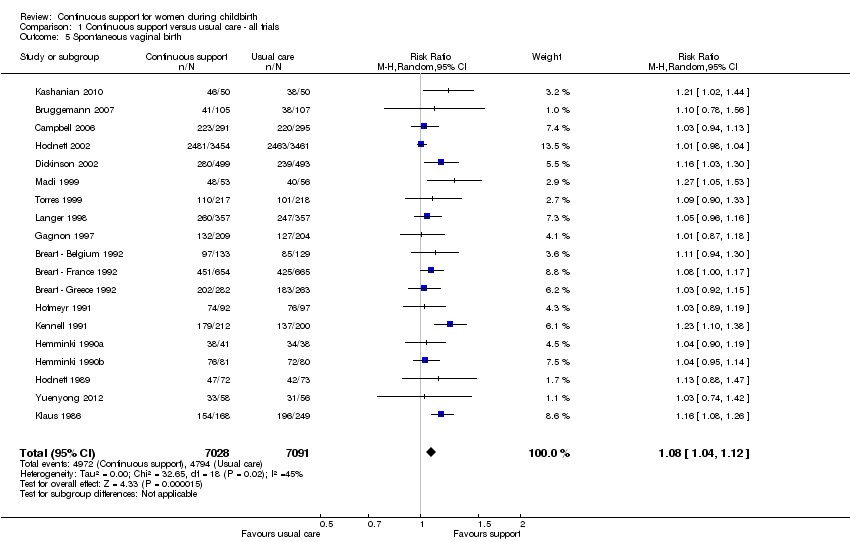
Comparison 1 Continuous support versus usual care ‐ all trials, Outcome 5 Spontaneous vaginal birth.

Comparison 1 Continuous support versus usual care ‐ all trials, Outcome 6 Instrumental vaginal birth.

Comparison 1 Continuous support versus usual care ‐ all trials, Outcome 7 Caesarean birth.
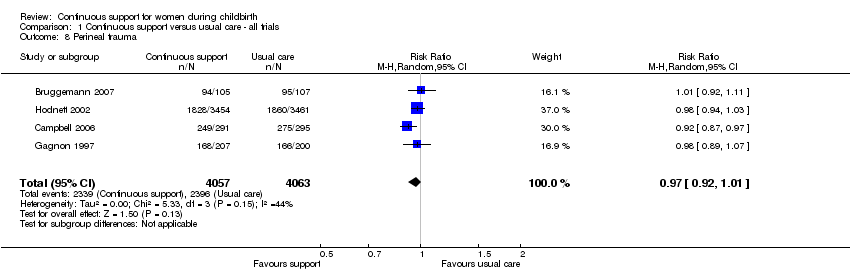
Comparison 1 Continuous support versus usual care ‐ all trials, Outcome 8 Perineal trauma.
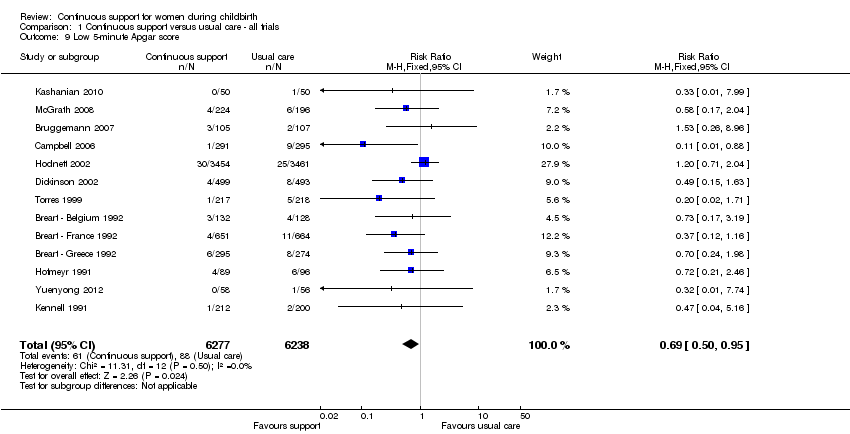
Comparison 1 Continuous support versus usual care ‐ all trials, Outcome 9 Low 5‐minute Apgar score.

Comparison 1 Continuous support versus usual care ‐ all trials, Outcome 10 Admission to special care nursery.
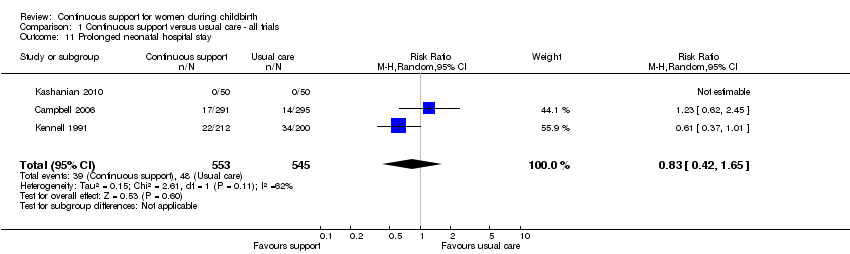
Comparison 1 Continuous support versus usual care ‐ all trials, Outcome 11 Prolonged neonatal hospital stay.
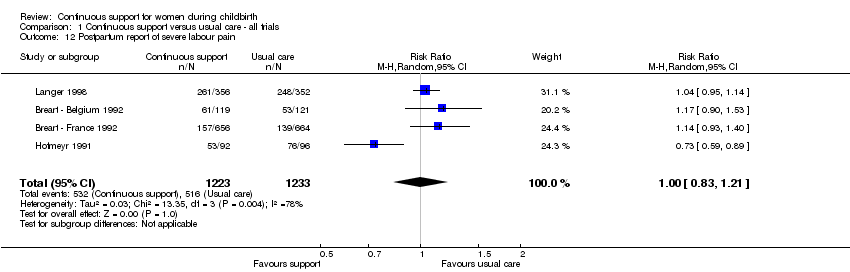
Comparison 1 Continuous support versus usual care ‐ all trials, Outcome 12 Postpartum report of severe labour pain.
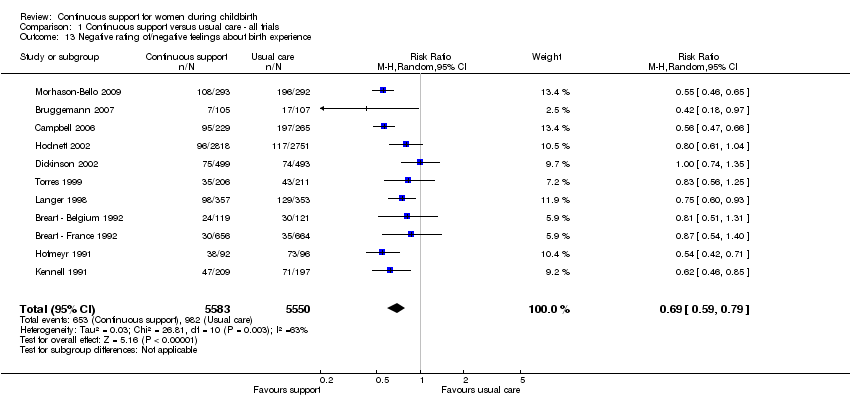
Comparison 1 Continuous support versus usual care ‐ all trials, Outcome 13 Negative rating of/negative feelings about birth experience.

Comparison 1 Continuous support versus usual care ‐ all trials, Outcome 14 Difficulty mothering.
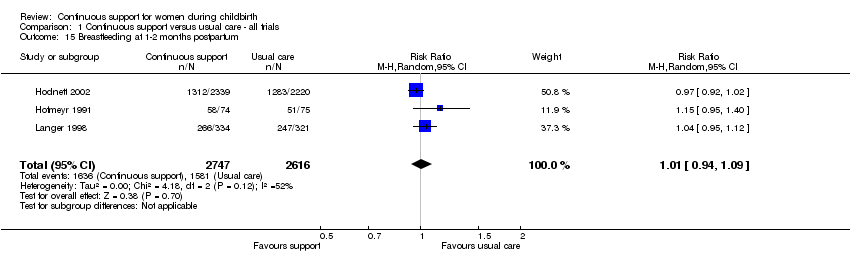
Comparison 1 Continuous support versus usual care ‐ all trials, Outcome 15 Breastfeeding at 1‐2 months postpartum.

Comparison 1 Continuous support versus usual care ‐ all trials, Outcome 16 Postpartum depression.
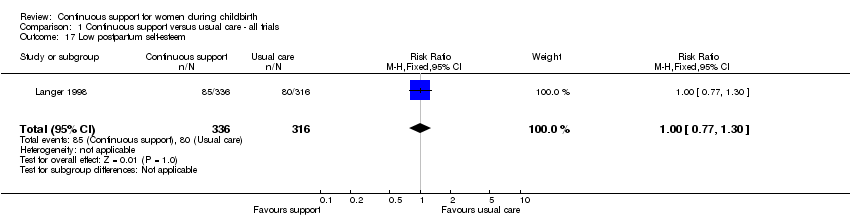
Comparison 1 Continuous support versus usual care ‐ all trials, Outcome 17 Low postpartum self‐esteem.
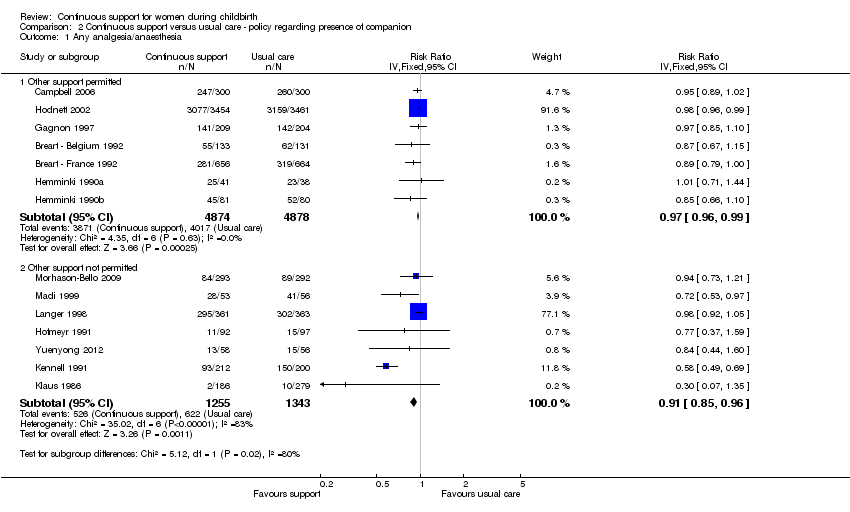
Comparison 2 Continuous support versus usual care ‐ policy regarding presence of companion, Outcome 1 Any analgesia/anaesthesia.

Comparison 2 Continuous support versus usual care ‐ policy regarding presence of companion, Outcome 2 Synthetic oxytocin during labour.
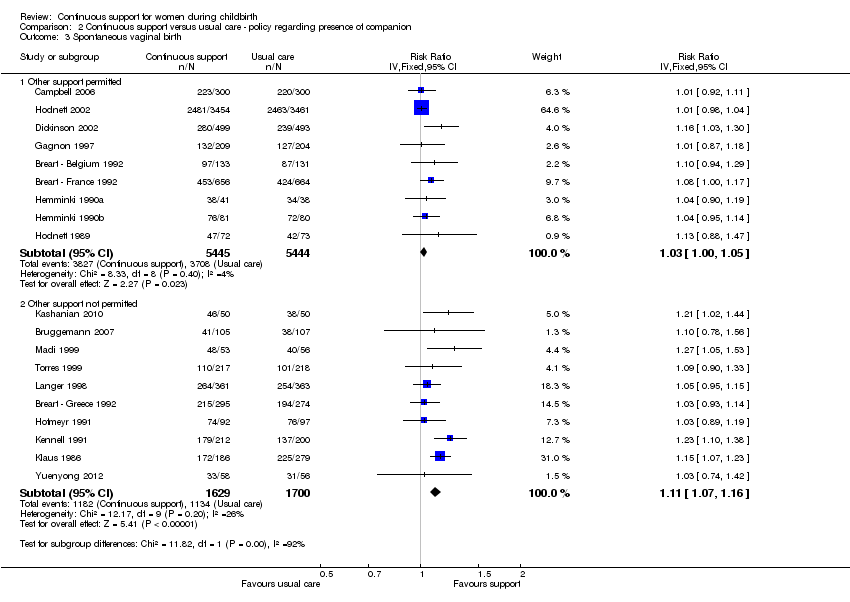
Comparison 2 Continuous support versus usual care ‐ policy regarding presence of companion, Outcome 3 Spontaneous vaginal birth.

Comparison 2 Continuous support versus usual care ‐ policy regarding presence of companion, Outcome 4 Caesarean birth.

Comparison 2 Continuous support versus usual care ‐ policy regarding presence of companion, Outcome 5 Admission to special care nursery.
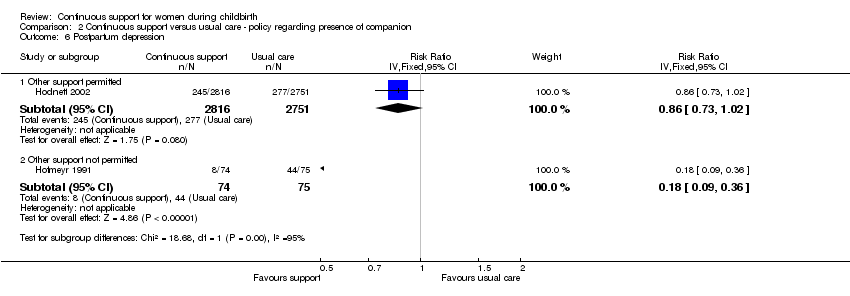
Comparison 2 Continuous support versus usual care ‐ policy regarding presence of companion, Outcome 6 Postpartum depression.

Comparison 2 Continuous support versus usual care ‐ policy regarding presence of companion, Outcome 7 Negative rating of/negative feelings about birth experience.

Comparison 2 Continuous support versus usual care ‐ policy regarding presence of companion, Outcome 8 Breastfeeding at 1‐2 months postpartum.
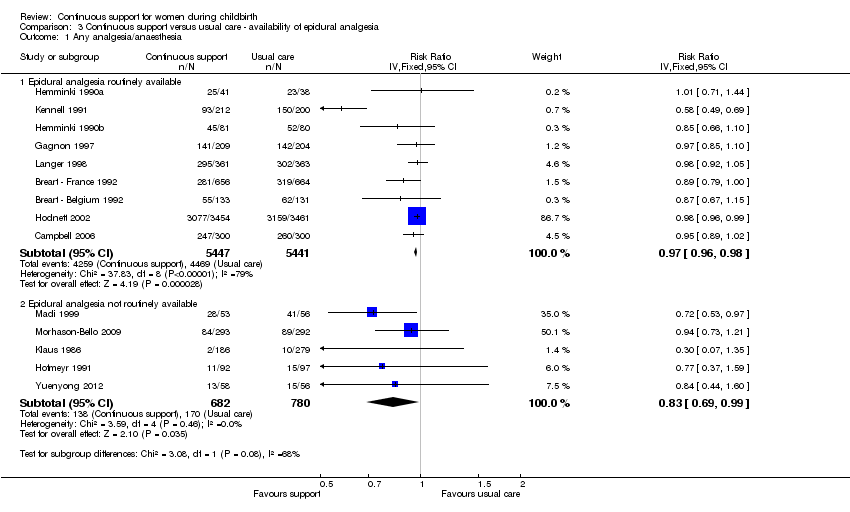
Comparison 3 Continuous support versus usual care ‐ availability of epidural analgesia, Outcome 1 Any analgesia/anaesthesia.

Comparison 3 Continuous support versus usual care ‐ availability of epidural analgesia, Outcome 2 Synthetic oxytocin during labour.

Comparison 3 Continuous support versus usual care ‐ availability of epidural analgesia, Outcome 3 Spontaneous vaginal birth.
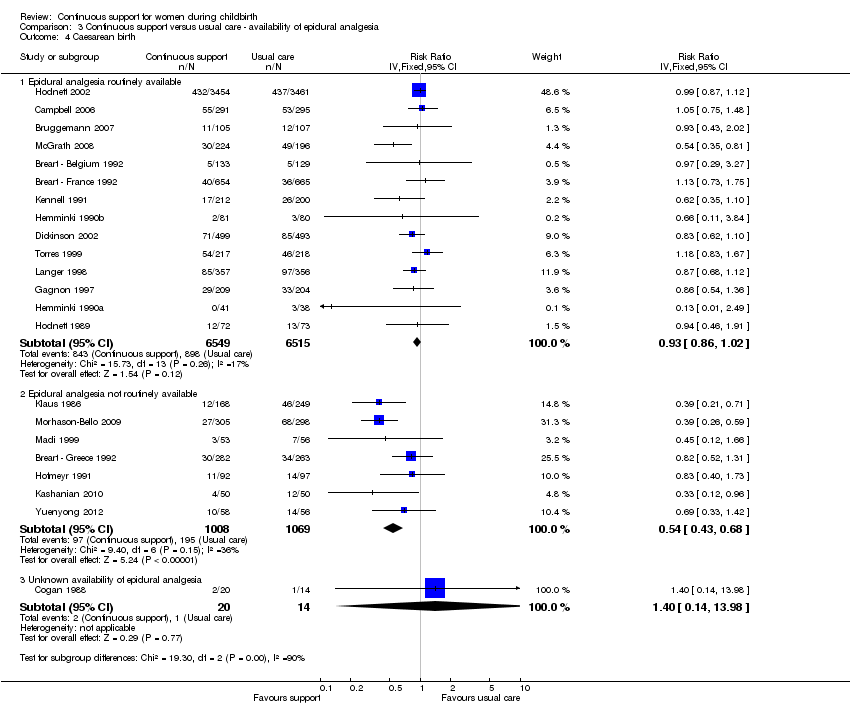
Comparison 3 Continuous support versus usual care ‐ availability of epidural analgesia, Outcome 4 Caesarean birth.

Comparison 3 Continuous support versus usual care ‐ availability of epidural analgesia, Outcome 5 Admission to special care nursery.

Comparison 3 Continuous support versus usual care ‐ availability of epidural analgesia, Outcome 6 Postpartum depression.

Comparison 3 Continuous support versus usual care ‐ availability of epidural analgesia, Outcome 7 Negative rating of/negative feelings about birth experience.
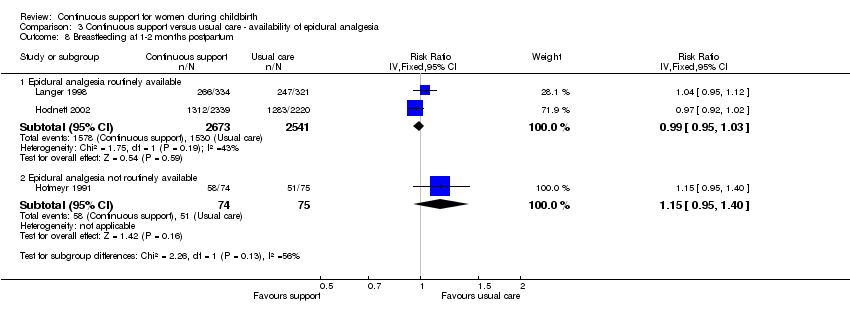
Comparison 3 Continuous support versus usual care ‐ availability of epidural analgesia, Outcome 8 Breastfeeding at 1‐2 months postpartum.
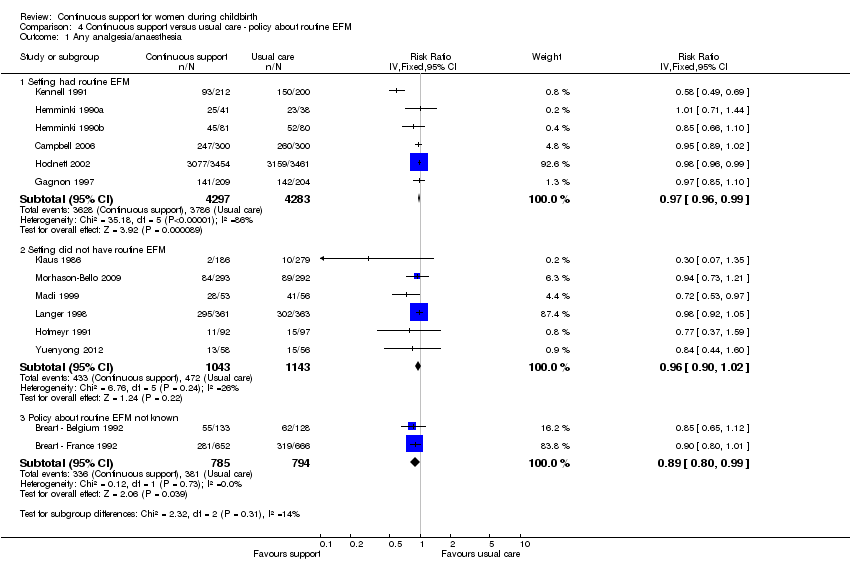
Comparison 4 Continuous support versus usual care ‐ policy about routine EFM, Outcome 1 Any analgesia/anaesthesia.
Comparison 4 Continuous support versus usual care ‐ policy about routine EFM, Outcome 2 Synthetic oxytocin during labour.
Comparison 4 Continuous support versus usual care ‐ policy about routine EFM, Outcome 3 Spontaneous vaginal birth.

Comparison 4 Continuous support versus usual care ‐ policy about routine EFM, Outcome 4 Caesarean birth.

Comparison 4 Continuous support versus usual care ‐ policy about routine EFM, Outcome 5 Admission to special care nursery.

Comparison 4 Continuous support versus usual care ‐ policy about routine EFM, Outcome 6 Postpartum depression.

Comparison 4 Continuous support versus usual care ‐ policy about routine EFM, Outcome 7 Negative rating of/negative views about birth experience.
Comparison 4 Continuous support versus usual care ‐ policy about routine EFM, Outcome 8 Breastfeeding at 1‐2 months postpartum.
Comparison 5 Continuous support versus usual care ‐ variations in provider characteristics, Outcome 1 Any analgesia/anaesthesia.
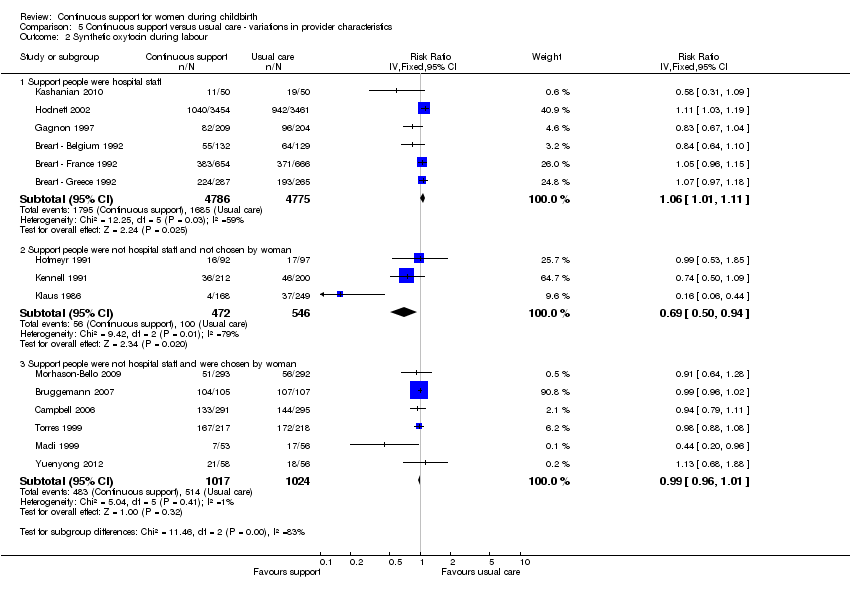
Comparison 5 Continuous support versus usual care ‐ variations in provider characteristics, Outcome 2 Synthetic oxytocin during labour.
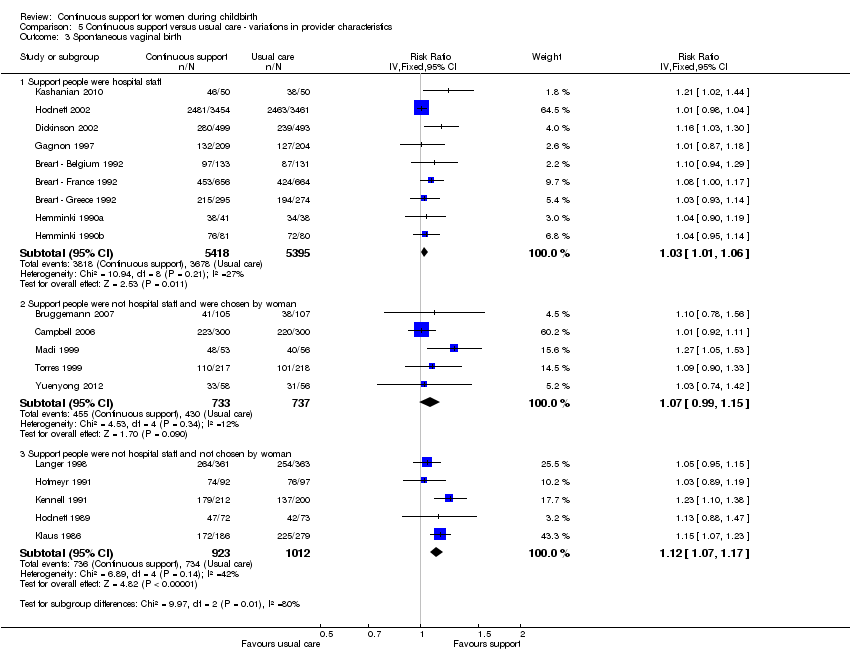
Comparison 5 Continuous support versus usual care ‐ variations in provider characteristics, Outcome 3 Spontaneous vaginal birth.

Comparison 5 Continuous support versus usual care ‐ variations in provider characteristics, Outcome 4 Caesarean birth.
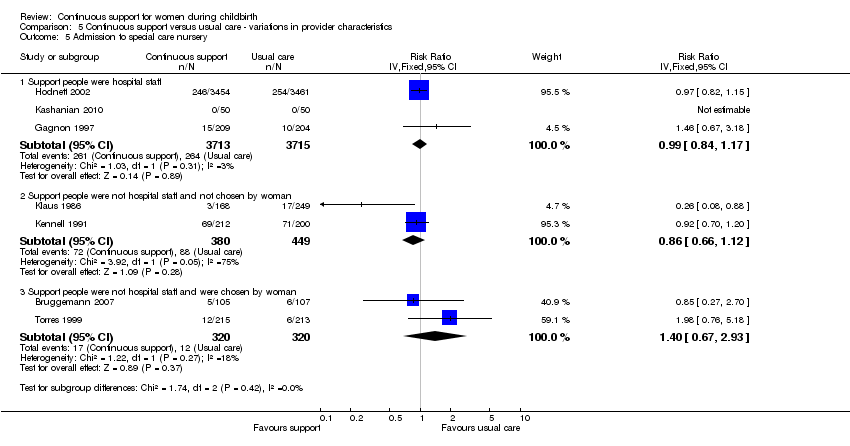
Comparison 5 Continuous support versus usual care ‐ variations in provider characteristics, Outcome 5 Admission to special care nursery.

Comparison 5 Continuous support versus usual care ‐ variations in provider characteristics, Outcome 6 Postpartum depression.

Comparison 5 Continuous support versus usual care ‐ variations in provider characteristics, Outcome 7 Negative rating of/negative feelings about birth experience.
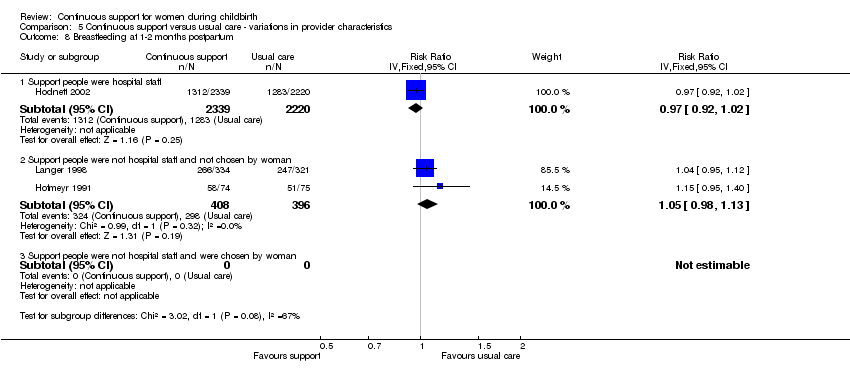
Comparison 5 Continuous support versus usual care ‐ variations in provider characteristics, Outcome 8 Breastfeeding at 1‐2 months postpartum.
| Outcome or subgroup title | No. of studies | No. of participants | Statistical method | Effect size |
| 1 Any analgesia/anaesthesia Show forest plot | 14 | 12283 | Risk Ratio (M‐H, Random, 95% CI) | 0.90 [0.84, 0.96] |
| 2 Regional analgesia/anaesthesia Show forest plot | 9 | 11444 | Risk Ratio (M‐H, Random, 95% CI) | 0.93 [0.88, 0.99] |
| 3 Synthetic oxytocin during labour Show forest plot | 15 | 12620 | Risk Ratio (M‐H, Random, 95% CI) | 0.97 [0.91, 1.04] |
| 4 Labour length Show forest plot | 12 | 5366 | Mean Difference (IV, Random, 95% CI) | ‐0.58 [‐0.85, ‐0.31] |
| 5 Spontaneous vaginal birth Show forest plot | 19 | 14119 | Risk Ratio (M‐H, Random, 95% CI) | 1.08 [1.04, 1.12] |
| 6 Instrumental vaginal birth Show forest plot | 19 | 14118 | Risk Ratio (M‐H, Fixed, 95% CI) | 0.90 [0.85, 0.96] |
| 7 Caesarean birth Show forest plot | 22 | 15175 | Risk Ratio (M‐H, Random, 95% CI) | 0.78 [0.67, 0.91] |
| 8 Perineal trauma Show forest plot | 4 | 8120 | Risk Ratio (M‐H, Random, 95% CI) | 0.97 [0.92, 1.01] |
| 9 Low 5‐minute Apgar score Show forest plot | 13 | 12515 | Risk Ratio (M‐H, Fixed, 95% CI) | 0.69 [0.50, 0.95] |
| 10 Admission to special care nursery Show forest plot | 7 | 8897 | Risk Ratio (M‐H, Random, 95% CI) | 0.97 [0.76, 1.25] |
| 11 Prolonged neonatal hospital stay Show forest plot | 3 | 1098 | Risk Ratio (M‐H, Random, 95% CI) | 0.83 [0.42, 1.65] |
| 12 Postpartum report of severe labour pain Show forest plot | 4 | 2456 | Risk Ratio (M‐H, Random, 95% CI) | 1.00 [0.83, 1.21] |
| 13 Negative rating of/negative feelings about birth experience Show forest plot | 11 | 11133 | Risk Ratio (M‐H, Random, 95% CI) | 0.69 [0.59, 0.79] |
| 14 Difficulty mothering Show forest plot | 3 | Risk Ratio (M‐H, Fixed, 95% CI) | Totals not selected | |
| 15 Breastfeeding at 1‐2 months postpartum Show forest plot | 3 | 5363 | Risk Ratio (M‐H, Random, 95% CI) | 1.01 [0.94, 1.09] |
| 16 Postpartum depression Show forest plot | 2 | Risk Ratio (M‐H, Fixed, 95% CI) | Totals not selected | |
| 17 Low postpartum self‐esteem Show forest plot | 1 | 652 | Risk Ratio (M‐H, Fixed, 95% CI) | 1.00 [0.77, 1.30] |
| Outcome or subgroup title | No. of studies | No. of participants | Statistical method | Effect size |
| 1 Any analgesia/anaesthesia Show forest plot | 14 | Risk Ratio (IV, Fixed, 95% CI) | Subtotals only | |
| 1.1 Other support permitted | 7 | 9752 | Risk Ratio (IV, Fixed, 95% CI) | 0.97 [0.96, 0.99] |
| 1.2 Other support not permitted | 7 | 2598 | Risk Ratio (IV, Fixed, 95% CI) | 0.91 [0.85, 0.96] |
| 2 Synthetic oxytocin during labour Show forest plot | 15 | Risk Ratio (IV, Fixed, 95% CI) | Subtotals only | |
| 2.1 Other support permitted | 5 | 9495 | Risk Ratio (IV, Fixed, 95% CI) | 1.04 [0.99, 1.10] |
| 2.2 Other support not permitted | 10 | 3125 | Risk Ratio (IV, Fixed, 95% CI) | 0.99 [0.97, 1.02] |
| 3 Spontaneous vaginal birth Show forest plot | 19 | Risk Ratio (IV, Fixed, 95% CI) | Subtotals only | |
| 3.1 Other support permitted | 9 | 10889 | Risk Ratio (IV, Fixed, 95% CI) | 1.03 [1.00, 1.05] |
| 3.2 Other support not permitted | 10 | 3329 | Risk Ratio (IV, Fixed, 95% CI) | 1.11 [1.07, 1.16] |
| 4 Caesarean birth Show forest plot | 22 | Risk Ratio (IV, Fixed, 95% CI) | Subtotals only | |
| 4.1 Other support permitted | 11 | 11326 | Risk Ratio (IV, Fixed, 95% CI) | 0.94 [0.85, 1.03] |
| 4.2 Other support not permitted | 11 | 3849 | Risk Ratio (IV, Fixed, 95% CI) | 0.75 [0.65, 0.86] |
| 5 Admission to special care nursery Show forest plot | 7 | Risk Ratio (IV, Fixed, 95% CI) | Subtotals only | |
| 5.1 Other support permitted | 2 | 7328 | Risk Ratio (IV, Fixed, 95% CI) | 0.99 [0.84, 1.17] |
| 5.2 Other support not permitted | 5 | 1569 | Risk Ratio (IV, Fixed, 95% CI) | 0.91 [0.71, 1.17] |
| 6 Postpartum depression Show forest plot | 2 | Risk Ratio (IV, Fixed, 95% CI) | Subtotals only | |
| 6.1 Other support permitted | 1 | 5567 | Risk Ratio (IV, Fixed, 95% CI) | 0.86 [0.73, 1.02] |
| 6.2 Other support not permitted | 1 | 149 | Risk Ratio (IV, Fixed, 95% CI) | 0.18 [0.09, 0.36] |
| 7 Negative rating of/negative feelings about birth experience Show forest plot | 11 | Risk Ratio (IV, Fixed, 95% CI) | Subtotals only | |
| 7.1 Other support permitted | 5 | 8639 | Risk Ratio (IV, Fixed, 95% CI) | 0.70 [0.62, 0.78] |
| 7.2 Other support not permitted | 6 | 2539 | Risk Ratio (IV, Fixed, 95% CI) | 0.62 [0.56, 0.69] |
| 8 Breastfeeding at 1‐2 months postpartum Show forest plot | 3 | Risk Ratio (IV, Fixed, 95% CI) | Subtotals only | |
| 8.1 Other support permitted | 1 | 4559 | Risk Ratio (IV, Fixed, 95% CI) | 0.97 [0.92, 1.02] |
| 8.2 Other support not permitted | 2 | 804 | Risk Ratio (IV, Fixed, 95% CI) | 1.05 [0.98, 1.13] |
| Outcome or subgroup title | No. of studies | No. of participants | Statistical method | Effect size |
| 1 Any analgesia/anaesthesia Show forest plot | 14 | Risk Ratio (IV, Fixed, 95% CI) | Subtotals only | |
| 1.1 Epidural analgesia routinely available | 9 | 10888 | Risk Ratio (IV, Fixed, 95% CI) | 0.97 [0.96, 0.98] |
| 1.2 Epidural analgesia not routinely available | 5 | 1462 | Risk Ratio (IV, Fixed, 95% CI) | 0.83 [0.69, 0.99] |
| 2 Synthetic oxytocin during labour Show forest plot | 15 | Risk Ratio (IV, Fixed, 95% CI) | Subtotals only | |
| 2.1 Epidural analgesia routinely available | 8 | 10568 | Risk Ratio (IV, Fixed, 95% CI) | 1.00 [0.98, 1.02] |
| 2.2 Epidural analgesia not routinely available | 7 | 2066 | Risk Ratio (IV, Fixed, 95% CI) | 1.02 [0.93, 1.11] |
| 3 Spontaneous vaginal birth Show forest plot | 19 | Risk Ratio (IV, Fixed, 95% CI) | Subtotals only | |
| 3.1 Epidural analgesia routinely available | 13 | 12672 | Risk Ratio (IV, Fixed, 95% CI) | 1.04 [1.01, 1.06] |
| 3.2 Epidural analgesia not routinely available | 6 | 1546 | Risk Ratio (IV, Fixed, 95% CI) | 1.11 [1.06, 1.17] |
| 4 Caesarean birth Show forest plot | 22 | Risk Ratio (IV, Fixed, 95% CI) | Subtotals only | |
| 4.1 Epidural analgesia routinely available | 14 | 13064 | Risk Ratio (IV, Fixed, 95% CI) | 0.93 [0.86, 1.02] |
| 4.2 Epidural analgesia not routinely available | 7 | 2077 | Risk Ratio (IV, Fixed, 95% CI) | 0.54 [0.43, 0.68] |
| 4.3 Unknown availability of epidural analgesia | 1 | 34 | Risk Ratio (IV, Fixed, 95% CI) | 1.4 [0.14, 13.98] |
| 5 Admission to special care nursery Show forest plot | 7 | Risk Ratio (IV, Fixed, 95% CI) | Subtotals only | |
| 5.1 Epidural analgesia routinely available | 5 | 8380 | Risk Ratio (IV, Fixed, 95% CI) | 0.98 [0.85, 1.13] |
| 5.2 Epidural analgesia not routinely available | 2 | 517 | Risk Ratio (IV, Fixed, 95% CI) | 0.26 [0.08, 0.88] |
| 6 Postpartum depression Show forest plot | 2 | Risk Ratio (IV, Fixed, 95% CI) | Subtotals only | |
| 6.1 Epidural analgesia routinely available | 1 | 6915 | Risk Ratio (IV, Fixed, 95% CI) | 0.89 [0.75, 1.05] |
| 6.2 Epidural analgesia not routinely available | 1 | 149 | Risk Ratio (IV, Fixed, 95% CI) | 0.18 [0.09, 0.36] |
| 7 Negative rating of/negative feelings about birth experience Show forest plot | 11 | Risk Ratio (IV, Fixed, 95% CI) | Subtotals only | |
| 7.1 Epidural analgesia routinely available | 9 | 10404 | Risk Ratio (IV, Fixed, 95% CI) | 0.70 [0.64, 0.77] |
| 7.2 Epidural analgesia not routinely available | 2 | 774 | Risk Ratio (IV, Fixed, 95% CI) | 0.55 [0.48, 0.63] |
| 8 Breastfeeding at 1‐2 months postpartum Show forest plot | 3 | Risk Ratio (IV, Fixed, 95% CI) | Subtotals only | |
| 8.1 Epidural analgesia routinely available | 2 | 5214 | Risk Ratio (IV, Fixed, 95% CI) | 0.99 [0.95, 1.03] |
| 8.2 Epidural analgesia not routinely available | 1 | 149 | Risk Ratio (IV, Fixed, 95% CI) | 1.15 [0.95, 1.40] |
| Outcome or subgroup title | No. of studies | No. of participants | Statistical method | Effect size |
| 1 Any analgesia/anaesthesia Show forest plot | 14 | Risk Ratio (IV, Fixed, 95% CI) | Subtotals only | |
| 1.1 Setting had routine EFM | 6 | 8580 | Risk Ratio (IV, Fixed, 95% CI) | 0.97 [0.96, 0.99] |
| 1.2 Setting did not have routine EFM | 6 | 2186 | Risk Ratio (IV, Fixed, 95% CI) | 0.96 [0.90, 1.02] |
| 1.3 Policy about routine EFM not known | 2 | 1579 | Risk Ratio (IV, Fixed, 95% CI) | 0.89 [0.80, 0.99] |
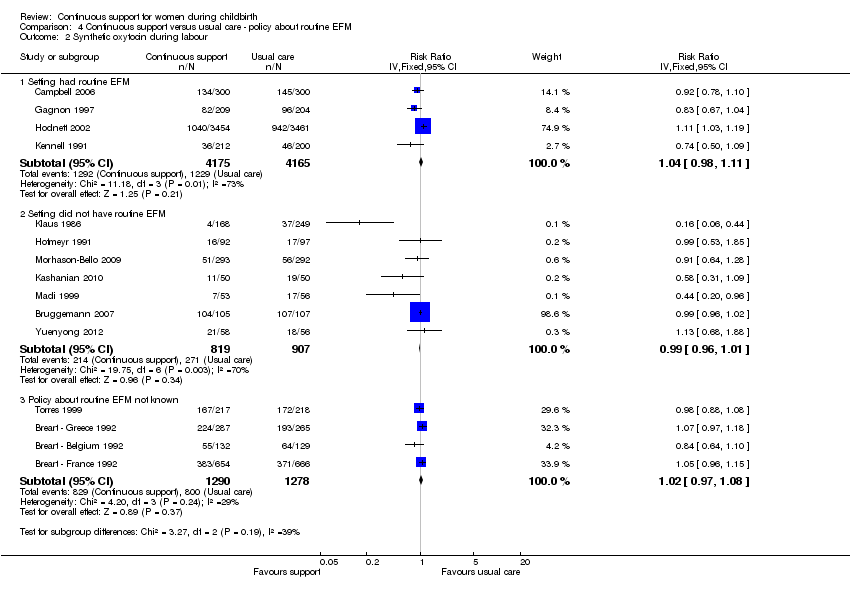
| 2 Synthetic oxytocin during labour Show forest plot | 15 | Risk Ratio (IV, Fixed, 95% CI) | Subtotals only | |
| 2.1 Setting had routine EFM | 4 | 8340 | Risk Ratio (IV, Fixed, 95% CI) | 1.04 [0.98, 1.11] |
| 2.2 Setting did not have routine EFM | 7 | 1726 | Risk Ratio (IV, Fixed, 95% CI) | 0.99 [0.96, 1.01] |
| 2.3 Policy about routine EFM not known | 4 | 2568 | Risk Ratio (IV, Fixed, 95% CI) | 1.02 [0.97, 1.08] |
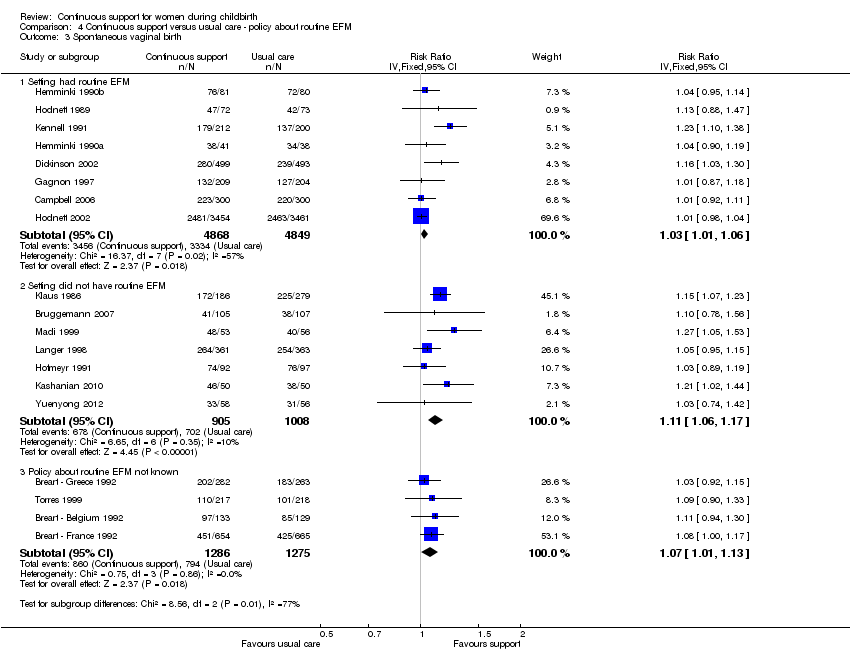
| 3 Spontaneous vaginal birth Show forest plot | 19 | Risk Ratio (IV, Fixed, 95% CI) | Subtotals only | |
| 3.1 Setting had routine EFM | 8 | 9717 | Risk Ratio (IV, Fixed, 95% CI) | 1.03 [1.01, 1.06] |
| 3.2 Setting did not have routine EFM | 7 | 1913 | Risk Ratio (IV, Fixed, 95% CI) | 1.11 [1.06, 1.17] |
| 3.3 Policy about routine EFM not known | 4 | 2561 | Risk Ratio (IV, Fixed, 95% CI) | 1.07 [1.01, 1.13] |
| 4 Caesarean birth Show forest plot | 22 | Risk Ratio (IV, Fixed, 95% CI) | Subtotals only | |
| 4.1 Setting had routine EFM | 9 | 10123 | Risk Ratio (IV, Fixed, 95% CI) | 0.92 [0.83, 1.01] |
| 4.2 Setting did not have routine EFM | 8 | 2457 | Risk Ratio (IV, Fixed, 95% CI) | 0.66 [0.55, 0.79] |
| 4.3 Policy about routine EFM not known | 5 | 2595 | Risk Ratio (IV, Fixed, 95% CI) | 1.06 [0.84, 1.33] |
| 5 Admission to special care nursery Show forest plot | 7 | Risk Ratio (IV, Fixed, 95% CI) | Subtotals only | |
| 5.1 Setting had routine EFM | 3 | 7740 | Risk Ratio (IV, Fixed, 95% CI) | 0.97 [0.84, 1.11] |
| 5.2 Setting did not have routine EFM | 3 | 729 | Risk Ratio (IV, Fixed, 95% CI) | 0.48 [0.21, 1.12] |
| 5.3 Policy about routine EFM not known | 1 | 428 | Risk Ratio (IV, Fixed, 95% CI) | 1.98 [0.76, 5.18] |
| 6 Postpartum depression Show forest plot | 2 | Risk Ratio (IV, Fixed, 95% CI) | Subtotals only | |
| 6.1 Setting had routine EFM | 1 | 6915 | Risk Ratio (IV, Fixed, 95% CI) | 0.89 [0.75, 1.05] |
| 6.2 Setting did not have routine EFM | 1 | 149 | Risk Ratio (IV, Fixed, 95% CI) | 0.18 [0.09, 0.36] |
| 7 Negative rating of/negative views about birth experience Show forest plot | 11 | Risk Ratio (IV, Fixed, 95% CI) | Subtotals only | |
| 7.1 Setting had routine EFM | 4 | 7467 | Risk Ratio (IV, Fixed, 95% CI) | 0.67 [0.60, 0.76] |
| 7.2 Setting did not have routine EFM | 4 | 1710 | Risk Ratio (IV, Fixed, 95% CI) | 0.60 [0.53, 0.68] |
| 7.3 Policy about routine EFM not known | 3 | 1977 | Risk Ratio (IV, Fixed, 95% CI) | 0.84 [0.65, 1.08] |
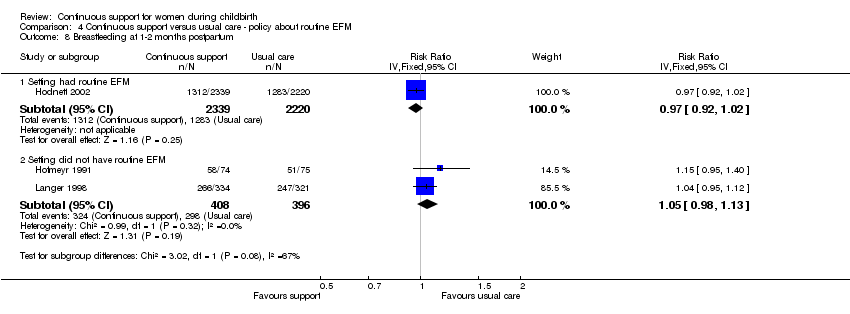
| 8 Breastfeeding at 1‐2 months postpartum Show forest plot | 3 | Risk Ratio (IV, Fixed, 95% CI) | Subtotals only | |
| 8.1 Setting had routine EFM | 1 | 4559 | Risk Ratio (IV, Fixed, 95% CI) | 0.97 [0.92, 1.02] |
| 8.2 Setting did not have routine EFM | 2 | 804 | Risk Ratio (IV, Fixed, 95% CI) | 1.05 [0.98, 1.13] |
| Outcome or subgroup title | No. of studies | No. of participants | Statistical method | Effect size |
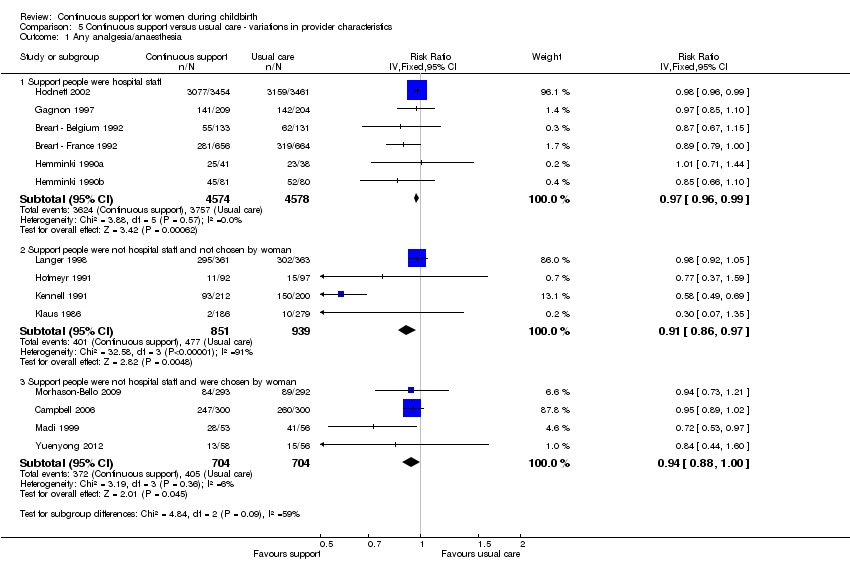
| 1 Any analgesia/anaesthesia Show forest plot | 14 | Risk Ratio (IV, Fixed, 95% CI) | Subtotals only | |
| 1.1 Support people were hospital staff | 6 | 9152 | Risk Ratio (IV, Fixed, 95% CI) | 0.97 [0.96, 0.99] |
| 1.2 Support people were not hospital staff and not chosen by woman | 4 | 1790 | Risk Ratio (IV, Fixed, 95% CI) | 0.91 [0.86, 0.97] |
| 1.3 Support people were not hospital staff and were chosen by woman | 4 | 1408 | Risk Ratio (IV, Fixed, 95% CI) | 0.94 [0.88, 1.00] |
| 2 Synthetic oxytocin during labour Show forest plot | 15 | Risk Ratio (IV, Fixed, 95% CI) | Subtotals only | |
| 2.1 Support people were hospital staff | 6 | 9561 | Risk Ratio (IV, Fixed, 95% CI) | 1.06 [1.01, 1.11] |
| 2.2 Support people were not hospital staff and not chosen by woman | 3 | 1018 | Risk Ratio (IV, Fixed, 95% CI) | 0.69 [0.50, 0.94] |
| 2.3 Support people were not hospital staff and were chosen by woman | 6 | 2041 | Risk Ratio (IV, Fixed, 95% CI) | 0.99 [0.96, 1.01] |
| 3 Spontaneous vaginal birth Show forest plot | 19 | Risk Ratio (IV, Fixed, 95% CI) | Subtotals only | |
| 3.1 Support people were hospital staff | 9 | 10813 | Risk Ratio (IV, Fixed, 95% CI) | 1.03 [1.01, 1.06] |
| 3.2 Support people were not hospital staff and were chosen by woman | 5 | 1470 | Risk Ratio (IV, Fixed, 95% CI) | 1.07 [0.99, 1.15] |
| 3.3 Support people were not hospital staff and not chosen by woman | 5 | 1935 | Risk Ratio (IV, Fixed, 95% CI) | 1.12 [1.07, 1.17] |
| 4 Caesarean birth Show forest plot | 22 | Risk Ratio (IV, Fixed, 95% CI) | Subtotals only | |
| 4.1 Support people were hospital staff | 9 | 10786 | Risk Ratio (IV, Fixed, 95% CI) | 0.95 [0.85, 1.05] |
| 4.2 Support people were not hospital staff and not chosen by woman | 7 | 2330 | Risk Ratio (IV, Fixed, 95% CI) | 0.72 [0.60, 0.86] |
| 4.3 Support people were not hospital staff and were chosen by woman | 6 | 2059 | Risk Ratio (IV, Fixed, 95% CI) | 0.83 [0.69, 1.01] |
| 5 Admission to special care nursery Show forest plot | 7 | Risk Ratio (IV, Fixed, 95% CI) | Subtotals only | |
| 5.1 Support people were hospital staff | 3 | 7428 | Risk Ratio (IV, Fixed, 95% CI) | 0.99 [0.84, 1.17] |
| 5.2 Support people were not hospital staff and not chosen by woman | 2 | 829 | Risk Ratio (IV, Fixed, 95% CI) | 0.86 [0.66, 1.12] |
| 5.3 Support people were not hospital staff and were chosen by woman | 2 | 640 | Risk Ratio (IV, Fixed, 95% CI) | 1.40 [0.67, 2.93] |
| 6 Postpartum depression Show forest plot | 2 | Risk Ratio (IV, Fixed, 95% CI) | Subtotals only | |
| 6.1 Support people were hospital staff | 1 | 5567 | Risk Ratio (IV, Fixed, 95% CI) | 0.86 [0.73, 1.02] |
| 6.2 Support people were not hospital staff and not chosen by woman | 1 | 149 | Risk Ratio (IV, Fixed, 95% CI) | 0.17 [0.09, 0.33] |
| 6.3 Support people were not hospital staff and were chosen by woman | 0 | 0 | Risk Ratio (IV, Fixed, 95% CI) | 0.0 [0.0, 0.0] |
| 7 Negative rating of/negative feelings about birth experience Show forest plot | 11 | Risk Ratio (IV, Fixed, 95% CI) | Subtotals only | |
| 7.1 Support people were hospital staff | 4 | 8145 | Risk Ratio (IV, Fixed, 95% CI) | 0.87 [0.73, 1.03] |
| 7.2 Support people were not hospital staff and not chosen by woman | 3 | 1325 | Risk Ratio (IV, Fixed, 95% CI) | 0.66 [0.57, 0.77] |
| 7.3 Support people were not hospital staff and were chosen by woman | 4 | 1708 | Risk Ratio (IV, Fixed, 95% CI) | 0.57 [0.51, 0.64] |
| 8 Breastfeeding at 1‐2 months postpartum Show forest plot | 3 | Risk Ratio (IV, Fixed, 95% CI) | Subtotals only | |
| 8.1 Support people were hospital staff | 1 | 4559 | Risk Ratio (IV, Fixed, 95% CI) | 0.97 [0.92, 1.02] |
| 8.2 Support people were not hospital staff and not chosen by woman | 2 | 804 | Risk Ratio (IV, Fixed, 95% CI) | 1.05 [0.98, 1.13] |
| 8.3 Support people were not hospital staff and were chosen by woman | 0 | 0 | Risk Ratio (IV, Fixed, 95% CI) | 0.0 [0.0, 0.0] |