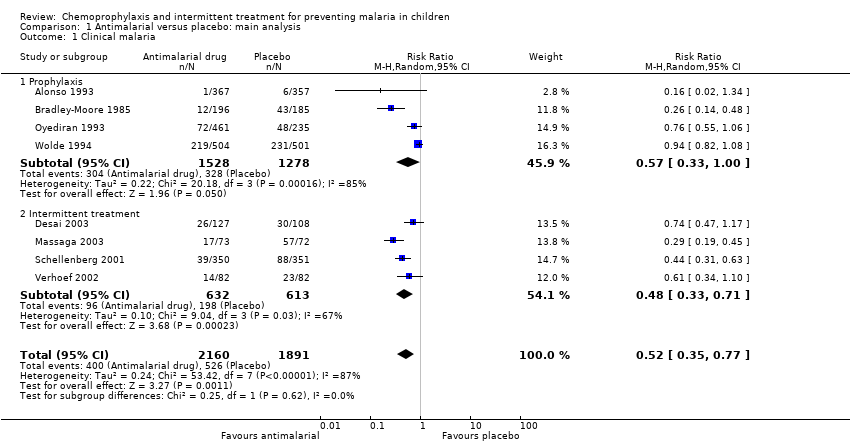
Scolaris Content Display Scolaris Content Display

Comparison 1 Antimalarial versus placebo: main analysis, Outcome 1 Clinical malaria.
Figuras y tablas -
Analysis 1.1

Comparison 1 Antimalarial versus placebo: main analysis, Outcome 1 Clinical malaria.

Comparison 1 Antimalarial versus placebo: main analysis, Outcome 2 Severe anaemia.
Figuras y tablas -
Analysis 1.2

Comparison 1 Antimalarial versus placebo: main analysis, Outcome 2 Severe anaemia.

Comparison 1 Antimalarial versus placebo: main analysis, Outcome 3 Death from any cause.
Figuras y tablas -
Analysis 1.3

Comparison 1 Antimalarial versus placebo: main analysis, Outcome 3 Death from any cause.

Comparison 1 Antimalarial versus placebo: main analysis, Outcome 4 Hospital admission for any cause.
Figuras y tablas -
Analysis 1.4

Comparison 1 Antimalarial versus placebo: main analysis, Outcome 4 Hospital admission for any cause.

Comparison 1 Antimalarial versus placebo: main analysis, Outcome 5 Parasitaemia.
Figuras y tablas -
Analysis 1.5

Comparison 1 Antimalarial versus placebo: main analysis, Outcome 5 Parasitaemia.

Comparison 1 Antimalarial versus placebo: main analysis, Outcome 6 Enlarged spleen.
Figuras y tablas -
Analysis 1.6

Comparison 1 Antimalarial versus placebo: main analysis, Outcome 6 Enlarged spleen.

Comparison 1 Antimalarial versus placebo: main analysis, Outcome 7 Mean haematocrit.
Figuras y tablas -
Analysis 1.7

Comparison 1 Antimalarial versus placebo: main analysis, Outcome 7 Mean haematocrit.

Comparison 1 Antimalarial versus placebo: main analysis, Outcome 8 Adverse events.
Figuras y tablas -
Analysis 1.8

Comparison 1 Antimalarial versus placebo: main analysis, Outcome 8 Adverse events.

Comparison 2 Antimalarial versus placebo: by drug group, Outcome 1 Clinical malaria.
Figuras y tablas -
Analysis 2.1

Comparison 2 Antimalarial versus placebo: by drug group, Outcome 1 Clinical malaria.

Comparison 2 Antimalarial versus placebo: by drug group, Outcome 2 Severe anaemia.
Figuras y tablas -
Analysis 2.2

Comparison 2 Antimalarial versus placebo: by drug group, Outcome 2 Severe anaemia.

Comparison 3 Antimalarial versus placebo: by seasonality, Outcome 1 Clinical malaria.
Figuras y tablas -
Analysis 3.1

Comparison 3 Antimalarial versus placebo: by seasonality, Outcome 1 Clinical malaria.

Comparison 3 Antimalarial versus placebo: by seasonality, Outcome 2 Severe anaemia.
Figuras y tablas -
Analysis 3.2

Comparison 3 Antimalarial versus placebo: by seasonality, Outcome 2 Severe anaemia.

Comparison 4 Intermittent treatment versus placebo: by presence of anaemia, Outcome 1 Clinical malaria.
Figuras y tablas -
Analysis 4.1

Comparison 4 Intermittent treatment versus placebo: by presence of anaemia, Outcome 1 Clinical malaria.

Comparison 4 Intermittent treatment versus placebo: by presence of anaemia, Outcome 2 Severe anaemia.
Figuras y tablas -
Analysis 4.2

Comparison 4 Intermittent treatment versus placebo: by presence of anaemia, Outcome 2 Severe anaemia.

Comparison 5 Antimalarial versus placebo: adequately concealed trials, Outcome 1 Clinical malaria.
Figuras y tablas -
Analysis 5.1

Comparison 5 Antimalarial versus placebo: adequately concealed trials, Outcome 1 Clinical malaria.

Comparison 5 Antimalarial versus placebo: adequately concealed trials, Outcome 2 Severe anaemia.
Figuras y tablas -
Analysis 5.2

Comparison 5 Antimalarial versus placebo: adequately concealed trials, Outcome 2 Severe anaemia.

Comparison 5 Antimalarial versus placebo: adequately concealed trials, Outcome 3 Death from any cause.
Figuras y tablas -
Analysis 5.3

Comparison 5 Antimalarial versus placebo: adequately concealed trials, Outcome 3 Death from any cause.

Comparison 6 Antimalarial versus placebo: excluding cluster‐randomized controlled trials, Outcome 1 Severe anaemia.
Figuras y tablas -
Analysis 6.1

Comparison 6 Antimalarial versus placebo: excluding cluster‐randomized controlled trials, Outcome 1 Severe anaemia.

Comparison 6 Antimalarial versus placebo: excluding cluster‐randomized controlled trials, Outcome 2 Death from any cause.
Figuras y tablas -
Analysis 6.2

Comparison 6 Antimalarial versus placebo: excluding cluster‐randomized controlled trials, Outcome 2 Death from any cause.

Comparison 6 Antimalarial versus placebo: excluding cluster‐randomized controlled trials, Outcome 3 Parasitaemia.
Figuras y tablas -
Analysis 6.3

Comparison 6 Antimalarial versus placebo: excluding cluster‐randomized controlled trials, Outcome 3 Parasitaemia.

Comparison 7 Antimalarial versus placebo: impact after stopping intervention, Outcome 1 Clinical malaria.
Figuras y tablas -
Analysis 7.1

Comparison 7 Antimalarial versus placebo: impact after stopping intervention, Outcome 1 Clinical malaria.

Comparison 7 Antimalarial versus placebo: impact after stopping intervention, Outcome 2 Severe anaemia.
Figuras y tablas -
Analysis 7.2

Comparison 7 Antimalarial versus placebo: impact after stopping intervention, Outcome 2 Severe anaemia.

Comparison 7 Antimalarial versus placebo: impact after stopping intervention, Outcome 3 Death from any cause (within 2 years of stopping intervention).
Figuras y tablas -
Analysis 7.3

Comparison 7 Antimalarial versus placebo: impact after stopping intervention, Outcome 3 Death from any cause (within 2 years of stopping intervention).

Comparison 7 Antimalarial versus placebo: impact after stopping intervention, Outcome 4 Parasitaemia.
Figuras y tablas -
Analysis 7.4

Comparison 7 Antimalarial versus placebo: impact after stopping intervention, Outcome 4 Parasitaemia.

Comparison 7 Antimalarial versus placebo: impact after stopping intervention, Outcome 5 Enlarged spleen.
Figuras y tablas -
Analysis 7.5

Comparison 7 Antimalarial versus placebo: impact after stopping intervention, Outcome 5 Enlarged spleen.

Comparison 7 Antimalarial versus placebo: impact after stopping intervention, Outcome 6 Mean haematocrit.
Figuras y tablas -
Analysis 7.6

Comparison 7 Antimalarial versus placebo: impact after stopping intervention, Outcome 6 Mean haematocrit.

Comparison 7 Antimalarial versus placebo: impact after stopping intervention, Outcome 7 Protective measles antibody titres.
Figuras y tablas -
Analysis 7.7

Comparison 7 Antimalarial versus placebo: impact after stopping intervention, Outcome 7 Protective measles antibody titres.

Table 1. Detailed search strategies

Search set

CIDG SR*

CENTRAL

MEDLINE**

EMBASE**

LILACS**

1

malaria

malaria

MALARIA

MALARIA

malaria

2

prophylaxis

prophylaxis

malaria

malaria

prophylaxis

3

intermittent treatment

intermittent treatment

1 or 2

1 or 2

prevention

4

presumptive treatment

prophylaxis

prophylaxis

2 or 3

5

2 or 3 or 4

chemoprophylaxis

chemoprophylaxis

1 and 4

6

1 and 5

prevention

prevention

7

intermittent treatment

intermittent treatment

8

presumptive treatment

presumptive treatment

9

4 or 5 or 6 or 7 or 8

4 or 5 or 6 or 7 or 8

10

3 and 9

3 and 9

*Cochrane Infectious Diseases Group Specialized Register

**Search terms used in combination with the search strategy for retrieving trials developed by The Cochrane Collaboration (Higgins 2005); Upper case: MeSH or EMTREE heading; Lower case: free text term

Figuras y tablas -
Table 1. Detailed search strategies
Table 2. Types of intervention

Trial

No. arms

Intervention

Iron or folic acid

ITNs*

Alonso 1993

1

Pyrimethamine‐dapsone

No

Yes

2

Placebo

No

Yes

Bradley‐Moore 1985

1

Chloroquine

No

No

2

Pyrimethamine

No

No

3

Placebo

No

No

David 1997

1

Pyrimethamine‐dapsone

No

No

2

Placebo

No

No

Desai 2003

1

Sulfadoxine‐pyrimethamine

No

Yes**

2

‐‐

Iron

Yes**

3

Sulfadoxine‐pyrimethamine

Iron

Yes**

4

Placebo

No

Yes**

Greenwood 1988

1

Pyrimethamine‐dapsone

No

No

2

Placebo

No

No

Greenwood 1989

1

Pyrimethamine‐dapsone

Folic acid

No

2

Pyrimethamine‐dapsone

No

No

3

Chlorproguanil

Folic acid

No

4

Chlorproguanil

No

No

5

Placebo

Folic acid

No

6

Placebo

No

No

Greenwood 1995

1

Pyrimethamine‐dapsone

No

No

2

Placebo

No

No

Hogh 1993

1

Chloroquine

No

No

2

Placebo

No

No

Lemnge 1997

1

Pyrimethamine‐dapsone

No

No

2

Placebo

No

No

Massaga 2003

1

Amodiaquine

Iron

No

2

Amodiaquine

No

No

3

Placebo

Iron

No

4

Placebo

No

No

Menendez 1997

1

Pyrimethamine‐dapsone

No

No

2

Pyrimethamine‐dapsone

Iron

No

3

Placebo

Iron

No

4

Placebo

No

No

Menon 1990

1

Pyrimethamine‐dapsone

No

No

2

Placebo

No

No

Otoo 1988

1

Pyrimethamine‐dapsone

No

No

2

Placebo

No

No

Oyediran 1993

1

Chloroquine

No

No

2

Pyrimethamine

No

No

3

Placebo

No

No

Schellenberg 2001

1

Sulfadoxine‐pyrimethamine

No

No

2

Placebo

No

No

Schellenberg 2005

1

Sulfadoxine‐pyrimethamine

No

No

2

Placebo

No

No

Tomashek 2001

1

Sulfadoxine‐pyrimethamine plus vitamins A and C

Iron, folic acid

No

2

Sulfadoxine‐pyrimethamine

Iron, folic acid

No

3

Placebo

Iron, folic acid

No

Verhoef 2002

1

Sulfadoxine‐pyrimethamine

No

No

2

‐‐

Iron

No

3

Sulfadoxine‐pyrimethamine

Iron

No

4

Placebo

No

No

Wolde 1994

1

Chloroquine

No

No

2

Placebo

No

No

Footnotes
*ITNs: insecticide‐treated nets
**ITNs not given to participants but reported that they benefited from their "area‐wide deployment"

Figuras y tablas -
Table 2. Types of intervention
Table 3. Methodological quality of included trials

Trial

Sequence*

Concealment*

Blinding

Primary outcome (n)

Number at follow up

Percentage loss

Alonso 1993

Unclear

Unclear

Double

Clinical malaria (1898 participants)

NA

NA

Bradley‐Moore 1985

Inadequate (alternate allocation)

Unclear

Unclear

Clinical malaria, severe anaemia (449 participants)

NA

NA

David 1997

Unclear

Unclear

Unclear

NA

NA

Desai 2003

Adequate (block randomization)

Adequate (identical and centrally coded drugs and placebo)

Double

Clinical malaria (428 participants)

468

14% (inadequate)

Greenwood 1988

Unclear

Unclear

Double

Clinical malaria, severe anaemia (2718 participants)

NA

NA

Greenwood 1989

Unclear

Unclear

Double

Clinical malaria (560 participants)

NA

NA

Greenwood 1995**

Unclear

Unclear

Double

NA

19% to 22% (inadequate)

Hogh 1993

Unclear

Unclear

Unclear

NA

NA

Lemnge 1997

Unclear

Adequate (identical and centrally coded drugs and placebo)

Double

234

6% (adequate)

Massaga 2003

Adequate (computer‐generated random numbers)

Adequate (identical and centrally coded drugs and placebo)

Double

Clinical malaria (291 participants)

231

21% (inadequate)

Menendez 1997

Adequate (block randomization)

Adequate (identical and centrally coded drugs and placebo)

Double

Severe anaemia (832 participants)

NA

7% (adequate)

Menon 1990

Unclear

Unclear

Double

NA

NA

Otoo 1988a**

Unclear

Unclear

Double

Clinical malaria (95 participants)

NA

16% (inadequate)

Oyediran 1993

Inadequate (alternate allocation)

Unclear

Unclear

Clinical malaria, severe anaemia (696 participants)

NA

NA

Schellenberg 2001

Adequate (computer‐generated)

Adequate (sealed, opaque envelopes and identical, centrally coded drugs and placebo)

Double

Clinical malaria, severe anaemia (701 participants)

677

3% (adequate)

Schellenberg 2005

Adequate (computer‐generated)

Adequate (sealed, opaque envelopes and identical, centrally coded drugs and placebo)

Double

Clinical malaria, severe anaemia, protective antibody titres against measles (555)

555

NA

Tomashek 2001

Adequate (computer‐generated)

Unclear

Double

Anaemia prevalence (238 participants)

215

9.7% (adequate)

Verhoef 2002

Adequate (block randomization)

Adequate (identical and centrally coded drugs and placebo)

Double

Clinical malaria (328 participants)

309

6% (adequate)

Wolde 1994

Unclear

Unclear

Unclear

Clinical malaria (1005 participants)

997

9% (adequate)

Footnotes
*Generation of allocation sequence; concealment of allocation
**Late impact trials
NA: not available
Footnotes
*Generation of allocation sequence; concealment of allocation
**Late impact trials
NA: not available

Figuras y tablas -
Table 3. Methodological quality of included trials
Table 4. Adverse event information not appropriate for meta‐analysis

Trial

Method to detect AE*

Results

Greenwood 1988

White cell count in randomly selected subset of 68 participants on Maloprim (pyrimethamine‐dapsone) and 78 on placebo

Almost identical mean white cell count for the Maloprim group (9.3 x 10^L) and placebo group (9.6 x 10^/L)

Lowest white cell count recorded was 2.8 x 10^/L (study group not indicated)

No severe adverse event reported

Almost identical mean white cell count for the Maloprim group (9.3 x 10^L) and placebo group (9.6 x 10^/L)

Lowest white cell count recorded was 2.8 x 10^/L (study group not indicated)

No severe adverse event reported

Greenwood 1989

Clinical assessment and white cell count

White cell counts on alternate participants in 1983 and attempted on all participants in 1984

White cell count and clinical assessment showed no features suggestive of agranulocytosis in treatment (Maloprim) and placebo groups

Results from Fuller 1988 (reporting on the Greenwood 1989 trial): "Mean WBC [white blood cell] count of children and the distribution of WBC counts were very similar in children who received Maloprim, chlorproguanil and placebo during each survey."

Lemnge 1997

White cell count; weight and height

Results available for 242 participants: 65 placebo, 58 iron, 60 amodiaquine, and 59 amodiaquine and iron

"No serious side effect was observed."

"Reduction in … neutrophil counts, in children with normal baseline values, were sometimes seen but these were temporary."

"No pronounced weight loss was observed in any child."

Massaga 2003

Total and differential white cell counts

"No clinical adverse effects such as sore throat or agranulocytosis were reported or observed during the study."

"No significant difference in mean leucocyte counts between the groups."

Footnotes
AE: adverse event

Figuras y tablas -
Table 4. Adverse event information not appropriate for meta‐analysis
Comparison 1. Antimalarial versus placebo: main analysis

Outcome or subgroup title

No. of studies

No. of participants

Statistical method

Effect size

1 Clinical malaria Show forest plot

8

4051

Risk Ratio (M‐H, Random, 95% CI)

0.52 [0.35, 0.77]

1.1 Prophylaxis

4

2806

Risk Ratio (M‐H, Random, 95% CI)

0.57 [0.33, 1.00]

1.2 Intermittent treatment

4

1245

Risk Ratio (M‐H, Random, 95% CI)

0.48 [0.33, 0.71]

2 Severe anaemia Show forest plot

8

2727

Risk Ratio (M‐H, Fixed, 95% CI)

0.54 [0.42, 0.68]

2.1 Prophylaxis

4

1509

Risk Ratio (M‐H, Fixed, 95% CI)

0.51 [0.37, 0.69]

2.2 Intermittent treatment

4

1218

Risk Ratio (M‐H, Fixed, 95% CI)

0.58 [0.40, 0.84]

3 Death from any cause Show forest plot

11

7929

Risk Ratio (M‐H, Fixed, 95% CI)

0.82 [0.65, 1.04]

3.1 Prophylaxis

7

6685

Risk Ratio (M‐H, Fixed, 95% CI)

0.80 [0.63, 1.03]

3.2 Intermittent treatment

4

1244

Risk Ratio (M‐H, Fixed, 95% CI)

0.98 [0.49, 1.99]

4 Hospital admission for any cause Show forest plot

3

1149

Risk Ratio (M‐H, Fixed, 95% CI)

0.60 [0.52, 0.68]

4.1 Prophylaxis

1

303

Risk Ratio (M‐H, Fixed, 95% CI)

0.49 [0.40, 0.60]

4.2 Intermittent treatment

2

846

Risk Ratio (M‐H, Fixed, 95% CI)

0.66 [0.56, 0.79]

5 Parasitaemia Show forest plot

6

1785

Risk Ratio (M‐H, Random, 95% CI)

0.37 [0.17, 0.79]

5.1 Prophylaxis

4

1426

Risk Ratio (M‐H, Random, 95% CI)

0.24 [0.13, 0.45]

5.2 Intermittent treatment

2

359

Risk Ratio (M‐H, Random, 95% CI)

0.85 [0.64, 1.13]

6 Enlarged spleen Show forest plot

4

1589

Risk Ratio (M‐H, Random, 95% CI)

0.28 [0.14, 0.56]

6.1 Prophylaxis

4

1589

Risk Ratio (M‐H, Random, 95% CI)

0.28 [0.14, 0.56]

7 Mean haematocrit Show forest plot

3

794

Mean Difference (IV, Fixed, 95% CI)

2.12 [1.47, 2.77]

7.1 Prophylaxis

3

794

Mean Difference (IV, Fixed, 95% CI)

2.12 [1.47, 2.77]

8 Adverse events Show forest plot

2

Risk Ratio (M‐H, Fixed, 95% CI)

Subtotals only

8.1 Vomiting (prophylaxis)

1

415

Risk Ratio (M‐H, Fixed, 95% CI)

2.99 [0.31, 28.47]

8.2 Hyperpigmented macules (prophylaxis)

1

886

Risk Ratio (M‐H, Fixed, 95% CI)

67.08 [4.12, 1092.11]

Figuras y tablas -
Comparison 1. Antimalarial versus placebo: main analysis
Comparison 2. Antimalarial versus placebo: by drug group

Outcome or subgroup title

No. of studies

No. of participants

Statistical method

Effect size

1 Clinical malaria Show forest plot

8

4051

Risk Ratio (M‐H, Random, 95% CI)

0.52 [0.35, 0.77]

1.1 Pyrimethamine‐dapsone

1

724

Risk Ratio (M‐H, Random, 95% CI)

0.16 [0.02, 1.34]

1.2 Chloroquine

3

2082

Risk Ratio (M‐H, Random, 95% CI)

0.62 [0.36, 1.08]

1.3 Sulfadoxine‐pyrimethamine (intermittent treatment)

3

1100

Risk Ratio (M‐H, Random, 95% CI)

0.56 [0.41, 0.78]

1.5 Amodiaquine (intermittent treatment)

1

145

Risk Ratio (M‐H, Random, 95% CI)

0.29 [0.19, 0.45]

2 Severe anaemia Show forest plot

8

2727

Risk Ratio (M‐H, Fixed, 95% CI)

0.54 [0.42, 0.68]

2.1 Pyrimethamine‐dapsone

2

656

Risk Ratio (M‐H, Fixed, 95% CI)

0.46 [0.33, 0.64]

2.2 Chloroquine

2

853

Risk Ratio (M‐H, Fixed, 95% CI)

1.15 [0.39, 3.40]

2.4 Sulfadoxine‐pyrimethamine (intermittent treatment)

3

1073

Risk Ratio (M‐H, Fixed, 95% CI)

0.73 [0.46, 1.15]

2.5 Amodiaquine (intermittent treatment)

1

145

Risk Ratio (M‐H, Fixed, 95% CI)

0.34 [0.17, 0.68]

Figuras y tablas -
Comparison 2. Antimalarial versus placebo: by drug group
Comparison 3. Antimalarial versus placebo: by seasonality

Outcome or subgroup title

No. of studies

No. of participants

Statistical method

Effect size

1 Clinical malaria Show forest plot

8

4053

Risk Ratio (M‐H, Random, 95% CI)

0.52 [0.35, 0.77]

1.1 Seasonal

3

1893

Risk Ratio (M‐H, Random, 95% CI)

0.73 [0.43, 1.24]

1.2 Perennial

5

2160

Risk Ratio (M‐H, Random, 95% CI)

0.47 [0.31, 0.71]

2 Severe anaemia Show forest plot

8

2727

Risk Ratio (M‐H, Fixed, 95% CI)

0.54 [0.42, 0.68]

2.1 Seasonal

1

241

Risk Ratio (M‐H, Fixed, 95% CI)

0.13 [0.01, 2.43]

2.2 Perennial

7

2486

Risk Ratio (M‐H, Fixed, 95% CI)

0.55 [0.43, 0.70]

Figuras y tablas -
Comparison 3. Antimalarial versus placebo: by seasonality
Comparison 4. Intermittent treatment versus placebo: by presence of anaemia

Outcome or subgroup title

No. of studies

No. of participants

Statistical method

Effect size

1 Clinical malaria Show forest plot

4

Risk Ratio (M‐H, Random, 95% CI)

Subtotals only

1.1 All participants

2

846

Risk Ratio (M‐H, Random, 95% CI)

0.37 [0.25, 0.55]

1.2 Only anaemic children

2

399

Risk Ratio (M‐H, Random, 95% CI)

0.69 [0.48, 0.98]

2 Severe anaemia Show forest plot

4

Risk Ratio (M‐H, Random, 95% CI)

Subtotals only

2.1 All participants

2

846

Risk Ratio (M‐H, Random, 95% CI)

0.42 [0.27, 0.67]

2.2 Only anaemic children

2

372

Risk Ratio (M‐H, Random, 95% CI)

1.31 [0.63, 2.72]

Figuras y tablas -
Comparison 4. Intermittent treatment versus placebo: by presence of anaemia
Comparison 5. Antimalarial versus placebo: adequately concealed trials

Outcome or subgroup title

No. of studies

No. of participants

Statistical method

Effect size

1 Clinical malaria Show forest plot

4

1245

Risk Ratio (M‐H, Random, 95% CI)

0.48 [0.33, 0.71]

1.1 Prophylaxis

0

0

Risk Ratio (M‐H, Random, 95% CI)

0.0 [0.0, 0.0]

1.2 Intermittent treatment

4

1245

Risk Ratio (M‐H, Random, 95% CI)

0.48 [0.33, 0.71]

2 Severe anaemia Show forest plot

4

1470

Risk Ratio (M‐H, Fixed, 95% CI)

0.50 [0.39, 0.64]

2.1 Prophylaxis

1

415

Risk Ratio (M‐H, Fixed, 95% CI)

0.48 [0.34, 0.67]

2.2 Intermittent treatment

3

1055

Risk Ratio (M‐H, Fixed, 95% CI)

0.52 [0.35, 0.77]

3 Death from any cause Show forest plot

4

1495

Risk Ratio (M‐H, Fixed, 95% CI)

0.64 [0.34, 1.22]

3.1 Prophylaxis

1

415

Risk Ratio (M‐H, Fixed, 95% CI)

0.20 [0.04, 0.90]

3.2 Intermittent treatment

3

1080

Risk Ratio (M‐H, Fixed, 95% CI)

0.98 [0.46, 2.09]

Figuras y tablas -
Comparison 5. Antimalarial versus placebo: adequately concealed trials
Comparison 6. Antimalarial versus placebo: excluding cluster‐randomized controlled trials

Outcome or subgroup title

No. of studies

No. of participants

Statistical method

Effect size

1 Severe anaemia Show forest plot

7

2486

Risk Ratio (M‐H, Fixed, 95% CI)

0.55 [0.43, 0.70]

1.1 Prophylaxis

3

1268

Risk Ratio (M‐H, Fixed, 95% CI)

0.53 [0.38, 0.72]

1.2 Intermittent treatment

4

1218

Risk Ratio (M‐H, Fixed, 95% CI)

0.58 [0.40, 0.84]

2 Death from any cause Show forest plot

7

4247

Risk Ratio (M‐H, Fixed, 95% CI)

1.02 [0.76, 1.39]

2.1 Prophylaxis

4

3166

Risk Ratio (M‐H, Fixed, 95% CI)

1.03 [0.74, 1.44]

2.2 Intermittent treatment

3

1081

Risk Ratio (M‐H, Fixed, 95% CI)

0.98 [0.46, 2.09]

3 Parasitaemia Show forest plot

4

1194

Risk Ratio (M‐H, Random, 95% CI)

0.46 [0.17, 1.26]

3.1 Prophylaxis

2

835

Risk Ratio (M‐H, Random, 95% CI)

0.26 [0.06, 1.21]

3.2 Intermittent treatment

2

359

Risk Ratio (M‐H, Random, 95% CI)

0.85 [0.64, 1.13]

Figuras y tablas -
Comparison 6. Antimalarial versus placebo: excluding cluster‐randomized controlled trials
Comparison 7. Antimalarial versus placebo: impact after stopping intervention

Outcome or subgroup title

No. of studies

No. of participants

Statistical method

Effect size

1 Clinical malaria Show forest plot

2

Risk Ratio (M‐H, Fixed, 95% CI)

Totals not selected

1.1 Prophylaxis

1

Risk Ratio (M‐H, Fixed, 95% CI)

0.0 [0.0, 0.0]

1.2 Intermittent treatment

1

Risk Ratio (M‐H, Fixed, 95% CI)

0.0 [0.0, 0.0]

2 Severe anaemia Show forest plot

1

Risk Ratio (M‐H, Fixed, 95% CI)

Totals not selected

3 Death from any cause (within 2 years of stopping intervention) Show forest plot

1

Risk Ratio (M‐H, Fixed, 95% CI)

Subtotals only

4 Parasitaemia Show forest plot

2

Risk Ratio (M‐H, Fixed, 95% CI)

Subtotals only

5 Enlarged spleen Show forest plot

2

305

Risk Ratio (M‐H, Fixed, 95% CI)

0.96 [0.60, 1.52]

6 Mean haematocrit Show forest plot

1

Mean Difference (IV, Fixed, 95% CI)

Subtotals only

7 Protective measles antibody titres Show forest plot

1

Risk Ratio (M‐H, Fixed, 95% CI)

Subtotals only

Figuras y tablas -
Comparison 7. Antimalarial versus placebo: impact after stopping intervention